The interstellar medium in young supernova remnants: key to the production of cosmic X-rays and -rays
Abstract
We review recent progress in elucidating the relationship between high-energy radiation and the interstellar medium (ISM) in young supernova remnants (SNRs) with ages of 2000 yr, focusing in particular on RX J1713.73946 and RCW 86. Both SNRs emit strong nonthermal X-rays and TeV -rays, and they contain clumpy distributions of interstellar gas that includes both atomic and molecular hydrogen. We find that shock–cloud interactions provide a viable explanation for the spatial correlation between the X-rays and ISM. In these interactions, the supernova shocks hit the typically pc-scale dense cores, generating a highly turbulent velocity field that amplifies the magnetic field up to 0.1–1 mG. This amplification leads to enhanced nonthermal synchrotron emission around the clumps, whereas the cosmic-ray electrons do not penetrate the clumps. Accordingly, the nonthermal X-rays exhibit a spatial distribution similar to that of the ISM on the pc scale, while they are anticorrelated at sub-pc scales. These results predict that hadronic -rays can be emitted from the dense cores, resulting in a spatial correspondence between the -rays and the ISM. The current pc-scale resolution of -ray observations is too low to resolve this correspondence. Future -ray observations with the Cherenkov Telescope Array will be able to resolve the sub-pc-scale -ray distribution and provide clues to the origin of these cosmic -rays.
Keywords cosmic rays — -rays: ISM — ISM: clouds — ISM: supernova remnants
1 Introduction
Cosmic-ray acceleration in supernova remnants (SNRs) is the most promising mechanism for accelerating Galactic cosmic rays, which mainly comprise relativistic protons with energies less than 1015.5 eV. Considerable efforts have been devoted to theoretical works to elucidate the details of particle acceleration (e.g., Bell, 1978; Blandford & Ostriker, 1978). Recent progress in X-ray and -ray observations has allowed us to explore the origin of cosmic rays. Young SNRs, which ages around 2000 yr, are of particular interest because they emit higher-energy X-rays and -rays than SNRs younger than 1000 yr (e.g., G1.90.3 at yr, Carlton et al., 2011) or those older than several tens of thousands of years (e.g., W44 at 20,000 yr, Wolszczan et al., 1991). In the present article, we focus on the young SNRs RX J1713.73946 (hereafter RXJ1713) and RCW 86, which are characterized by the emission of bright X-rays and TeV -rays.
The origin of -rays from young SNRs is currently under debate, and two mechanisms have been suggested to explain them. One is a leptonic process in which cosmic-ray electrons collide with low-energy photons, boosting them into the -ray regime via the inverse Compton process. The other is a hadronic process in which cosmic-ray protons collide with interstellar protons to produce neutral pions that decay into two -rays. It is important to verify whether the -rays are of hadronic origin for establishing whether SNRs are a major source of cosmic rays in the Galaxy.
In previous works that considered the hadronic model for the -ray emissivity of an SNR, the number density of targeted interstellar protons has been used (e.g., to estimate the cosmic-ray energy from the -ray luminosity). However, strongly shocked matter (e.g., shock-ionized plasma traced by optical lines and free–free radio/X-ray continuum and shocked molecular hydrogen observed as near-infrared lines), which occupies only a small portion of the interstellar medium (ISM), has mainly been considered as the target gas. Neutral molecular and atomic hydrogen gas has not been considered to play a major role in controlling the radiative properties of SNRs, except for some pioneering works (e.g., Aharonian et al., 1994), while the interaction of SNRs with the ISM has been a subject of interest in some other works (e.g., Dubner & Arnal, 1988; Dubner et al., 1998, 1999, 2002a, 2002b, 2004; Tatematsu et al., 1987, 1990a, 1990b; Seta et al., 1998, 2004; Arikawa et al., 1999). In this article, we focus on the bulk neutral gas that dominates the mass the ISM. Recent theoretical studies have revealed that the associated ISM may play a major role in determining the radiative properties of SNRs, and clarifying clarify the role of inhomogeneities in the ISM in regulating the high-energy radiations is important (e.g., Inoue et al., 2012; Celli et al., 2019). Here we review methods used to identify the ISM associated with a SNR, a theoretical model that incorporates shock–cloud interactions, and their theoretical implications for the origin of very-high-energy -rays, with a focus on the SNRs RXJ1713 and RCW 86.
2 The Interstellar Medium (ISM)
The neutral ISM consists of the warm neutral medium (WNM) and the cool neutral medium (CNM) (e.g., Draine, 2011). The WNM has a density of 0.1–10 cm-3 and a spin temperature of 300–10000 K, while the CNM has a density of 10–103 cm-3 and a spin temperature of 10–300 K (e.g., McKee & Hollenbach, 1980; Heiles & Troland, 2003). The masses of the two phases are comparable. The CNM comprises clumps with a volume filling factor of a few percent, while the WNM occupies a large volume of inter clump space (Draine, 2011; Fukui et al., 2018). The CO clouds are formed in the CNM clumps, and their volume filling factors are also very small (3–4%, e.g., Inoue & Inutsuka, 2012; Tachihara et al., 2018). This picture is significantly different from the conventional assumptions made for (one-dimensional) models, which do not appropriately represent these two-phase inhomogeneities.
The 21 cm Hi emission and 2.6 mm CO emission are good tracers of the ISM associated with a SNR. Comparing a high-resolution X-ray image with the CO and Hi distributions provides a powerful method for identifying the interaction between an SNR and the ISM. Because electrons cannot penetrate the dense ISM clumps, we find a small-scale anti correlation between the X-rays and dense ISM clumps at sub-pc scales. Calculations of the ISM column density can be performed using a CO-to-H2 conversion factor (for a review, see Bolatto et al., 2013) and the Hi 21 cm emission, where corrections for the Hi optical depth are required for the dense CNM.
Although the scheme described above works successfully in general, one caveat is that the intermediate density regime between 100 and 1000 cm-3 may not be detectable in the CO emission because of the low CO abundance caused by photo dissociation. In addition, the Hi emission may become optically thick in this density regime, requiring a correction for saturation. Hi is observed to have self-absorption dips; thus, some Hi gas is optically thick (e.g., Sato & Fukui, 1978).
The existence of dark gas, which cannot be probed by either CO or Hi emission, was suggested by EGRET -ray observations (Grenier et al., 2005) as well as from submillimeter observations by Planck (e.g., Planck Collaboration et al., 2011). Two possible explanations exist for the physical entity of the dark gas: CO-dark H2 gas and optically thick Hi gas. The concept of CO-dark H2 gas is based on numerical simulations of the evolution of the H2/Hi gas conducted by Wolfire et al. (2010), who showed that the self-shielding of H2 against UV is strong and a phase of H2 without an observable abundance of CO can exist outside a CO cloud. This gas, which comprises H2 without CO, is a reasonable model provided that Hi is converted mainly into H2. However, Fukui et al. (2014, 2015) used the Planck/IRAS dust emission as a proxy for the hydrogen column density and found that the Hi emission becomes optically thick under the usual Hi gas condition, in which the Hi column density is assumed to be proportional to the dust optical depth. The saturated Hi intensity becomes weaker than in the optically thin case, resulting in a smaller Hi column density than under the conventional optically thin approximation. The column density corrected for the optical depth becomes larger than the optically thin Hi column density by a factor of 1.5–2; this increased column density is large enough to explain the dark gas (Okamoto et al., 2017; Hayashi et al., 2019a, b; Mizuno et al., 2020). The optically thick Hi raises the possibility of Hi being dominant compared with H2, which requires theoretical justification. Simulations by Inoue & Inutsuka (2012) using a gas-evolution code similar to that employed by Wolfire et al. (2010) presented another evolutionary model of Hi flows showing Hi dominant outside the CO clouds. An important difference exists between the initial conditions in these two simulations. Inoue & Inutsuka (2012) adopted a lower Hi density, which includes both the CNM and WNM. This is a realistic Hi distribution compared with dense Hi comprising only the CNM, which was the initial condition assumed by Wolfire et al. (2010). The lower density leads to slower Hi–H2 conversion than the high-density initial condition and produces a rich Hi envelope surrounding the CO gas instead of CO-dark H2 gas. This lends theoretical support to optically thick Hi as an alternative. A possible new probe for this density regime is Ci emission at submillimeter wavelengths, which can serve as another useful tool (Tachihara et al., 2018).
3 RX J1713.73946
3.1 Distance determination: nonthermal X-rays and the interacting ISM
Except for several nearby SNRs with historical records, determining distances to SNRs in the Milky Way is not straightforward, because most of SNRs lie in the Galactic plane and are heavily obscured. Although the relation between radio surface brightness and angular diameters (–D relation) has been used to estimate the distances to SNRs, the –D relation does not provide an accurate measure of distance because of its large scatter (e.g., Pavlovic et al., 2014). Shock-excited masers—e.g., OH (1720 MHz) masers—are very useful for identifying the shocked interface, and the distance to SNRs can be obtained from the radial velocities of the masers, although this method can only be used for middle-aged SNRs that have interacted with the ISM for a long time (e.g., Chen & Jiang, 2013). The ISM, including CO clouds and Hi gas, associated with an SNR also provides a kinematic velocity, using which the distance can be calculated by comparison with a kinematic model of the Galaxy. The uncertainty is mainly due to the random cloud motions, which are on the order of 10 km s-1.
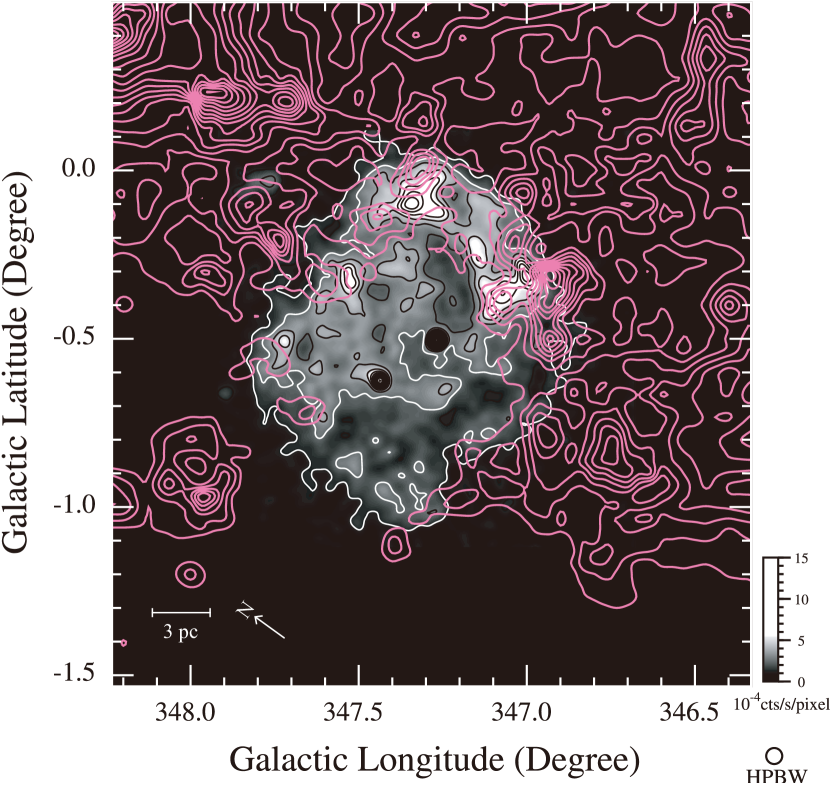
The nonthermal X-ray SNR RXJ1713 is a case for which two distances that differ by a factor of 6 had been debated. It was first suggested that this SNR is located at a distance of 1 kpc, assuming a typical average Hi density for the X-ray absorption (Koyama et al., 1997), and it was identified as the SNR of 393AD from Chinese historical records (Wang et al., 1997). Slane et al. (1999) claimed that CO clouds at and km s-1 are associated with the SNR, from 8.8 arcmin resolution maps obtained with the CfA 1.2-m telescope, and they derived a large kinematical distance (6 kpc). These authors argued that the Hi density toward RXJ1713 is lower than the typical Galactic average owing to an accidental coincidence with a hole in the ISM, while a three-times-larger distance implies an unusually large radius of 50 pc for an age of yrs. The 6 kpc distance has been questioned by a subsequent high-resolution CO survey, which found another CO component at km s-1 to be associated with this SNR at the 2.6 arcmin resolution CO maps obtained with the NANTEN 4-m telescope, as shown in Figure 1 (Fukui et al., 2003; Moriguchi et al., 2005). The observational signature of this association is the large-scale correlation (on scales of a few pc) between the CO map and the ROSAT X-ray survey, which was confirmed in more detail by the Suzaku data from Sano et al. (2010, 2013) (see Section 3.2). As the low velocity CO gas is fainter by an order of magnitude than the and km s-1 clouds, it was ignored by Slane et al. (1999). The smaller distance is now widely accepted, and it has been established that RXJ1713 is a young SNR aged 1600 yr, which was historically recorded (Aharonian et al., 2004; Cassam-Chenaï et al., 2004; Tanaka et al., 2008; Sano et al., 2015a; Tsuji & Uchiyama, 2016). This shows that high resolution and sensitivity are crucial in a comparison with the ISM, raising questions about the distance determinations in previous low-resolution studies.
3.2 Detailed correspondence between X-rays and ISM clumps
Fukui et al. (2012) showed that RXJ1713 is associated with molecular and atomic gas, each having masses of . The ISM distribution is shell-like, which an 8 pc radius, and the molecular cloud cores are inside the shell. The shell is consistent with a core-collapse SNR, for which the stellar winds from the high-mass progenitor evacuated the surrounding ISM prior to the SN explosion.
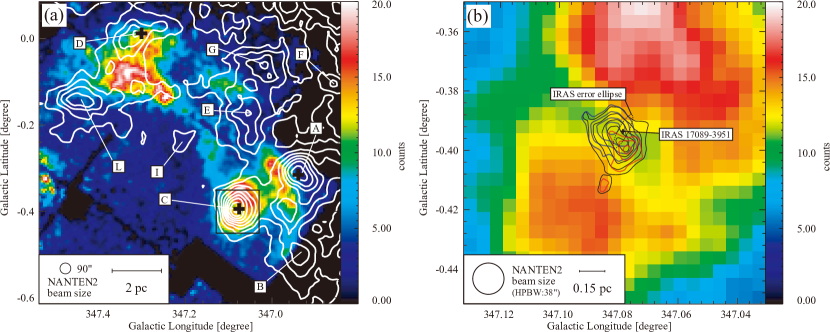
A comparison of the Suzaku X-ray data with the CO image revealed details of the interaction (Sano et al., 2010). Figure 2 shows that the CO peaks A–E, G, I, and L are anticorrelated with the X-ray peaks111Note that these anti-correlations are not due to interstellar absorption, because the 5–10 keV X-ray energy band is thought to be an absorption-free energy range when the ISM proton column density is less than 1023 cm-2., indicating that the dense cores hinder cosmic-ray electrons from penetrating them, and the X-rays are rim-brightened on the surfaces of the CO cores (see also Maxted et al., 2012). The cores in the shell were formed via gravitational instability over a timescale of Myr prior to the SN explosion, and three of them (CO peaks A, C, and D) are forming young stars, as shown by the infrared point sources (Sano et al., 2010). In fact, peak C shows obvious signs of active star formation, including bipolar outflows and an IRAS point source (see Figure 2a).
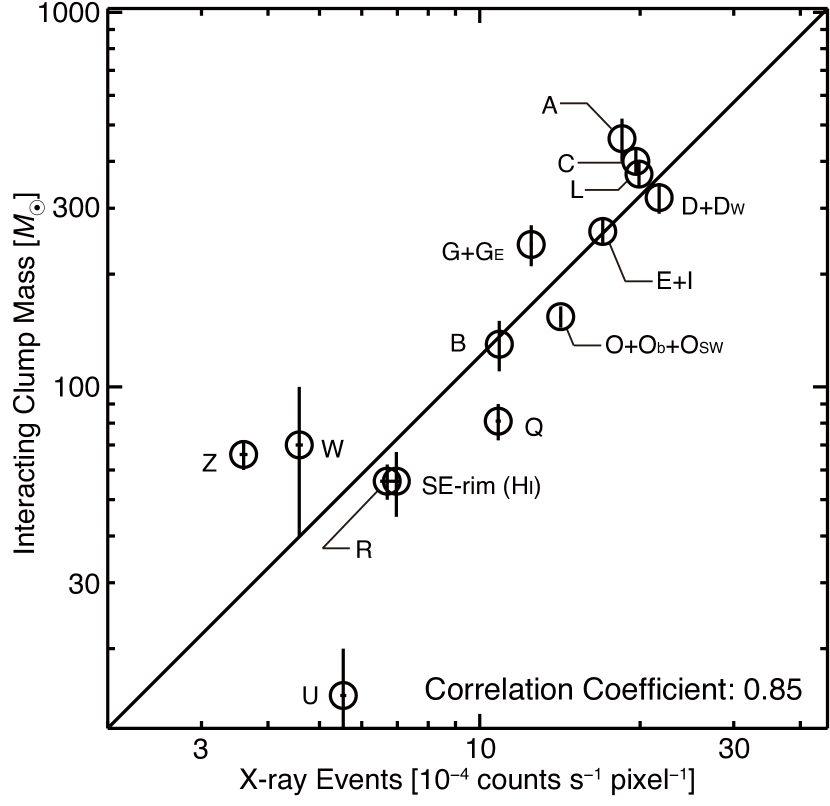
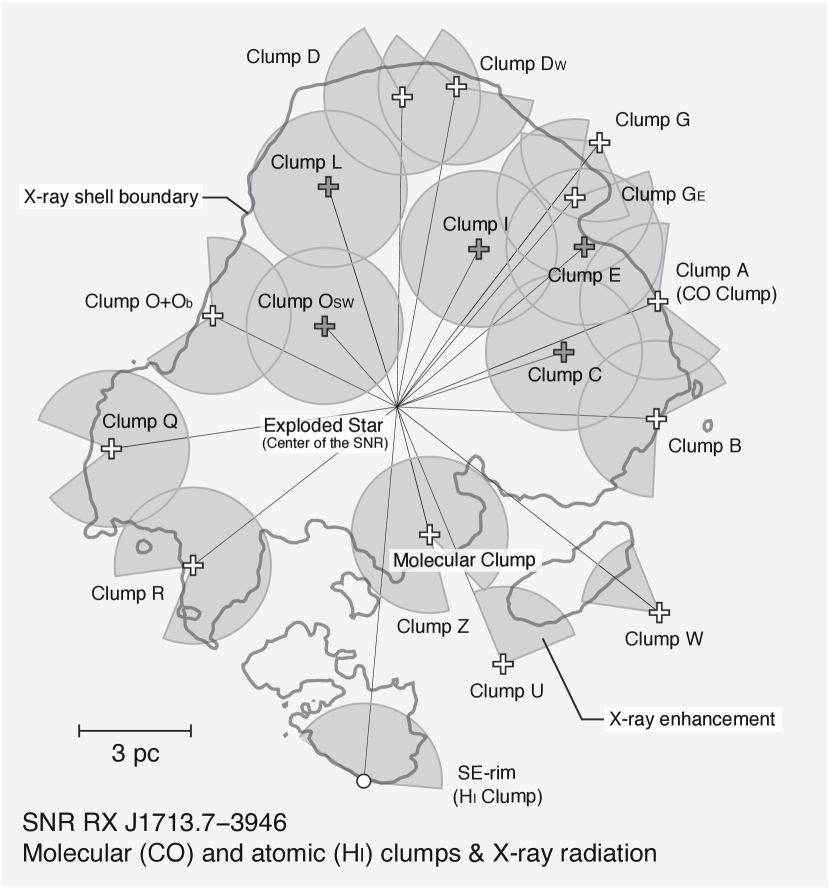
Sano et al. (2013) conducted a comprehensive study of the dense cores probed by CO as well as by cold Hi, and found that the X-ray intensities are well correlated with the masses of the ISM cores, as shown in Figure 3. Sano et al. (2013) showed that more than 80% of the X-ray peaks, brighter than counts s-1 pixel-1, are associated with the ISM cores, suggesting a tight close connection between X-ray emission and the masses of the interacting ISM cores (Figure 4). This suggests that the distribution of the dense gas had a significant effect on regulating the X-ray distribution in the recent 1000 yr, assuming a shock velocity of 4000 km s-1 (c.f., Tsuji & Uchiyama, 2016), which has stimulated a detailed theoretical study of the interaction between a shock front and clumpy ISM222According to proper-motion measurements of the Chandra X-rays, the shock speed is measured to be km s-1 (Tsuji & Uchiyama, 2016). The shock propagates through low-density intercloud regions without much deceleration (see also Section 3.3). Because the shocked molecular clouds are located within 4 pc from the shock front, the clouds have regulated the X-ray distribution in the most recent 1000 yr..
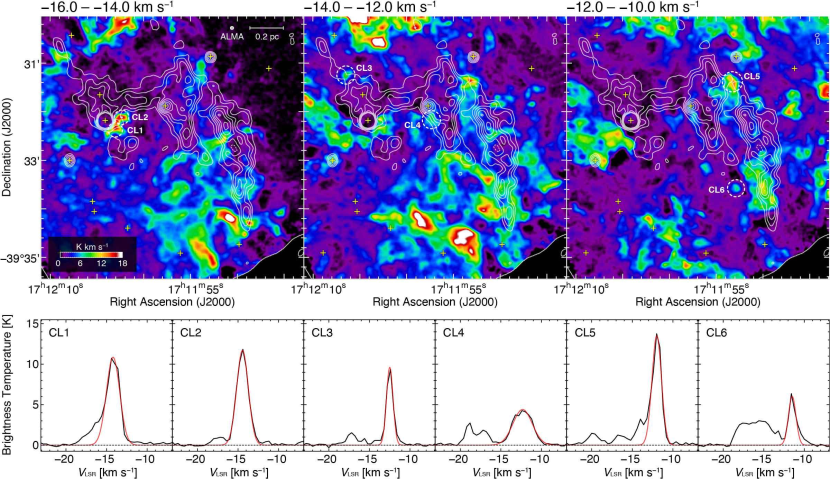
Most recently, Sano et al. (2020b) obtained high-resolution CO observations (with 0.02 pc resolution) toward the northwestern shell of RXJ1713 using the Atacama Large Millimeter/submillimeter Array (ALMA). The authors found dozens of tiny clumps, with typical radii of 0.03–0.05 pc (referred to as molecular cloudlets). Figure 5 shows the velocity channel distributions of ALMA CO intensities superposed on Chandra synchrotron X-ray contours. The molecular cloudlets are located not only along the synchrotron X-ray filaments, but also in the vicinity of X-ray hotspots that exhibit flux variations on timescales of a few months or years (see Uchiyama et al., 2007; Higurashi et al., 2020). Because the CO profiles of the cloudlets have narrow widths (see the bottom panels in Figure 5 ), the authors concluded that these clumpy structures were formed before the supernova explosion.
3.3 Simulations of shock-cloud interactions
Magneto-hydrodynamical (MHD) numerical simulations of a supernova shock propagating in a clumpy ISM show that both the turbulence and the magnetic field are amplified around the dense cores, offering a theoretical basis for the ISM–X-ray correspondence (Inoue et al., 2009, 2012).
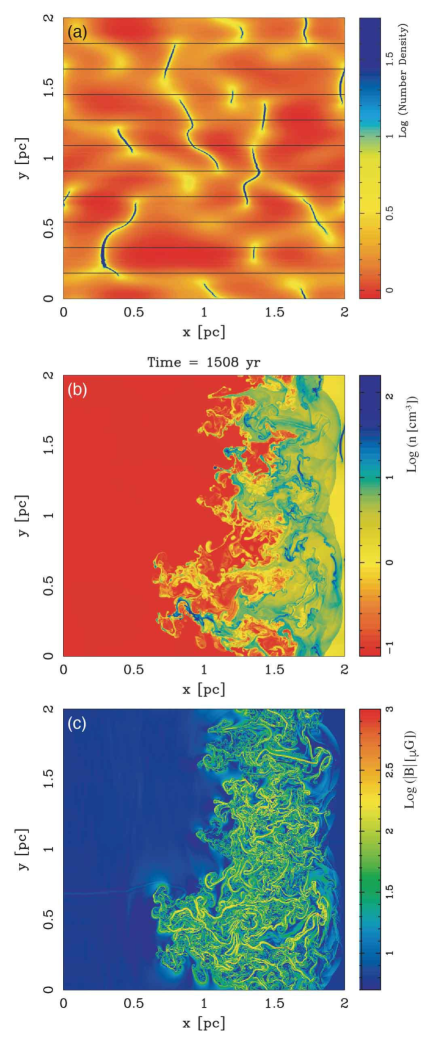
Figures 6(a) and 6(b) show the density distributions at 0 and 1508 yr after since the onset of the shock interaction. The low-density gas (with number density of 1 cm-3)—i.e., the WNM—is disturbed significantly by the shock acceleration, while the high-density gas (with number densities exceeding 100 cm-3)—i.e., the CNM—is not much accelerated. In spite of the interaction, the shock front propagates almost freely at its initial velocity of 3000 km s-1 owing to the low filling factor of the CNM cores. Figure 6(c) shows the distribution of the magnetic field which indicates a highly entangled field configuration. The shock front, which was initially planar, is deformed when it hits a dense core and becomes entangled around the core. This produces a turbulent velocity field in the WNM, and the magnetic field becomes turbulent and is amplified to 100 G or higher from its initial value of 6 G (Inoue et al., 2009). The amplified magnetic field surrounds the dense cores, as shown in Figure 6(b), which explains why the synchrotron X-rays are rim-brightened around the dense cores. The simulations show that the magnetic field is amplified around the dense core in a layer of sub pc-scale thickness, where the nonthermal X-rays are enhanced.
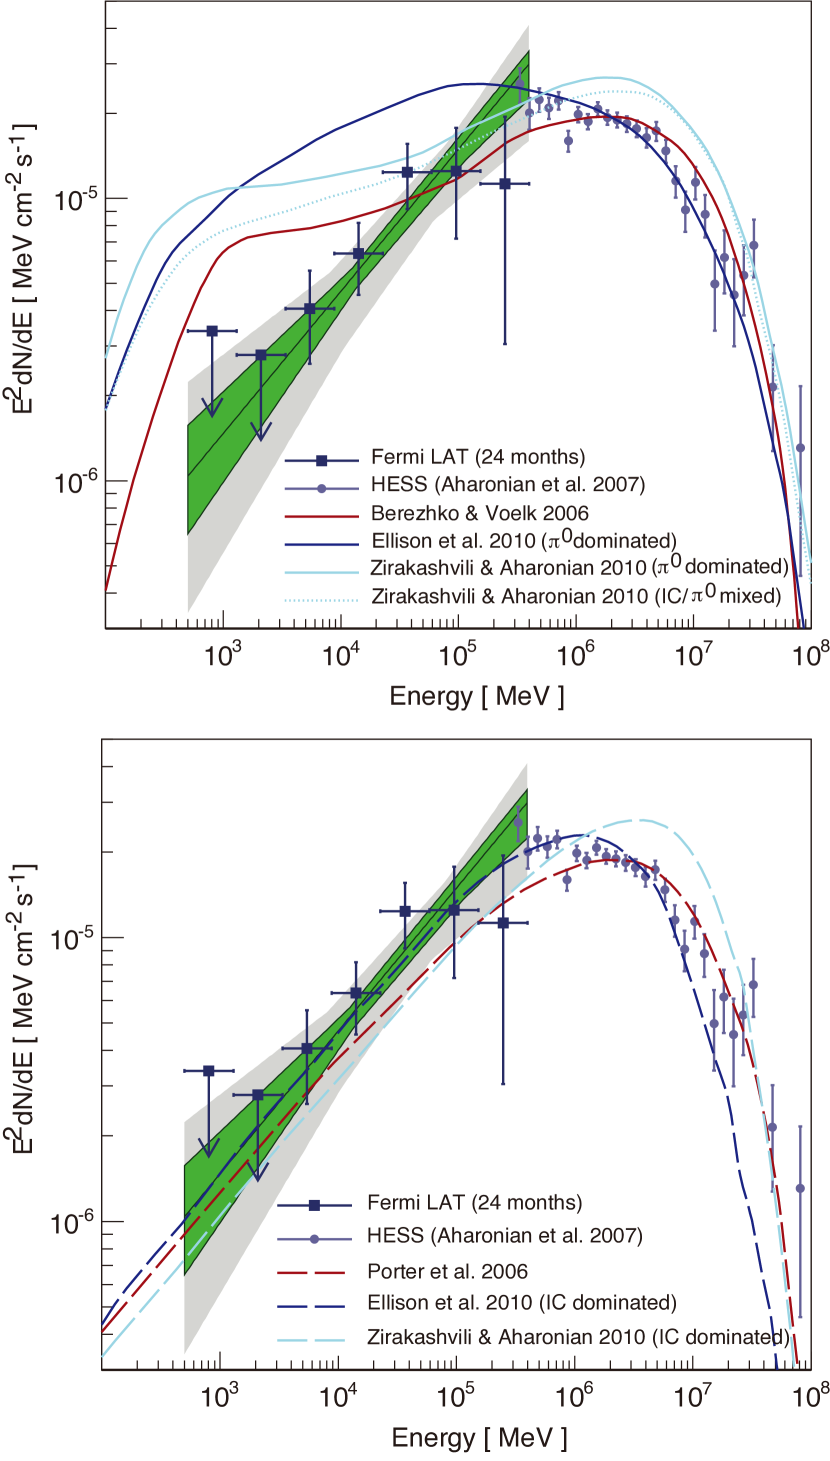
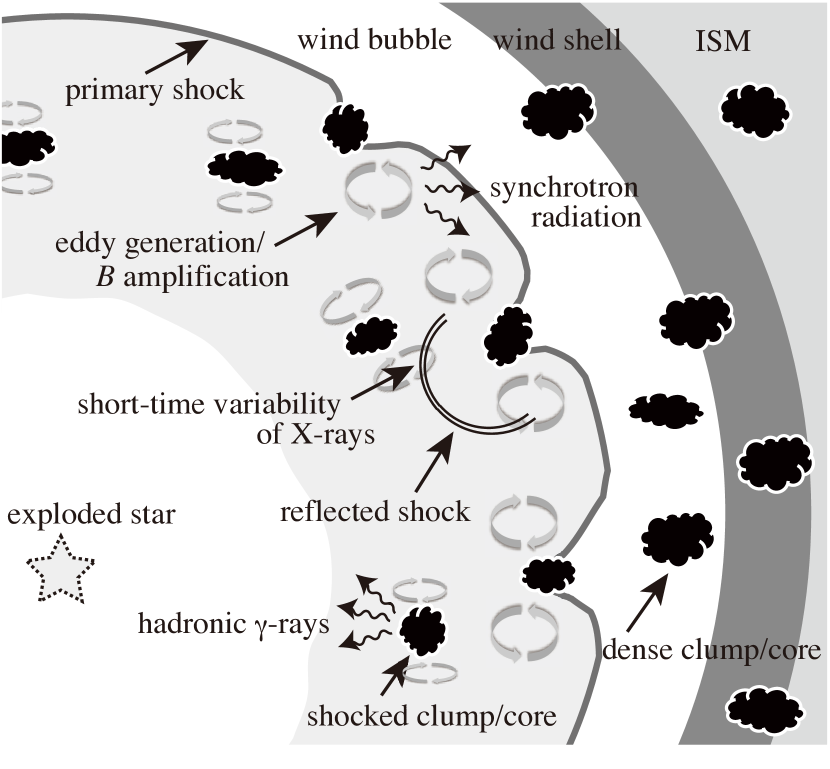
Figure 7 shows a schematic of the shock–cloud interaction model of Inoue et al. (2012). Before the supernova explosion of a high-mass progenitor, ambient interstellar gas such as diffuse Hi is completely evacuated by a strong stellar wind. The wind creates a wind bubble with a density of 0.01 cm-3 (e.g., Weaver et al., 1977). By contrast, dense molecular clouds, with densities exceeding 1000 cm-3 can survive in the wind. Consequently, an inhomogeneous gas distribution with a density difference of five orders of magnitude is formed by the high-mass progenitor, before the supernova explosion occurrs. The primary forward shocks from the SN explosion propagate through the wind bubble with clumpy clouds, where particle acceleration operates. Shocks transmitted through the gas cloud are stalled, whereas shock waves in the intercloud medium are not decelerated. These velocity differences are also observed in measurements of the proper motions of the forward shocks (e.g., Tsuji & Uchiyama, 2016). The velocity difference generates multiple eddies around the shocked clouds, which enhance the magnetic field strength up to 1 mG. Finally, we observe that the shocked clouds are limb-brightened by the synchrotron X-rays. The high magnetic field strength causes short-timescale variability of the synchrotron X-rays, as discovered by Uchiyama et al. (2007). The shocked gas clouds also act as targets for cosmic-ray protons and produce hadronic -rays (see Sections 3.4 and 3.5).
3.4 The clumpy gas distribution and the -ray spectrum
Many previous theoretical works on gamma-ray production via the hadronic process have assumed uniform density or radial density gradients, with a typical ambient density of 1 cm-3 (e.g., Ellison et al., 2010; Lee et al., 2013). Even though a low-density environment such as a wind-swept cavity and non-uniformity have been discussed to explain the observed -ray spectra, potentially energy dependent propagation effects in the multi phase ISM have not been considered (cf., Berezhko & Völk, 2010). One reason why the multi phase ISM has not generally been considered is because MHD effects in SNRs are mostly negligible for low-density contrasts (Berezhko et al., 2013). The real ISM environment surrounding a SNR, however, contains preexisting inhomogeneities with density contrasts of 105 in the ISM, the importance of which was first emphasized by Cox & Smith (1974) and McKee & Ostriker (1977).
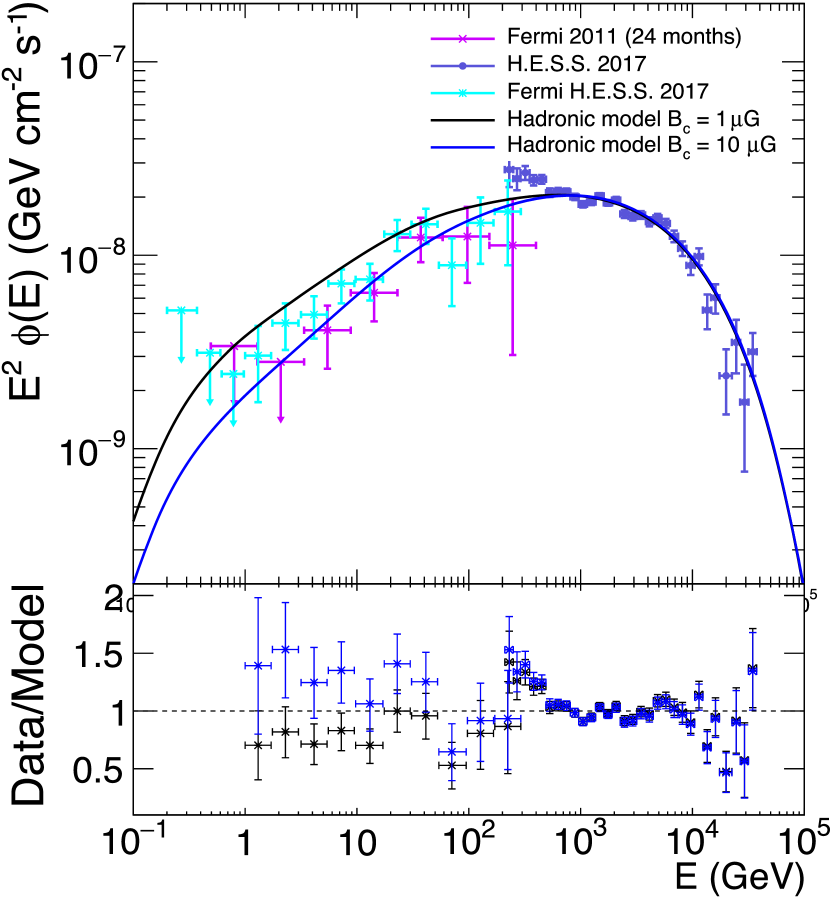
Conventional -ray spectra in the hadronic and leptonic scenarios for a uniform (or small density-contrast) ISM are shown in Figure 8 (Abdo et al., 2011). The hadronic spectrum is relatively flat, with a spectral index of 2.0, while the leptonic spectrum is hard in the GeV band (). Therefore, on average, over several SNRs—the shape of the -ray spectra—should allow discrimination between the two scenarios if we consider a simple one-zone assumption. However, such assumptions do not hold for individual SNRs, as has been discussed in the community, even for the typical young SNR Cassiopeia A (e.g., Atoyan et al., 2000; Helder & Vink, 2008). RXJ1713 is also a representative examples: the inclusion of the clumpy ISM has a significant effect and significantly changes the hadronic spectrum as discussed below (Zirakashvili & Aharonian, 2010; Inoue et al., 2012; Gabici & Aharonian, 2014; Celli et al., 2019).
The hadronic -ray scenario requires a high density of target protons, whereas the large volume of low-density gas is required for efficient particle acceleration via diffusive shock acceleration (DSA). Because the maximum energy of the accelerated particles is proportional to the shock speed, it is assumed to be that a low-density medium (typically less than 1 cm-3) and the large volume is needed to efficient acceleration. Under the assumption of a uniform ISM, an ISM density greater than 1 cm-3 is required to produce the -rays observed from RXJ1713 (Ellison et al., 2010). For such high densities, strong thermal X-rays due to shock heating are expected. This is contradicted the purely nonthermal X-rays observed from RXJ1713. Although some theoretical studies have avoided this contradiction by considering a wind-bubble model and/or a thermal nonequilibrium state between the electrons and protons downstream (e.g., Morlino et al., 2009; Berezhko & Völk, 2010), the absence of bright thermal X-ray emission has been used to exclude hadronic -rays and support leptonic -rays (Ellison et al., 2012).
However, the lack of thermal X-ray emission in the presence of high gas densities can be explained naturally by considering a realistic clumpy ISM distribution. Most of the volume of the interclump medium is of low density, which allows the DSA to work, whereas a large fraction of the mass of the ISM is contained in dense cores, which can work as a dense, massive, target material, enabling the cosmic-ray protons to produce hadronic -rays via the p–p reaction. In the dense cores, the shock fronts are decelerated significantly, with no heating, and thermal X-rays are suppressed, as indicated by the equation 1 (Inoue et al., 2012):
| (1) |
where is the maximum temperature of the protons, is the shock velocity in the intercloud or diffuse region, is the number density of the intercloud or diffuse gas, and is the number density in the dense clouds. Because the density differences between and are on the order of 5, no strong thermal X-rays are expected from RXJ1713 under the clumpy ISM distribution. The recently discovered thermal X-ray line emission from RXJ1713 originates from the supernova ejecta (Katsuda et al., 2015), and hence it is consistent with the shock–cloud interaction model.
Inoue et al. (2012) studied -ray production in the shock–cloud interaction in RXJ1713 based on MHD numerical simulations, and they showed that a hard spectrum ( in the GeV band) like that of leptonic -rays is well reproduced in the hadronic scenario with a clumpy ISM. Within the SNR shell, the dense cores are exposed to cosmic-ray protons, and the p–p interactions inside the cores produce -rays. The p–p reactions thus lead to a spatial correspondence between the -rays and the ISM mass.
The most essential argument of Inoue et al. (2012) is taking into account the penetration depths of cosmic-ray protons into dense cores, which are limited by the amplified turbulent magnetic field around the dense cores (Inoue et al. 2012: see also Zirakashvili & Aharonian 2010). This tends to dilute the -ray–ISM correspondence. Equation 2 gives an expression for the penetration depth as a function of the magnetic field from Inoue et al. (2012),
| (2) |
where is the particle energy, is the age of the SNR, and the cosmic-ray energy spectrum is assumed to have the form above the critical energy for creation and below the maximum energy of the accelerated nuclei. Here, is the degree of randomness of the turbulent magnetic field, which is 1 around the cores (e.g., Uchiyama et al., 2007). This indicates that the cosmic-ray protons can penetrate on the order of 0.1 pc into the surface layers of the cores in; this is smaller than the typical size of 1 pc of the CO cores in RXJ1713. Consequently, low-energy cosmic-ray protons cannot penetrate deeply into the dense regions of the cores, and the -ray spectrum is modified accordingly (Inoue et al., 2012; Gabici & Aharonian, 2014; Celli et al., 2019). The ISM mass that interacts with the cosmic rays is proportional to the cosmic-ray energy : , if we assume a cosmic-ray distribution with the spectral index for high-energy nuclei, as in conventional DSA theory (Inoue et al., 2012). The increase in with produces a hard -ray spectrum (), similar to the leptonic spectrum produced in a uniform low-density ISM. Figure 9 shows the -ray SED of RXJ1713, which can be well reproduced by the hadronic scenario when the penetration depths of the cosmic-ray protons are considered (Celli et al., 2019). In addition, the penetration depth is expected to cause local anticorrelations between the -rays and the ISM density on the 0.1-pc scales, which may become directly observable in the future using high-resolution -ray observations with the Cherenkov Telescope Array (CTA).
3.5 Correspondence between the ISM and -rays
3.5.1 ISM–-ray correspondence
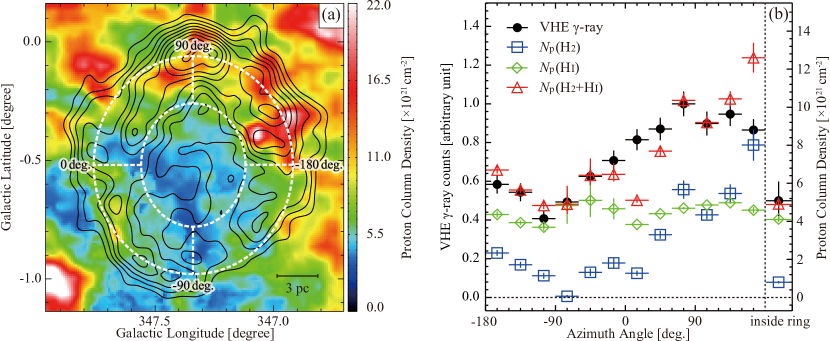
In early works (Aharonian et al., 2006; Fukui, 2008), only CO clouds were compared with the -ray distributions. Fukui et al. (2012) made a comprehensive comparison between the ISM (including both molecular and atomic hydrogen) and the TeV -rays observed using H.E.S.S. aiming to test the spatial correspondence. A new feature of this work was that the Hi emission was included in the comparison, and the amount of the Hi gas was found to be comparable with the molecular mass. Figure 10 shows that the azimuthal distributions of the two quantities have good spatial correspondence at an effective resolution of 3 pc, which is limited by the H.E.S.S. observations. These results lend support to the hadronic scenario (see below for further discussion). The 3-pc resolution is considerably larger than the typical penetration depth of 0.1 pc and the effect of the exclusion of low-energy cosmic rays from the dense region is not significant in the plot. The good spatial correspondence between the total ISM protons and -rays shows for the first time that the necessary condition for the hadronic origin of the -rays, which was not clear in Aharonian et al. (2006), is satisfied. Subsequent detailed comparative studies among the ISM, gamma-rays, and synchrotron X-rays supported this result by separating the hadronic and leptonic gamma-rays quantitively (Fukui et al., 2021).
3.5.2 Cosmic-ray energy
The total cosmic-ray energy is estimated from equation 3 below (from Aharonian et al., 2006) to be erg, which corresponds to 0.1% of the total energy of a typical supernova explosion.
| (3) |
where is the 1-kpc distance to the source and is the average density of interstellar protons associated with the SNR. This value is unlikely to represent the total cosmic-ray energy involved in RXJ1713. The number of dense cores in the shell is around 20, each with a typical radius of 1 pc (Sano et al., 2013). For the volume of the shell, which has an 8-pc radius, the volume filling factor of the cores is estimated to be 10%, implying that about 1/10 of the cosmic-ray protons are interacting with the ISM protons. This means that the total energy of cosmic rays is 10 times larger than the estimated value of . The time evolution must be taken into account further, and we expect the maximum energy of the -rays to shift to lower values with 10-fold increase in the total energy. The total cosmic-ray energy in the middle aged SNRs such as W44 and W28 is estimated to be 1049 erg in the hadronic scenario (e.g., Yoshiike et al., 2013, 2017). In addition, it is likely that escaping cosmic rays can be more significant than accelerated cosmic-rays inside the SNR. In W44, Uchiyama et al. (2012) showed the nearby clouds outside the SNR are -ray bright, and may involve a significant amount of cosmic rays on the order of (0.3–3) erg. This value corresponds to 10% of the typical kinematic energy released by a supernova explosion (1051 erg). Therefore, SNRs such as RXJ1713 may substantially contribute to the Galactic cosmic-ray energy budget because on average 10% of the total explosion energy is needed to sustain the Galactic cosmic-ray flux (see Gabici 2013 and references therein).
3.5.3 Hadronic vs. leptonic scenarios
The major process responsible for -ray production in RXJ1713 is still under debate. The similar shell-like distributions in both X-rays and -rays make two scenarios possible. In the leptonic scenario, cosmic-ray electrons are responsible for both -ray and X-ray production. In the hadronic scenario, the shell-like ISM distribution produces shell-like -rays and the shock–cloud interaction produces a shell-like distribution owing to the enhanced nonthermal X-rays around the dense cores. A possible difference between the two is that the shock–cloud interaction causes spatial offsets on the order of 0.1–0.4 pc between the cores and the -ray peaks, which are still below the current limit of -ray resolution.
Broad-band fitting of the -ray spectrum can be reconciled with the both scenarios according to a recent analysis by H. E. S. S. Collaboration et al. (2018). They argued that both the leptonic and hadronic scenarios can explain the -ray observations obtained by H.E.S.S., based on a spectral analysis of the -ray observations from 2003 to 2018. In this work, the H.E.S.S. -rays and Suzaku X-rays were combined and the broad-band energy spectrum from 1 keV to 10 TeV was presented. The spatial resolution was conservatively set to 3.2 pc, which was adopted for the Suzaku analysis (Tanaka et al., 2008), while the new H.E.S.S. data achieved a nominal resolution of 0.6 pc. In the leptonic scenario, the cosmic-ray electrons are responsible for the -ray production. The electrons are cooled by synchrotron energy loss, so the magnetic field has to be small (10 G) for the leptonic scenario to work. In shock–cloud interactions, the field may become as strong as 0.1–1 mG locally, although it may not be so strong over a large volume. H. E. S. S. Collaboration et al. (2018) did not make a comparison with the ISM, which remains to be done in the future.
4 RCW 86
4.1 X-rays and the ISM
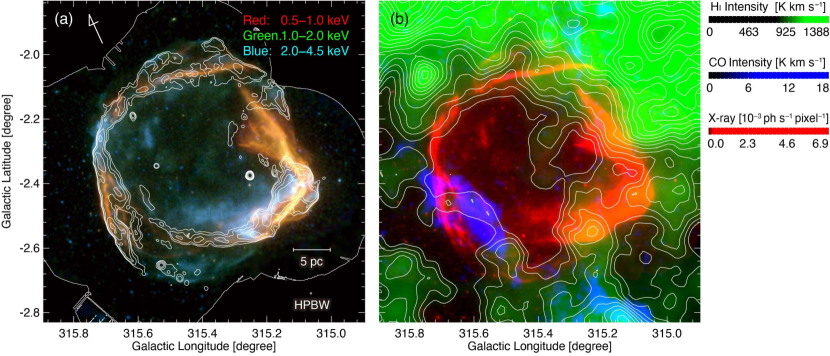
The Type Ia SNR RCW 86 is located at (, ) = (315.4, ) and it exhibits both thermal and nonthermal X-rays (Figure 11a). The distance has been determined to be 2.5 kpc using several methods (e.g., Westerlund, 1969; Rosado et al., 1996; Helder et al., 2013), and its 1800 yr age is based on a possible counterpart to the historical supernova event SN 185 recorded in Chinese literature in 185 AD (Stephenson & Green, 2002; Smith, 1997; Dickel et al., 2001; Vink et al., 2006). The ISM in the velocity range from to km s-1 is associated with the SNR, as found from the spatial correlation with the X-rays (Ajello et al., 2016; Sano et al., 2017a). RCW 86 is close to a CO cloud, that is part of the supershell GS 314.80.134 identified in CO emission by Matsunaga et al. (2001). Sano et al. (2017a) compared the X-rays with CO and Hi for two energy bands, 0.5–1.0 and 2.0–4.5 keV, where the low energy band is dominated by thermal X-rays and the high energy band by nonthermal X-rays (e.g., Rho et al., 2002; Ajello et al., 2016, see also Figure 11a).
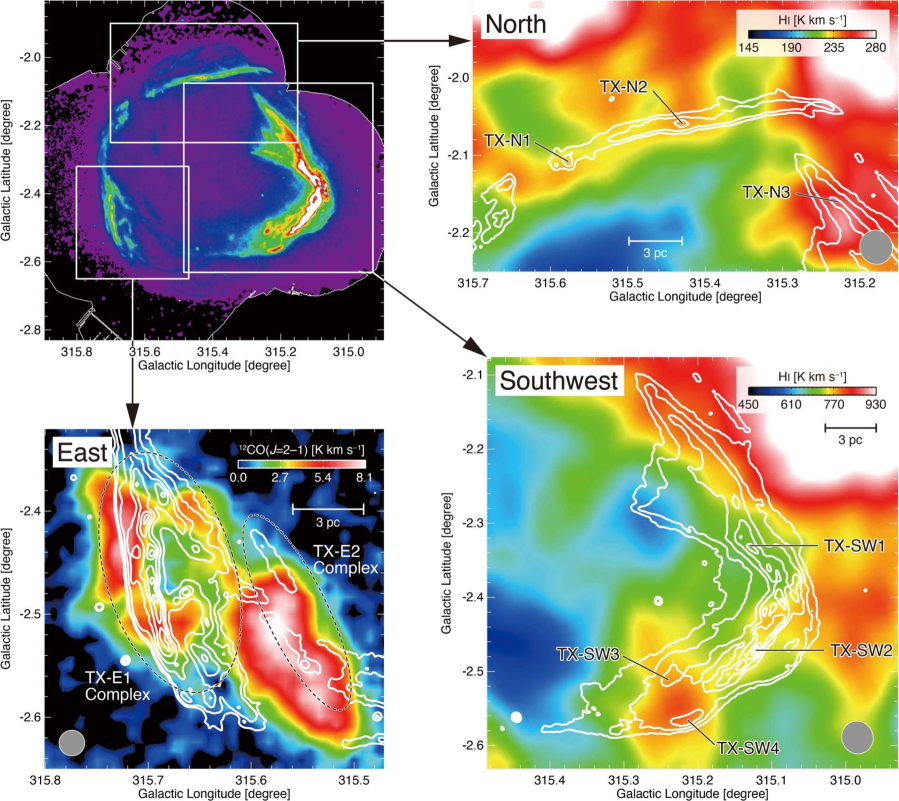
The ISM surrounding the SNR is dominated by Hi. The overall distribution of both Hi and CO is shell like, and the X-rays are distributed within the cavity (Figure 11b). In addition, extended weak Hi emission is found inside the shell. According to Sano et al. (2017a), the thermal X-ray filaments with a typical thickness of 1 pc show tight correlations with Hi and CO (Figure 12), while the nonthermal X-rays are associated with low-density regions of Hi, with densities around cm-2. The ISM density in RCW 86 is lower than that in RXJ1713, which is consistent with a Type Ia SNR. Only a CO cloud with a size of 5 pc 3 pc interacts with the shock, as verified by the high temperature estimated from the high ratio of the two CO transitions, CO = 2–1 and 1–0. No heating sources such as IRAS / AKARI infrared point sources or high-mass stars exsit in these regions, except for the shock front of RCW 86 (Sano et al., 2017a).
Because the thermal X-rays are produced by shock heating of neutral gas with a density less than 100 cm-3, the correlation with the Hi gas is a natural outcome of the shock heating. The critical difference between RCW 86 and RXJ1713 is probably the total mass of Hi gas inside the SNR shell. For RXJ1713, dense molecular clouds with densities greater than cm-3 remain without being swept up by the SNR shocks. The diffuse and intercloud Hi gas were completely evacuated by strong stellar winds, and then creating the very low-density cavity and the swept-up dense wall (e.g., Fukui et al., 2003; Moriguchi et al., 2005; Sano et al., 2010; Maxted et al., 2013). Therefore, we did not find any Hi envelopes around the dense molecular clouds in RXJ1713, and strong thermal X-rays were not detected at the peripheries (see also Section 3.4). On the other hand, RCW 86 shows an Hi envelope surrounding the molecular cloud in the east, and a large amount of diffuse Hi gas remains inside the SNR (see Figure 11b). This difference is explained by the hypothesis that accretion winds (or disk winds) from the progenitor system of RCW 86 are weaker than the stellar winds from the high-mass progenitor of RXJ1713.
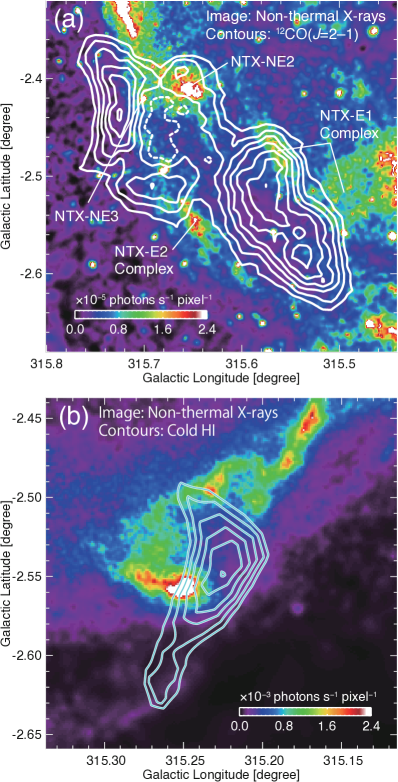
Sano et al. (2017a) also studied the association of the ISM with nonthermal X-rays. Figure 13 shows nonthermal X-ray images superposed on the CO and cold Hi contours toward the east and southwest regions. The CO and Hi clumps are limb-brightened in nonthermal X-rays, which are dominated by synchrotron radiation. This indicates that shock–cloud interactions occur in the surface layers of dense clumps, where the magnetic filed is strongly amplified. RCW 86 has no clumpy CO inside the shell, and the gas density seems to be smoother than in RXJ1713. The authors interpreted the lower ISM mass to be related to the older evolutionary state of the region after star formation because RCW 86 is part of a molecular supershell with an age of 2 Myr (Matsunaga et al., 2001). By contrast, in RXJ1713 we see ongoing star formation within the SNR shell, as evidenced by the protostellar outflow in CO peak “C” and a few more YSO candidates (Sano et al., 2010).
4.2 The origin of the -rays
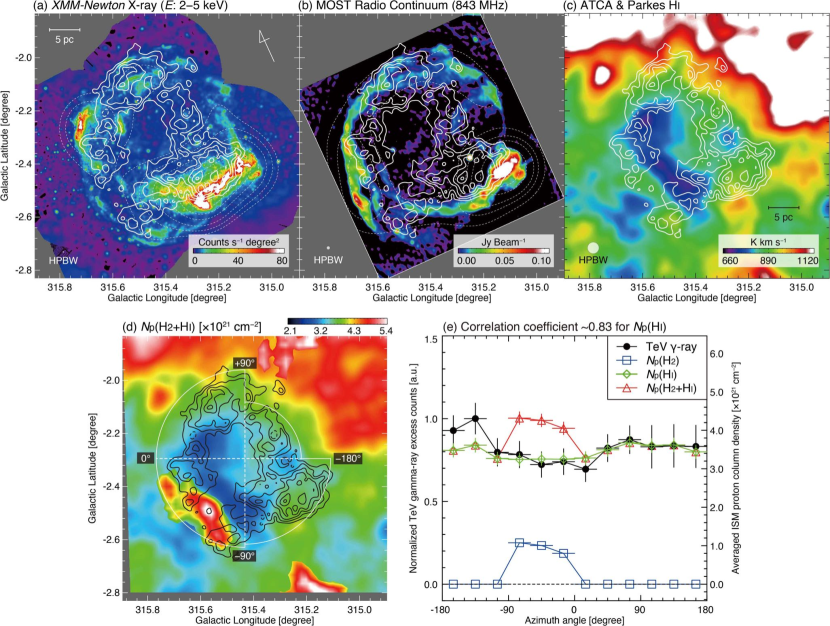
Figures 14(a) and 14(b) show overlays of the synchrotron X-ray and radio continuum distributions on the TeV -ray contours, where the lowest -ray contour level of -ray corresponds to a significance level of (see also Figure 1 of H. E. S. S. Collaboration et al., 2018). In these images, the synchrotron emission appears as a nearly circular shell, whereas the -ray emission seems to deviate from this shape, particularly toward the West, where the -ray emission appears to be shifted toward the SNR interior. If true, this would argue against the leptonic scenario. However, by employing a quantitative analysis that uses radial profiles in the different regions of interest, H. E. S. S. Collaboration et al. (2018) showed that within statistical errors, there is no significant difference between the TeV -rays and the X-ray synchrotron emission. Future -ray observations with high sensitivity and high angular resolution are needed to confirm the spatial match or the difference between the two images.
A spatial comparison between the ISM and -rays therefore remains essential for understanding the origin of the -rays. In Figure 14(c) the TeV -ray distribution is overlaid on the Hi, and the comparison shows good spatial correspondence. Figure 14e shows a plot of the azimuthal distributions of the -rays and of the total proton column density (HHi), derived using both the Hi and the CO. The -rays show good correspondence with the Hi distribution, while no enhancement is seen toward the CO cloud (Figures 14d and 14e in the azimuth angles from to ). The poor correlation with the CO is ascribed to the effect of cosmic-ray exclusion due to the small penetration depths (less than 1 pc; Sano et al., 2019a, see Section 3.4). More precisely, the radii of the shock-interacting molecular clouds constitute a key difference between RXJ1713 and RCW 86. For RXJ1713, the cloud radius is 1 pc or less; hence, the molecular clouds play a significant role as targets of cosmic-ray protons. However, the cloud radius of RCW 86 is more than 5 pc (Sano et al., 2017a). Additionally, the weak disk winds from the progenitor system of RCW 86 were not able to strip off the Hi envelope from the surface of molecular cloud. Therefore, cosmic-ray protons accelerated in RCW 86 can interact only with the low-density Hi gas on the surface of the molecular cloud.
For the azimuthal angles from to , we find -ray excesses relative to the total proton column density. We see a hint of the -ray excess by a factor of 1.2, which may be ascribed to the contribution from a leptonic -ray component, because bright synchrotron radiation is detected toward the SE region. The possible contribution of leptonic -rays to the total -rays may be as low as 5% if the arguments given above are correct. The total cosmic-ray energy in RCW 86 is estimated to be erg. A similar argument to the case of RXJ1713 is perhaps applicable here, and the energy is a typical one for a young SNR with an age of 2000 yr. Considering the lower sensitivity of the current H.E.S.S. data for RCW 86, we do not discuss the -ray origin further until more sensitive -ray data become available.
5 Summary and Future Prospects
We have reviewed the ISM associated with young supernova remnants and its connection with the observed X-rays and -rays. These high-energy radiations are closely related to cosmic rays that are probably accelerated via DSA. The present focus was on the young, bright TeV -ray SNRs RXJ1713 and RCW 86. Shock–cloud interactions in a clumpy ISM play an important role in regulating the X-ray properties as well as the -ray production.
The pursuit of the ISM in SNRs is being extended to nearby galaxies, including the Large Magellanic Cloud (LMC) and the Small Magellanic Cloud (SMC). The ISM associated with the SNRs has been identified in many of them, providing promising candidates for further studies on the role of the ISM (Sano et al., 2015b, 2017b, 2017c, 2018, 2019b, 2019c, 2020a; Yamane et al., 2018, 2021; Roper et al., 2018; Alsaberi et al., 2019). The smaller contamination along the line of sight is advantageous for identifying molecular clouds associated with the SNRs and for using optical and infrared datasets without strong stellar absorption. Although the Magellanic SNRs lie at 50–60 times larger distances from us than compared with the distance of RXJ1713 from us (e.g., Hilditch et al., 2005; Pietrzyński et al., 2013), ALMA’s unprecedented sensitivity and spatial resolution have enabled us to resolve spatially the cloud-scale structures of the ISM associated with the Magellanic SNRs.
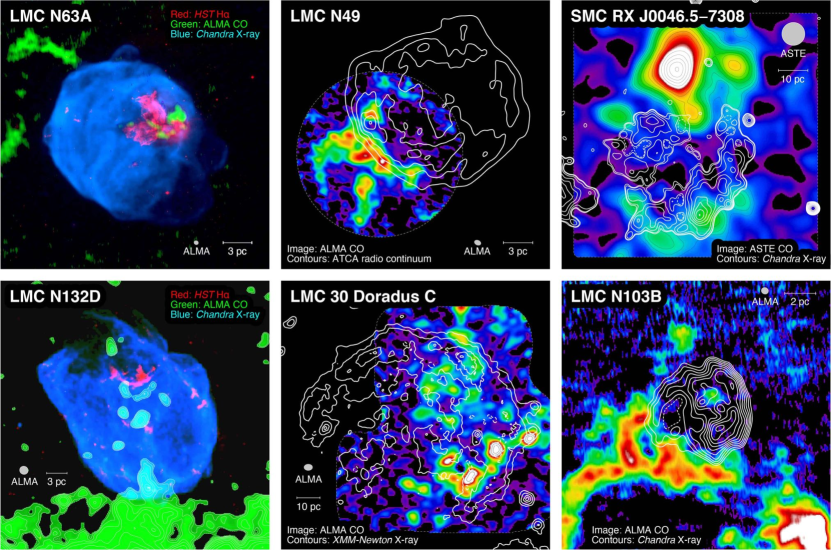
Figure 15 shows CO mapping results toward the five Magellanic SNRs and a superbubble that are bright in X-rays. The molecular clouds lie nicely along, or embedded within, the SNR shells, indicating that the shock–cloud interactions have occurred. 30 Doradus C, one of the brightest X- and -ray superbubbles in the Local group (see Kavanagh 2020 and references therein), provides one of the best laboratories for studying shock–cloud interactions because of its large apparent diameter and very bright TeV -rays (H. E. S. S. Collaboration et al., 2015). Future observations using ALMA, Chandra, and the CTA will allow us to study in detail not only shock–cloud interactions but also the hadronic -ray radiation from the Magellanic SNRs.
We summarize the main points of this review as follows:
-
1.
Spatial comparisons between X-rays and the ISM provide a powerful approach for determining the distances to SNRs, which is otherwise difficult for SNRs in the Galactic plane because of heavy obscuration. For RXJ1713, the ISM delineates the outer boundary of the nonthermal X-ray shell at pc scales, while X-ray bright spots (or filaments) are anti-correlated with the ISM clouds/cloudlets at small-scales (sub-pc scales), allowing a robust distance estimate. RCW 86 is an easier case, for which distance has been determined accurately owing to its relatively high Galactic latitude.
-
2.
When we consider the ISM surrounding the SNRs, it is important to recognize that the neutral ISM is characterized by highly clumped distributions, with clumps that are much denser than the nominal uniform density of 1 cm-3 assumed in many previous works. The ISM shell in a SNR surrounds a low-density cavity, and the shell comprises a layer that includes tiny, dense clumps with a small volume filling factor. Consequently, an SNR has a large low-density volume, where DSA works, as well as dense clumps, which interact with the cosmic rays and shocks. Magnetohydrodynamical numerical simulations of shock–cloud interactions reveal that the dense clumps cause strong deformations of the shock fronts. The deformations produce highly turbulent velocity distributions, which entangle and amplify the magnetic field to mG levels (Inoue et al., 2012). In most parts of the low-density cavity, however, the shocks propagate with little deceleration or deformation.
-
3.
The clumpy ISM picture requires modification of the previous scenarios that were based on a homogeneous ISM. The observed -ray spectrum of RXJ1713 is hard, according to the Fermi collaboration, and the spectrum has previous been interpreted in terms of the leptonic scenario in a uniform ISM picture. However, we have shown that a the clumpy ISM can explain the hard spectrum in the GeV band ( = 1.5) equally well because the penetration of cosmic rays into dense clumps is inhibited by diffusive scattering due to the turbulent magnetic field. We have discussed the implications of a clumpy ISM for interpreting the observations of several SNRs and have outlined the future prospects for this field.
Acknowledgements We truly appreciate the anonymous referee for the useful comments and suggestions, which helped authors to improve the review. We would like to thank the editors of this Topical Collection Ralf-Jürgen Dettmar, Manami Sasaki, and Julia Tjus for inviting us to write this review. We are also grateful to Rei Enokiya for the useful comments, which helped the authors improve the review paper. This review paper makes use of the following ALMA data: ADS/JAO.ALMA#2013.1.01042.S, ADS/JAO.ALMA#2015.1.01130.S, ADS/JAO.ALMA #2015.1.01195.S, ADS/JAO.ALMA#2015.1.01232.S, ADS/JAO.ALMA#2017.1.01363.S, and ADS/JAO.AL MA#2017.1.01406.S. ALMA is a partnership of ESO (representing its member states), NSF (USA) and NINS (Japan), together with NRC (Canada), MOST and ASIAA (Taiwan), and KASI (Republic of Korea), in cooperation with the Republic of Chile. The Joint ALMA Observatory is operated by ESO, AUI/NRAO and NAOJ. This review was supported by JSPS KAKENHI Grant Numbers JP15H05694 (YF), JP19K14758 (HS), JP19H05075 (HS), 21H01136 (HS). The authors would like to thank Enago (www.enago.jp) for the English language review.
References
- Abdo et al. (2011) Abdo, A. A., Ackermann, M., Ajello, M., et al. 2011, Astrophys. J., 734, 28
- Aharonian et al. (1994) Aharonian, F. A., Drury, L. O., & Voelk, H. J. 1994, Astron. Astrophys., 285, 645
- Aharonian et al. (2004) Aharonian, F. A., Akhperjanian, A. G., Aye, K.-M., et al. 2004, Nature, 432, 75
- Aharonian et al. (2006) Aharonian, F., Akhperjanian, A. G., Bazer-Bachi, A. R., et al. 2006, Astron. Astrophys., 449, 223
- Aharonian et al. (2007) Aharonian, F., Akhperjanian, A. G., Bazer-Bachi, A. R., et al. 2007, Astron. Astrophys., 464, 235
- Ajello et al. (2016) Ajello, M., Baldini, L., Barbiellini, G., et al. 2016, Astrophys. J., 819, 98
- Alsaberi et al. (2019) Alsaberi, R. Z. E., Maitra, C., Filipović, M. D., et al. 2019, Mon. Not. R. Astron. Soc., 486, 2507
- Arikawa et al. (1999) Arikawa, Y., Tatematsu, K., Sekimoto, Y., et al. 1999, Publ. Astron. Soc. Jpn., 51, L7
- Atoyan et al. (2000) Atoyan, A. M., Tuffs, R. J., Aharonian, F. A., et al. 2000, Astron. Astrophys., 354, 915
- Bell (1978) Bell, A. R. 1978, Mon. Not. R. Astron. Soc., 182, 147
- Berezhko & Völk (2006) Berezhko, E. G., & Völk, H. J. 2006, Astron. Astrophys., 451, 981
- Berezhko & Völk (2010) Berezhko, E. G. & Völk, H. J. 2010, Astron. Astrophys., 511, A34
- Berezhko et al. (2013) Berezhko, E. G., Ksenofontov, L. T., & Völk, H. J. 2013, Astrophys. J., 763, 14
- Blandford & Ostriker (1978) Blandford, R. D., & Ostriker, J. P. 1978, Astrophys. J. Lett., 221, L29
- Bolatto et al. (2013) Bolatto, A. D., Wolfire, M., & Leroy, A. K. 2013, Annu. Rev. Astron. Astrophys., 51, 207
- Carlton et al. (2011) Carlton, A. K., Borkowski, K. J., Reynolds, S. P., et al. 2011, Astrophys. J. Lett., 737, L22
- Cassam-Chenaï et al. (2004) Cassam-Chenaï, G., Decourchelle, A., Ballet, J., et al. 2004, Astron. Astrophys., 427, 199
- Celli et al. (2019) Celli, S., Morlino, G., Gabici, S., et al. 2019, Mon. Not. R. Astron. Soc., 487, 3199
- Chen & Jiang (2013) Chen, Y., & Jiang, B. 2013, Scientia Sinica Physica, Mechanica & Astronomica, 43, 1
- Cox & Smith (1974) Cox, D. P. & Smith, B. W. 1974, Astrophys. J. Lett., 189, L105
- Dickel et al. (2001) Dickel, J. R., Strom, R. G., & Milne, D. K. 2001, Astrophys. J., 546, 447
- Draine (2011) Draine, B. T. 2011, Physics of the Interstellar and Intergalactic Medium by Bruce T. Draine. Princeton University Press
- Dubner & Arnal (1988) Dubner, G. M., & Arnal, E. M. 1988, Astron. Astrophys. Suppl. Ser., 75, 363
- Dubner et al. (1998) Dubner, G. M., Green, A. J., Goss, W. M., et al. 1998, Astron. J., 116, 813
- Dubner et al. (1999) Dubner, G., Giacani, E., Reynoso, E., et al. 1999, Astron. J., 118, 930
- Dubner et al. (2002a) Dubner, G. M., Gaensler, B. M., Giacani, E. B., et al. 2002a, Astron. J., 123, 337
- Dubner et al. (2002b) Dubner, G. M., Giacani, E. B., Goss, W. M., et al. 2002b, Astron. Astrophys., 387, 1047
- Dubner et al. (2004) Dubner, G., Giacani, E., Reynoso, E., et al. 2004, Astron. Astrophys., 426, 201
- Ellison et al. (2010) Ellison, D. C., Patnaude, D. J., Slane, P., et al. 2010, Astrophys. J., 712, 287
- Ellison et al. (2012) Ellison, D. C., Slane, P., Patnaude, D. J., et al. 2012, Astrophys. J., 744, 39
- Fukui et al. (2003) Fukui, Y., Moriguchi, Y., Tamura, K., et al. 2003, Publ. Astron. Soc. Jpn., 55, L61
- Fukui (2008) Fukui, Y. 2008, American Institute of Physics Conference Series, 104
- Fukui et al. (2012) Fukui, Y., Sano, H., Sato, J., et al. 2012, Astrophys. J., 746, 82
- Fukui et al. (2014) Fukui, Y., Okamoto, R., Kaji, R., et al. 2014, Astrophys. J., 796, 59
- Fukui et al. (2015) Fukui, Y., Torii, K., Onishi, T., et al. 2015, Astrophys. J., 798, 6
- Fukui et al. (2017) Fukui, Y., Sano, H., Sato, J., et al. 2017, Astrophys. J., 850, 71
- Fukui et al. (2018) Fukui, Y., Hayakawa, T., Inoue, T., et al. 2018, Astrophys. J., 860, 33
- Fukui et al. (2021) Fukui, Y., Sano, H., Yamane, Y., et al. 2021, arXiv: 2105.02734
- Gabici (2013) Gabici, S. 2013, Cosmic Rays in Star-Forming Environments, 34, 221
- Gabici & Aharonian (2014) Gabici, S., & Aharonian, F. A. 2014, Mon. Not. R. Astron. Soc., 445, L70
- Grenier et al. (2005) Grenier, I. A., Casandjian, J.-M., & Terrier, R. 2005, Science, 307, 1292
- Hayashi et al. (2019a) Hayashi, K., Okamoto, R., Yamamoto, H., et al. 2019a, Astrophys. J., 878, 131
- Hayashi et al. (2019b) Hayashi, K., Mizuno, T., Fukui, Y., et al. 2019b, Astrophys. J., 884, 130
- Heiles & Troland (2003) Heiles, C., & Troland, T. H. 2003, Astrophys. J., 586, 1067
- Helder & Vink (2008) Helder, E. A. & Vink, J. 2008, Astrophys. J., 686, 1094
- Helder et al. (2013) Helder, E. A., Vink, J., Bamba, A., et al. 2013, Mon. Not. R. Astron. Soc., 435, 910
- Higurashi et al. (2020) Higurashi, R., Tsuji, N., & Uchiyama, Y. 2020, Astrophys. J., 899, 102
- Hilditch et al. (2005) Hilditch, R. W., Howarth, I. D., & Harries, T. J. 2005, Mon. Not. R. Astron. Soc., 357, 304
- H. E. S. S. Collaboration et al. (2015) H. E. S. S. Collaboration, Abramowski, A., Aharonian, F., et al. 2015, Science, 347, 406
- H. E. S. S. Collaboration et al. (2018) H. E. S. S. Collaboration, Abdalla, H., Abramowski, A., et al. 2018, Astron. Astrophys., 612, A6
- Inoue et al. (2009) Inoue, T., Yamazaki, R., & Inutsuka, S.-. ichiro . 2009, Astrophys. J., 695, 825
- Inoue et al. (2012) Inoue, T., Yamazaki, R., Inutsuka, S.-. ichiro ., et al. 2012, Astrophys. J., 744, 71
- Inoue & Inutsuka (2012) Inoue, T., & Inutsuka, S.-. ichiro . 2012, Astrophys. J., 759, 35
- Inoue (2019) Inoue, T. 2019, Astrophys. J., 872, 46
- Katsuda et al. (2015) Katsuda, S., Acero, F., Tominaga, N., et al. 2015, Astrophys. J., 814, 29
- Kavanagh (2020) Kavanagh, P. J. 2020, Astrophys. Space Sci., 365, 6
- Koyama et al. (1997) Koyama, K., Kinugasa, K., Matsuzaki, K., et al. 1997, Publ. Astron. Soc. Jpn., 49, L7
- Lee et al. (2013) Lee, S.-H., Slane, P. O., Ellison, D. C., et al. 2013, Astrophys. J., 767, 20
- Matsunaga et al. (2001) Matsunaga, K., Mizuno, N., Moriguchi, Y., et al. 2001, Publ. Astron. Soc. Jpn., 53, 1003
- Maxted et al. (2012) Maxted, N. I., Rowell, G. P., Dawson, B. R., et al. 2012, Mon. Not. R. Astron. Soc., 422, 2230
- Maxted et al. (2013) Maxted, N. I., Rowell, G. P., Dawson, B. R., et al. 2013, Proc. Astron. Soc. Aust., 30, e055
- McKee & Hollenbach (1980) McKee, C. F., & Hollenbach, D. J. 1980, Annu. Rev. Astron. Astrophys., 18, 219
- McKee & Ostriker (1977) McKee, C. F. & Ostriker, J. P. 1977, Astrophys. J., 218, 148
- Mizuno et al. (2020) Mizuno, T., Abdollahi, S., Fukui, Y., et al. 2020, Astrophys. J., 890, 120
- Moriguchi et al. (2005) Moriguchi, Y., Tamura, K., Tawara, Y., et al. 2005, Astrophys. J., 631, 947
- Morlino et al. (2009) Morlino, G., Amato, E., & Blasi, P. 2009, Mon. Not. R. Astron. Soc., 392, 240
- Okamoto et al. (2017) Okamoto, R., Yamamoto, H., Tachihara, K., et al. 2017, Astrophys. J., 838, 132
- Pavlovic et al. (2014) Pavlovic, M. Z., Dobardzic, A., Vukotic, B., et al. 2014, Serbian Astronomical Journal, 189, 25
- Pietrzyński et al. (2013) Pietrzyński, G., Graczyk, D., Gieren, W., et al. 2013, Nature, 495, 76
- Planck Collaboration et al. (2011) Planck Collaboration, Ade, P. A. R., Aghanim, N., et al. 2011, Astron. Astrophys., 536, A19
- Porter et al. (2006) Porter, T. A., Moskalenko, I. V., & Strong, A. W. 2006, Astrophys. J. Lett., 648, L29
- Rho et al. (2002) Rho, J., Dyer, K. K., Borkowski, K. J., et al. 2002, Astrophys. J., 581, 1116
- Roper et al. (2018) Roper, Q., Filipovic, M., Allen, G. E., et al. 2018, Mon. Not. R. Astron. Soc., 479, 1800
- Rosado et al. (1996) Rosado, M., Ambrocio-Cruz, P., Le Coarer, E., et al. 1996, Astron. Astrophys., 315, 243
- Sano et al. (2010) Sano, H., Sato, J., Horachi, H., et al. 2010, Astrophys. J., 724, 59
- Sano et al. (2013) Sano, H., Tanaka, T., Torii, K., et al. 2013, Astrophys. J., 778, 59
- Sano et al. (2015a) Sano, H., Fukuda, T., Yoshiike, S., et al. 2015a, Astrophys. J., 799, 175
- Sano et al. (2015b) Sano, H., Fukui, Y., Yoshiike, S., et al. 2015b, Revolution in Astronomy with ALMA: The Third Year, 257
- Sano et al. (2017a) Sano, H., Reynoso, E. M., Mitsuishi, I., et al. 2017a, Journal of High Energy Astrophysics, 15, 1
- Sano et al. (2017b) Sano, H., Yamane, Y., Voisin, F., et al. 2017b, Astrophys. J., 843, 61
- Sano et al. (2017c) Sano, H., Fujii, K., Yamane, Y., et al. 2017c, 6th International Symposium on High Energy -ray Astronomy, 040038
- Sano et al. (2018) Sano, H., Yamane, Y., Tokuda, K., et al. 2018, Astrophys. J., 867, 7
- Sano et al. (2019a) Sano, H., Rowell, G., Reynoso, E. M., et al. 2019a, Astrophys. J., 876, 37
- Sano et al. (2019b) Sano, H., Matsumura, H., Nagaya, T., et al. 2019b, Astrophys. J., 873, 40
- Sano et al. (2019c) Sano, H., Matsumura, H., Yamane, Y., et al. 2019c, Astrophys. J., 881, 85
- Sano et al. (2020a) Sano, H., Plucinsky, P. P., Bamba, A., et al. 2020a, Astrophys. J., 902, 53
- Sano et al. (2020b) Sano, H., Inoue, T., Tokuda, K., et al. 2020b, Astrophys. J. Lett., 904, L24
- Sato & Fukui (1978) Sato, F., & Fukui, Y. 1978, Astron. J., 83, 1607
- Seta et al. (1998) Seta, M., Hasegawa, T., Dame, T. M., et al. 1998, Astrophys. J., 505, 286
- Seta et al. (2004) Seta, M., Hasegawa, T., Sakamoto, S., et al. 2004, Astron. J., 127, 1098
- Slane et al. (1999) Slane, P., Gaensler, B. M., Dame, T. M., et al. 1999, Astrophys. J., 525, 357
- Smith (1997) Smith, R. C. 1997, Astron. J., 114, 2664
- Stephenson & Green (2002) Stephenson, F. R., & Green, D. A. 2002, Historical supernovae and their remnants, 5
- Tachihara et al. (2018) Tachihara, K., Fukui, Y., Hayakawa, T., et al. 2018, arXiv e-prints, arXiv:1811.02224
- Tanaka et al. (2008) Tanaka, T., Uchiyama, Y., Aharonian, F. A., et al. 2008, Astrophys. J., 685, 988
- Tatematsu et al. (1987) Tatematsu, K., Fukui, Y., Nakano, M., et al. 1987, Astron. Astrophys., 184, 279
- Tatematsu et al. (1990a) Tatematsu, K., Fukui, Y., Iwata, T., et al. 1990a, Astrophys. J., 351, 157
- Tatematsu et al. (1990b) Tatematsu, K., Fukui, Y., Landecker, T. L., et al. 1990b, Astron. Astrophys., 237, 189
- Tsuji & Uchiyama (2016) Tsuji, N., & Uchiyama, Y. 2016, Publ. Astron. Soc. Jpn., 68, 108
- Uchiyama et al. (2007) Uchiyama, Y., Aharonian, F. A., Tanaka, T., et al. 2007, Nature, 449, 576
- Uchiyama et al. (2012) Uchiyama, Y., Funk, S., Katagiri, H., et al. 2012, Astrophys. J. Lett., 749, L35
- Vink et al. (2006) Vink, J., Bleeker, J., van der Heyden, K., et al. 2006, Astrophys. J. Lett., 648, L33
- Wang et al. (1997) Wang, Z. R., Qu, Q.-Y., & Chen, Y. 1997, Astron. Astrophys., 318, L59
- Weaver et al. (1977) Weaver, R., McCray, R., Castor, J., et al. 1977, Astrophys. J., 218, 377
- Westerlund (1969) Westerlund, B. E. 1969, Astron. J., 74, 879
- Wolszczan et al. (1991) Wolszczan, A., Cordes, J. M., & Dewey, R. J. 1991, Astrophys. J. Lett., 372, L99
- Wolfire et al. (2010) Wolfire, M. G., Hollenbach, D., & McKee, C. F. 2010, Astrophys. J., 716, 1191
- Yamane et al. (2018) Yamane, Y., Sano, H., van Loon, J. T., et al. 2018, Astrophys. J., 863, 55
- Yamane et al. (2021) Yamane, Y., Sano, H., Filipović, M. D., et al. 2021, Astrophys. J., under review
- Yamaguchi et al. (2009) Yamaguchi, H., Bamba, A., & Koyama, K. 2009, Publ. Astron. Soc. Jpn., 61, S175
- Yamane et al. (2021) Yamane, Y., Sano, H., Filipovic, M. D., et al. 2021, arXiv:2106.09916
- Yoshiike et al. (2013) Yoshiike, S., Fukuda, T., Sano, H., et al. 2013, Astrophys. J., 768, 179
- Yoshiike et al. (2017) Yoshiike, S., Fukuda, T., Sano, H., et al. 2017, 6th International Symposium on High Energy -ray Astronomy, 040039
- Zirakashvili & Aharonian (2010) Zirakashvili, V. N., & Aharonian, F. A. 2010, Astrophys. J., 708, 965