Towards Quantifiable Dialogue Coherence Evaluation
Abstract
Automatic dialogue coherence evaluation has attracted increasing attention and is crucial for developing promising dialogue systems. However, existing metrics have two major limitations: (a) they are mostly trained in a simplified two-level setting (coherent vs. incoherent), while humans give Likert-type multi-level coherence scores, dubbed as “quantifiable”; (b) their predicted coherence scores cannot align with the actual human rating standards due to the absence of human guidance during training. To address these limitations, we propose Quantifiable Dialogue Coherence Evaluation (QuantiDCE), a novel framework aiming to train a quantifiable dialogue coherence metric that can reflect the actual human rating standards. Specifically, QuantiDCE includes two training stages, Multi-Level Ranking (MLR) pre-training and Knowledge Distillation (KD) fine-tuning. During MLR pre-training, a new MLR loss is proposed for enabling the model to learn the coarse judgement of coherence degrees. Then, during KD fine-tuning, the pretrained model is further finetuned to learn the actual human rating standards with only very few human-annotated data. To advocate the generalizability even with limited fine-tuning data, a novel KD regularization is introduced to retain the knowledge learned at the pre-training stage. Experimental results show that the model trained by QuantiDCE presents stronger correlations with human judgements than the other state-of-the-art metrics. 111The code and trained checkpoints are available at https://github.com/James-Yip/QuantiDCE.
1 Introduction
Dialogue coherence, which requires a response to be fluent, consistent and context-related, is an essential property for developing promising dialogue systems (Cervone et al., 2018). However, it is still challenging to evaluate the coherence of a response generated by a dialogue system. Although human evaluation is always considered as the most accurate way to evaluate the coherence, it is expensive and high-latency, which cannot meet the evaluation demand of the frequent development of dialogue systems. Therefore, automatic evaluation metrics are developed to serve as human proxies that can rapidly compute the dialogue coherence and return relatively accurate results.
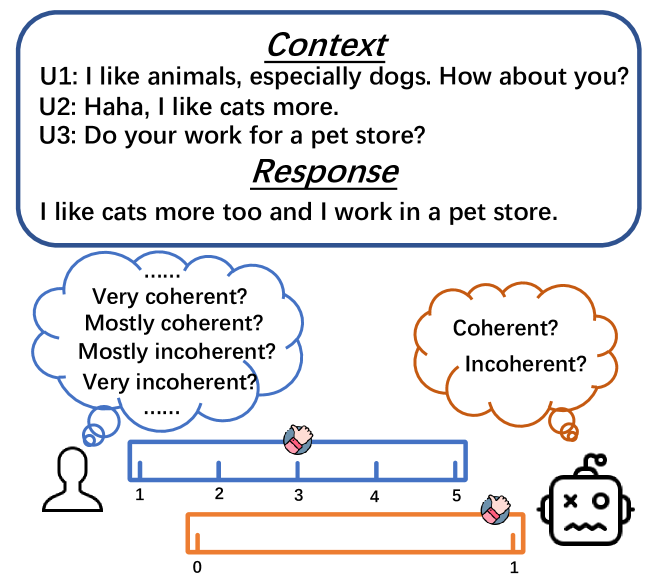
The current widely used metrics measure the lexical word-overlap between generated responses and reference responses, such as BLEU (Papineni et al., 2002) and ROUGE (Lin, 2004). However, they have been demonstrated to be biased and correlate poorly with human judgements since no semantic information is considered (Liu et al., 2016; Novikova et al., 2017). To overcome this issue, researchers turned to develop learnable metrics based on neural networks that incorporate the semantic information, such as RUBER (Tao et al., 2018), BERT-RUBER (Ghazarian et al., 2019) and GRADE (Huang et al., 2020). However, these metrics deviate from the actual human rating due to two limitations. First, they simplify the coherence evaluation task in a two-level setting, i.e., coherent or incoherent, by maximizing the differences between the positive coherent dialogues and the negative incoherent ones obtained by some negative sampling strategies. In contrast, humans usually adopt Likert scaling and give coherence scores from multiple levels like 1 to 5, as shown in Figure 1. Second, to avoid relying on large-scale human-annotated data, they are mostly trained in a purely unsupervised manner and cannot align with the human rating due to the absence of introducing the actual human rating standards during training.
To address the above limitations, we propose a novel dialogue coherence metric training framework, named as Quantifiable Dialogue Coherence Evaluation (QuantiDCE). This framework consists of two training stages: Multi-Level Ranking (MLR) pre-training and Knowledge Distillation (KD) fine-tuning. At the MLR pre-training stage, a new multi-level ranking (MLR) loss is proposed for learning the coarse judgement of coherence degrees. Specifically, the MLR loss separates the context-response pairs with different coherence levels and compacts the pairs within the same level in one-dimensional score space. As a result, the pretrained model is able to distinguish different coherence-level dialogue responses for a given context and predicts more accurate coherence scores. At the KD fine-tuning stage, the pretrained model is further finetuned to learn the actual human rating standards with only very few human-annotated coherence scores. To mitigate overfitting into the scarce annotated data during fine-tuning, a novel knowledge distillation regularization loss is introduced to retain the knowledge learned at the pre-training stage, where the pretrained model (teacher) provides the soft targets for the model during fine-tuning (student). Experimental results show that the metric trained by our QuantiDCE obviously outperforms the other state-of-the-art metrics in terms of the Pearson, Spearman and Kendall correlations with human judgements by around 5% points on average. To summarize our contributions:
1) We propose QuantiDCE, a novel quantifiable training framework for dialogue coherence evaluation, which aims to align the automatic scores with the actual human rating standards via MLR pre-training and KD fine-tuning. To the best of our knowledge, it is the first attempt to consider the quantifiable problem for dialogue coherence evaluation.
2) Extensive experiments demonstrate the effectiveness of our QuantiDCE, which enables the trained metric to have obviously stronger correlations with human judgements than the other state-of-the-art metrics.
2 Related Work
Automatic Coherence Evaluation.
The widely used automatic metrics, such as BLEU (Papineni et al., 2002), METEOR (Banerjee and Lavie, 2005) and ROUGE (Lin, 2004), use statistical rules to measure the degree of lexical word-overlap between generated responses and reference responses. However, these metrics have been demonstrated to correlate poorly with human judgments due to the absence of semantic information (Liu et al., 2016; Novikova et al., 2017). Therefore, the subsequent metrics are considered to incorporate the semantic information. For instance, BERTScore (Zhang et al., 2020) turns to measure the soft semantic word-overlap rather than the hard lexical word-overlap like BLEU. Moreover, learnable metrics encoding the semantic information have been attracting interests recently, which are trained in a supervised manner with large-scale human-annotated data, such as ADEM (Lowe et al., 2017), or trained in an unsupervised manner with automatically constructed data, such as RUBER (Tao et al., 2018) and BERT-RUBER (Ghazarian et al., 2019). Besides, Mesgar et al. (2020) implicitly utilizes dialogue act labels by introducing an auxiliary task, which improves the performance of coherence evaluation. Furthermore, the recently proposed coherence metric, GRADE (Huang et al., 2020), introduces the graph information of dialogue topic transitions and achieves the current state-of-the-art results. Note that these learnable metrics are trained in a two-level training objective to separate the coherent dialogues from the incoherent ones, while our QuantiDCE models the task in a multi-level setting which is closer to the actual human rating.
Knowledge Distillation.
Knowledge distillation (KD) is a method that transfers the knowledge from a large trained teacher model to a smaller student model by using the soft targets provided by the teacher (Hinton et al., 2015). In recent years, KD has been applied to many specific tasks (Sun et al., 2020; Wei et al., 2019; Kim and Rush, 2016; Sourty et al., 2020). Unlike these previous works, we use KD to retain knowledge learned at the pre-training stage during fine-tuning and do not compress the model size of the student model.
3 QuantiDCE Framework
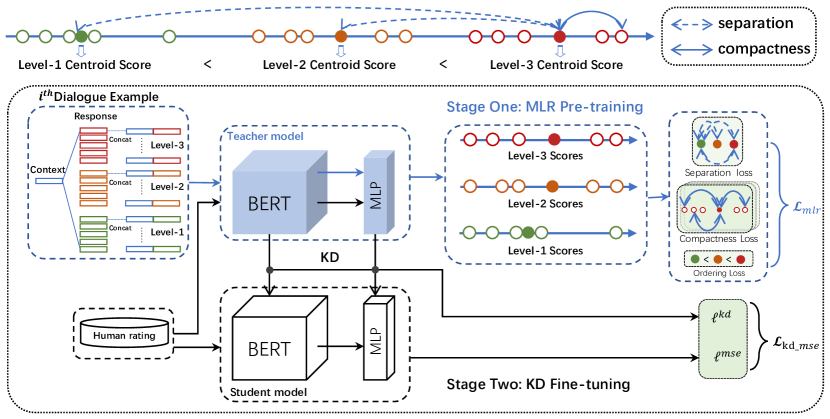
In this section, we present QuantiDCE, a two-stage framework for dialogue coherence metric learning, consisting of Multi-Level Ranking (MLR) pre-training and Knowledge Distillation (KD) fine-tuning. As illustrated in Figure 2, given a metric model (Section 3.1), QuantiDCE enables to learn multi-level representations for context-response pairs with different levels of coherence degrees during the pre-training stage (Section 3.2), and further to learn the rating standards of humans with only a fraction of data during the fine-tuning stage (Section 3.3). After these two training stages, the quantifiable gap between automatic metrics and humans can be obviously reduced.
3.1 Model Architecture
In our QuantiDCE framework, the metric model is composed of: (1) an encoder network for encoding the input context-response pairs into features and (2) a predictor network for transforming the encoded features into coherence scores. Specifically, we adopt BERT (Devlin et al., 2019) as the encoder network and a multi-layer perceptron (MLP) as the predictor network.
Given a context and a response where and are tokens of the context and the response respectively, the and are concatenated as , denoted as . Then the coherence score of the response w.r.t. the context is predicted by:
| (1) |
where is a three-layer fully-connected network in which the activation functions of the three layers are two exponential linear units (Clevert et al., 2016) and a sigmoid function, respectively.
3.2 MLR Pre-Training
For learning the coarse judgement of coherence degrees without the direct supervision of score annotations, the model is first pretrained by minimizing a new multi-level ranking (MLR) loss on a large-scale dialogue dataset. Concretely, the MLR loss is composed of a separation loss, a compactness loss and an ordering loss.
Formally, given a training dataset where is a dialogue context and is a response set with coherence levels222The coherence level is in ascending order, i.e., the response in a higher level is more coherent than the lower one. and responses for each level, the model is trained by minimizing the following MLR loss:
| (2) |
where , , and refer to the separation loss, the compactness loss and the ordering loss of the example, respectively.
The separation loss
aims to separate the features of context-response pairs with different coherence levels by separating the coherence scores of the different pairs333We also tried to directly restrict the features of different-level pairs to be separated, but the performance dropped compared with restricting the scores.. Moreover, to efficiently compute the loss, we first compute the centroids of the context-response pairs belonging to the same coherence level for the dialogue example, i.e., where is the coherence score of the context-response pair (, ), and the separation loss between the centroids is then computed as follows:
| (3) |
where is the L1 distance, is the lower bound for the distance between two centroids, and = is the distance weight used for amplifying the lower bound w.r.t. the coherence-level gap.
The compactness loss
aims to compact the pairs within the same level, which served as a regularization role to avoid the occurrence of outliers for each coherence level. Specifically, the coherence score is forced to be closer to the corresponding centroid as follows:
| (4) |
where is the upper bound for the distance between the centroid of a certain coherence level and the score within this level.
The ordering loss
is finally introduced to assure that the rank order of the predicted scores satisfies the pre-defined order of coherence degrees, i.e., , , . It is critical since the separation loss only restricts the scores of the pairs from different coherence levels to be separated and this restriction is also satisfied when the scores of the highest level are lower than the scores of the lowest level. Similar to the separation loss, the ordering loss is also computed between each two centroids as follows:
| (5) |
3.3 KD Fine-Tuning
The model pretrained by the MLR loss is further trained at the KD fine-tuning stage to directly learn the actual human rating standards with only a fraction of annotated data.
Formally, given a training dataset where , and are the dialogue context, the corresponding response and the human-annotated coherence score of w.r.t. respectively, the previous fine-tuning approach for the scoring task usually optimizes the model with an MSE loss between the predicted score and the human score :
| (6) |
However, by minimizing for each example, the model will be easily over-fitting on the very few annotated data, and thus the model generalizability will be dramatically reduced. To overcome this issue, a novel knowledge distillation (KD) regularization is introduced for retaining the knowledge learned at the MLR pre-training stage. Concretely, the pretrained model is treated as the teacher model that provides the soft targets for the student model which is entirely copied from . And we adopt the distillation objectives of TinyBERT (Jiao et al., 2020), including the distillations of the embedding layer, the Transformer layers and the prediction layer. The KD loss is then formulated as:
| (7) |
where indicates the squared L2 norm, T is the number of the Transformer layers, and are the layer outputs of and respectively, and are the attention matrices of the transformer layer. Note that the layer 0 and the layer T+1 refer to the embedding layer and the prediction layer respectively.
Overall, the loss function for KD fine-tuning, named as KD-MSE loss, is the weighted sum of and across the whole training dataset :
| (8) |
where and are hyperparameters, and we empirically found that = 1 and = 5 performs well.
The overall training procedure is summarized in Algorithm 1.
Input: training datasets and , metric model
Output: student model
4 Experiments
4.1 Experimental Setup
Baseline Metrics.
We compare the metric model trained by our QuantiDCE with eight popular automatic dialogue metrics, including three lexical word-overlap metrics: BLEU (Papineni et al., 2002), ROUGE (Lin, 2004) and METEOR (Banerjee and Lavie, 2005), one semantic word-overlap metric, BERTScore (Zhang et al., 2020), and four learnable metrics: ADEM (Lowe et al., 2017), BERT-RUBER (Ghazarian et al., 2019), BLEURT (Sellam et al., 2020) and GRADE (Huang et al., 2020).
Evaluation.
Our QuantiDCE and the baselines are evaluated by computing the correlations between the model-predicted scores and the human-rated scores. Specifically, we adopt Pearson, Spearman and Kendall as the correlation measures and a large-scale human judgement benchmark (Huang et al., 2020) to provide the human-rated scores. This benchmark contains 1,200 unique (context, response, human-rated score) triplets for metric evaluation where the contexts were randomly selected from the test set of three chit-chat datasets including DailyDialog (Li et al., 2017), ConvAI2 (Dinan et al., 2019) and EmpatheticDialogues (Rashkin et al., 2019), and the responses were produced by both the retrieval-based dialogue models and the generation-based ones to assure response diversity.
Training Datasets.
We use two datasets, DailyDialog++444https://github.com/iitmnlp/Dialogue-Evaluation-with-BERT and DailyDialogEVAL555https://github.com/li3cmz/GRADE, to support the pre-training and fine-tuning of QuantiDCE, respectively. The DailyDialog++ dataset (Sai et al., 2020) contains over 11K conversations, which augments the original DailyDialog dataset with multiple responses of different quality levels including five golden reference responses, five adversarial irrelevant responses and five random selected responses for each context. Therefore, in this work, we set the number of coherence levels = 3 where the pairs containing the random responses, the adversarial responses and the reference responses respectively belong to the levels from 1 to 3. As to the fine-tuning data, we use the DailyDialog human judgement dataset, denoted as DailyDialogEVAL, which is a subset of the adopted evaluation benchmark (Huang et al., 2020), with 300 human rating data in total, and randomly split the data into training (90%) and validation (10%) sets.
Implementation Details.
We use to initialize the encoder network, which is in line with the current SOTA metric, GRADE. For the MLR pre-training, we pretrain our model for 5 epochs with batch size 3 and learning rate 2e-5 where the lower bound for the separation loss = 0.3 and the upper bound for the compactness loss = 0.1. For the KD fine-tuning, we further finetune the pretrained model for 20 epochs with batch size 10 and learning rate 5e-6. For all the training, BERTAdam is used as the optimizer with and . For the Transformer-layer distillation, we distill all the Transformer layers since the model architectures of the teacher and the student are exactly the same.
| Metric | Pearson | Spearman | Kendall | Average |
|---|---|---|---|---|
| ConvAI2 | ||||
| BLEU | 0.003 * | 0.128 | 0.088 | 0.073 |
| ROUGE | 0.136 | 0.140 | 0.097 | 0.124 |
| METEOR | 0.145 | 0.181 | 0.123 | 0.15 |
| BERTScore | 0.225 | 0.225 | 0.154 | 0.201 |
| ADEM | 0.026 * | 0.037 * | 0.049 * | 0.037 |
| BERT-RUBER | 0.266 | 0.266 | 0.185 | 0.239 |
| BLEURT | 0.152 | 0.149 | 0.103 | 0.135 |
| GRADE | 0.496 | 0.503 | 0.356 | 0.452 |
| QuantiDCE | 0.554 | 0.554 | 0.395 | 0.501 |
| EmpatheticDialogues | ||||
| BLEU | -0.051 * | 0.002 * | 0.005 * | -0.015 |
| ROUGE | 0.029 * | -0.013 * | -0.010 * | 0.002 |
| METEOR | 0.118 | 0.055 * | 0.04 * | 0.071 |
| BERTScore | 0.046 * | 0.033 * | 0.021 * | 0.033 |
| ADEM | 0.007 * | 0.009 * | 0.040 * | 0.019 |
| BERT-RUBER | -0.022 * | -0.040 * | -0.029 * | -0.030 |
| BLEURT | 0.203 | 0.192 | 0.13 | 0.175 |
| GRADE | 0.350 | 0.344 | 0.243 | 0.312 |
| QuantiDCE | 0.412 | 0.393 | 0.274 | 0.360 |
| Loss | Pearson | Spearman | Kendall | Average |
|---|---|---|---|---|
| ConvAI2 | ||||
| BCE | 0.505 | 0.505 | 0.361 | 0.457 |
| Ranking | 0.507 | 0.504 | 0.360 | 0.457 |
| SupCon | 0.495 | 0.523 | 0.367 | 0.462 |
| FAT | 0.516 | 0.521 | 0.371 | 0.469 |
| Vanilla MLR | 0.522 | 0.536 | 0.379 | 0.479 |
| MLR (ours) | 0.554 | 0.554 | 0.395 | 0.501 |
| EmpatheticDialogues | ||||
| BCE | 0.354 | 0.353 | 0.243 | 0.317 |
| Ranking | 0.399 | 0.389 | 0.272 | 0.353 |
| SupCon | 0.332 | 0.315 | 0.22 | 0.289 |
| FAT | 0.381 | 0.358 | 0.245 | 0.328 |
| Vanilla MLR | 0.403 | 0.387 | 0.267 | 0.352 |
| MLR (ours) | 0.412 | 0.393 | 0.274 | 0.360 |
4.2 Experimental Results
Metric Performance.
The correlation results of QuantiDCE and the other baseline metrics on the large-scale human judgement benchmark are presented in Table 1, including the ConvAI2 and the EmpatheticDialogues datasets.666The DailyDialogEVAL dataset was not used for evaluation since we used it for fine-tuning. For a fair comparison, the learnable baseline metrics, ADEM, BERT-RUBER and GRADE, are trained on the training dataset we adopted, i.e., DailyDialog++.777BLEURT was not trained on DailyDialog++ since this dataset is not suitable for the BLEURT pre-training strategy. Instead, we trained BLEURT with the fine-tuning data we used. The training details of these baseline metrics are provided in Appendix A. Generally, QuantiDCE achieves an absolute averaged correlation improvement by around 5% points over the current SOTA, GRADE. Besides, all the results of QuantiDCE are statistically significant with p-value <0.01.
Pre-Training Objective.
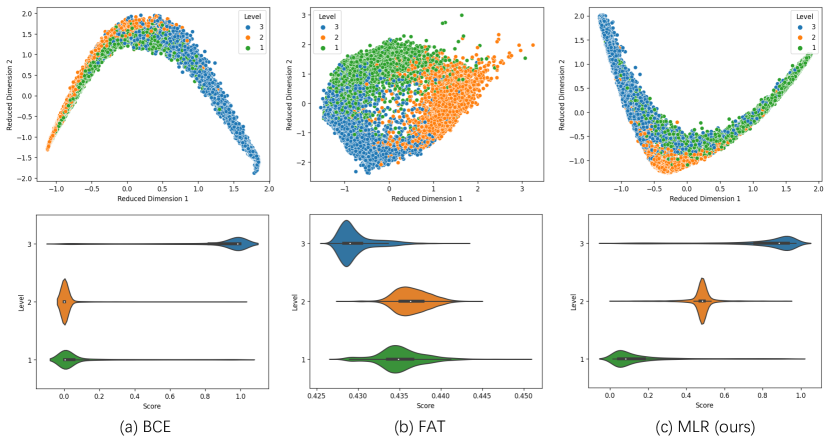
To verify the superiority of our pre-training objective, namely the MLR loss, we investigated the performance of several existing loss functions for pre-training compared with ours. Specifically, two categories of loss functions used for metric training are adopted, including (a) the two-level setting and (b) the multi-level setting. The binary cross entropy (BCE) loss and the margin ranking loss are adopted for the two-level setting, while another three loss functions are adopted for the multi-level setting, including the supervised contrastive (SupCon) loss (Khosla et al., 2020), the fast-approximated triplet (FAT) loss (Yuan et al., 2019) and the vanilla MLR loss (Lin et al., 2020) 888The details of these pre-training loss fucntions are provided in Appendix B.. As shown in Table 2, the performance of our MLR loss is the best among all the pre-training objectives. And we also found that the multi-level setting losses perform better than the two-level ones, especially on the ConvAI2 dataset. Moreover, in order to more intuitively analyze the performances of these pre-training objectives, we also visualize the encoded features and the predicted scores of the model after being pretrained by the above loss functions on the DailyDialog++ dataset without fine-tuning.999The visualization results of the ranking loss, SupCon loss and Vanilla MLR loss are provided in Appendix C. As shown in Figure 3, (a) the BCE loss cannot separate the level-1 scores from the level-2 ones and the corresponding features are also mixed; (b) the FAT loss, on the other hand, separates the features of different levels well, but does not consider the relative gaps where the distances between the level-1 and level-3 features are not larger than those between level-1 and level-2; (c) in contrast, our MLR loss separates both the features and the scores well and also considers the relative gaps between different levels.
| Loss | Pearson | Spearman | Kendall | Average |
|---|---|---|---|---|
| ConvAI2 (best epoch) | ||||
| MSE | 0.272 | 0.369 | 0.255 | 0.299 |
| MSE (fix encoder) | 0.477 | 0.477 | 0.337 | 0.430 |
| KD-MSE (ours) | 0.554 | 0.554 | 0.395 | 0.501 |
| EmpatheticDialogues (best epoch) | ||||
| MSE | 0.278 | 0.276 | 0.187 | 0.247 |
| MSE (fix encoder) | 0.384 | 0.367 | 0.253 | 0.335 |
| KD-MSE (ours) | 0.412 | 0.393 | 0.274 | 0.360 |
| DailyDialogEVAL (last epoch) | ||||
| MSE | 0.934 | 0.945 | 0.867 | 0.915 |
| MSE (fix encoder) | 0.379 | 0.402 | 0.281 | 0.354 |
| KD-MSE (ours) | 0.804 | 0.832 | 0.678 | 0.771 |
Fine-Tuning Objective.
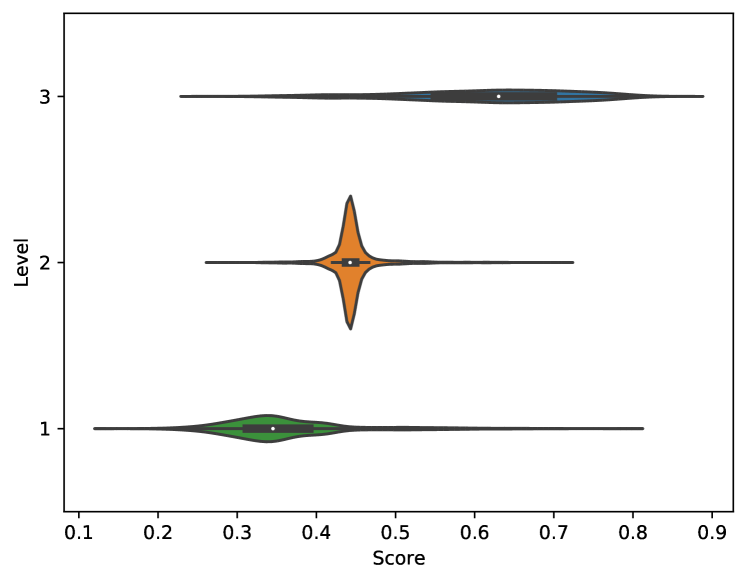
Furthermore, we also verified the effectiveness of our KD-MSE loss during fine-tuning by comparing with other fine-tuning losses, including the pure MSE loss without KD regularization as shown in Equation 6 and the same MSE loss except for freezing the encoder network and only finetuning the predictor network i.e. the MLP, denoted as MSE (fix encoder). As the results shown in Table 3, compared with the other two losses, the model finetuned by our KD-MSE loss has the highest correlation results on both ConvAI2 and EmpatheticDialogues. Moreover, by comparing the results of MSE and KD-MSE, we can find that introducing KD regularization leads to obvious averaged correlation improvements by 20.2% points on ConvAI2 and 11.3% points on EmpatheticDialogues, which verifies the effectiveness of the KD loss. Besides, we also reported the last-epoch correlation results on the training dataset, DailyDialogEVAL. And the results of MSE and MSE (fix encoder) indicate the phenomena of over-fitting and under-fitting into DailyDialogEVAL respectively, which explain the reasons of their low performance on the two evaluation datasets. In contrast, our KD-MSE loss enables the model to learn the actual human rating standards from the scarce annotated data and avoid overfitting it simultaneously. Finally, in Figure 4, we present the visualization of the scores predicted by our QuantiDCE after KD fine-tuning. Compared with the score distributions before fine-tuning in Figure 3(c), the finetuned score distributions of the level-1 and level-3 are wider and partly overlap with the level-2 distribution. It is predictable as the judgements of coherence are always subjective and humans tend to give vague and middle scores instead of extremely high or low scores.
| Metric | Pearson | Spearman | Kendall | Average |
|---|---|---|---|---|
| QuantiDCE | 0.554 | 0.554 | 0.395 | 0.501 |
| w/o MLR pre-training | 0.373 | 0.357 | 0.246 | 0.325 |
| w/o separation loss | 0.388 | 0.416 | 0.289 | 0.364 |
| w/o compactness loss | 0.526 | 0.550 | 0.390 | 0.489 |
| w/o ordering loss | -0.494 | -0.522 | -0.371 | -0.462 |
| w/o KD fine-tuning | 0.531 | 0.540 | 0.381 | 0.484 |
4.3 Ablation Studies
Component Analysis.
To verify the contributions of the core components in our QuantiDCE, we further conducted ablation studies on the ConvAI2 dataset. As shown in Table 4, both the MLR pre-training and KD fine-tuning contribute to the better performance of QuantiDCE. Besides, we also conducted ablations by removing one of the secondary loss during MLR pre-training, including the separation loss, the compactness loss and the ordering loss. The results show that the performance benefits from all these losses in which the separation loss and the ordering loss are crucial for training a metric with strong and positive human correlations.
Number of Data for Fine-Tuning.
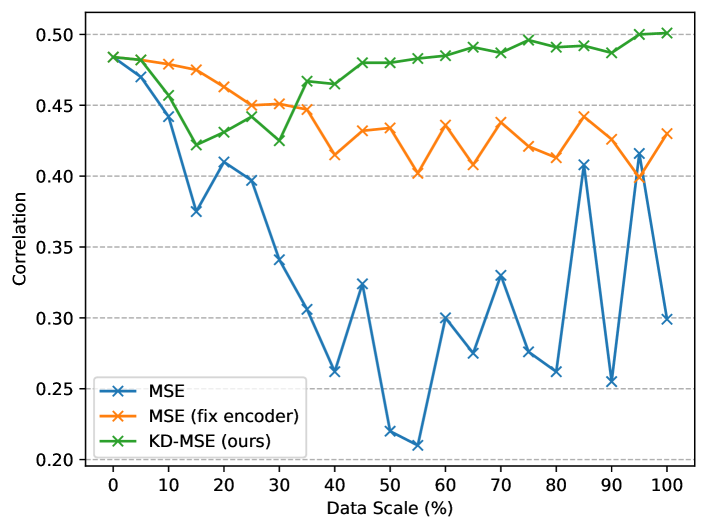
Moreover, we also investigated how the scale of data for fine-tuning effects the model performance by increasing the number of fine-tuning data 5% each time from zero. The trend of the model performance is presented in Figure 5. We observed that minimizing our KD-MSE loss made the correlation results have a gradually increasing trend after an initial decrease.101010The initial decrease probably attributes to the randomness of data sampling where the smaller the sampling ratio is, the higher the probability that noisy samples dominate the sampled data will be. And overfitting into the noisy samples leads to the performance decrease. More specifically, the result achieved the standard before fine-tuning at around the 70% data scale and continued increasing until 100% with a final improvement by around 2% points. For comparison, the performance trends of MSE and MSE (fix encoder) are also provided. And the results present overall decreasing trends of the model performance, which indicates that the model trained by MSE or MSE (fix encoder) cannot benefit from the increasing of data scale, due to the severe over-fitting or under-fitting. Therefore, to effectively utilize the limited data, it is important to enable the update of the entire network and add some constraints to avoid over-fitting, such as our proposed KD regularization.
| U1: I need to book a plane ticket to London. |
| U2: Round-trip or one-way? |
| R: Round trip or one way trip? |
| Coherence Score (Human / QuantiDCE / GRADE) : 2.10 / 2.85 / 4.52 |
| U1: Yum. You will find me in the kitchen and if not i am fishing. |
| U2: Wow that’s pretty cool what else you do for fun? |
| R: Probably fish it is great. |
| Coherence Score (Human / QuantiDCE / GRADE) : 2.50 / 3.94 / 4.27 |
4.4 Case Study
To illustrate the performance of QuantiDCE, two representative examples are shown in Table 5 . The first example shows the strength of QuantiDCE where the coherence score given by ours is closer to the human rating score compared with the extremely high score given by GRADE. However, in the second example, both our QuantiDCE and GRADE deviate from the human score, possibly because the number of coherence levels we adopted in this work ( = 3) is insufficient as humans usually consider more levels of dialogue coherence.
5 Conclusion
In this paper, we propose QuantiDCE, a novel training framework aiming to bridge the gap between the training objective and the actual human rating and train a quantifiable dialogue coherence metric. In general, QuantiDCE includes two training stages, MLR pre-training for learning the coarse human judgements of dialogue coherence degrees, and KD fine-tuning for learning the actual human rating standards. Experimental results show that the metric trained by QuantiDCE presents strong correlations with human judgements. For future work, it is interesting to investigate a more efficient way to obtain multi-level data and extend the multi-level setting into the general evaluation for natural language generation.
Acknowledgments
We thank all anonymous reviewers for their constructive comments. This work was supported in part by National Key R&D Program of China under Grant No. 2020AAA0109700, National Natural Science Foundation of China (NSFC) under Grant No.U19A2073 and No.61976233, Guangdong Province Basic and Applied Basic Research (Regional Joint Fund-Key) Grant No.2019B1515120039, Shenzhen Fundamental Research Program (Project No. RCYX20200714114642083, No. JCYJ20190807154211365), Zhijiang Lab’s Open Fund (No. 2020AA3AB14) and CSIG Young Fellow Support Fund.
References
- Banerjee and Lavie (2005) Satanjeev Banerjee and Alon Lavie. 2005. METEOR: An automatic metric for MT evaluation with improved correlation with human judgments. In Proceedings of the ACL Workshop on Intrinsic and Extrinsic Evaluation Measures for Machine Translation and/or Summarization, pages 65–72, Ann Arbor, Michigan. Association for Computational Linguistics.
- Cervone et al. (2018) Alessandra Cervone, Evgeny Stepanov, and Giuseppe Riccardi. 2018. Coherence models for dialogue. In Proceedings of the 19th Annual Conference of the International Speech Communcation Association, pages 1011–1015.
- Clevert et al. (2016) Djork-Arné Clevert, Thomas Unterthiner, and Sepp Hochreiter. 2016. Fast and accurate deep network learning by exponential linear units (elus). In International Conference on Learning Representations.
- Devlin et al. (2019) Jacob Devlin, Ming-Wei Chang, Kenton Lee, and Kristina Toutanova. 2019. BERT: Pre-training of deep bidirectional transformers for language understanding. In Proceedings of the 2019 Conference of the North American Chapter of the Association for Computational Linguistics: Human Language Technologies, Volume 1 (Long and Short Papers), pages 4171–4186, Minneapolis, Minnesota. Association for Computational Linguistics.
- Dinan et al. (2019) Emily Dinan, Varvara Logacheva, Valentin Malykh, Alexander H. Miller, Kurt Shuster, Jack Urbanek, Douwe Kiela, Arthur Szlam, Iulian Serban, Ryan Lowe, Shrimai Prabhumoye, Alan W. Black, Alexander I. Rudnicky, Jason Williams, Joelle Pineau, Mikhail Burtsev, and Jason Weston. 2019. The second conversational intelligence challenge (convai2). Computing Research Repository, arXiv:1902.00098. Version 1.
- Ghazarian et al. (2019) Sarik Ghazarian, Johnny Wei, Aram Galstyan, and Nanyun Peng. 2019. Better automatic evaluation of open-domain dialogue systems with contextualized embeddings. In Proceedings of the Workshop on Methods for Optimizing and Evaluating Neural Language Generation, pages 82–89, Minneapolis, Minnesota. Association for Computational Linguistics.
- Hinton et al. (2015) Geoffrey Hinton, Oriol Vinyals, and Jeff Dean. 2015. Distilling the knowledge in a neural network. Computing Research Repository, arXiv:1503.02531. Version 1.
- Huang et al. (2020) Lishan Huang, Zheng Ye, Jinghui Qin, Liang Lin, and Xiaodan Liang. 2020. GRADE: Automatic graph-enhanced coherence metric for evaluating open-domain dialogue systems. In Proceedings of the 2020 Conference on Empirical Methods in Natural Language Processing (EMNLP), pages 9230–9240, Online. Association for Computational Linguistics.
- Jiao et al. (2020) Xiaoqi Jiao, Yichun Yin, Lifeng Shang, Xin Jiang, Xiao Chen, Linlin Li, Fang Wang, and Qun Liu. 2020. TinyBERT: Distilling BERT for natural language understanding. In Findings of the Association for Computational Linguistics: EMNLP 2020, pages 4163–4174, Online. Association for Computational Linguistics.
- Khosla et al. (2020) Prannay Khosla, Piotr Teterwak, Chen Wang, Aaron Sarna, Yonglong Tian, Phillip Isola, Aaron Maschinot, Ce Liu, and Dilip Krishnan. 2020. Supervised contrastive learning. In Advances in Neural Information Processing Systems 33: Annual Conference on Neural Information Processing Systems 2020, NeurIPS 2020, December 6-12, 2020, virtual.
- Kim and Rush (2016) Yoon Kim and Alexander M. Rush. 2016. Sequence-level knowledge distillation. In Proceedings of the 2016 Conference on Empirical Methods in Natural Language Processing, pages 1317–1327, Austin, Texas. Association for Computational Linguistics.
- Li et al. (2017) Yanran Li, Hui Su, Xiaoyu Shen, Wenjie Li, Ziqiang Cao, and Shuzi Niu. 2017. DailyDialog: A manually labelled multi-turn dialogue dataset. In Proceedings of the Eighth International Joint Conference on Natural Language Processing (Volume 1: Long Papers), pages 986–995, Taipei, Taiwan. Asian Federation of Natural Language Processing.
- Lin (2004) Chin-Yew Lin. 2004. ROUGE: A package for automatic evaluation of summaries. In Text Summarization Branches Out, pages 74–81, Barcelona, Spain. Association for Computational Linguistics.
- Lin et al. (2020) Zibo Lin, Deng Cai, Yan Wang, Xiaojiang Liu, Haitao Zheng, and Shuming Shi. 2020. The world is not binary: Learning to rank with grayscale data for dialogue response selection. In Proceedings of the 2020 Conference on Empirical Methods in Natural Language Processing (EMNLP), pages 9220–9229, Online. Association for Computational Linguistics.
- Liu et al. (2016) Chia-Wei Liu, Ryan Lowe, Iulian Serban, Mike Noseworthy, Laurent Charlin, and Joelle Pineau. 2016. How NOT to evaluate your dialogue system: An empirical study of unsupervised evaluation metrics for dialogue response generation. In Proceedings of the 2016 Conference on Empirical Methods in Natural Language Processing, pages 2122–2132, Austin, Texas. Association for Computational Linguistics.
- Lowe et al. (2017) Ryan Lowe, Michael Noseworthy, Iulian Vlad Serban, Nicolas Angelard-Gontier, Yoshua Bengio, and Joelle Pineau. 2017. Towards an automatic Turing test: Learning to evaluate dialogue responses. In Proceedings of the 55th Annual Meeting of the Association for Computational Linguistics (Volume 1: Long Papers), pages 1116–1126, Vancouver, Canada. Association for Computational Linguistics.
- Mesgar et al. (2020) Mohsen Mesgar, Sebastian Bücker, and Iryna Gurevych. 2020. Dialogue coherence assessment without explicit dialogue act labels. In Proceedings of the 58th Annual Meeting of the Association for Computational Linguistics, pages 1439–1450, Online. Association for Computational Linguistics.
- Novikova et al. (2017) Jekaterina Novikova, Ondřej Dušek, Amanda Cercas Curry, and Verena Rieser. 2017. Why we need new evaluation metrics for NLG. In Proceedings of the 2017 Conference on Empirical Methods in Natural Language Processing, pages 2241–2252, Copenhagen, Denmark. Association for Computational Linguistics.
- Papineni et al. (2002) Kishore Papineni, Salim Roukos, Todd Ward, and Wei-Jing Zhu. 2002. Bleu: a method for automatic evaluation of machine translation. In Proceedings of the 40th Annual Meeting of the Association for Computational Linguistics, pages 311–318, Philadelphia, Pennsylvania, USA. Association for Computational Linguistics.
- Rashkin et al. (2019) Hannah Rashkin, Eric Michael Smith, Margaret Li, and Y-Lan Boureau. 2019. Towards empathetic open-domain conversation models: A new benchmark and dataset. In Proceedings of the 57th Annual Meeting of the Association for Computational Linguistics, pages 5370–5381, Florence, Italy. Association for Computational Linguistics.
- Sai et al. (2020) Ananya B. Sai, Akash Kumar Mohankumar, Siddhartha Arora, and Mitesh M. Khapra. 2020. Improving dialog evaluation with a multi-reference adversarial dataset and large scale pretraining. Computing Research Repository, arXiv:2009.11321. Version 1.
- Sellam et al. (2020) Thibault Sellam, Dipanjan Das, and Ankur Parikh. 2020. BLEURT: Learning robust metrics for text generation. In Proceedings of the 58th Annual Meeting of the Association for Computational Linguistics, pages 7881–7892, Online. Association for Computational Linguistics.
- Sourty et al. (2020) Raphaël Sourty, Jose G. Moreno, François-Paul Servant, and Lynda Tamine-Lechani. 2020. Knowledge base embedding by cooperative knowledge distillation. In Proceedings of the 28th International Conference on Computational Linguistics, pages 5579–5590, Barcelona, Spain (Online). International Committee on Computational Linguistics.
- Sun et al. (2020) Jingyuan Sun, Shaonan Wang, Jiajun Zhang, and Chengqing Zong. 2020. Distill and replay for continual language learning. In Proceedings of the 28th International Conference on Computational Linguistics, pages 3569–3579, Barcelona, Spain (Online). International Committee on Computational Linguistics.
- Tao et al. (2018) Chongyang Tao, Lili Mou, Dongyan Zhao, and Rui Yan. 2018. Ruber: An unsupervised method for automatic evaluation of open-domain dialog systems. In AAAI.
- Wei et al. (2019) Hao-Ran Wei, Shujian Huang, Ran Wang, Xin-yu Dai, and Jiajun Chen. 2019. Online distilling from checkpoints for neural machine translation. In Proceedings of the 2019 Conference of the North American Chapter of the Association for Computational Linguistics: Human Language Technologies, Volume 1 (Long and Short Papers), pages 1932–1941, Minneapolis, Minnesota. Association for Computational Linguistics.
- Yuan et al. (2019) Ye Yuan, Wuyang Chen, Yang Yang, and Zhangyang Wang. 2019. In defense of the triplet loss again: Learning robust person re-identification with fast approximated triplet loss and label distillation. Computing Research Repository, arXiv:1912.07863. Version 2.
- Zhang et al. (2020) Tianyi Zhang, Varsha Kishore, Felix Wu, Kilian Q. Weinberger, and Yoav Artzi. 2020. Bertscore: Evaluating text generation with bert. In International Conference on Learning Representations.
Appendix A Training Details of the learnable baseline metrics
a) Following Sai et al. (2020), we trained ADEM by first initializing it with the official checkpoint and further finetuning on DailyDialog++ with a target of 5 for level-3 pairs and 1 for level-1 pairs; b) BERT-RUBER and GRADE were both trained on DailyDialog++ where level-3 pairs as positive samples and both level-1 and level-2 pairs as negative samples, except that the former use cross-entropy loss while the latter use ranking loss; c) BLEURT was initialized with the official recommended checkpoint BLEURT-Base and finetuned on DailyDilaogEVAL by following the office guidelines111111https://github.com/google-research/bleurt.
Appendix B Details of the Pre-Training Losses
BCE Loss.
The binary cross entropy (BCE) loss is adopted for the experiments of the two-level setting, where both the adversarial irrelevant responses and random selected responses of the dailydialog++ dataset (Sai et al., 2020) are treated as negative samples and labeled as 0, while the golden reference responses are treated as positive samples and labeled as 1.
Margin Ranking Loss.
Similarly, the margin ranking loss simplifies the evaluation task as a two-level setting and maximizes the differences between the positive coherent dialogues and the negative incoherent ones. As the name suggests, the focus of the margin ranking loss is ranking, which aims at ranking the scores of positive coherent dialogues ahead of the negative incoherent ones.
SupCon Loss.
The supervised contrastive (SupCon) loss (Khosla et al., 2020), which pulls the positive anchors closer and pushes the negatives farther away in representation space, can be adopted for the multi-level setting. Here, for our multi-level setting, we consider the dialogues of level-1, level-2, and level-3 as positive anchors successively, and the remaining two levels as corresponding negatives.
FAT Loss.
The fast-approximated triplet (FAT) loss (Yuan et al., 2019) replaces the traditional point-to-point distances of the triplet loss with point-to-cluster distances, through an upper bound relaxation of the triplet form, which is first applied for the classification task and obviously reduces the computation cost. To use FAT loss in our evaluation task, we consider the different coherence levels as different classes and perform the FAT loss to separate the context-response pairs with different coherence levels.
Vanilla MLR Loss.
The vanilla MLR loss (Lin et al., 2020) is the extension of the margin ranking loss to a multi-level version by repeatedly applying the original margin ranking loss between different levels, which can be directly applied to our evaluation task.
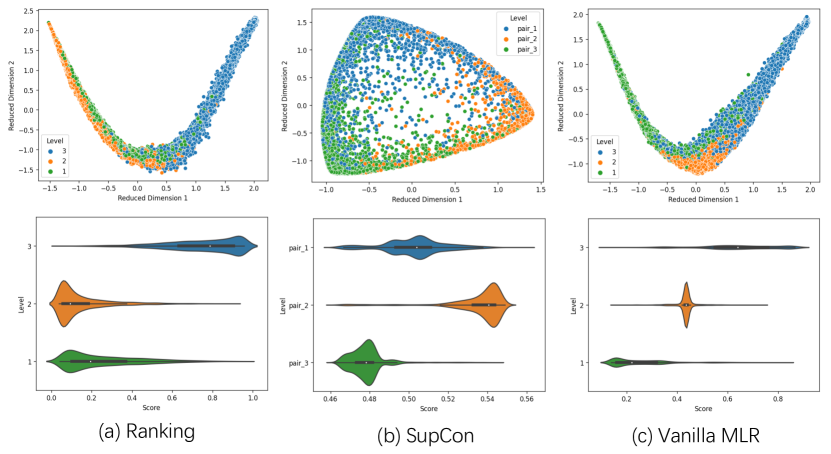
Appendix C Visualizations of the Pre-Training Losses
We have already compared the visualization results of the BCE loss and the FAT loss. For a supplement, here we mainly introduce the visualizations of the margin ranking loss, the SupCon loss and the vanilla MLR loss in detail.
As we can see in Figure 6, (a) the margin ranking loss cannot separate the level-1 scores from the level-2 ones and the corresponding features are also mixed, which is similar to the BCE loss; (b) the SupCon loss, on the other hand, can distinguish the features and scores of the three levels to some extent, and the scores of different levels are also separated but do not follow the real rank order, i.e., level-1 level-2 level-3; (c) the final vanilla MLR loss can separate the context-response pairs with different coherence level in feature space and the predicted scores also follow the actual rank order. However, its score distributions are not compact enough for the level-1 and level-3.