Very Large Array imaging rules out precessing radio jets in three DES–SDSS-selected candidate periodic quasars
Abstract
Periodic quasars have been suggested as candidates for hosting binary supermassive black holes (SMBHs), although alternative scenarios remain possible to explain the optical light curve periodicity. To test the alternative hypothesis of precessing radio jet, we present deep 6 GHz radio imaging conducted with NSF’s Karl G. Jansky Very Large Array (VLA) in its C configuration for the three candidate periodic quasars, DES J024703.24010032.0, DES J024944.66000036.8, and DES J025214.67002813.7. Our targets were selected based on their optical variability using 20-yr long multi-color light curves from the Dark Energy Survey (DES) and the Sloan Digital Sky Survey (SDSS). The new VLA observations show that all three periodic quasars are radio-quiet with the radio loudness parameters measured to be of 1.0–1.5 and the -corrected luminosities [6 GHz] of 5–21 1039 erg s-1. They are in stark contrast to previously known periodic quasars proposed as binary SMBH candidates such as the blazar OJ 287 and PG1302102. Our results rule out optical emission contributed from precessing radio jets as the origin of the optical periodicity in the three DES–SDSS-selected candidate periodic quasars. Future continued optical monitoring and complementary multi-wavelength observations are still needed to further test the binary SMBH hypothesis as well as other competing scenarios to explain the optical periodicity.
keywords:
quasars: supermassive black holes – black hole physics – galaxies: active – galaxies: nuclei – quasars: general – radio continuum: galaxies1 Introduction
Periodic quasars have been suggested as close binary supermassive black holes (SMBHs) – the progenitors of SMBH mergers (e.g., Haiman et al., 2009; Loeb, 2010; Tanaka & Haiman, 2013; Farris et al., 2014; Shi & Krolik, 2015; Kelley et al., 2019; Duffell et al., 2020; Serafinelli et al., 2020; Xin et al., 2020a; Xin & Haiman, 2021), which are of interest as sources of low frequency gravitational waves (e.g., Burke-Spolaor, 2013; Mingarelli et al., 2017; Middleton et al., 2018; Zhu et al., 2019; Nguyen et al., 2020; Sesana, 2021; Taylor, 2021) and possibly for the formation of SMBH seeds at high redshift (e.g., Kroupa et al., 2020). Binary SMBHs are expected to form in galaxy mergers (Begelman et al., 1980; Yu, 2002; Merritt, 2013), given that most massive galaxies harbor SMBHs (Kormendy & Richstone, 1995; Kormendy & Ho, 2013; Heckman & Best, 2014). While periodic quasars have been proposed as close binary SMBH candidates (e.g., Valtonen et al., 2008; Graham et al., 2015a; Charisi et al., 2016; Zheng et al., 2016; Li et al., 2016, 2019; Liu et al., 2019; Chen et al., 2020; Liao et al., 2020), no confirmed case is known at sub-milliparsec scales, i.e., separations close enough to be in the gravitational wave regime.
Significant periodicities were recently discovered in the optical light curves of five quasars (Chen et al., 2020; Liao et al., 2020). The systematic search combined new, highly sensitive light curves from the Dark Energy Survey Supernova (DES-SN) fields (Kessler et al., 2015; Tie et al., 2017) with archival data from the Sloan Digital Sky Survey (SDSS) Stripe 82 (Ivezić et al., 2007). Though periodic quasar candidates are usually linked to binary SMBHs, the true physical mechanism driving the periodicity is still unclear. Doppler beaming effect of a accretion disk (D’Orazio et al., 2015; Charisi et al., 2018) predicts sinusoidal signals with wavelength dependence, whereas circumbinary accretion disk variability seen in the hydrodynamical simulations (e.g., Farris et al., 2014; Duffell et al., 2020) often shows bursty light curves. Jet precession is also proposed to explain some characteristics of the radio-loud periodic quasars such as OJ287, 3C120, PG1553+113 (Katz, 1997; Caproni & Abraham, 2004; Caproni et al., 2017). The accretion disk or/and the jet of a secondary black hole that is inclined to the orbital plane of a binary system will undergo relativistic precession and produce periodic signal due to variation in the viewing angle (Lehto & Valtonen, 1996). Based on the frequency dependence of the variability amplitudes and the shapes of the light curves, it is likely that the periodicities of the five candidates in Chen et al. (2020) are originated from hydrodynamic circumbinary accretion disk variability instead of Doppler beaming.
While a binary SMBH is perhaps the most plausible explanation, there are alternative interpretations for the observed optical periodicity with a single rotating SMBH such as precession of a warped accretion disk or/and a radio jet, or instability in accretion flow (e.g., Stella & Vietri, 1998; Rieger, 2004; Vaughan & Uttley, 2005; Caproni et al., 2007; Ingram et al., 2009; Tchekhovskoy et al., 2011; McKinney et al., 2012; King et al., 2013; Tremaine & Davis, 2014). One popular model is Lense–Thirring precession of a geometrically thick, accretion disk near the central black hole. Due to misalignment of the BH spin axis with the angular momentum of accretion disk, Lense–Thirring effect (Bardeen & Petterson, 1975) predicts precession of a accretion disk as well as a radio jet if it presents. Other possibilities are usually associated with instability or oscillation of acrretion flow often seen in the three-dimensional magnetohydrodynamic simulations (Tchekhovskoy et al., 2011; McKinney et al., 2012)
In this work, we test the leading hypothesis – radio jet precession for three candidate periodic quasars, DES J024703.24010032.0 (hereafter DES J02470100 for short) and DES J024944.66000036.8 (hereafter DES J02490000 for short) discovered by Chen et al. (2020) and DES J025214.67002813.7 (hereafter DES J02520028 for short) discovered by Liao et al. (2020) by conducting new radio observations with NSF’s Karl G. Jansky Very Large Array (VLA).
This paper is organised as follows. In §2, we describe our new VLA observations, archival DES imaging data, SDSS spectra and other supplementary data. In §3, we describe the results of the radio analysis. In §4, we discuss the origin of the radio emission, followed by the comparison with the previous periodic quasars and the implications of the results for the jet precession scenario. Finally, we summarize our results and conclude in §5. A concordance CDM cosmology with , , and km s-1 Mpc-1 is assumed throughout.
| Target Name | Redshift | Obs. date | Config. | Frequency | Bandwidth | Beam Size | P.A. | r.m.s. | |
|---|---|---|---|---|---|---|---|---|---|
| [mag] | [UTC] | [GHz] | [GHz] | [″″] | [deg] | [Jy beam-1] | |||
| DES J024703.24010032.0 | 2.525 | 20.33 | 2020-06-05 | C | 6.0 | 4.0 | 6.03.4 | 38.8 | 3.0 |
| DES J024944.66000036.8 | 1.295 | 21.04 | 2020-05-10 | C | 6.0 | 4.0 | 7.63.9 | 46.7 | 3.0 |
| DES J025214.67002813.7 | 1.530 | 20.60 | 2020-05-05 | C | 6.0 | 4.0 | 5.13.6 | 22.8 | 3.0 |
2 Observations and Data Analysis
2.1 New VLA Radio Continuum Observations
We observed three candidate periodic quasars DES J02470100, DES J02490000, and DES J02520028 with the VLA in its C configuration at the central frequency of 6.0 GHz on May 5, May 10, and June 5 in 2020 under Program ID 20A-457 (PI Liu). 3C 48 was used as the flux and bandpasss calibrator and J02390234 was used as the gain calibrator. The on-source observing time was 53 mins per target. The images were calibrated and reduced through the standard VLA Calibration Pipeline version 5.6.2111https://science.nrao.edu/facilities/vla/data-processing/pipeline/CIPL_56 in the Common Astronomy Software Applications package (CASA, McMullin et al., 2007). With a total bandwidth of 4 GHz and nature weighting, the achieved 1- rms noise level of the cleaned images is 3.0 Jy/beam. Table 1 lists details of the VLA observations.
2.2 Optical Continuum Flux Densities from Archival SDSS Spectra
To calculate the radio loudness, we need to estimate the optical continuum flux densities at the rest-frame 2500 Å that are measured at the same time as those of the radio continuum flux densities. We calculate the optical continuum flux densities of the three targets based on the archival optical spectra from the SDSS corrected for variability using the long-term optical light curve in the optical band that contains the rest-frame 2500 Å.
The three quasars were observed with the BOSS spectrograph by the SDSS-III/BOSS survey (Dawson et al., 2013) or the SDSS-IV/eBOSS survey (Dawson et al., 2016). The BOSS spectra cover observed 3650–10400 Å with a spectral resolution of 1850–2200. We fit the SDSS spectra following the procedures described in Shen & Liu (2012) using the code PyQSOFit (Guo et al., 2018; Shen et al., 2019). The spectral model consists of a power-law continuum, a pseudo-continuum constructed from the Fe II emission templates, and single or multiple Gaussian components for the narrow and broad emission lines.
2.3 Archival Optical Imaging and New Optical Light Curves
Our targets have publicly available optical images from the Dark Energy Survey (DES; Flaugher, 2005; Dark Energy Survey Collaboration et al., 2016; Diehl et al., 2019). DES is a 6-yr optical imaging survey of the southern sky in five filters (). DES has a median seeing of 1″ and a nominal single-epoch depth down to 23.34 (Morganson et al., 2018). The optical light curves of our targets include photometric measurements from various optical surveys including DES, SDSS (Adelman-McCarthy et al., 2007; Ivezić et al., 2007), the Catalina Real Time Transient Survey (CRTS; Drake et al., 2009), the Palomar Transient Factory (PTF; Rau et al., 2009), the Panoramic Survey Telescope and Rapid Response System (Chambers et al., 2016; Flewelling et al., 2016), and the Zwicky Transient Facility (Masci et al., 2019). To correct for the variability effect in the radio loudness calculation, we fit a sinusoidal model to the optical light curves to estimate the optical continuum flux densities at the same time as those of the radio observations.
3 Results
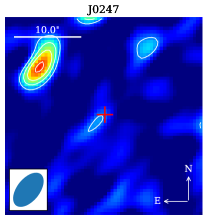
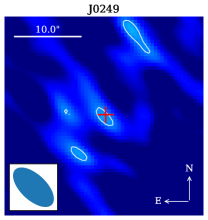
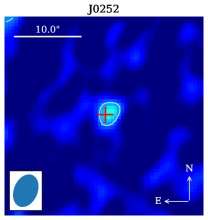
The contour levels are 3, 5, 7, 10, 15, and 20, where the 1 rms noise level is 3.0 Jy/beam. The image field of view for each target is 30″30″. The red cross marks the peak flux position of the optical counterpart shown in Figure 2. The synthesized beam is shown in the bottom left corner.
3.1 VLA Radio Images and Comparison to DES Optical Images
Figure 1 shows the 6 GHz VLA continuum images of the three DES–SDSS-selected candidate periodic quasars using nature weighting. DES J02520028 shows a 5 detection, whereas DES J02470100 and DES J02490000 are not clearly detected, whose 3 detections are likely the structured noises from the clean processes. There are no (3) extended radio jet structures associated with the central cores. We fit the data with a 2-dimensional Gaussian function to obtain the integrated flux density for DES J02470100 and use 3 upper limits for DES J02470100 and DES J02490000. The integrated 6 GHz radio flux densities are 9, 9 and 133 Jy for DES J02470100, DES J02490000 and DES J02520028, respectively (Table 2).
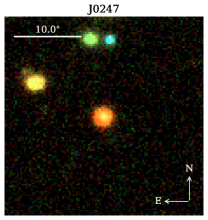
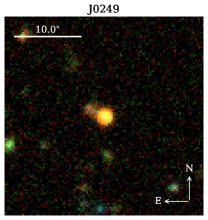
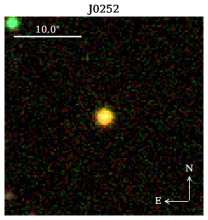
For comparison, Figure 2 shows the DES color composite images of the three targets. The optical morphology are consistent with the Point Spread Function (PSF) except for a faint extended emission 2″ N-E of the central source in DES J02490000, although no extended radio emission is detected at the same position.
3.2 Radio Luminosities and Radio Loudness Parameters
The -corrected intrinsic radio luminosity at rest-frame 6 GHz can be estimated by
| (1) |
where 6 GHz, is the luminosity distance, is the redshift, is the spectral index, and is the observed flux density . Assuming a radio spectral index of (Kimball & Ivezić, 2008), the radio luminosities at rest-frame 6 GHz are estimated as , and erg s-1 for DES J02470100, DES J02490000 and DES J02520028, respectively.
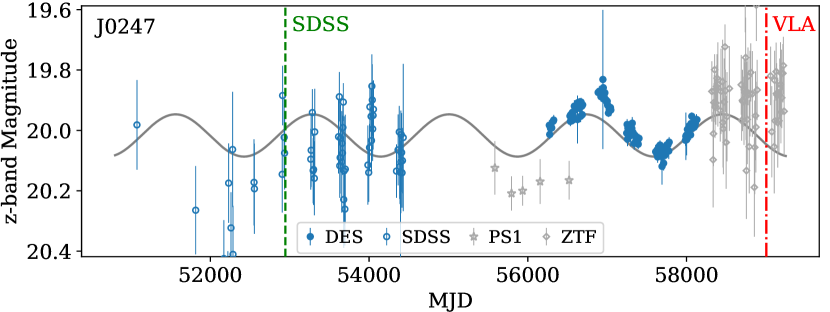
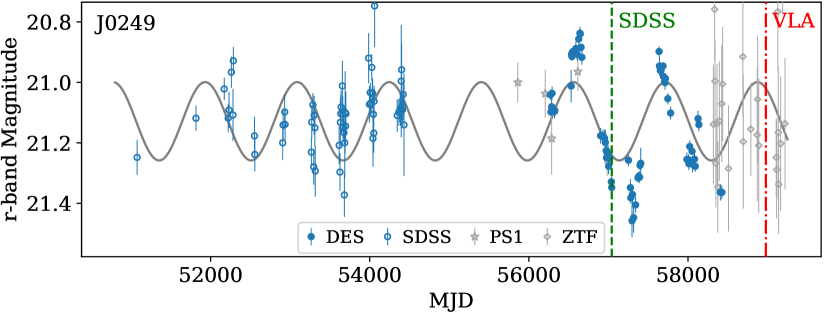
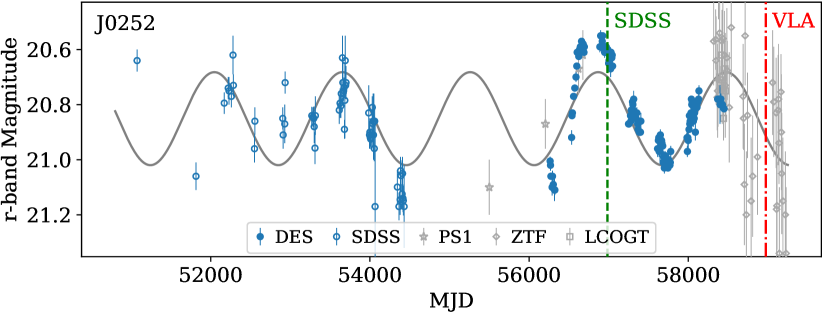
By comparing the radio continuum flux density with the optical continuum flux density at rest-frame 2500 Å derived from the SDSS spectra, we estimate the radio loudness parameter (Kellermann et al., 1989) , where is the rest-frame flux densities at 6 cm and is the rest-frame flux densities at 2500Å. are calculated from the VLA images assuming the radio flux follows a power law . To quantify systematic uncertainties, we adopt two different radio spectral indices (Jiang et al., 2007) or (Kimball & Ivezić, 2008). are calculated based on the archival optical SDSS spectra. Since the VLA observation and the SDSS spectra were taken at different time, we calculated the optical flux variations between the VLA and the SDSS observations using the best-fit sinusoidal models of the optical light curves shown in Figure 3 (Chen et al., 2020) . has been corrected for the variability effect using the flux variation. The estimated radio loudnesses are 1.0, 1.5, and 1.2 assuming for DES J02470100, DES J02490000 and DES J02520028, respectively. Table 2 lists the intrinsic radio luminosities and the inferred radio loudness parameters for the three periodic quasars.
3.3 Multi-Wavelength Spectral Energy Distributions
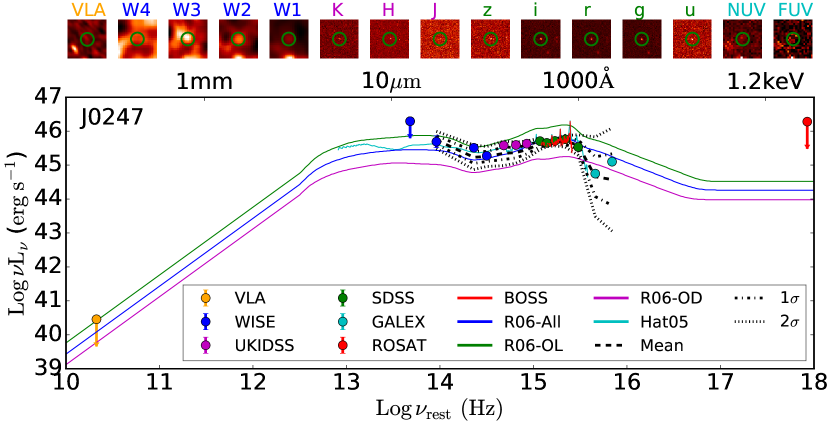
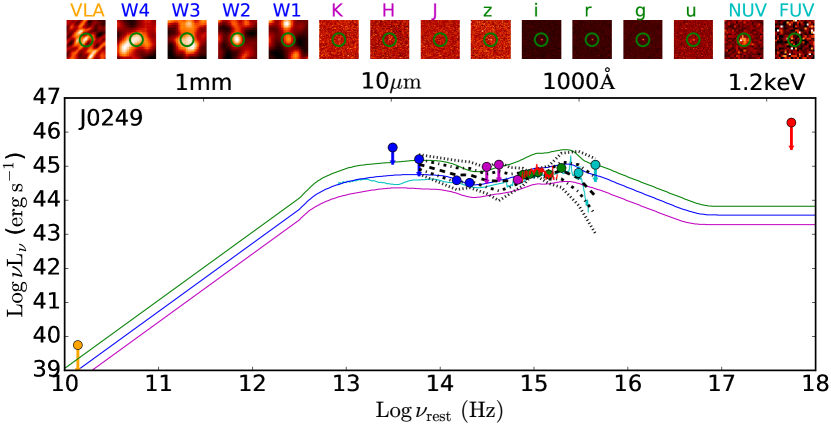
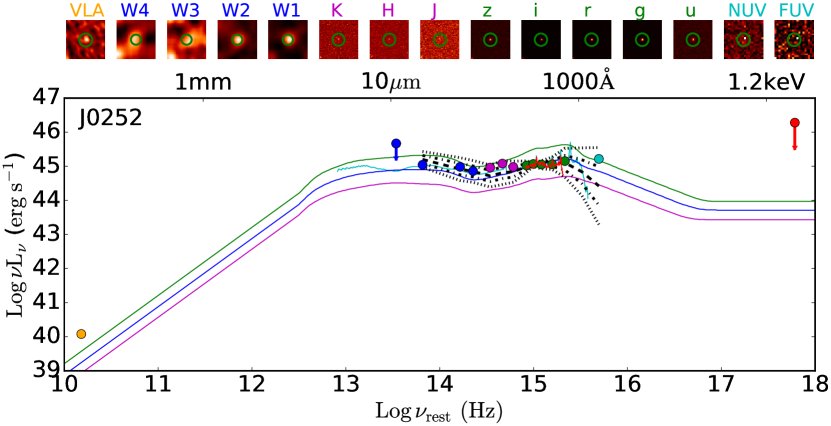
Figure 4 shows the spectral energy distributions (SEDs) of the three DES–SDSS-selected candidate periodic quasars. The SED data include our new 6 GHz radio continuum measurements from the VLA and archival mid-infrared photometry from the Wide-field Infrared Survey Explorer (WISE, Wright et al., 2010), near-infrared photometry from the UKIRT Infrared Deep Sky Survey (UKIDSS, Lawrence et al., 2007), optical photometry and spectra from the SDSS (York et al., 2000), UV photometry from the Galaxy Evolution Explorer (GALEX, Martin et al., 2005), and X-ray 3 upper limits from the ROentgen SATellite (ROSAT, Voges et al., 2000). We compared the SEDs of the three DES–SDSS-selected candidate periodic quasars with the mean SEDs of the control sample matched in redshift and absolute magnitude as well as the mean SEDs of the whole sample in Hatziminaoglou et al. (2005) and Richards et al. (2006). The SEDs of the three DES–SDSS-selected candidate periodic quasars are consistent (within 3-) with the comparison SEDs.
| Abbreviated Name | ||||
|---|---|---|---|---|
| [Jy] | [1039 erg s-1] | |||
| DES J02470100 | <9 | <21.4 | <0.6 | <1.0 |
| DES J02490000 | <9 | <4.5 | <1.1 | <1.5 |
| DES J02520028 | 133 | 9.72.2 | 0.80.2 | 1.20.3 |
4 Discussions
4.1 Origins of the Radio Emission
The radio emission of quasars could be due to different physical mechanisms such as collimated jets, uncollimated winds, star formation activity from host galaxies, free-free emissions from photoionized gas, and/or accretion disk coronal activity (Panessa et al., 2019). The inferred radio luminosities of 1040 erg s-1 the and radio loudness parameters of order unity place the three DES–SDSS-selected candidate periodic quasars in the radio-quiet regime (Kellermann et al., 1989).
Zakamska & Greene (2014) analyzed 568 obscured luminous quasars with median radio luminosity [1.4 GHz] of erg s-1 and concluded that the radio emissions in radio-quiet quasars are due to uncollimated outflows. The 6 GHz study in a volume-limited sample of 178 low-redshift (0.20.3) quasars by Kellermann et al. (2016) suggests that the radio emission in 80% of radio-quiet quasars is powered by star formation in their host galaxies. According to the luminosity function shown in Figure 9 in Kellermann et al. (2016), the radio luminosities of the DES–SDSS-selected candidate periodic quasars are likely powered by star formation or a mixture of uncollimated quasar outflows and star formation. More recently, Nyland et al. (2020) discovered compact young jets in quasars that had recently brightened in the radio. These authors suggest that young and short-lived jets which do not grow to large scales might be common at high redshift. However, the radio fluxes of these young-jet-powering quasars are ten to a hundred times higher than those of our targets.
In summary, the relatively weak radio luminosities of the DES–SDSS-selected candidate periodic quasars are unlikely from collimated radio jets. Even if any weak, small-scale jets exist, which would have been unresolved in the VLA images given the few arcsecond resolution, the large-amplitude (20%) variability detected in the optical light curves could not be explained by pure optical contribution from precessing radio jets based on the relative weaknesses of the radio luminosities.
4.2 Comparison to Previous Candidate Periodic Quasars
OJ287 and PG 1302102 are two prototypical candidate periodic quasars that have been proposed as candidates for binary SMBHs (Lehto & Valtonen, 1996; Valtonen et al., 2008; Graham et al., 2015b). OJ287 is a low-redshift () blazar (Stickel et al., 1989) showing candidate double-peaks in its optical light curves every 12 years (Sillanpaa et al., 1988; Lehto & Valtonen, 1996, but see Goyal et al. 2018 for evidence against any significant periodicity). The periodic peaks since 1891 have been interpreted as arising from the binary motions at similar timescale. OJ287 was detected by the Swift satellite in the X-rays (D’Elia et al., 2013) and by the Fermi Large Area Telescope in the -rays (Abdollahi et al., 2020). PG1302102 is also a low-redshift () blazar (Massaro et al., 2015). It was detected by the Swift satellite in the X-rays (Baumgartner et al., 2013). PG 1302102 shows a 5.2-yr periodic signal with 1.5 cycles covered by the Catalina Real-Time survey (Graham et al., 2015b, see also Liu et al. 2018; Zhu & Thrane 2020). Doppler boosting has been proposed to explain the optical light curve periodicity (D’Orazio et al., 2015; Xin et al., 2020b; Song et al., 2021).
Unlike our targets of DES–SDSS-selected candidate periodic quasars, OJ287 and PG 1302102 have strong radio emission with flux densities on the order of hundreds of mJy. They share a similar core-jet structure as seen in both the optical and radio observations (Hutchings et al., 1994; Benitez et al., 1996). In contrast, the three DES–SDSS-selected candidate periodic quasars only show weak radio cores with flux densities of tens Jy and no associated jet components. The comparison between the radio and the optical images suggests that their morphologies are consistent with unresolved point sources. There is a faint emission 2″ N-E of DES J02490000, although no radio emission is seen at the same position, indicating that it might be a neighboring galaxy, or from the superposition of a foreground star or galaxy.
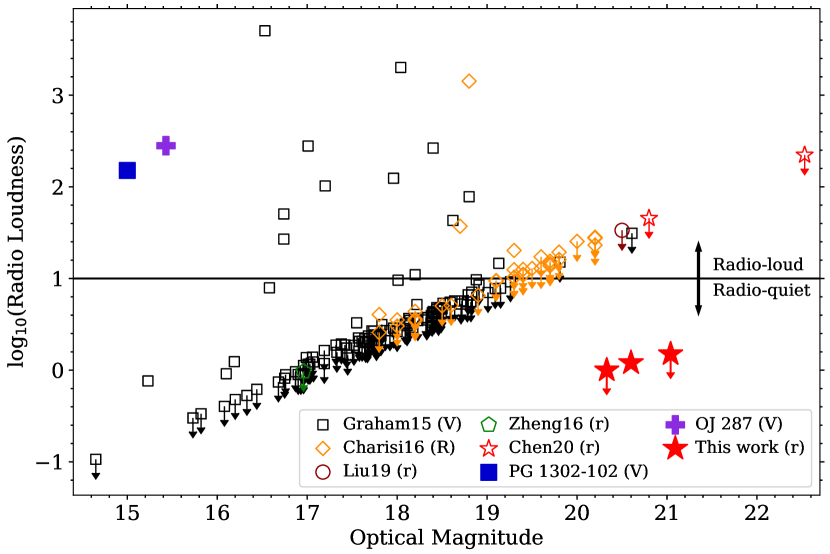
Figure 5 compares the radio loudnesses of the DES–SDSS-selected candidate periodic quasar with those of other candidate periodic quasars from the literature (Graham et al., 2015a; Charisi et al., 2016; Liu et al., 2019; Zheng et al., 2016; Chen et al., 2020) including PG1302102 and OJ287. For the comparison quasars, we follow the similar procedures of calculating the radio loudness as those described in subsection 3.2. The optical flux densities are estimated from broad-band photometry and are scaled using the frequency power-law index, of (Vanden Berk et al., 2001). The radio flux densities are estimated from the VLA sky survey (VLASS, Lacy et al., 2020) and the Faint Images of the Radio Sky at Twenty-cm (FIRST, Becker et al., 1995). The radio loudness of the three DES–SDSS-selected candidate periodic quasars are hundreds times smaller than those of PG1302-102 and OJ287. For the other candidate periodic quasars in the literature, which are mostly from the CRTS and the PTF, 80% of them are undetected in FIRST and/or VLASS due to the limited sensitivity, which makes the comparison incomplete especially for faint objects. Nevertheless, we can still put a lower limit of 10% for the other candidate periodic quasars from the literature which are radio-loud (10).
Guo et al. (2020) has carried out a multi-wavelength SED study for the previous candidate periodic quasars from the CRTS and the PTF. These authors find a tentatively higher fraction of radio-loud quasars compared to the control sample of ordinary quasars matched in redshift and luminosity. This has been interpreted as possible contamination from processing radio jets, although the sample is subject to false positives due to the limited cycles of periodicities being observed (Vaughan et al., 2016). The higher fraction of radio-loud quasars could be due to a selection bias given that blazars exhibit much larger variability amplitudes. Due to the faintness of the DES–SDSS-selected candidate periodic quasars, the control sample of ordinary quasars matched in redshift and luminosity are mostly undetected in the current archival radio surveys including VLASS and FIRST. It is unsurprising that the control sample of ordinary quasars are undetected in the wide-field radio surveys since 80% of the quasars are radio-quiet (Kellermann et al., 2016).
4.3 Implications for the Radio Jet Precession Scenario
Jet precession is one of the popular scenarios invoked to explain the radio periodicity observed in some radio-loud quasars (Bach et al., 2006; Britzen et al., 2010; Kudryavtseva et al., 2011; Kulkarni & Loeb, 2016). With a powerful radio jet, the synchrotron emission could contribute significantly to the UV/optical emission (Crane et al., 1993; Sparks et al., 1995; Scarpa et al., 1999). For blazars with observed optical periodicities, while a binary SMBH is a plausible explanation (Lehto & Valtonen, 1996; Villata et al., 1998; Valtaoja et al., 2000; Caproni et al., 2017; Sobacchi et al., 2017), the scenario of a precessing radio jet powered by a single SMBH remains possible (Rieger, 2004; Britzen et al., 2018; Butuzova & Pushkarev, 2020). The precession of a helical jet with a small angle between the helix axis and the line of sight could explain the periodic bursty light curves.
The jet precession scenario either from a binary SMBH or a single SMBH, however, is highly unlikely for the three DES–SDSS-selected candidate periodic quasars studied here. The radio-quiet properties suggest that the optical periodicity is not being significantly contaminated with radio jets. The optical spectra with typical quasar-like power-law continuum and strong emission lines (Chen et al., 2020) also distinguish them from the featureless systems such as BL Lacs, whose emission is dominated by jets. Therefore, we anticipate that the optical periodicity is associated with the accretion disk. Different physical origins of the optical periodicity for the DES–SDSS-selected periodic quasars including Doppler boosting, hydrodynamic variability in circumbinary disk, or a warped accretion disk have been discussed in Chen et al. (2020). It has been shown that Doppler boosting and a warped accretion disk are difficult to explain the characteristics of the optical light curves (multi-wavelength dependence, processing and damping timescale, and variability amplitude; see Chen et al., 2020). Liao et al. (2020) found that DES J02520028 is best explained by a bursty model predicted by hydrodynamic simulations of circumbinary accretion disks. There are other scenarios like shorter time variability attributed to nutation on top of a longer precession period or quasi-periodic behavior due to instability in accretion flow, but detailed light curve modeling to test them is beyond the scope of this work.
The DES–SDSS-selected candidate periodic quasars are at higher redshift () than those from previous samples of candidate periodic quasars and might represent a new radio-quiet population different from those low-redshift periodic blazars whose emissions are dominated by synchrotron radiation. This higher-redshift, radio-quiet population is powered by less massive SMBHs (Chen et al., 2020) whose mergers are more relevant for future space-born gravitational wave experiments such as the Laser Interferometer Space Antenna (e.g., Holley-Bockelmann et al., 2020; Volonteri et al., 2020) and TianQin (e.g., Wang et al., 2019). Future sensitive synoptic surveys such as LSST (Ivezić et al., 2019) will be able to detect more periodic quasar candidates similar to the DES–SDSS-selected candidate periodic quasars (Xin & Haiman, 2021). Together with deep multi-wavelength follow-ups on those periodic quasars, we will be able to characterize the population in detail and systematically test different hypotheses to explain their optical periodicities.
5 Conclusions
We have presented deep 6.0 GHz VLA images for the three DES–SDSS-selected candidate periodic quasars discovered by Chen et al. (2020). We have measured their radio loudness parameters and analyzed their radio properties as compared against those of other candidate periodic quasars from the literature. We summarize our main findings and as follows:
-
1.
The -corrected intrinsic radio luminosities at rest-frame 6 GHz are , and erg s-1 and the radio loudnesses are 1.0, 1.5 and 1.2 for DES J02470100, DES J02490000 and DES J02520028, respectively.
-
2.
The radio luminosity of erg s-1 and the radio loudness of order unity place the three candidate periodic quasars in the radio-quiet regime, where significant contamination in the optical emission from radio jets is highly unlikely. The origin of the radio emission is likely from star formation and/or uncollimated quasar winds. Together with the core-only morphology in the radio images, our results rule out the radio jet procession as the origin of the observed optical periodicity. The optical periodicity is likely associated with the variability in accretion disk.
-
3.
Unlike the previously known periodic blazars such as OJ 287 and PG 1302102, the DES–SDSS-selected candidate periodic quasars at show radio-quiet properties, suggesting that they might represent a different population from those found in low-redshift radio-loud quasars.
The VLA observations of the three DES–SDSS-selected candidate periodic quasars serve as a pilot study of radio properties for periodic quasars. Future Legacy Survey of Space and Time (LSST; Ivezić et al., 2019) of the Vera C. Rubin Observatory will discover hundreds of candidates similar to the DES–SDSS-selected candidate periodic quasars. Deep multi-wavelength observations will be needed to characterize them in detail and systematically evaluate the competing hypotheses for the optical periodicity before they can be established as binary SMBHs.
Acknowledgements
We thank the anonymous referee for the constructive comments and suggestions. We thank Amy Mioduszewski, Anthony Perreault and Heidi Medlin for help with our VLA observations. Y.-C.C. and X.L. acknowledge a Center for Advanced Study Beckman fellowship and support from the University of Illinois campus research board. Y.-C.C. is supported by the Illinois Graduate Survey Science Fellowship and the government scholarship to study aboard from the ministry of education of Taiwan. H.G. acknowledges support from National Science Foundation grant AST-1907290
The National Radio Astronomy Observatory is a facility of the National Science Foundation operated under cooperative agreement by Associated Universities, Inc.
This project used public archival data from the Dark Energy Survey (DES). Funding for the DES Projects has been provided by the U.S. Department of Energy, the U.S. National Science Foundation, the Ministry of Science and Education of Spain, the Science and Technology FacilitiesCouncil of the United Kingdom, the Higher Education Funding Council for England, the National Center for Supercomputing Applications at the University of Illinois at Urbana-Champaign, the Kavli Institute of Cosmological Physics at the University of Chicago, the Center for Cosmology and Astro-Particle Physics at the Ohio State University, the Mitchell Institute for Fundamental Physics and Astronomy at Texas A&M University, Financiadora de Estudos e Projetos, Fundação Carlos Chagas Filho de Amparo à Pesquisa do Estado do Rio de Janeiro, Conselho Nacional de Desenvolvimento Científico e Tecnológico and the Ministério da Ciência, Tecnologia e Inovação, the Deutsche Forschungsgemeinschaft, and the Collaborating Institutions in the Dark Energy Survey. The Collaborating Institutions are Argonne National Laboratory, the University of California at Santa Cruz, the University of Cambridge, Centro de Investigaciones Energéticas, Medioambientales y Tecnológicas-Madrid, the University of Chicago, University College London, the DES-Brazil Consortium, the University of Edinburgh, the Eidgenössische Technische Hochschule (ETH) Zürich, Fermi National Accelerator Laboratory, the University of Illinois at Urbana-Champaign, the Institut de Ciències de l’Espai (IEEC/CSIC), the Institut de Física d’Altes Energies, Lawrence Berkeley National Laboratory, the Ludwig-Maximilians Universität München and the associated Excellence Cluster Universe, the University of Michigan, the National Optical Astronomy Observatory, the University of Nottingham, The Ohio State University, the OzDES Membership Consortium, the University of Pennsylvania, the University of Portsmouth, SLAC National Accelerator Laboratory, Stanford University, the University of Sussex, and Texas A&M University. Based in part on observations at Cerro Tololo Inter-American Observatory, National Optical Astronomy Observatory, which is operated by the Association of Universities for Research in Astronomy (AURA) under a cooperative agreement with the National Science Foundation.
Funding for the Sloan Digital Sky Survey IV has been provided by the Alfred P. Sloan Foundation, the U.S. Department of Energy Office of Science, and the Participating Institutions.
SDSS-IV acknowledges support and resources from the Center for High Performance Computing at the University of Utah. The SDSS website is www.sdss.org.
SDSS-IV is managed by the Astrophysical Research Consortium for the Participating Institutions of the SDSS Collaboration including the Brazilian Participation Group, the Carnegie Institution for Science, Carnegie Mellon University, Center for Astrophysics | Harvard & Smithsonian, the Chilean Participation Group, the French Participation Group, Instituto de Astrofísica de Canarias, The Johns Hopkins University, Kavli Institute for the Physics and Mathematics of the Universe (IPMU) / University of Tokyo, the Korean Participation Group, Lawrence Berkeley National Laboratory, Leibniz Institut für Astrophysik Potsdam (AIP), Max-Planck-Institut für Astronomie (MPIA Heidelberg), Max-Planck-Institut für Astrophysik (MPA Garching), Max-Planck-Institut für Extraterrestrische Physik (MPE), National Astronomical Observatories of China, New Mexico State University, New York University, University of Notre Dame, Observatário Nacional / MCTI, The Ohio State University, Pennsylvania State University, Shanghai Astronomical Observatory, United Kingdom Participation Group, Universidad Nacional Autónoma de México, University of Arizona, University of Colorado Boulder, University of Oxford, University of Portsmouth, University of Utah, University of Virginia, University of Washington, University of Wisconsin, Vanderbilt University, and Yale University.
Based on observations obtained with the Samuel Oschin 48-inch Telescope at the Palomar Observatory as part of the Zwicky Transient Facility project. ZTF is supported by the National Science Foundation under Grant No. AST-1440341 and a collaboration including Caltech, IPAC, the Weizmann Institute for Science, the Oskar Klein Center at Stockholm University, the University of Maryland, the University of Washington, Deutsches Elektronen-Synchrotron and Humboldt University, Los Alamos National Laboratories, the TANGO Consortium of Taiwan, the University of Wisconsin at Milwaukee, and Lawrence Berkeley National Laboratories. Operations are conducted by COO, IPAC, and UW.
Facilities: VLA, DES, Sloan
Data Availability
The VLA data will be available in the VLA data archive at https://science.nrao.edu/facilities/vla/archive/index after the proprietary period. The DES data are available at https://des.ncsa.illinois.edu. The SDSS spectra are available in SDSS Data Release 16 at https://www.sdss.org/dr16.
References
- Abdollahi et al. (2020) Abdollahi S., et al., 2020, ApJS, 247, 33
- Adelman-McCarthy et al. (2007) Adelman-McCarthy J. K., et al., 2007, ApJS, 172, 634
- Astropy Collaboration et al. (2013) Astropy Collaboration et al., 2013, A&A, 558, A33
- Astropy Collaboration et al. (2018) Astropy Collaboration et al., 2018, AJ, 156, 123
- Bach et al. (2006) Bach U., et al., 2006, A&A, 456, 105
- Bardeen & Petterson (1975) Bardeen J. M., Petterson J. A., 1975, ApJ, 195, L65
- Baumgartner et al. (2013) Baumgartner W. H., Tueller J., Markwardt C. B., Skinner G. K., Barthelmy S., Mushotzky R. F., Evans P. A., Gehrels N., 2013, ApJS, 207, 19
- Becker et al. (1995) Becker R. H., White R. L., Helfand D. J., 1995, ApJ, 450, 559
- Begelman et al. (1980) Begelman M. C., Blandford R. D., Rees M. J., 1980, Nature, 287, 307
- Benitez et al. (1996) Benitez E., Dultzin-Hacyan D., Heidt J., Sillanpaeae A., Nilsson K., Pursimo T., Teerikorpi P., Takalo L. O., 1996, ApJ, 464, L47
- Britzen et al. (2010) Britzen S., et al., 2010, A&A, 511, A57
- Britzen et al. (2018) Britzen S., et al., 2018, MNRAS, 478, 3199
- Burke-Spolaor (2013) Burke-Spolaor S., 2013, Classical and Quantum Gravity, 30, 224013
- Butuzova & Pushkarev (2020) Butuzova M. S., Pushkarev A. B., 2020, Universe, 6, 191
- Caproni & Abraham (2004) Caproni A., Abraham Z., 2004, MNRAS, 349, 1218
- Caproni et al. (2007) Caproni A., Abraham Z., Livio M., Mosquera Cuesta H. J., 2007, MNRAS, 379, 135
- Caproni et al. (2017) Caproni A., Abraham Z., Motter J. C., Monteiro H., 2017, ApJ, 851, L39
- Chambers et al. (2016) Chambers K. C., et al., 2016, ArXiv e-prints 1612.05560,
- Charisi et al. (2016) Charisi M., Bartos I., Haiman Z., Price-Whelan A. M., Graham M. J., Bellm E. C., Laher R. R., Márka S., 2016, MNRAS, 463, 2145
- Charisi et al. (2018) Charisi M., Haiman Z., Schiminovich D., D’Orazio D. J., 2018, MNRAS, 476, 4617
- Chen et al. (2020) Chen Y.-C., et al., 2020, MNRAS, 499, 2245
- Crane et al. (1993) Crane P., et al., 1993, ApJ, 402, L37
- D’Elia et al. (2013) D’Elia V., et al., 2013, A&A, 551, A142
- D’Orazio et al. (2015) D’Orazio D. J., Haiman Z., Schiminovich D., 2015, Nature, 525, 351
- Dark Energy Survey Collaboration et al. (2016) Dark Energy Survey Collaboration et al., 2016, MNRAS, 460, 1270
- Dawson et al. (2013) Dawson K. S., et al., 2013, AJ, 145, 10
- Dawson et al. (2016) Dawson K. S., et al., 2016, AJ, 151, 44
- Diehl et al. (2019) Diehl H., et al., 2019, Technical Report FERMILAB-TM-2720-AE, The Dark Energy Survey and Operations: Year 6 – The Finale, doi:10.2172/1596042.
- Drake et al. (2009) Drake A. J., et al., 2009, ApJ, 696, 870
- Duffell et al. (2020) Duffell P. C., D’Orazio D., Derdzinski A., Haiman Z., MacFadyen A., Rosen A. L., Zrake J., 2020, ApJ, 901, 25
- Farris et al. (2014) Farris B. D., Duffell P., MacFadyen A. I., Haiman Z., 2014, ApJ, 783, 134
- Flaugher (2005) Flaugher B., 2005, International Journal of Modern Physics A, 20, 3121
- Flewelling et al. (2016) Flewelling H. A., et al., 2016, ArXiv e-prints 1612.05243,
- Goyal et al. (2018) Goyal A., et al., 2018, ApJ, 863, 175
- Graham et al. (2015a) Graham M. J., et al., 2015a, MNRAS, 453, 1562
- Graham et al. (2015b) Graham M. J., et al., 2015b, Nature, 518, 74
- Guo et al. (2018) Guo H., Shen Y., Wang S., 2018, PyQSOFit: Python code to fit the spectrum of quasars, Astrophysics Source Code Library (ascl:1809.008)
- Guo et al. (2020) Guo H., Liu X., Zafar T., Liao W.-T., 2020, MNRAS, 492, 2910
- Haiman et al. (2009) Haiman Z., Kocsis B., Menou K., 2009, ApJ, 700, 1952
- Hatziminaoglou et al. (2005) Hatziminaoglou E., et al., 2005, AJ, 129, 1198
- Heckman & Best (2014) Heckman T. M., Best P. N., 2014, Annu. Rev. Astro. Astrophys., 52, 589
- Holley-Bockelmann et al. (2020) Holley-Bockelmann K., et al., 2020, arXiv e-prints, p. arXiv:2012.02650
- Hutchings et al. (1994) Hutchings J. B., Morris S. C., Gower A. C., Lister M. L., 1994, PASP, 106, 642
- Ingram et al. (2009) Ingram A., Done C., Fragile P. C., 2009, MNRAS, 397, L101
- Ivezić et al. (2007) Ivezić Ž., et al., 2007, AJ, 134, 973
- Ivezić et al. (2019) Ivezić Ž., et al., 2019, ApJ, 873, 111
- Jiang et al. (2007) Jiang L., Fan X., Ivezić Ž., Richards G. T., Schneider D. P., Strauss M. A., Kelly B. C., 2007, ApJ, 656, 680
- Katz (1997) Katz J. I., 1997, ApJ, 478, 527
- Kellermann et al. (1989) Kellermann K. I., Sramek R., Schmidt M., Shaffer D. B., Green R., 1989, AJ, 98, 1195
- Kellermann et al. (2016) Kellermann K. I., Condon J. J., Kimball A. E., Perley R. A., Ivezić Ž., 2016, ApJ, 831, 168
- Kelley et al. (2019) Kelley L. Z., Haiman Z., Sesana A., Hernquist L., 2019, MNRAS, 485, 1579
- Kessler et al. (2015) Kessler R., et al., 2015, AJ, 150, 172
- Kimball & Ivezić (2008) Kimball A. E., Ivezić Ž., 2008, AJ, 136, 684
- King et al. (2013) King O. G., et al., 2013, MNRAS, 436, L114
- Kormendy & Ho (2013) Kormendy J., Ho L. C., 2013, ARA&A, 51, 511
- Kormendy & Richstone (1995) Kormendy J., Richstone D., 1995, ARA&A, 33, 581
- Kroupa et al. (2020) Kroupa P., Subr L., Jerabkova T., Wang L., 2020, MNRAS, 498, 5652
- Kudryavtseva et al. (2011) Kudryavtseva N. A., et al., 2011, A&A, 526, A51
- Kulkarni & Loeb (2016) Kulkarni G., Loeb A., 2016, MNRAS, 456, 3964
- Lacy et al. (2020) Lacy M., et al., 2020, PASP, 132, 035001
- Lawrence et al. (2007) Lawrence A., et al., 2007, MNRAS, 379, 1599
- Lehto & Valtonen (1996) Lehto H. J., Valtonen M. J., 1996, ApJ, 460, 207
- Li et al. (2016) Li Y.-R., et al., 2016, ApJ, 822, 4
- Li et al. (2019) Li Y.-R., et al., 2019, ApJS, 241, 33
- Liao et al. (2020) Liao W.-T., et al., 2020, MNRAS, 500, 4025
- Liu et al. (2018) Liu T., Gezari S., Miller M. C., 2018, ApJ, 859, L12
- Liu et al. (2019) Liu T., et al., 2019, ApJ, 884, 36
- Loeb (2010) Loeb A., 2010, PRD, 81, 047503
- Martin et al. (2005) Martin D. C., et al., 2005, ApJ, 619, L1
- Masci et al. (2019) Masci F. J., et al., 2019, PASP, 131, 018003
- Massaro et al. (2015) Massaro E., Maselli A., Leto C., Marchegiani P., Perri M., Giommi P., Piranomonte S., 2015, Ap&SS, 357, 75
- McKinney et al. (2012) McKinney J. C., Tchekhovskoy A., Blandford R. D., 2012, MNRAS, 423, 3083
- McMullin et al. (2007) McMullin J. P., Waters B., Schiebel D., Young W., Golap K., 2007, in Shaw R. A., Hill F., Bell D. J., eds, Astronomical Society of the Pacific Conference Series Vol. 376, Astronomical Data Analysis Software and Systems XVI. p. 127
- Merritt (2013) Merritt D., 2013, Dynamics and Evolution of Galactic Nuclei. Princeton Series in Astrophysics, Princeton University Press, http://books.google.com/books?id=cOa1ku640zAC
- Middleton et al. (2018) Middleton H., Chen S., Del Pozzo W., Sesana A., Vecchio A., 2018, Nature Communications, 9, 573
- Mingarelli et al. (2017) Mingarelli C. M. F., et al., 2017, Nature Astronomy, 1, 886
- Morganson et al. (2018) Morganson E., et al., 2018, PASP, 130, 074501
- Nguyen et al. (2020) Nguyen K., Bogdanović T., Runnoe J. C., Taylor S. R., Sesana A., Eracleous M., Sigurdsson S., 2020, ApJ, 900, L42
- Nyland et al. (2020) Nyland K., et al., 2020, ApJ, 905, 74
- Panessa et al. (2019) Panessa F., Baldi R. D., Laor A., Padovani P., Behar E., McHardy I., 2019, Nature Astronomy, 3, 387
- Pâris et al. (2018) Pâris I., et al., 2018, A&A, 613, A51
- Rau et al. (2009) Rau A., et al., 2009, PASP, 121, 1334
- Richards et al. (2006) Richards G. T., et al., 2006, ApJS, 166, 470
- Rieger (2004) Rieger F. M., 2004, ApJ, 615, L5
- Scarpa et al. (1999) Scarpa R., Urry C. M., Falomo R., Treves A., 1999, ApJ, 526, 643
- Serafinelli et al. (2020) Serafinelli R., et al., 2020, ApJ, 902, 10
- Sesana (2021) Sesana A., 2021, Frontiers in Astronomy and Space Sciences, 8, 7
- Shen & Liu (2012) Shen Y., Liu X., 2012, ApJ, 753, 125
- Shen et al. (2019) Shen Y., et al., 2019, ApJS, 241, 34
- Shi & Krolik (2015) Shi J.-M., Krolik J. H., 2015, ApJ, 807, 131
- Sillanpaa et al. (1988) Sillanpaa A., Haarala S., Valtonen M. J., Sundelius B., Byrd G. G., 1988, ApJ, 325, 628
- Sobacchi et al. (2017) Sobacchi E., Sormani M. C., Stamerra A., 2017, MNRAS, 465, 161
- Song et al. (2021) Song Z., Ge J., Lu Y., Yan C., Ji X., 2021, A&A, 645, A15
- Sparks et al. (1995) Sparks W. B., Golombek D., Baum S. A., Biretta J., de Koff S., Macchetto F., McCarthy P., Miley G. K., 1995, ApJ, 450, L55
- Stella & Vietri (1998) Stella L., Vietri M., 1998, ApJ, 492, L59
- Stickel et al. (1989) Stickel M., Fried J. W., Kuehr H., 1989, A&AS, 80, 103
- Tanaka & Haiman (2013) Tanaka T. L., Haiman Z., 2013, Classical and Quantum Gravity, 30, 224012
- Taylor (2021) Taylor S. R., 2021, arXiv e-prints, p. arXiv:2105.13270
- Tchekhovskoy et al. (2011) Tchekhovskoy A., Narayan R., McKinney J. C., 2011, MNRAS, 418, L79
- Tie et al. (2017) Tie S. S., et al., 2017, AJ, 153, 107
- Tremaine & Davis (2014) Tremaine S., Davis S. W., 2014, MNRAS, 441, 1408
- Valtaoja et al. (2000) Valtaoja E., Teräsranta H., Tornikoski M., Sillanpää A., Aller M. F., Aller H. D., Hughes P. A., 2000, ApJ, 531, 744
- Valtonen et al. (2008) Valtonen M. J., et al., 2008, Nature, 452, 851
- Vanden Berk et al. (2001) Vanden Berk D. E., et al., 2001, AJ, 122, 549
- Vaughan & Uttley (2005) Vaughan S., Uttley P., 2005, MNRAS, 362, 235
- Vaughan et al. (2016) Vaughan S., Uttley P., Markowitz A. G., Huppenkothen D., Middleton M. J., Alston W. N., Scargle J. D., Farr W. M., 2016, MNRAS, 461, 3145
- Villata et al. (1998) Villata M., Raiteri C. M., Sillanpaa A., Takalo L. O., 1998, MNRAS, 293, L13
- Voges et al. (2000) Voges W., et al., 2000, IAUC, 7432, 3
- Volonteri et al. (2020) Volonteri M., et al., 2020, MNRAS, 498, 2219
- Wang et al. (2019) Wang H.-T., et al., 2019, Phys. Rev. D, 100, 043003
- Wright et al. (2010) Wright E. L., et al., 2010, AJ, 140, 1868
- Xin & Haiman (2021) Xin C., Haiman Z., 2021, arXiv e-prints, p. arXiv:2105.00005
- Xin et al. (2020a) Xin C., Mingarelli C. M. F., Hazboun J. S., 2020a, arXiv e-prints, p. arXiv:2009.11865
- Xin et al. (2020b) Xin C., Charisi M., Haiman Z., Schiminovich D., Graham M. J., Stern D., D’Orazio D. J., 2020b, MNRAS, 496, 1683
- York et al. (2000) York D. G., et al., 2000, AJ, 120, 1579
- Yu (2002) Yu Q., 2002, MNRAS, 331, 935
- Zakamska & Greene (2014) Zakamska N. L., Greene J. E., 2014, MNRAS, 442, 784
- Zheng et al. (2016) Zheng Z.-Y., Butler N. R., Shen Y., Jiang L., Wang J.-X., Chen X., Cuadra J., 2016, ApJ, 827, 56
- Zhu & Thrane (2020) Zhu X.-J., Thrane E., 2020, ApJ, 900, 117
- Zhu et al. (2019) Zhu X.-J., Cui W., Thrane E., 2019, MNRAS, 482, 2588