Measurement of cross section for near threshold
Abstract
Using collision data at ten center-of-mass energies between 2.644 and 3.080 GeV collected with the BESIII detector at BEPCII and corresponding to an integrated luminosity of about 500 pb-1, we measure the cross sections and effective form factors for the process utilizing a single-tag method. A fit to the cross section of with a pQCD-driven power function is performed, from which no significant resonance or threshold enhancement is observed. In addition, the ratio of cross sections for the processes and is calculated using recent BESIII measurement and is found to be compatible with expectation from isospin symmetry. PACS: 13.66.Bc, 13.30.a, 14.20.Jn
keywords:
Born cross section, Effective form factor, Threshold effect1 Introduction
In the past few decades, many experiments have observed surprising behavior in the near-threshold region in the production cross section of nucleon pairs in collisions. The measured cross section for the process is approximately constant in the energy range from threshold up to about 2 GeV [1, 2, 3, 4, 5, 6, 7, 8], with an average value of about 0.85 nb. Similar behavior in the near threshold region has been observed in the processes [9, 10, 11], [12] and [13, 14] with average cross sections of 0.8 nb, 0.3 nb and 0.2 nb, respectively. The non-vanishing cross section near threshold and the wide-range plateau discussed above have attracted much interest and driven many theoretical studies, including scenarios that invoke bound states [15] or unobserved meson resonances [16], Coulomb final-state interactions or quark electromagnetic interaction that into account the asymmetry between attractive and repulsive Coulomb factors [17, 18]. In the present context of QCD and of our understanding of the quark-gluon structure of hadrons, it is particularly interesting to understand these anomalous phenomena in the hyperon sector [19, 20, 21]. Recently, the BESIII collaboration performed high precision studies of possible threshold enhancement in the processes [22] and [23] with an energy scan method, and also reported a non-vanishing cross section near threshold. To understand the nature of these threshold effects, measurements of the near-threshold pair production of other hyperons will be valuable.
Additionally, the electromagnetic structure of hadrons, parametrized in terms of electromagnetic form factors (EMFFs) [24], provides a key to understanding QCD effects in bound states. However, experimental information regarding the EMFFs of hyperons remains limited. The access to hyperon structure by EMFFs provides extra motivation for measurements of exclusive cross sections and EMFFs for baryon antibaryon pairs.
In this Letter, we report a measurement of the Born cross section and the effective form factor for the process using a single-baryon-tag method at center-of-mass (CM) energies between 2.644 and 3.080 GeV. We fit the Born cross sections under various hypotheses for the production in annihilation. The data set used in this analysis corresponds to a total of about 500 pb-1 collision data [25, 26] collected with the BESIII detector [27] at the BEPCII storage rings [28].
2 BESIII detector and Monte Carlo simulation
The BESIII detector [27] records symmetric collisions provided by the BEPCII storage rings [28]. BESIII has collected large data samples in the -charm threshold region [29]. The cylindrical core of the BESIII detector covers 93% of the full solid angle and consists of a helium-based multilayer drift chamber (MDC), a plastic scintillator time-of-flight system (TOF), and a CsI(Tl) electromagnetic calorimeter (EMC), which are all enclosed in a superconducting solenoidal magnet providing a 1.0 T magnetic field. The solenoid is supported by an octagonal flux-return yoke with resistive plate counter muon-identification modules interleaved with steel. The charged-particle momentum resolution at is , and the d/d resolution is for electrons from Bhabha scattering. The EMC measures photon energies with a resolution of () at GeV in the barrel (end-cap) region. The time resolution in the TOF barrel region is 68 ps. The end-cap TOF system was upgraded in 2015 using multi-gap resistive plate chamber technology, providing a time resolution of 60 ps [30].
To determine the detection efficiency 100,000 simulated events are generated for each energy point with phase space modeling in the conexc generator [31], which takes into account the beam-energy spread and corrections from initial-states radiation (ISR). The is simulated via evtgen [32] in its decay to the mode with the subsequent decay with phase space model. The anti-baryons are allowed to decay inclusively according to the branching fractions from the Particle Data Group (PDG) [33] (unless otherwise noted, the charge-conjugate state of the mode is included by default below). The response of the BESIII detector is modeled with Monte Carlo (MC) simulations using a framework based on geant4 [34]. Large simulated samples of generic events (inclusive MC) implemented by the conexc generator [31] are used to estimate background.
3 Event selection
The selection of events with a full reconstruction method suffers from a low reconstruction efficiency. Hence, a single baryon tag technique is employed, i.e., only one baryon is reconstructed via the decay mode with and , and the presence of the anti-baryon is inferred from the recoil mass of the detected .
Charged tracks are required to be reconstructed in the MDC within the angular coverage of the MDC: , where is the polar angle with respect to the beam direction. Information from d/d measured in the MDC combined with the TOF is used to construct a particle-identification probability for the hypotheses of a pion, kaon, and proton. Each track is assigned to the particle type with the highest probability. Events with at least one negatively charged pion and one proton are kept for further analysis.
Photons are reconstructed from isolated showers in the EMC. The energy deposited in the nearby TOF counter is included to improve the reconstruction efficiency and energy resolution. Photon energies are required to be greater than 25 MeV in the EMC barrel region ), or greater than 50 MeV in the EMC end cap (). The showers in the angular range between the barrel and the end cap are poorly reconstructed and are excluded from the analysis. Furthermore, the EMC timing of the photon candidate must be in coincidence with collision events, ns, in order to suppress electronic noise and energy deposits unrelated to the collision events. At least two photon candidates are required.
To reconstruct the candidates, a one-constraint (1C) kinematic fit is employed for all combinations by constraining the invariant mass of two photons to the nominal mass [33], and a requirement is placed on the goodness-of-fit, , to suppress non- backgrounds. Here the fitted momentum of is used to further analysis. To reconstruct candidates, a secondary vertex fit [35] is applied to all combinations and those with a goodness-of-fit are selected. In the case when there is more than one combination satisfying this requirement then that one with the minimum value of among all combinations is chosen, where is the invariant mass of the pair, and is the nominal mass of the baryon [33]. The invariant mass of the selected candidate is required to be within 5 MeV/ of the nominal mass, a criterion determined by optimizing the figure of merit (FOM) based on the MC simulation. Here is the number of signal MC events and is the number of the background events expected from simulation. To further suppress background from non- events, the decay length, i.e.,, the distance between its production and decay positions, is required to be greater than zero. The candidates are reconstructed from the combination of the selected and candidates by minimizing the variable , where is the invariant mass of the pair, and is the nominal mass of the baryon taken from the PDG [33]. In order to suppress background further, the invariant mass is required to be within 10 MeV/ of the nominal mass, where the cut value is again set from FOM studies.
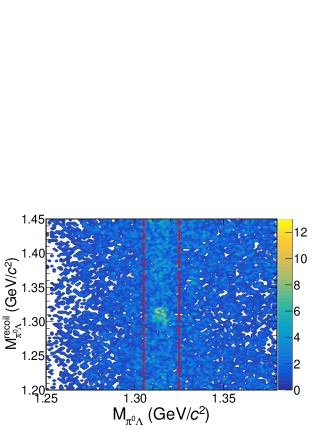
To select anti-baryon candidates, we use the distribution of mass recoiling against the selected system,
| (1) |
where and are the energy and momentum of the selected candidate in the CM system, and is the CM energy. Figure 3 shows the distribution of versus for all energy points. A clear accumulation is observed around the nominal mass.
4 Extraction of signal yields
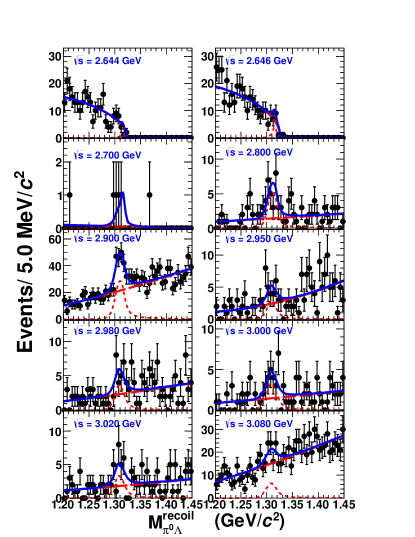
The signal yield for the process at each energy point is determined by performing an extended unbinned maximum-likelihood fit to the spectrum in the range from 1.20 GeV/ to 1.45 GeV/. In the fit, the signal shape for the process at each energy point is represented by the simulated MC shape. After applying the same event selection on the inclusive MC samples at each CM energy, it is found that some background is present at each energy point, mainly coming from events. These events distribute smoothly in the region of interest and can be described by a second-order polynomial function, while for two energy points near the mass threshold at 2.644 and 2.646 GeV, the background is modeled by an Argus function [36]. The signal significances for the energy points 2.644, 2.646, 2.700 and 2.950 GeV are found to be below three standard deviations. For these energy points, the upper limits for production are calculated at the 90% confidence level (C.L.) based on the profile likelihood method incorporating systematic uncertainties [37]. Figure 5 shows the fit to the distribution of for the process at each energy point after applying the event selection described above. Note that single-baryon-tag method means that in a small fraction of events both the and hyperons are reconstructed, which means that the recoil-mass fit introduces double counting into the analysis. A correction factor of 1.08 is applied to the statistical uncertainty to account for this effect [23, 38] based on MC simulation, while for two energy points near the mass threshold at 2.644 and 2.646 GeV, the correction factor is estimated to be 1.03. The number of observed events is summarized in Table 1.
5 Determination of Born cross section
The Born cross section for is calculated by
| (2) |
where is the number of the observed signal events, is the integrated luminosity related to the CM energy, the factor 2 is required for the inclusion of the mode, is the ISR correction factor [39], is the vacuum polarization (VP) correction factor [40], is the detection efficiency and denotes the product of the known branching fractions for the decays , and , respectively [33]. The ISR correction factor is obtained using the QED calculation as described in Ref. [41] and taking Eq. (6) used to fit the cross section measured in this analysis parameterized as input. The measured cross sections are summarized in Table 1.
[0.73] GeV (pb-1) (pb) 2.644 33. 72 1.04 0.75 1.60 0.03 3.0 2.8 () 5.7 5.4 1.1 () 54.0 26.0 5.0 () 2.0 2.646 34. 00 1.04 0.76 1.71 0.03 9.3 5.1 () 16.1 9.4 2.8 () 88.0 26.0 7.0 () 2.0 2.700 1. 03 1.04 0.85 5.85 0.05 3.8 2.4 () 56.8 35.9 3.1 () 120.0 38.0 3.0 () 2.1 2.800 4. 78 1.04 0.90 10.38 0.08 27.8 7.9 47.6 13.5 2.6 93.0 13.0 3.0 5.0 2.900 105. 23 1.03 0.92 12.08 0.08 160.0 23.4 10.5 1.5 0.6 41.0 3.0 3.0 8.2 2.950 15. 94 1.03 0.93 12.09 0.08 16.7 9.2 () 7.2 4.0 0.4 () 34.0 9.3 1.0 () 2.7 2.981 16. 07 1.02 0.94 12.80 0.08 20.5 8.2 8.2 3.3 0.4 36.0 7.2 1.0 3.2 3.000 15. 88 1.02 0.94 12.67 0.08 19.9 7.3 8.2 3.0 0.4 36.0 6.5 1.0 3.6 3.020 17. 29 1.01 0.95 12.80 0.08 20.3 7.6 7.6 2.8 0.4 34.0 6.4 1.0 3.6 3.080 263. 70 0.91 0.97 12.60 0.08 54.0 22.2 1.5 0.6 0.1 15.0 3.0 0.4 3.0
6 Determination of effective form factor
Assuming that spin-1/2 baryon pair production is dominated by one-photon exchange, the Born cross-section for the process can be parameterized in terms of the two EMFFs and [42] as follows:
| (3) |
where is the fine structure constant, the variable is the velocity, , the mass, and is the square of the measured CM energy. The effective form factor is defined as a combination of the EMFFs
| (4) |
and, through substitution of Eq. (3) into Eq. (4), is proportional to the square root of the Born cross-section:
| (5) |
The measured values of the effective form factors are summarized in Table 1.
7 Fit to Born cross section
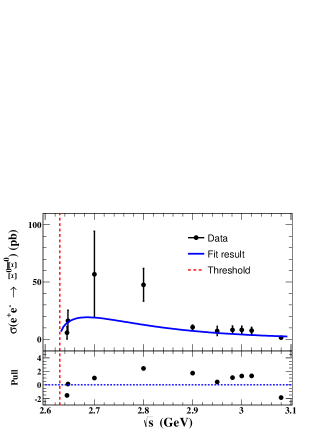
A least- method [43] is used to fit the Born cross-section for the process with the assumption of two alternative functions. The first of these is a perturbative-QCD (pQCD) driven energy power function [44],
| (6) |
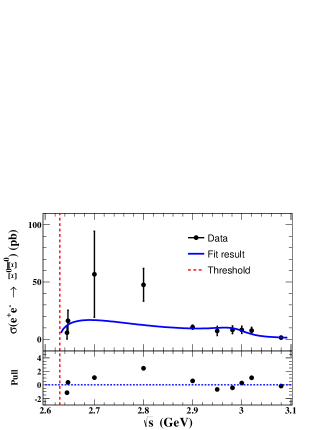
where is the normalization, is the mean effect of a set of possible intermediate states. This model has been applied successfully in studies of [12], [22], and [23] production. The fit returns (20.3 9.6) pb GeV-10 and (1.52 0.13) GeV, where the uncertainty includes both statistical and systematic contributions. Figure 7 shows the fit result with quality , where the number of freedom degree () is calculated by subtracting the number of free parameters in the fit from the total number of energy points. The second function is a coherent sum of a pQCD-driven energy power function plus a Breit-Wigner (BW) function to test the resonance reported in the charged mode [23]
| (7) |
Here the mass and width are fixed to the values of the charged mode [23], is a relative phase between the BW function
| (8) |
and the power function and is the two-body phase space factor. In Eq. (8), is the electronic partial width, and are the mass and width of BW, respectively, and is the branching fraction. The significance for the resonance described by the BW is estimated to be 2.0 including the systematic uncertainty, which receives contributions from the Born cross section for this measurement and the uncertainty in the knowledge of the mass and width of the resonance from previous studies [23]. The fit has a quality of and is shown in Figure 7. The comparison of fit quality for both models is fair. Note that neither fit model describes the point near 2.8 GeV well, which may be due to statistical fluctuation or the contribution of one or more additional unknown resonances. A Bayesian approach [45] gives the upper limit on the product of the electronic partial width and the branching fractions for this possible resonance decaying to the to be 0.3 eV at the 90% C.L. , after taking into account the systematic uncertainties described in the following.
8 Systematic uncertainty
Several sources of systematic uncertainties are considered on the Born cross section measurement. They include the reconstruction efficiency, the fit range, the background shape, the mass resolution and the fit models for the cross section. Knowledge of the decay branching fractions of intermediate states and the luminosity measurement give additional contributions. All of the systematic uncertainties are discussed in detail below.
-
1.
The understanding of the reconstruction efficiency, which in turn depends on the photon-selection efficiency, the reconstruction efficiency, the reconstruction efficiency, the requirements on the mass of the and , and the decay length of the candidates, is studied with a control sample of events via single- and double-tag methods. The selection criteria for the charged tracks, and the reconstruction of and candidates are exactly the same as those described in Sec. 3. The reconstruction efficiency is defined as the ratio of the number of double-tag events to that from the single tags. For studying the reconstruction efficiency for two energy points near threshold, care is taken to ensure that the momenta of the two pions in the final state of the control sample is within the same range as those of the signal decays. A detailed description of the method can be found in Ref. [46]. The difference in the reconstruction efficiency between the data and MC samples is assigned as the uncertainty.
-
2.
The uncertainty due to the fitting range is estimated by shifting the fitting range of by 20 MeV/. The difference in yields is taken as the systematic uncertainty of the fit range.
-
3.
The uncertainties due to the background shape arise mainly from the level of the wrong-combination background and the form of the polynomial function used. For the wrong-combination background, there are transition ’s with similar momenta in both the baryon and anti-baryon decay chains within the signal events. Incorrect use of these in the reconstruction leads to the wrong-combination background. The impact of this component on the background shape is studied by studying how the shape changes as the association criteria for the neutral pions are varied in the MC. The uncertainty associated with the polynomial function is estimated by changing from a second order to a third order function. The observed difference in the yields is taken as the systematic uncertainty due to the background shape.
-
4.
The uncertainty associated with knowledge of the mass resolution is estimated by changing the nominal PDF to the MC-simulated shape convolved with Gaussian function whose mean and width are free parameters. The difference in yields is taken as the systematic uncertainty due to the mass resolution.
-
5.
In this analysis, the detection efficiency for each energy point is determined from MC simulated with the phase space model, which may not describe the angular distribution well. Thus, a joint angular distribution formalism [47] combined with the measured parameters in decay is employed to validate the detection efficiency, where the angular distribution parameter is set to unity which is its maximally allowed value. The difference in the efficiency for both models is taken as the systematic uncertainty associated with the angular distribution.
-
6.
The uncertainty of the fit model used to evaluate the line shape of Born cross section incorporating the effect of ISR factor is estimated by floating and fixing the index of the pQCD energy power function. The resulting change in selection efficiency is taken as the systematic uncertainty due to the fitting model of line shape.
-
7.
The uncertainties associated with the branching fractions of the intermediate states and are taken from the PDG [33].
-
8.
The luminosity at all energy points is measured using the Bhabha events, with an uncertainty of about 1.0% [48].
The various systematic uncertainties on the cross-section measurements are summarized in Table 8, where the values in parentheses represent the corresponding values for the two energy points near threshold. Assuming all sources to be independent, the total systematic uncertainty is obtained by summing over the individual contributions in quadrature. TABLE 2: Systematic uncertainty on the Born cross section measurement, with the values in parentheses indicating the value near threshold (in %).
| Source | Value |
|---|---|
| reconstruction | 2.7 (14.8) |
| Fitting range | 2.5 |
| Background shape | 3.3 |
| Mass resolution | 1.0 |
| Angular distribution | 1.0 |
| Line shape | 1.1 |
| Intermediate states | 0.8 |
| Luminosity | 1.0 |
| Total | 5.4 (15.5) |
9 Discussion and conclusion
Born cross sections and effective form factors for the exclusive process are measured by means of a single baryon tag method for the first time. The collision data are collected at ten center-of-mass energies between 2.644 and 3.080 GeV by the BESIII detector at BEPCII, and correspond to a total integrated luminosity of about 500 pb-1 . The measured Born cross sections are described adequately with a pQCD-driven energy power function, which tend to zero around 2.64 GeV and so do not exhibit any obvious threshold enhancement. Allowing for a resonance at around 3.0 GeV, as reported in Ref. [23], gives a signal with a significance of 2.0, including both statistical and systematic uncertainties. The upper limit on the product of the electronic partial width and the branching fractions for this resonance decaying to the final state is estimated to be 0.3 eV at 90% C.L.. The fit models considered do not describe the data well at 2.8 GeV, which is behavior that warrants closer study when larger data sets become available. The effective form factor is determined at each energy point, but the samples are not large enough to allow separate measurements of and . A comparison of the measured Born cross sections between the charged mode [23] and the neutral mode , as shown in Fig. 9, shows consistent behavior with the current level of experimental precision.
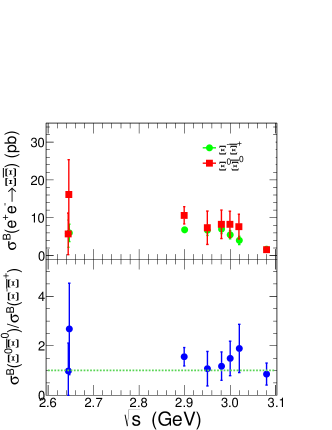
The ratio of Born cross sections for both modes is within 1 of the expectation of isospin symmetry. These results provide more information for understanding the insight into the nature of hyperon pair production in annihilation near threshold.
10 Acknowledgements
The BESIII collaboration thanks the staff of BEPCII and the IHEP computing center for their strong support. This work is supported in part by National Key Research and Development Program of China under Contracts Nos. 2020YFA0406400, 2020YFA0406403, 2020YFA0406300; National Natural Science Foundation of China (NSFC) under Contracts Nos. 11625523, 11635010, 11735014, 11822506, 11835012, 11905236, 11935015, 11935016, 11935018, 11961141012, 12022510, 12035009, 12035013, 12047501, 12061131003, 12075107; the Chinese Academy of Sciences (CAS) Large-Scale Scientific Facility Program; Joint Large-Scale Scientific Facility Funds of the NSFC and CAS under Contracts Nos. U1732263, U1832207; CAS Key Research Program of Frontier Sciences under Contract No. QYZDJ-SSW-SLH040; 100 Talents Program of CAS; INPAC and Shanghai Key Laboratory for Particle Physics and Cosmology; ERC under Contract No. 758462; European Union Horizon 2020 research and innovation programme under Contract No. Marie Sklodowska-Curie grant agreement No 894790; German Research Foundation DFG under Contracts Nos. 443159800, Collaborative Research Center CRC 1044, FOR 2359, FOR 2359, GRK 214; Istituto Nazionale di Fisica Nucleare, Italy; Ministry of Development of Turkey under Contract No. DPT2006K-120470; National Science and Technology fund; Olle Engkvist Foundation under Contract No. 200-0605; STFC (United Kingdom); The Knut and Alice Wallenberg Foundation (Sweden) under Contract No. 2016.0157; The Royal Society, UK under Contracts Nos. DH140054, DH160214; The Swedish Research Council; U. S. Department of Energy under Contracts Nos. DE-FG02-05ER41374, DE-SC-0012069.
References
- [1] B. Delcourt et al., Phys. Lett. B 86 (1979) 395.
- [2] DM2 Collaboration, D. Bisello et al., Nucl. Phys. B 224 (1983) 379; Z. Phys. C 48 (1990) 23.
- [3] A. Antonelli et al., Phys. Lett. B 313 (1993) 283; Phys. Lett. B 334 (1994) 431; Nucl. Phys. B 517 (1998) 3.
- [4] BABAR Collaboration, J. P. Lees et al., Phys. Rev. D 87 (2013) 092005; Phys. Rev. D 88 (2013) 072009.
- [5] PS170 Collaboration, G. Bardin et al., Nucl. Phys. B 411 (1994) 3.
- [6] CMD-3 Collaboration R. R. Akhmetshin et al. , Phys. Lett. B 759 (2016) 634
- [7] CLEO Collaboration, T. K. Pedlar et al., Phys. Rev. Lett. 95 (2005) 261803.
- [8] BESIII Collaboration, M. Ablikim et al., Phys. Rev. D 91 (2015) 112004; Phys. Rev. Lett. 124 (2020) 042001; Phys. Lett. B 817 (2021) 136328.
- [9] M. N. Achasov et al., Phys. Rev. D 90 (2014) 112007.
- [10] BESIII Collaboration, M. Ablikim et al., [arXiv:2103.12486 [hep-ex]].
- [11] V. P. Druzhinin and S. I. Serednyakov, EPJ Web Conf. 212 (2019) 07007.
- [12] BESIII Collaboration, M. Ablikim et al., Phys. Rev. D 97 (2018) 032013.
- [13] Belle Collaboration, G. Pakhlova et al., Phys. Rev. Lett. 101 (2008) 172001.
- [14] BESIII Collaboration, M. Ablikim et al., Phys. Rev. Lett. 120 (2018) 132001.
- [15] O. D. Dalkarov, P. A. Khakhulin, and A. Y. Voronin, Nucl. Phys. A 833 (2010) 104.
- [16] B. El-Bennich, M. Lacombe, B. Loiseau, and S. Wycech, Phys. Rev. C 79 (2009) 054001.
- [17] J. Haidenbauer, H. W. Hammer, U. G. Meissner and A. Sibirtsev, Phys. Lett. B 643 (2006) 29.
- [18] R. Baldini, S. Pacetti, A. Zallo, A. Zichichi, Eur. Phys. J. A 39 (2009) 315.
- [19] BABAR Collaboration, B. Aubert et al., Phys. Rev. D 76 (2007) 092006.
- [20] DM2 Collaboration, D. Bisello et al., Z. Phys. C 48 (1990) 23.
- [21] BESIII Collaboration, M. Ablikim et al., Phys. Rev. D 97 (2018) 032013; Phys. Rev. Lett. 120 (2018) 132001; Chin. Phys. C 44 (2020) 040001.
- [22] BESIII Collaboration, M. Ablikim et al., Phys. Lett. B 814 (2021) 136110.
- [23] BESIII Collaboration, M. Ablikim et al., Phys. Rev. D 103, 012005 (2021).
- [24] A. Denig and G. Salme, Prog. Part. Nucl. Phys. 68 (2013), 113-157.
- [25] With the same method (see Ref. [26] for more details), the preliminary luminosities for these energy points are determined to be a total of about 500 pb-1 with an uncertainty of 1%.
- [26] BESIII Collaboration, M. Ablikim et al., Chin. Phys. C 41 (2017) 063001; Chin. Phys. C 41 (2017) 013001; Chin. Phys. C 42 (2018) 023001.
- [27] BESIII Collaboration, M. Ablikim et al., Nucl. Instrum. Methods Phys. Res., Sect. A 614 (2010) 345.
- [28] Y. F. Wang, Int. J. Mod. Phys. A 21 (2006) 5371; C. H. Yu et al., Proceedings of IPAC2016, Busan, Korea, 2016, doi:10.18429/JACoW-IPAC2016-TUYA01.
- [29] BESIII Collaboration, M. Ablikim et al., Chin. Phys. C 44 (2020) 040001.
- [30] X. Li et al., Radiat. Detect. Technol. Methods 1 (2017) 13; Y. X. Guo et al., Radiat. Detect. Technol. Methods 1 (2017) 15; P. Cao et al., Nucl. Instrum. Meth. A 953 (2020) 163053.
- [31] R. G. Ping et al. Chin. Phys. C 40 (2016) 113002.
- [32] D. J. Lange, Nucl. Instrum. Methods Phys. Res. Sect. A 462 (2001) 152; R. G. Ping et al. Chin. Phys. C 32 (2008) 599.
- [33] Particle Data Group, P. A. Zyla et al., Prog. Theor. Exp. Phys. 2020, 083C01 (2020).
- [34] GEANT4 Collaboration, S. Agostinelli et al., Nucl. Instrum. Methods Phys. Res., Sect. A 506 (2003) 250; J. Allison et al., IEEE Trans. Nucl. Sci. 53 (2006) 270.
- [35] M. Xu et al., Chin. Phys. C 33, (2009) 428.
- [36] ARGUS Collaboration, H. Albrecht et al., Phys. Rev. Lett. 241 (1990) 278.
- [37] K. Stenson, arXiv:physics/0605236; J. Lundberg, J. Conrad, W. Rolke and A. Lopez, Comput. Phys. Commun. 181 (2010) 683.
- [38] BESIII Collaboration, M. Ablikim et al., Phys. Rev. D 100 (2019) 051101.
- [39] S. Jadach, B. F. L. Ward and Z. Was, Phys. Rev. D 63 (2001) 113009; R. G. Ping, Chin. Phys. C 38 (2014) 083001.
- [40] S. Actis et al. Eur. Phys. J. C 66 (2010) 585.
- [41] E. Kuraev and V. S. Fadin, Sov. J. Nucl. Phys. 41 (1985) 466.
- [42] N. Cabibbo and R. Gatto, Phys. Rev. 124 (1961) 1577.
- [43] Y. S. Zhu, Chin. Phys. C 32 (2008) 363; G. D’ Agostini, Bayesian Reasoning in Data Analysis: A Critical Introduction (World Scientific, New Jersey, USA (2003) 329 p.
- [44] S. Pacetti, R. Baldini Ferroli and E. Tomasi Gustafsson, Phys. Rep. 550 (2015) 1.
- [45] Y. S. Zhu, Chin. Phys. C 32 (2008) 363; G. D’Agostini, Bayesian reasoning in data analysis: A critical introduction, New Jersey, USA: World Scientific (2003) 329 p.
- [46] BESIII Collaboration, M. Ablikim et al., Phys. Rev. D 87 (2013) 032007; Phys. Rev. D 93 (2016) 072003 ; Phys. Lett. B 770 (2017) 217; Phys. Rev. D 100 (2019) 051101; Phys. Rev. Lett. 124 (2020) 032002.
- [47] P. Adlarson and A. Kupsc, Phys. Rev. D 100 (2019) 114005.
- [48] BESIII Collaboration, M. Ablikim et al., Chin. Phys. C 41 (2017) 063001; Chin. Phys. C 41 (2017) 113001.