Discovery of a radio halo (and relic) in a cluster
Abstract
Radio halos are diffuse synchrotron sources observed in dynamically unrelaxed galaxy clusters. Current observations and models suggest that halos trace turbulent regions in the intra-cluster medium where mildly relativistic particles are re-accelerated during cluster mergers. Due to the higher luminosities and detection rates with increasing cluster mass, radio halos have been mainly observed in massive systems ( ). Here, we report the discovery of a radio halo with a largest linear scale of 750 kpc in PSZ2G145.92-12.53 () using LOFAR observations at 120168 MHz. With a mass of and a radio power at 150 MHz of W Hz-1, this is the least powerful radio halo in the least massive cluster discovered to date. Additionally, we discover a radio relic with a mildly convex morphology at 1.7 Mpc from the cluster center. Our results demonstrate that LOFAR has the potential to detect radio halos even in low-mass clusters, where the expectation to form them is very low (5%) based on turbulent re-acceleration models. Together with the observation of large samples of clusters, this opens the possibility to constrain the low end of the power-mass relation of radio halos.
1 Introduction
Radio halos are extended synchrotron sources with steep spectra (, with where
is the flux density at frequency and is the spectral index) that are often observed in massive merging galaxy clusters (e.g. van Weeren et al., 2019, for a review). Their emission generally follows the distribution of the thermal gas of the intra-cluster medium (ICM), and occupies the central volume of the cluster. Nowadays, turbulent re-acceleration is thought to be the main mechanism responsible for generating radio halos (e.g. Brunetti & Jones, 2014, for a review). In this scenario, relativistic electrons in halos are re-energized due to the interaction with MHD turbulence that has been injected in the ICM during cluster collisions. The competition between energy losses and acceleration of particles (that is connected to the energetics of the merger) results in a gradual steepening of the halo spectrum at higher frequencies (e.g. Cassano & Brunetti, 2005). This implies that, especially when observed at GHz-frequencies, they should preferentially be found in massive objects undergoing energetic merging events and be rarer in less massive merging-systems (Cassano et al., 2006).
The radio halo power is found to increase with the cluster mass and/or X-ray luminosity (e.g. Feretti et al., 2012; van Weeren et al., 2019), implying that it is more challenging to observe radio halos in lower mass systems. For this reason, Giant Metrewave Radio Telescope (GMRT) and Very Large Array (VLA) observations have been focused mainly on massive ( ) or X-ray bright ( erg s-1), nearby (), clusters (Venturi et al., 2007; Giovannini et al., 2009; Cassano et al., 2013; Kale et al., 2013, 2015; Cuciti et al., 2015, 2021a, 2021b). However, one major expectation of the re-acceleration scenario is that the occurrence of radio halos should be higher at low frequencies, where also radio halos generated during less energetic events, i.e. in low-mass clusters or in minor mergers, should be visible (Cassano et al., 2006, 2010). The LOw Frequency ARray (LOFAR) is enabling highly sensitive observations at MHz which allow us to probe the population of radio halos in the relatively poorly explored regimes of high- (Cassano et al., 2019; Di Gennaro et al., 2021) and low-mass systems (Botteon et al., 2019; Hoang et al., 2019, 2021; Osinga et al., 2021).
In this Letter, we report on the discovery of a radio halo (and relic) in PSZ2G145.92-12.53. This cluster belongs to the Clusters in the Zone of Avoidance sample (CIZA; Ebeling et al., 2002) and to the second Planck Sunyaev-Zel’dovich (SZ) catalog (PSZ2; Planck Collaboration XXVII, 2016), is located at (Ebeling et al., 2002), and has a SZ-derived mass of , consistent with that reported by PSZ1 ( ; Planck Collaboration XXIX 2014) and in the Meta-Catalogue of X-ray detected Clusters of galaxies ( ; Piffaretti et al. 2011). Owing to its low-mass and (radio) power, we nickname it the Ant Cluster. Throughout this work, we adopt a CDM cosmology with , and km s-1 Mpc-1. At , this corresponds to a luminosity distance of Mpc and to an angular scale of 36.1 kpc arcmin-1.
|
|
|---|---|
 |
|
 |
2 Data reduction
2.1 LOFAR
The Ant Cluster is located 0.95∘ from the center of the LOFAR Two-meter Sky Survey (LoTSS; Shimwell et al., 2017, 2019) pointing P044+44, which was observed for 8 hr on 2018 December 14. Observations were carried out in HBA_DUAL_INNER mode adopting a bandwidth of 48 MHz (120168 MHz band), centered at 144 MHz. Preliminary data processing was carried out by the LOFAR Surveys Key Science Project team adopting the same pipelines used to correct for direction independent and dependent effects across the entire field-of-view (FoV) of LoTSS observations (van Weeren et al., 2016; de Gasperin et al., 2019; Shimwell et al., 2019; Tasse et al., 2021). In particular, direction-depended calibration is performed with ddf-pipeline111https://github.com/mhardcastle/ddf-pipeline, which also delivers images of the entire LOFAR FoV at and resolution. We then obtained images suitable for our study following two approaches.
First, we created a very-low resolution source-subtracted image of a FoV of centered on the Ant Cluster. In this case, we used the resolution model of P044+44 obtained from ddf-pipeline to subtract sources in the whole FoV, taking care to exclude any clean components associated with the cluster. The uv-data were then reimaged at resolution (corresponding to kpc kpc at the cluster redshift) and corrected for the primary beam response. This image was obtained only for visualization purposes, and was not use further in the analysis. LoTSS images at and of the same FoV without discrete sources subtracted are shown in Appendix A.
Second, we refined the calibration towards two regions of interest (halo and relic regions) following the “extraction and re-calibration” method described in van Weeren et al. (2020). Briefly, this method consists in removing all sources outside a region containing the target from the uv-data, phase shifting to the center of the region while averaging the data to speed up further processing, correcting for the LOFAR primary beam response, and performing phase and amplitude self-calibration loops in the extracted region. The improved calibration provided by this approach allows us to study better the cluster diffuse radio emission and to measure its flux density. For this reason, all the flux densities reported in this paper were evaluated using these datasets. Each of the reprocessed regions was reimaged at two different resolutions, with and without discrete sources (modeled and subtracted using the improved datasets).
Our final LOFAR images are visualized in Fig. 1 and their noise and resolution are summarized in Tab 1. All images were produced with WSClean v2.10 (Offringa et al., 2014) adopting an inner uv-cut of (corresponding to an angular scale of 43′) to reduce sensitivity to extended Galactic emission. Uncertainties on the LOFAR integrated flux densities are dominated by errors in the absolute flux scale, which is conservatively set to 20%, in line with LoTSS measurements (Shimwell et al., 2019). The flux scale of the LOFAR images was aligned adopting the NRAO VLA Sky Survey (NVSS; Condon et al., 1998) derived multiplicative correction factor of 0.876 on LOFAR data, following Hardcastle et al. (2021).
| Field | Resolution | Noise | Discrete sources |
|---|---|---|---|
| () | (Jy beam-1) | ||
| Full | 1050 | subtracted | |
| Relic (colors) | 307 | present | |
| Relic (contours) | 438 | subtracted | |
| Halo (colors) | 596 | present | |
| Halo (contours) | 876 | subtracted |
2.2 ROSAT and XMM-Newton
ROSAT count images in the energy band 0.12.4 keV in the direction of the Ant Cluster were retrieved together with the corresponding background and exposure maps from the ROSAT All-Sky Survey (RASS; Voges et al., 1999) data archive222https://heasarc.gsfc.nasa.gov/docs/rosat/rass.html. These data were combined to produce the count rate image smoothed with a Gaussian kernel with pixels (1 pixel = 45′′) that is shown in Fig. 1.
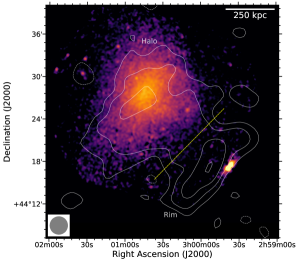
From the XMM-Newton Science Archive333http://nxsa.esac.esa.int/nxsa-web/, we retrieved a pointed observation of the cluster (ObsID: 0744100301, 14 ks). We made use of the XMM-Newton Scientific Analysis System (sas v16.1.0) to create clean event files using the tasks mos-filter and pn-filter. The MOS1, MOS2, and pn data were then combined to produce a 0.52.0 keV count rate image that was smoothed with a Guassian kernel with pixels (1 pixel = 2.5′′). The resulting image, which covers only the central region of the cluster, is shown in Fig. 2.
3 Results
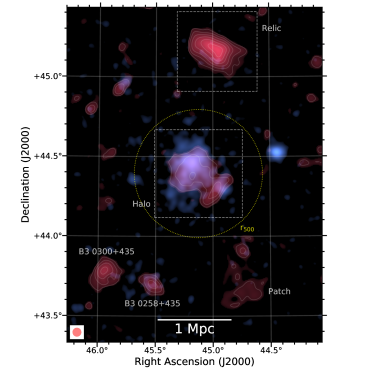
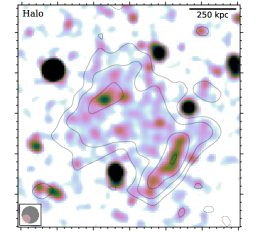
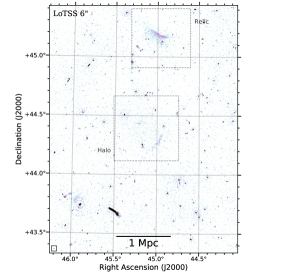
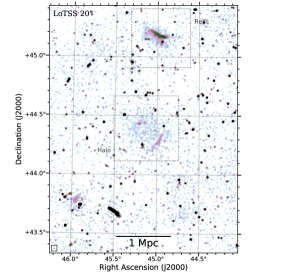
In the left panel of Fig. 1, we show a radio/X-ray (LoTSS/RASS) overlay of a large FoV centered on the Ant Cluster. The thermal emission of the ICM (blue) is elongated in the N-S direction, suggesting that the cluster is dynamically unrelaxed. The LOFAR discrete source-subtracted image (red) highlights the presence of diffuse emission at the center of the cluster that is connected to a brighter and elongated structure to the W, that we term the Rim. At 1.7 Mpc N from the cluster center, a source extended in the the E-W direction is also detected. Its surface brightness drops rapidly to the N, while it declines more slowly towards the cluster. The zoom-in images of these two regions of interest are depicted in the right panels of Fig. 1.
Due to the morphology, location in the cluster, and largest linear size of 750 kpc, we classify the central diffuse emission as a radio halo. This classification is supported by the morphological similarity between the X-ray and radio emission, that can be better observed in Fig. 2 where we overlay the LOFAR contours onto the XMM-Newton image of the cluster center. The absence of a compact and peaked X-ray core and the elongated X-ray morphology revealed in the higher resolution XMM-Newton data is indicative of a merging system, confirming the impression from the RASS image. The hypothesis that the radio emission in the Ant Cluster is tracing a mini-halo (i.e. another kind of diffuse emission that can be found at the center of galaxy clusters) is rejected due to: its large linear size, the lack of a powerful radio galaxy at its center, and the absence of a cool-core in the system. The Rim, roughly separated from the halo by the dashed line in Fig. 2, is located in a region of lower gas density, in a direction where the X-ray emission from the ICM has a protuberance. The total flux density of the diffuse emission measured within the low-resolution level contour is mJy, divided into 155 mJy for the halo and 98 mJy for the Rim. We also measure the flux density of the radio halo by fitting its surface brightness profile in 2D using the Halo-Flux Density CAlculator444https://github.com/JortBox/Halo-FDCA (Halo-FDCA; Boxelaar et al., 2021) and adopting an exponential profile (see also Murgia et al., 2009). Due to the elongation of the halo, we assumed an elliptical model, which has 6 free parameters: the coordinates of the center ( and ), the central brightness (), two e-folding radii ( and ), and a rotation angle (). The Rim region was masked out during the fit. The relevant best-fit physical quantities of the model are Jy arcsec-2, kpc and kpc, and the model appears to provide an accurate description of the data (). The flux density at 150 MHz obtained by integrating this model up to three times the e-folding radii (as suggested by Murgia et al. 2009) and assuming a spectral index value of (which covers the typical range observed for radio halo spectra, e.g. Feretti et al. 2012; van Weeren et al. 2019) is mJy, consistent within uncertainties with that measured in the contour. Hereafter, we adopt this flux density value for the radio halo, which leads to a radio power at 150 MHz of W Hz-1.
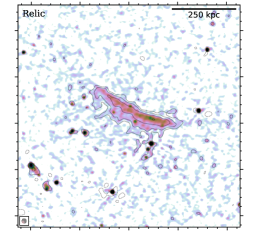
We classify the peripheral emission in the cluster N outskirts as a radio relic. Radio relics are diffuse sources observed in merging clusters that trace synchrotron emitting electrons (re)accelerated at merger shocks. The source position in the system, its major axis elongated perpendicularly with respect to the main elongation of the ICM thermal emission (which generally indicates the merger axis), its brightness distribution declining towards the cluster center, and the absence of a clear optical counterpart support this classification. Its flux density (measured within the low-resolution contour) is mJy, corresponding to a power of W Hz-1. We note that the relic can be also observed with low-significance in the NVSS at 1.4 GHz; however, the limited sensitivity and poor resolution of NVSS does not allow us to provide a meaningful constraint on its spectral index.
Finally, we note the presence of other three prominent sources in the large FoV image of the Ant Cluster (marked Fig. 1). While the emissions labeled B3 0300+435 and B3 0258+435 (Ficarra et al., 1985) may well be residuals left over by the subtraction of these two bright and extended sources, we exclude that the Patch is an artifact because of the lack of sources in that region in the LoTSS 6′′ resolution image of P044+44 (see Appendix A). This emission arises only at very low-resolution (150′′), is detected just above the level, and possibly shows an elongation towards the cluster center.
4 Discussion
4.1 Radio halo
The Ant Cluster is the least massive cluster known to host a radio halo, allowing us to probe non-thermal phenomena in the low-mass end of the cluster mass function. So far there are only a handful of central, extended, diffuse sources detected in clusters with mass (e.g. A3562, Venturi et al. 2000, 2003; Giacintucci et al. 2005; A2061, Rudnick & Lemmerman 2009; PSZ1G018.75+23.57, Bernardi et al. 2016; A2146, Hlavacek-Larrondo et al. 2018; Hoang et al. 2019; RXCJ1825.3+3026, Botteon et al. 2019; A1775, Botteon et al. 2021) and no radio halos have been claimed below . LOFAR is increasing the number of radio halos observed in low-mass systems thanks to the wide area covered by LoTSS-DR2 (Shimwell et al., in prep.) and the Deep Fields observations (Osinga et al., 2021). Currently, the Ant Cluster is the clearest halo in the lowest mass PSZ2 cluster that we have found after searching LoTSS images spanning 35% of the Northern sky.
In the context of turbulent re-acceleration, radio halos originate during cluster-cluster mergers where a small fraction of gravitational energy is dissipated by large-scale motions into particle acceleration on much smaller scales (e.g. Brunetti & Jones, 2014). The energetic of the merger depends on the mass of the colliding clusters (e.g. Sarazin, 2002), thus the formation of observable levels of synchrotron emitting electrons is favored in massive systems. This is reflected in the observed steep correlation between radio halo power and cluster mass (e.g. Cassano et al., 2013) and in the observed increase of the occurrence of radio halos with the cluster mass (e.g. Cuciti et al., 2021b). Both these observational facts are probed for massive clusters ( ) and at GHz-frequencies.
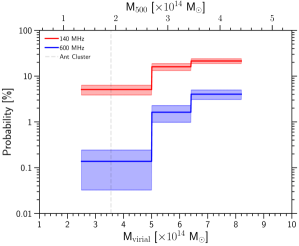
According to re-acceleration models, the occurrence of radio halos should increase at lower frequency especially for less massive systems due to the presence of ultra steep-spectrum radio halos (e.g. Cassano et al., 2006, 2010). As spectral steepening in radio halos makes it difficult to detect them at frequencies higher than the frequency at which the steepening becomes severe, one can assume that a radio halo can be successfully detected at a given frequency only when . To derive the expected probability to form a radio halo with a given we use the statistical model developed in Cassano & Brunetti (2005, see also ), which is based on a Monte Carlo approach to describe the merger history of galaxy clusters, to calculate the generation of turbulence, the particle acceleration, and the synchrotron spectrum during the cluster lifetime. In Fig. 3 we show the probability to form a radio halo as a function of the cluster mass, in the redshift range , with a steepening frequency MHz and MHz. We find that, for a cluster with a mass similar to that of the Ant Cluster, the probability to form a radio halo with steepening frequency MHz is 5% (red line), while it decreases down to a few per thousand for MHz (blue line), with a clear dependence on cluster mass. The large difference expected between the two fractions implies that a large number of these halos should have very steep radio spectra. The calculations assume a mean rms magnetic field average over the radio halo volume of G. Decreasing the magnetic field to G has only a small impact in the formation probability at 140 MHz (well within the reported uncertainties), while a more important decrement is expected at 600 MHz. These values have been chosen to be in line with the magnetic field strengths at G levels observed in galaxy clusters (e.g. Govoni & Feretti, 2004, for a review).
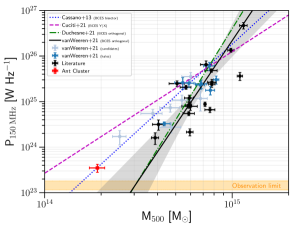
In Fig. 4 we plot the position of the Ant Cluster in the relation from van Weeren et al. (2020). The Ant Cluster is the least powerful radio halo observed to date, and lays in a region were we need to extrapolate the known relations. Its position on the diagram shows that with LOFAR we are entering in an unexplored regime of cluster mass. Only with the analysis of large statistical samples of clusters, taking into account possible selection effects (e.g. completeness in mass) and observational biases (e.g. sensitivity of radio observations), it will be possible to firmly constrain the slope of the relation.
Future X-ray and radio surveys performed with eROSITA (Predehl et al., 2021) and the Square Kilometer Array (SKA; Dewdney et al., 2009) are expected to discover many new low-mass clusters missed by previous instruments, allowing us to definitely enter into the study of non-thermal phenomena in this poorly explored regime of cluster mass.
4.2 Relic, Rim, and Patch
To the best of our knowledge, the Ant Cluster is the third cluster with an SZ-derived mass that hosts a radio relic (the others are A168, Dwarakanath et al. 2018; and A1904, van Weeren et al. 2020). The relic is located at a considerable distance from the cluster center ( 1.7 Mpc 2) and shows a mildly convex morphology (Fig. 1, top right panel). Relics are generally observed at Mpc from the cluster center (e.g. de Gasperin et al., 2014; Nuza et al., 2017) and have a concave morphology. The mildly convex curvature of the relic in the Ant Cluster is quite atypical, and may arise from the properties of the medium encountered by the shock front during its long propagation into the cluster outskirts. Many aspects of the formation mechanisms of radio relics are still uncertain, and the discovery of more relics with similar properties will help to refine the models (e.g. Brüggen & Vazza, 2020).
The classification of the Rim and Patch is still not clear. The Rim has an elongated morphology and higher surface brightness compared to the radio halo, possibly suggesting a radio relic nature. We note that this emission is projected within , where relics should be more unlikely to observed (Vazza et al., 2012). The Patch has a very low-surface brightness and potentially shows a trail of emission towards the cluster. However, the low-significance of the detection makes it hard to determine the exact morphology and whether or not it is associated with some optical counterpart. Still, its peripheral location and distance to the cluster center similar to that of the relic may suggest that also the Patch is tracing a radio relic. Obviously, this hypothesis is rather speculative at the moment and deeper, multi-frequency observations are required to understand its nature.
5 Conclusions
We have reported the discovery of a radio halo in PSZ2G145.92-12.53 (Ant Cluster) at using LOFAR observations at MHz carried out in the context of LoTSS. The halo occupies the central region of the cluster and its morphology follows that of the ICM thermal emission. Its radio power at 150 MHz of W Hz-1 and mass of make it the least powerful and least massive system hosting a radio halo known to date. Our observations show the potential of LOFAR to detect radio halos even in low-mass systems, where the probability to form them in the context of turbulent re-acceleration models is expected to be very low (5%). Future observations of statistical samples of clusters will allow us to test the model predictions and constrain the low-power and low-mass end of the relation.
Appendix A Images from LoTSS
In Fig. 5 we show the corresponding LoTSS images at and resolution of the FoV covered by the left panel of Fig. 1 as produced by the LOFAR Surveys Key Science Project team by running ddf-pipeline on the pointing P044+44. These images were obtained employing the third generation calibration and imaging algorithm described in Tasse et al. (2021). Thanks to the “extraction and re-calibration” method described in Section 2.1, we are able to: improve the calibration towards specific targets, perform fast and flexible re-imaging of the regions of interest, model and subtract discrete sources more carefully, and deeply deconvolve faint diffuse emission (see van Weeren et al., 2020, for more details).
References
- Bernardi et al. (2016) Bernardi, G., Venturi, T., Cassano, R., et al. 2016, MNRAS, 456, 1259
- Botteon et al. (2019) Botteon, A., Cassano, R., Eckert, D., et al. 2019, A&A, 630, A77
- Botteon et al. (2021) Botteon, A., Giacintucci, S., Gastaldello, F., et al. 2021, A&A, 649, A37
- Boxelaar et al. (2021) Boxelaar, J. M., van Weeren, R. J., & Botteon, A. 2021, A&C, 35, 100464
- Brüggen & Vazza (2020) Brüggen, M., & Vazza, F. 2020, MNRAS, 493, 2306
- Brunetti & Jones (2014) Brunetti, G., & Jones, T. W. 2014, IJMPD, 23, 30007
- Cassano & Brunetti (2005) Cassano, R., & Brunetti, G. 2005, MNRAS, 357, 1313
- Cassano et al. (2010) Cassano, R., Brunetti, G., Röttgering, H. J., & Brüggen, M. 2010, A&A, 509, A68
- Cassano et al. (2006) Cassano, R., Brunetti, G., & Setti, G. 2006, MNRAS, 369, 1577
- Cassano et al. (2013) Cassano, R., Ettori, S., Brunetti, G., et al. 2013, ApJ, 777, 141
- Cassano et al. (2019) Cassano, R., Botteon, A., Di Gennaro, G., et al. 2019, ApJ, 881, L18
- Condon et al. (1998) Condon, J., Cotton, W., Greisen, E., et al. 1998, AJ, 115, 1693
- Cuciti et al. (2015) Cuciti, V., Cassano, R., Brunetti, G., et al. 2015, A&A, 580, A97
- Cuciti et al. (2021a) —. 2021a, A&A, 647, A50
- Cuciti et al. (2021b) —. 2021b, A&A, 647, A51
- de Gasperin et al. (2014) de Gasperin, F., van Weeren, R. J., Brüggen, M., et al. 2014, MNRAS, 444, 3130
- de Gasperin et al. (2019) de Gasperin, F., Dijkema, T. J., Drabent, A., et al. 2019, A&A, 622, A5
- Dewdney et al. (2009) Dewdney, P., Hall, P., Schilizzi, R., & Lazio, T. J. W. 2009, IEEE Proceedings, 97, 1482
- Di Gennaro et al. (2021) Di Gennaro, G., van Weeren, R. J., Brunetti, G., et al. 2021, Nature Astron., 5, 268
- Duchesne et al. (2021) Duchesne, S. W., Johnston-Hollitt, M., Offringa, A. R., et al. 2021, PASA, 38, e010
- Dwarakanath et al. (2018) Dwarakanath, K., Parekh, V., Kale, R., & George, L. 2018, MNRAS, 477, 957
- Ebeling et al. (2002) Ebeling, H., Mullis, C., & Tully, R. 2002, ApJ, 580, 774
- Feretti et al. (2012) Feretti, L., Giovannini, G., Govoni, F., & Murgia, M. 2012, A&A Rev., 20, 54
- Ficarra et al. (1985) Ficarra, A., Grueff, G., & Tomassetti, G. 1985, A&AS, 59, 255
- Giacintucci et al. (2005) Giacintucci, S., Venturi, T., Brunetti, G., et al. 2005, A&A, 440, 867
- Giovannini et al. (2009) Giovannini, G., Bonafede, A., Feretti, L., et al. 2009, A&A, 507, 1257
- Govoni & Feretti (2004) Govoni, F., & Feretti, L. 2004, IJMPD, 13, 1549
- Hardcastle et al. (2021) Hardcastle, M. J., Shimwell, T. W., Tasse, C., et al. 2021, A&A, 648, A10
- Hlavacek-Larrondo et al. (2018) Hlavacek-Larrondo, J., Gendron-Marsolais, M.-L., Fecteau-Beaucage, D., et al. 2018, MNRAS, 475, 2743
- Hoang et al. (2019) Hoang, D. N., Shimwell, T. W., van Weeren, R. J., et al. 2019, A&A, 622, A21
- Hoang et al. (2021) Hoang, D. N., Shimwell, T. W., Osinga, E., et al. 2021, MNRAS, 501, 576
- Kale et al. (2013) Kale, R., Venturi, T., Giacintucci, S., et al. 2013, A&A, 557, A99
- Kale et al. (2015) —. 2015, A&A, 579, A92
- Murgia et al. (2009) Murgia, M., Govoni, F., Markevitch, M., et al. 2009, A&A, 499, 679
- Nuza et al. (2017) Nuza, S., Gelszinnis, J., Hoeft, M., & Yepes, G. 2017, MNRAS, 470, 240
- Offringa et al. (2014) Offringa, A. R., McKinley, B., Hurley-Walker, N., et al. 2014, MNRAS, 444, 606
- Osinga et al. (2021) Osinga, E., van Weeren, R. J., Boxelaar, J. M., et al. 2021, A&A, 648, A11
- Piffaretti et al. (2011) Piffaretti, R., Arnaud, M., Pratt, G., Pointecouteau, E., & Melin, J.-B. 2011, A&A, 534, A109
- Planck Collaboration XXIX (2014) Planck Collaboration XXIX. 2014, A&A, 571, A29
- Planck Collaboration XXVII (2016) Planck Collaboration XXVII. 2016, A&A, 594, A27
- Predehl et al. (2021) Predehl, P., Andritschke, R., Arefiev, V., et al. 2021, A&A, 647, A1
- Robitaille & Bressert (2012) Robitaille, T., & Bressert, E. 2012, APLpy: Astronomical Plotting Library in Python, Astrophysics Source Code Library, ,
- Rudnick & Lemmerman (2009) Rudnick, L., & Lemmerman, J. 2009, ApJ, 697, 1341
- Sarazin (2002) Sarazin, C. L. 2002, in Astrophysics and Space Science Library, Vol. 272, Merging Processes in Galaxy Clusters, ed. L. Feretti, I. Gioia, & G. Giovannini, 1–38
- Shimwell et al. (2017) Shimwell, T. W., Röttgering, H. J., Best, P. N., et al. 2017, A&A, 598, A104
- Shimwell et al. (2019) Shimwell, T. W., Tasse, C., Hardcastle, M. J., et al. 2019, A&A, 622, A1
- Tasse et al. (2021) Tasse, C., Shimwell, T. W., Hardcastle, M. J., et al. 2021, A&A, 648, A1
- van Haarlem et al. (2013) van Haarlem, M., Wise, M. W., Gunst, A., et al. 2013, A&A, 556, A2
- van Weeren et al. (2019) van Weeren, R. J., de Gasperin, F., Akamatsu, H., et al. 2019, Space Sci. Rev., 215, 16
- van Weeren et al. (2016) van Weeren, R. J., Williams, W. L., Hardcastle, M. J., et al. 2016, ApJS, 223, 2
- van Weeren et al. (2020) van Weeren, R. J., Shimwell, T. W., Botteon, A., et al. 2020, arXiv e-prints, arXiv:2011.02387
- Vazza et al. (2012) Vazza, F., Brüggen, M., van Weeren, R. J., et al. 2012, MNRAS, 421, 1868
- Venturi et al. (2003) Venturi, T., Bardelli, S., Dallacasa, D., et al. 2003, A&A, 402, 913
- Venturi et al. (2000) Venturi, T., Bardelli, S., Morganti, R., & Hunstead, R. W. 2000, MNRAS, 314, 594
- Venturi et al. (2007) Venturi, T., Giacintucci, S., Brunetti, G., et al. 2007, A&A, 463, 937
- Voges et al. (1999) Voges, W., Aschenbach, B., Boller, T., et al. 1999, A&A, 349, 389