Photoinduced modulation of the excitonic resonance
via coupling with coherent phonons in a layered semiconductor
Abstract
The coupling of excitons with atomic vibrations plays a pivotal role on the nonequilibrium optical properties of layered semiconductors. However, addressing the dynamical interaction between excitons and phonons represents a hard task both experimentally and theoretically. By means of time-resolved broadband optical reflectivity combined with state-of-the-art ab-initio calculations of a bismuth triiodide single crystal, we unravel the universal spectral fingerprints of exciton–phonon coupling in layered semiconductors. Furthermore, we microscopically relate a photoinduced coherent energy modulation of the excitonic resonance to coherent optical phonons, thereby tracking the extent of the photoinduced atomic displacement in real-space. Our findings represent a step forward on the road to coherent manipulation of the excitonic properties on ultrafast timescales.
Electron–phonon coupling is among the fundamental interactions in condensed matter which govern the nonequilibrium optoelectronic properties of materials by, for instance, guiding the relaxation dynamics of quasiparticles Allen (1987); Sangiovanni et al. (2006); Bauer et al. (2015); Sjakste et al. (2018) and assisting nonthermally-driven electronic phase transitions Hellmann et al. (2012); Porer et al. (2014); Maklar et al. (2021). In semiconductors, the electron–hole Coulomb interaction also plays a crucial role in allowing the formation of bound states (excitons) upon photoabsorption. The binding energy of excitons is usually of a few meV, making them unstable at room temperature and difficult to be detected. However, in layered semiconductors, the reduced dielectric screening strongly enhances the exciton binding energy up to several hundreds of meV Hüser et al. (2013). This fact, together with the technological relevance of layered materials, is triggering enormous research efforts in capturing exciton dynamics on the femto- to picoseconds timescale Carvalho et al. (2015); Paleari et al. (2019); Trovatello et al. (2020); Li et al. (2021); Brem et al. (2020); Chen et al. (2020). Recently, exciton–phonon coupling has been proposed to impact on not only the incoherent carrier-cooling dynamics, but also the homogeneous linewidth of the excitonic luminescence, and even the diffusion and the coherence length of excitons Molina-Sánchez et al. (2017); Chen et al. (2020).
While access to these complex dynamics can be a great challenge from experimentally and theoretically, their understanding and control is of paramount interest for the technological progress, as well as from a break-through knowledge perspective. Experimentally, resonant Raman scattering spectroscopy is among the most common techniques to address exciton–phonon coupling Ganguly and Birman (1967); Miranda et al. (2017). However, the exciton dynamics remains out of reach due to the lack of temporal resolution. Time-resolved optical spectroscopy is the most suitable tool to investigate the interaction between excitons and phonons in the ultrafast time domain. By measuring transient changes in the optical polarization, the technique provides macroscopic snapshots of the nonequilibrium behavior of the system. On the theoretical side, ab-initio calculations of the exciton–phonon coupling combines density-functional-perturbation theory for the electron–phonon matrix elements Giustino (2017), with the Bethe–Salpeter Equation (BSE), which correctly describes the excitonic physics Onida et al. (1995). Such scheme has been recently developed and applied to two-dimensional materials Cudazzo (2020); Chen et al. (2020) to compute exciton–phonon lifetimes. An alternative approach computes the excitonic properties solving the BSE within the GW approximation both at equilibrium and with the atoms displaced along specific phonon modes Trovatello et al. (2020). This method further enables an estimate of atomic displacements with exceptionally high spatial resolution on the sub-picometer scale Katsuki et al. (2013).
In this Letter, by combining time-resolved broadband optical reflectivity measurements with state-of-the-art spinorial ab-initio–BSE calculations Marsili et al. (2021), we unveil the spectral fingerprints of exciton–phonon coupling in a representative van-der-Waals-layered semiconductor, the bismuth tri-iodide (BiI3) single crystal. Recently, BiI3 has come into focus as an efficient non-toxic replacement of lead-based perovskites in optoelectronic applications Lehner et al. (2015); Shi et al. (2017). The absorption spectrum is dominated by a direct excitonic resonance at 620 nm (2.00 eV) owing lifetime of nanoseconds and binding energy of hundreds of meV Kaifu (1988). Such large binding energy in a bulk semiconductor is a rather unique feature. Resonant Raman scattering combined with luminescence Nila et al. (2017); Saitoh et al. (2000); Karasawa et al. (1981) have identified an interaction between excitons and the main Ag vibrational mode at 3.4 THz (113 cm-1) Tiwari et al. (2018). More recently, transient absorption of spin-coated thin films of BiI3 suggested that coherent optical phonons and excitons should be coupled in the ultrafast time domain Scholz et al. (2018). All these aspects make BiI3 an ideal playground to explore the photophysics of exciton–phonon coupling in semiconductors. However, both the spectral fingerprint of the coupling and its impact on the exciton and phonon dynamics has remained elusive until now, likely due to the difficulty in providing univocal proof both experimentally and theoretically.
Here, we provide evidences that exciton–phonon coupling sets in at the photoexcitation time and triggers a coherent modulation of the excitonic resonance of BiI3. The displacive photoexcitation of coherent optical phonons produces oscillations of the transient reflectivity which are enhanced by almost one order of magnitude at wavelengths close to the excitonic resonance. Moreover, the exciton energy varies periodically within a few picoseconds, in phase with the coherently-generated atomic vibrations. This is captured by retrieving the initial phase of the coherent phonon amplitude across the exciton wavelength and monitoring the energy shift of the excitonic peak. The ab-initio calculations corroborate that all observations are univocal and universal fingerprints of exciton–phonon coupling. Moreover, our joint experimental and theoretical approach provides a unique tool to address exciton–phonon coupling in real space by retrieving the extent of the atomic displacement responsible for the coherent modulation of the excitonic resonance.
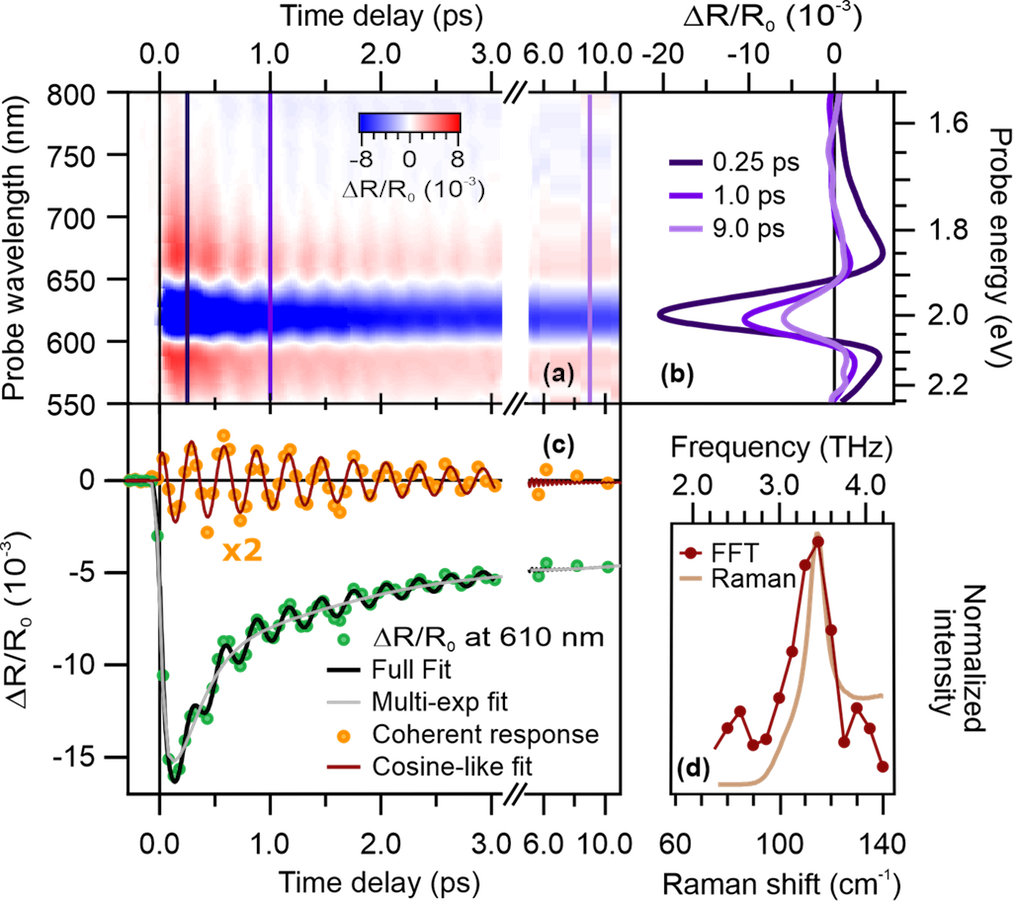
The photoinduced transient reflectivity change, , is shown as color scale in Fig. 1(a) as a function of probe wavelength (left axis), probe photon energy (right axis), and pump-probe time delay (top axis). The measurement is carried out at room temperature and the pump photon energy is 2.78 eV (445 nm), well above the band gap of BiI3. This enables the excitation of el/cm3 quasi-free carriers into the conduction bands Sup . At positive time delays, i.e. after photoexcitation, a pronounced negative (blue) signal with minimum at 620 nm (2.00 eV) indicates a transient decrease of reflectivity () in the spectral range of the excitonic resonance. Above and below this spectral region, the signal is positive (red), as the transient reflectivity increases (). The temporal evolution of both the negative and positive spectral features is emphasized by the spectra reported in Fig. 1(b) for selected time delays. At all probe wavelengths, this incoherent optical response is superimposed by a periodic intensity modulation (see, e.g. the coherent response at 610 nm in Fig. 1(c)) resulting from the generation of coherent optical phonons by the pump pulse.
The transient reflectivity signal at each wavelength is fitted by a sum of four exponentially-decaying functions (incoherent optical response) and an exponentially-decaying cosine function (coherent optical response) convoluted with a Gaussian function (pump-pulse cross-correlation) Sup . Fig. 1(c) shows the fit (black line) for the data at 610 nm (green circles). The gray line is the multi-exponential fit contribution to the incoherent optical response, only. At all wavelengths, we find that the latter decays through multiple relaxation channels with time constants on the order of 200 fs, few picoseconds, hundreds of picoseconds and 1.5 ns, respectively. These values agree with previous measurements of the transient absorption of spin-coated BiI3 thin films Scholz et al. (2018) and the luminescence of BiI3 single crystals Brandt et al. (2015). Accordingly, we assign the fastest dynamics to carrier-carrier scattering, and the two intermediate dynamics to electron–phonon scattering processes and the beginning of electron-hole recombination. The slowest dynamics exceed the investigated temporal window and its time constant has been hold during the fitting procedure to the literature value Brandt et al. (2015) of the electron-hole radiative recombination process.
After subtraction of the multi-exponential fit component (gray line in Fig. 1(c)), the coherent optical response (orange circles) is retrieved. Its fast Fourier transform (FFT, red circles in Fig. 1(d)) reveals an oscillation at 3.41 0.02 THz matching the frequency of the Ag phonon mode (light brown line) Tiwari et al. (2018). Moreover, the oscillation intensity is damped, on average, within 1.860 0.075 ps, which provides the dephasing time of the coherent phonons.
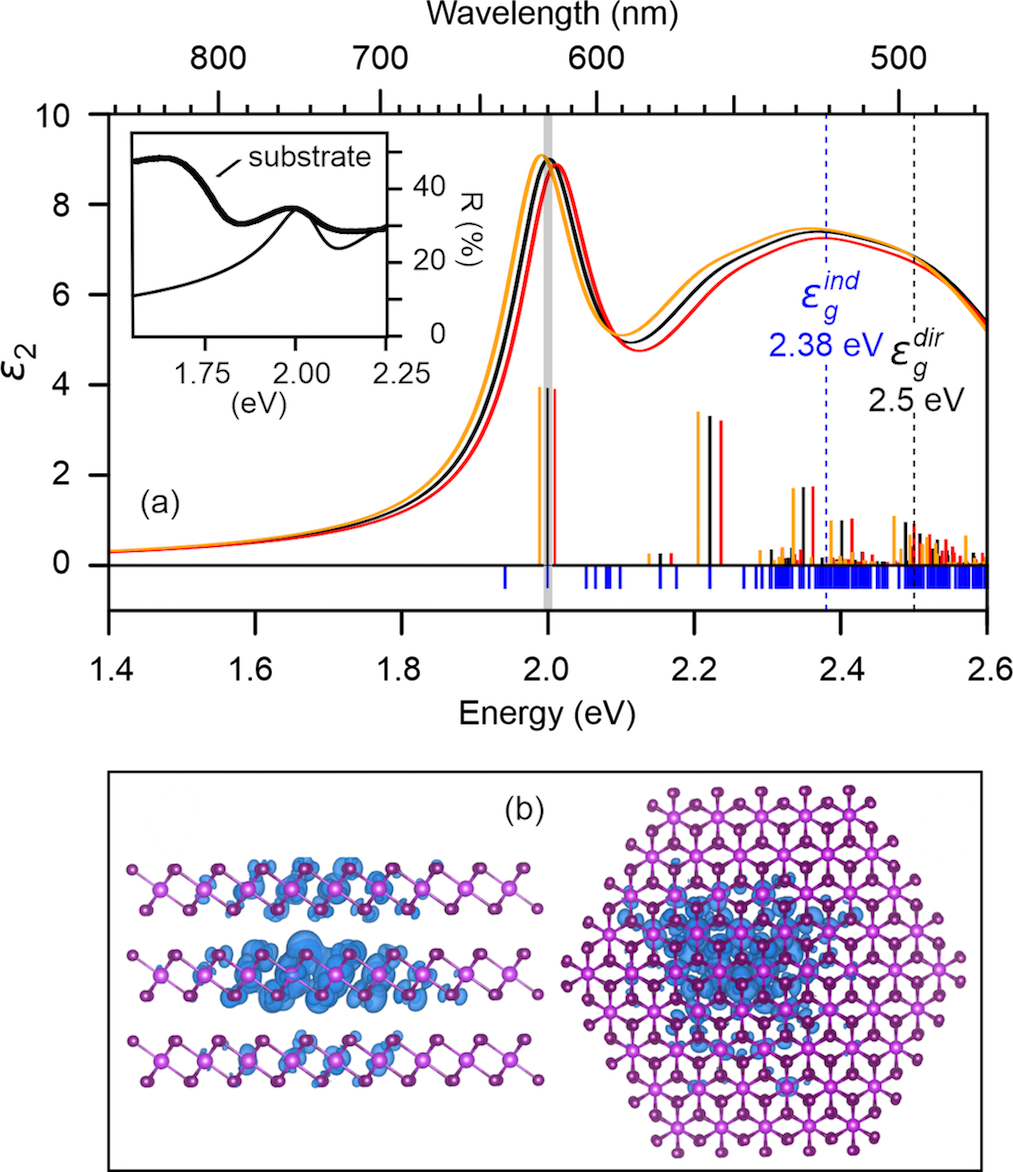
To shed light on the nature of the transient optical response, we perform numerical analysis of the optical properties of BiI3 via ab-initio simulations within the GW+BSE scheme Sup . As shown in Fig. 2(a), the imaginary part of the dielectric function is dominated, in the optical region investigated in our measurements, by an excitonic peak with binding energy of 500 meV 111The exciton binding energy reported in the literature is 160-180 meV Kaifu (1988). Such estimate is based on the Hydrogen model accounting for the macroscopic screening. Present calculations account for both macroscopic and microscopic screening effects.. Such large binding energy is consistent with the strong in-plane localization of the exciton wavefunction Habe and Nakamura (2021) shown in the real-space representation of Fig. 2(b). The computed reflectivity spectrum, (thin line in inset of Fig. 2(a)) exhibits a resonance at the energy of the excitonic peak. To match with the experimental reflectance spectrum (thick line), the calculated peaks are shifted here by 0.35 eV. Thus, our calculations clearly show that the optical reflectivity is mostly dominated by the imaginary part of the dielectric function, in agreement with previous works Jellison et al. (1999); Podraza et al. (2013). We then interpret the incoherent optical response as follows: the negative peak at 620 nm (2.00 eV) is assigned to the pump-induced photobleaching of the excitonic resonance; the positive signal at shorter and longer wavelengths to a combination of photoabsorption between transiently excited states, screening-induced optical gap renormalization Scholz et al. (2018), and increase of the exciton linewidth.
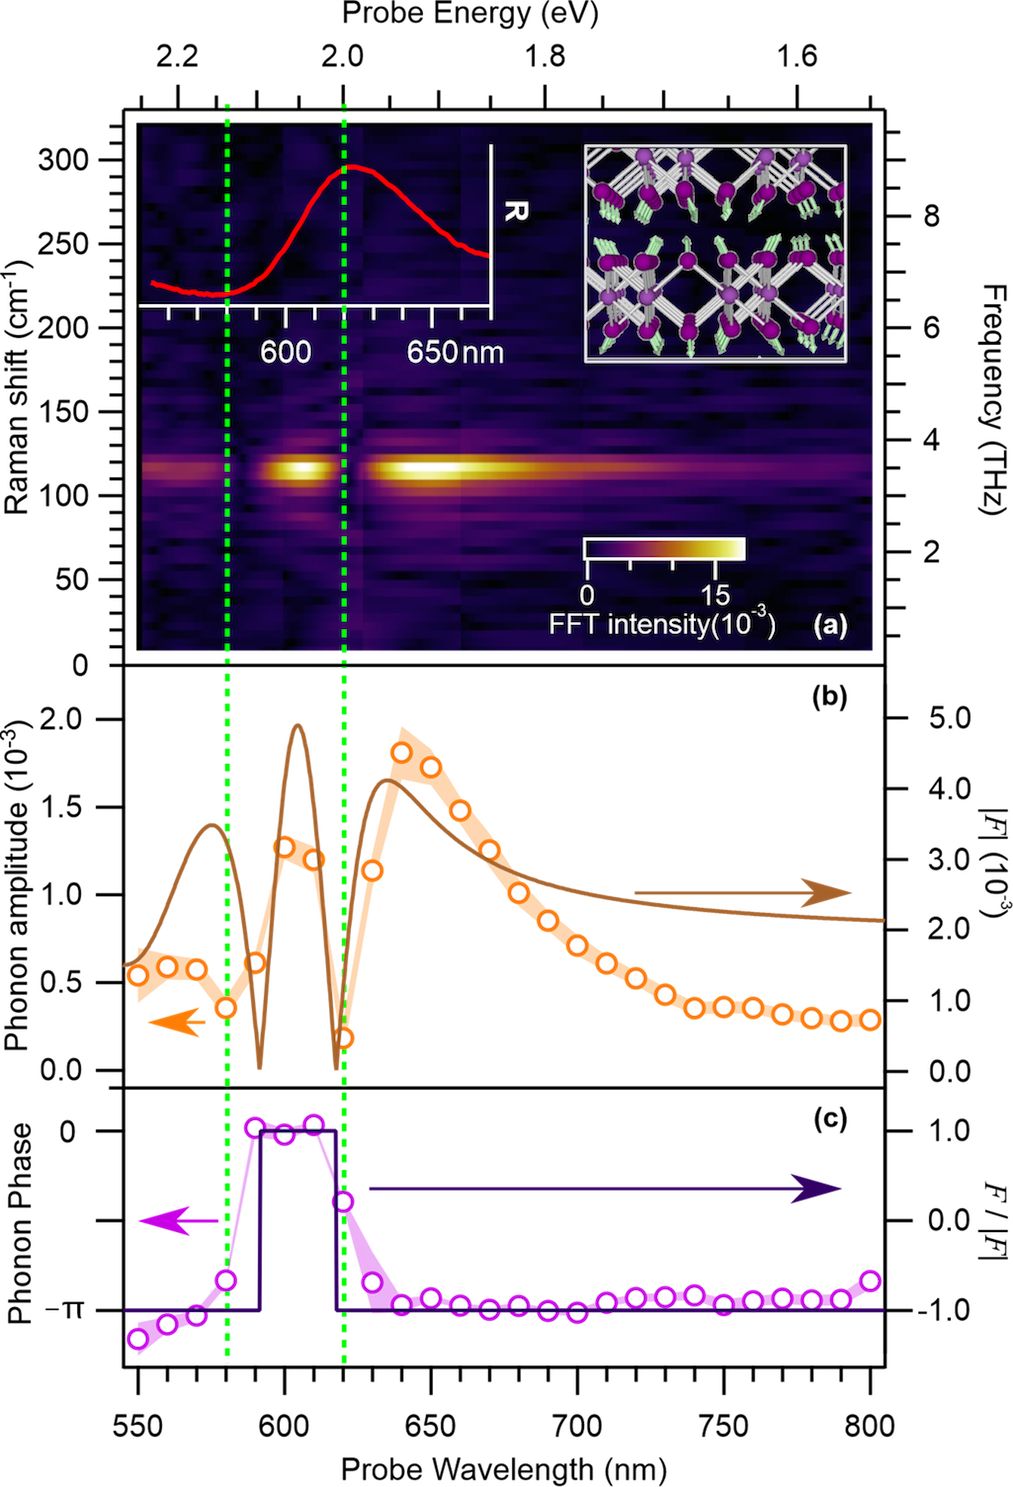
We now focus on the bare coherent optical response of BiI3. The frequency-resolved coherent optical phonon spectrum is obtained by FFT at each probe wavelength and plotted in color scale in Fig. 3(a). It exhibits one intense feature centered at 3.41 0.02 THz, i.e. at the frequency of the Ag phonon mode whose calculated real-space representation is depicted in inset. A closer look at the FFT-spectrum intensity reveals two peculiarities: an enhancement in the exciton-wavelength region and a quenching at 580 nm (2.14 eV) and 620 nm (2.00 eV). We argue that both the enhancement and the quenching of the phonon intensity are unambiguous markers for exciton–phonon coupling in photoexcited semiconductors.
The fit parameters of the initial phonon amplitude and phase are plotted on the left axes of Fig. 3(b) and (c), respectively. The corresponding ab-initio quantities are explicitly calculated and reported on the right axis for direct comparison. As a first result, the phonon phase indicates, at all wavelengths, a cosine-like oscillation of the atoms around their equilibrium position. We deduce that coherent optical phonons are generated via a displacive excitation mechanism, consistent with the full symmetry of the Ag vibrational mode and the absorptive excitation regime of our experiment Cheng et al. (1991); Zeiger et al. (1992); Ishioka et al. (2006); Ishioka and Misochko (2010).
The calculated amplitude and phase are obtained as follows. First, the GW+BSE reflectivity is re-computed with the atoms displaced by an amount along the direction of the eigenvector of the Ag phonon mode (green arrows, inset of Fig. 3(a)). Assuming that the atoms oscillates according to , we obtain the reflectivity, , and thus the reflectivity variation, , for distinct positions of the displaced atoms. We find that the atomic displacement induces opposite changes in the band gap and the exciton binding energy, respectively, resulting in a total shift of the excitonic peak, . The overall picture is of an excitonic resonance that oscillates back and forth in energy as shown in Fig. 2(a) (yellow and red spectra).
We now compare the calculated and with the measured initial amplitude and phase of the coherent optical response, respectively. Clearly, both quantities confirm the amplitude enhancement as well as the two nodes at the wavelengths of the -phase shift. The node at the exciton wavelength (620 nm) is due to opposite sign of the reflectivity variation generated by the shift of the excitonic peak. Concerning the other node, a bunch of excitons with strong exciton–phonon coupling is found to produce a broad peak centered at 525 nm (2.35 eV). Thus, the second node at 580 nm results from the combination of the displacements of the two excitonic peaks. All-in-all, we provide unambiguous proof of coupling between coherently activated Ag phonons and excitons. Furthermore, by exploiting the excellent agreement between theory and experiment, we provide a quantitative estimate of the photoinduced atomic displacement and the associated energy shifts. An intensity variation of the coherent optical response on the order of is obtained in the simulations upon atomic displacement in the range of picometers. In turn, the excitonic peak is predicted to shift by meV.
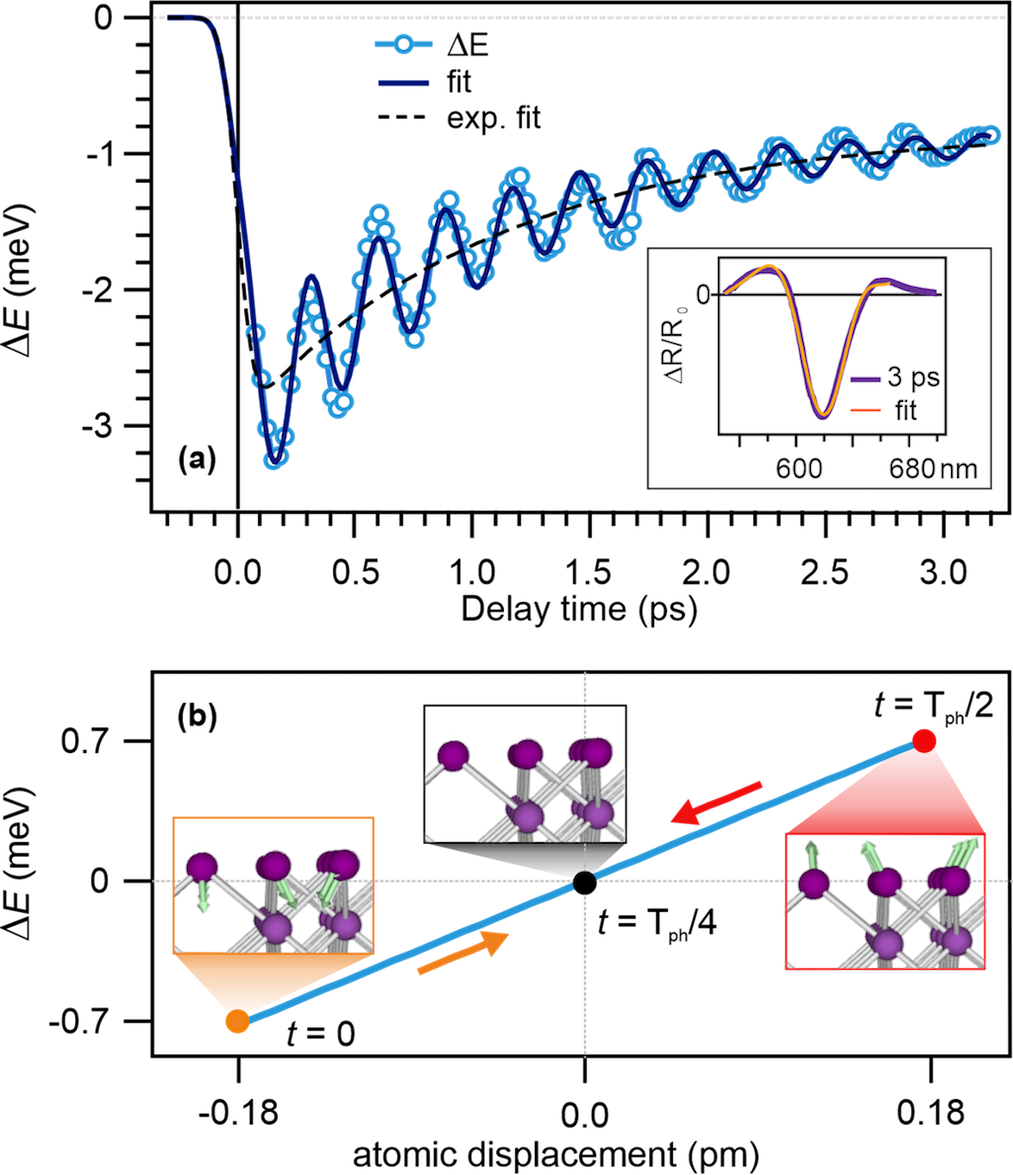
To unravel the impact of exciton–phonon coupling on the dynamics of the excitonic resonance, we follow the transient energy position of the excitonic peak. This is obtained by differential fitting of the transient reflectivity spectra (inset of Fig. 4(a)) after parametrization of the equilibrium reflectance with a set of Gaussian functions (see Sup for details). Fig. 4(a) reports the energy shift, , from the equilibrium position of the Gaussian peak accounting for the excitonic resonance (blue circles). The evaluated temporal window spans up to a few picoseconds to cover the phonon dephasing time. Upon photoexcitation, the excitonic resonance undergoes an instantaneous redshift (within the pump-pulse crosscorrelation) followed by a blueshift towards the equilibrium position. The latter evolves on a fast timescale of 1.110 0.075 ps (dashed line), and a slower one that exceeds the evaluated temporal window and is accounted in the fit by an additional offset. The blueshift is superimposed by a periodic energy modulation at the exact frequency of the Ag-phonon mode, damped on a timescale of 1.420 0.075 ps. Both the red- and blueshifts are rather common in photoexcited semiconductors and typically relate to band-gap renormalization Pagliara et al. (2011); Chernikov et al. (2015); Pogna et al. (2016); Mor et al. (2017) and exciton-binding-energy changes Cunningham et al. (2017); Jiang et al. (2018) induced by dynamical screening, and conduction-band filling by photoexcited carriers Ullrich et al. (2014); Franceschini et al. (2020); Jnawali et al. (2020). Conversely, the coherent modulation of the excitonic resonance has been rarely observed in the photoinduced dynamics of semiconductors with strong exciton–phonon coupling. We explain this fact by noting that a suitable intensity ratio of the coherent and incoherent optical response is required in order to avoid the exciton energy modulation to be buried underneath the photobleaching spectral intensity, as reported, for instance, in Trovatello et al. (2020). Our measurements indicate that such ratio is on the order of 1:10 and is achieved by off-resonance photoexcitation with energy above the optical band gap in order to retain from too intense photobleaching of the excitonic resonance.
The periodic modulation of the excitonic peak exhibits an initial amplitude of 0.7 meV 222We note that a periodic modulation of the transient reflectivity minimum is already visible by eye. The high statistics of our transient reflectivity data allows us to resolve relative energy shifts of only few tens of meV which are robust against the choice of fit analysis. reproduced by the simulation with an atomic displacement of 0.18 pm (see Fig. 4(b)). The corresponding reflectivity variation is on the expected order of , differing only by a factor of form the measured phonon amplitude at the respective probe wavelengths (see Fig. 3(b)). All these findings demonstrate that tracking the energy modulation of the excitonic resonance induced by coherent phonons enables to trace atomic displacements along the direction of the phonon mode. Effectively, our combined experimental and theoretical approach successfully addresses the coherent phonon dynamics coupled to the exciton in real-space with sub-picometer resolution.
In conclusion, the amplitude enhancement and phase shift of the coherent phonon are established as univocal spectral fingerprints of exciton–phonon coupling. We prove that the excitonic resonance of the layered semiconductor BiI3 can be optically modulated via coupling of coherent atomic vibrations of which we are able to estimate the spatial extent with sub-picometer resolution. Noteworthly, the present results can be extended to any photoexcited semiconductor with the exciton strongly coupled to a lattice deformation. As a perspective, we propose that ultrafast modulation of excitonic resonances could be experimentally controlled by varying the laser fluence or tuning the pump photon energy across the exciton transition, paving the way towards optical control of the nonequilibrium optoelectronic properties of low-dimensional semiconductors.
Acknowledgements
S.P., L.S. and C.G. acknowledge partial support from D.1 and D.2.2 grants of the Universitá Cattolica del Sacro Cuore. C.G. and P.F. acknowledge financial support from MIUR through the project CENTRAL (Prot. 20172H2SC4_005) within the PRIN 2017 program. D.S. acknowledges the funding received from MIUR PRIN BIOX Grant No. 20173B72NB, and from the European Union projects: MaX Materials design at the eXascale H2020-INFRAEDI-2018-2020, Grant agreement No.824143; Nanoscience Foundries and Fine Analysis - Europe H2020-INFRAIA-2014-2015, Grant agreement No. 654360.
References
References
- Allen (1987) P. B. Allen, Phys. Rev. Lett. 59, 1460 (1987).
- Sangiovanni et al. (2006) G. Sangiovanni, M. Capone, and C. Castellani, Phys. Rev. B 73, 165123 (2006).
- Bauer et al. (2015) M. Bauer, A. Marienfeld, and M. Aeschlimann, Progress in Surface Science 90, 319 (2015), ISSN 0079-6816.
- Sjakste et al. (2018) J. Sjakste, K. Tanimura, G. Barbarino, L. Perfetti, and N. Vast, Journal of Physics: Condensed Matter 30, 353001 (2018).
- Hellmann et al. (2012) S. Hellmann, T. Rohwer, M. Kalläne, K. Hanff, C. Sohrt, A. Stange, A. Carr, M. Murnane, H. Kapteyn, L. Kipp, et al., Nat. Comm. 3 (2012).
- Porer et al. (2014) M. Porer, U. Leierseder, J.-M. Ménard, H. Dachraoui, L. Mouchliadis, I. E. Perakis, U. Heinzmann, J. Demsar, K. Rossnagel, and R. Huber, Nat. Mat. 13 (2014).
- Maklar et al. (2021) J. Maklar, Y. W. Windsor, C. W. Nicholson, M. Puppin, P. Walmsley, V. Esposito, M. Porer, J. Rittmann, D. Leuenberger, M. Kubli, et al., Nat. Comm. 12 (2021)-.
- Hüser et al. (2013) F. Hüser, T. Olsen, and K. S. Thygesen, Phys. Rev. B 88, 245309 (2013).
- Carvalho et al. (2015) B. R. Carvalho, L. M. Malard, J. M. Alves, C. Fantini, and M. A. Pimenta, Phys. Rev. Lett. 114, 136403 (2015).
- Paleari et al. (2019) F. Paleari, H. P. C. Miranda, A. Molina-Sánchez, and L. Wirtz, Phys. Rev. Lett. 122, 187401 (2019).
- Trovatello et al. (2020) C. Trovatello, H. P. C. Miranda, A. Molina-Sánchez, R. Borrego-Varillas, C. Manzoni, L. Moretti, L. Ganzer, M. Maiuri, J. Wang, D. Dumcenco, et al., ACS Nano 14, 5700 (2020).
- Li et al. (2021) D. Li, C. Trovatello, S. Dal Conte, M. Nuß, G. Soavi, G. Wang, A. C. Ferrari, G. Cerullo, and T. Brixner, Nat. Comm. 12, 954 (2021), ISSN 2041-1723.
- Brem et al. (2020) S. Brem, A. Ekman, D. Christiansen, F. Katsch, M. Selig, C. Robert, X. Marie, B. Urbaszek, A. Knorr, and E. Malic, Nano Lett. 20, 2849 (2020).
- Chen et al. (2020) H.-Y. Chen, D. Sangalli, and M. Bernardi, Phys. Rev. Lett. 125, 107401 (2020).
- Molina-Sánchez et al. (2017) A. Molina-Sánchez, D. Sangalli, L. Wirtz, and A. Marini, Nano Letters 17, 4549 (2017).
- Ganguly and Birman (1967) A. K. Ganguly and J. L. Birman, Phys. Rev. 162, 806 (1967).
- Miranda et al. (2017) H. P. C. Miranda, S. Reichardt, G. Froehlicher, A. Molina-Sánchez, S. Berciaud, and L. Wirtz, Nano Lett. 17 (2017), ISSN 1530-6984.
- Giustino (2017) F. Giustino, Rev. Mod. Phys. 89, 015003 (2017).
- Onida et al. (1995) G. Onida, L. Reining, R. W. Godby, R. Del Sole, and W. Andreoni, Phys. Rev. Lett. 75, 818 (1995).
- Cudazzo (2020) P. Cudazzo, Phys. Rev. B 102, 045136 (2020).
- Katsuki et al. (2013) H. Katsuki, J. C. Delagnes, K. Hosaka, K. Ishioka, H. Chiba, E. S. Zijlstra, M. E. Garcia, H. Takahashi, K. Watanabe, M. Kitajima, et al., Nat. Comm. 4, 2801 (2013).
- Marsili et al. (2021) M. Marsili, A. Molina-Sánchez, M. Palummo, D. Sangalli, and A. Marini, Phys. Rev. B 103, 155152 (2021).
- Lehner et al. (2015) A. J. Lehner, H. Wang, D. H. Fabini, C. Liman, C. Hébert, E. Perry, G. Wang, M. Bazan, M. Chabinyc, and R. Seshadri, Appl. Phys. Lett. 107, 131109 (2015).
- Shi et al. (2017) Z. Shi, J. Guo, Y. Chen, Q. Li, Y. Pan, H. Zhang, Y. Xia, and W. Huang, Adv. Mater. 29, 1605005 (2017).
- Kaifu (1988) Y. Kaifu, Journal of Luminescence 42, 61 (1988).
- Nila et al. (2017) A. Nila, A. Matea, M. Baibarac, and I. Baltog, Journal of Luminescence 182.
- Saitoh et al. (2000) A. Saitoh, T. Komatsu, and T. Karasawa, Journal of Luminescence 87-89.
- Karasawa et al. (1981) T. Karasawa, T. Komatsu, K. Miyata, T. Iida, and Y. Kaifu, Physica B+C 105, 88 (1981).
- Tiwari et al. (2018) D. Tiwari, D. Alibhai, and D. J. Fermin, ACS Energy Lett. 3, 1882 (2018).
- Scholz et al. (2018) M. Scholz, K. Oum, and T. Lenzer, Phys. Chem. Chem. Phys. 20, 10677 (2018).
- (31) See Supplemental Material at [URL will be inserted by publisher].
- Brandt et al. (2015) R. E. Brandt, R. C. Kurchin, R. L. Z. Hoye, J. R. Poindexter, M. W. B. Wilson, S. Sulekar, F. Lenahan, P. X. T. Yen, V. Stevanovi, J. C. Nino, et al., J. Phys. Chem. Lett. 6, 4297 (2015).
- Habe and Nakamura (2021) T. Habe and K. Nakamura, Phys. Rev. B 103, 115409 (2021).
- Jellison et al. (1999) G. E. Jellison, J. O. Ramey, and L. A. Boatner, Phys. Rev. B 59, 9718 (1999).
- Podraza et al. (2013) N. J. Podraza, W. Qiu, B. B. Hinojosa, H. Xu, M. A. Motyka, S. R. Phillpot, J. E. Baciak, S. Trolier-McKinstry, and J. C. Nino, J. Appl. Phys. 114, 033110 (2013).
- Cheng et al. (1991) T. K. Cheng, J. Vidal, H. J. Zeiger, G. Dresselhaus, M. S. Dresselhaus, and E. P. Ippen, Appl. Phys. Lett. 59, 1923 (1991).
- Zeiger et al. (1992) H. J. Zeiger, J. Vidal, T. K. Cheng, E. P. Ippen, G. Dresselhaus, and M. S. Dresselhaus, Phys. Rev. B 45, 768 (1992).
- Ishioka et al. (2006) K. Ishioka, M. Kitajima, and O. V. Misochko, Journal of Applied Physics 100. 093501 (2006).
- Ishioka and Misochko (2010) K. Ishioka and O. V. Misochko, Coherent Lattice Oscillations in Solids and Their Optical Control (Springer Berlin Heidelberg, Berlin, Heidelberg, 2010), pp. 23–46, ISBN 978-3-642-03825-9.
- Pagliara et al. (2011) S. Pagliara, G. Galimberti, S. Mor, M. Montagnese, G. Ferrini, M. S. Grandi, P. Galinetto, and F. Parmigiani, J. Am. Chem. Soc. 133, 6318 (2011).
- Chernikov et al. (2015) A. Chernikov, C. Ruppert, H. Hill, A. F. Rigosi, and T. F. Heinz, Nat. Photonics 9, 466 (2015).
- Pogna et al. (2016) E. A. A. Pogna, M. Marsili, D. De Fazio, S. Dal Conte, C. Manzoni, D. Sangalli, D. Yoon, A. Lombardo, A. C. Ferrari, A. Marini, et al., ACS Nano 10, 1182 (2016).
- Mor et al. (2017) S. Mor, M. Herzog, D. Golež, P. Werner, M. Eckstein, N. Katayama, M. Nohara, H. Takagi, T. Mizokawa, C. Monney, et al., Phys. Rev. Lett. 119, 086401 (2017).
- Cunningham et al. (2017) P. D. Cunningham, A. T. Hanbicki, K. M. McCreary, and B. T. Jonker, ACS Nano 11, 12601 (2017).
- Jiang et al. (2018) T. Jiang, R. Chen, X. Zheng, Z. Xu, and Y. Tang, Opt. Express 26, 859 (2018).
- Ullrich et al. (2014) B. Ullrich, H. Xi, and J. S. Wang, J. Appl. Phys. 115, 233503 (2014).
- Franceschini et al. (2020) P. Franceschini, L. Carletti, A. P. Pushkarev, F. Preda, A. Perri, A. Tognazzi, A. Ronchi, G. Ferrini, S. Pagliara, F. Banfi, et al., ACS Nano 14, 13602 (2020).
- Jnawali et al. (2020) G. Jnawali, Y. Xiang, S. M. Linser, I. A. Shojaei, R. Wang, G. Qiu, C. Lian, B. M. Wong, W. Wu, P. D. Ye, et al., Nat. Comm. 11 (2020).