Discovery of Carbon Monoxide in Distant Comet C/2017 K2 (PANSTARRS)
Abstract
Optical observations of the Oort cloud comet C/2017 K2 (PANSTARRS) show that its activity began at large heliocentric distances (up to 35 au), which cannot be explained by either the sublimation or the crystallization of water ice. Supervolatile sublimation, most likely of carbon monoxide (CO), has been proposed as a plausible driver of the observed mass loss. Here, we present the detection of the J = 21 rotational transition in outgassed CO from C/2017 K2 when at heliocentric distance = 6.72 au, using the James Clerk Maxwell Telescope. The CO line is blue-shifted by 0.200.03 km s-1 with an area and width of 8.32.3 mK km s-1 and 0.08 km s-1, respectively. The CO production rate is s-1. These are the first observations of a gaseous species in C/2017 K2 and provide observational confirmation of the role of supervolatile sublimation in this comet.
Subject headings:
comets: individual, Oort Cloud, radio lines: solar system: formation1. Introduction
Comets are primitive objects, composed of refractory solids and ices, which are well-preserved relic planetesimals since the early Solar system. In the heat of the Sun, comets develop comae and/or tails when entering the inner Solar system. Most active comets are detected within the orbit of Jupiter, where the temperature is high enough for water ice, the major cometary volatile, to sublimate. However, a number of comets exhibit distant activity well beyond 5 au. The mechanism for this distant activity is not clear. Suggested scenarios include, the sublimation of supervolatiles (e.g. CO and CO2), the crystallization of amorphous water ice (Prialnik et al., 2004), and chemical reactions involving unstable radicals created by cosmic ray bombardment (Donn & Urey, 1956; Rettig et al., 1992). As pointed out by Roemer (1962), our physical understanding of comets mostly comes from observing cometary activity at moderately small heliocentric distances within 5 au. The characterization of distant comets, though challenging, provides important information about the formation conditions of comets in the Solar protoplanetary disk, such as the dynamics, collisions, physical and chemical processes (Meech & Hainaut, 2001).
C/2017 K2 (PANSTARRS) (hereafter K2) is an Oort cloud comet on its way to perihelion, expected at heliocentric distance = 1.80 au in late 2022. It was discovered at = 16 au (Wainscoat et al., 2017), then later identified in prediscovery images at = 24 au (Jewitt et al., 2017; Hui et al., 2018), and activity is inferred to have begun at 35 au (Jewitt et al., 2021). The early detection of K2 when in the outer solar system offers the unprecedented opportunity to examine the development of activity in a comet arriving from near-interstellar temperatures.
The barycentric semimajor axis, eccentricity and inclination of K2 are = 20,000 au, = 0.9998 and = 87.5 deg, respectively (Królikowska & Dybczyński, 2018). These orbital parameters qualify K2 as a long-period (Oort cloud) comet, albeit one that is not strictly dynamically new. Nevertheless, with orbit period 3 Myr, the previous perihelion occurred so long ago that the nucleus can retain no heat, and it is appropriate to consider K2 as arriving from both Oort cloud distances (aphelion is at 40,000 au) and temperatures ( 10 K). The observed activity is a response to contemporaneous heating by the Sun.
Optical observations of the dust coma reveal a number of distinguishing characteristics. The coma is massive, with an appearance dominated by large (submillimeter and larger) particles ejected slowly (speeds 4 m s-1 (Jewitt et al., 2017, 2019, 2021; Hui et al., 2018) even in the earliest observations. The dust production is in steady state (on the coma residence timescale) but rises as the heliocentric distance falls, in proportion to , with an estimated value 10 kg s-1 at 10 au, where is the mean dust particle radius in millimeters (Jewitt et al., 2021).
The rotational lines of CO are intrinsically weak due to the small dipole moment of this molecule. Nevertheless, the 230.5 GHz CO J(2-1) line has been detected in several comets at distances too large, and temperatures too low, for the activity to be caused by the thermodynamics of water ice. For example, CO is strong in 29P/Schwassmann-Wachmann 1, which has a nearly circular orbit at 6 au (Senay & Jewitt, 1994). The CO line was discovered in comet C/1995 O1 (Hale-Bopp) when inbound at = 6.76 au (Jewitt et al., 1996) and was followed out to = 14 au (Biver et al., 2002). For this reason, and given the substantial activity indicated by the optical observations, we undertook to search for rotational emission lines from CO in comet K2.
2. Observations and Data Reduction
Observations were taken at the James Clerk Maxwell Telescope (JCMT) on Mauna Kea, Hawaii. We obtained 8 hours of integration on K2. A journal of these observations is provided in Table 1. We used the newly commissioned heterodyne instrument Nāmakanui with its 230-GHz `Ū`ū receiver. The half-power beam-width of `Ū`ū is 2041 at 230 GHz, while the main-beam efficiency is about 0.6. The ephemeris of K2 is known to be better than 1″, small compared to the beam size. For this reason, and because cometary emission is highly concentrated around the nucleus, we integrated on a single position (i.e. 11 grid) with beam-switching (180 arcsec) sample mode. The observations were taken under good atmospheric conditions with 225 GHz opacity in the range 0.04 to 0.08 (Table 1).
The ACSIS spectrometer was used for all observations, providing a total bandwidth of 250 MHz and a spectral channel spacing of 30.5 kHz, corresponding to 0.04 km s-1 at 230 GHz. Pointing and focus were checked roughly every hour using strong sources that were close to the comet at the time of the observation (e.g., CRL 2688). Flux calibration was done roughly every 3 hours on strong sources (e.g., IRAS 16293-2422). The data were reduced using starlink and IDL.
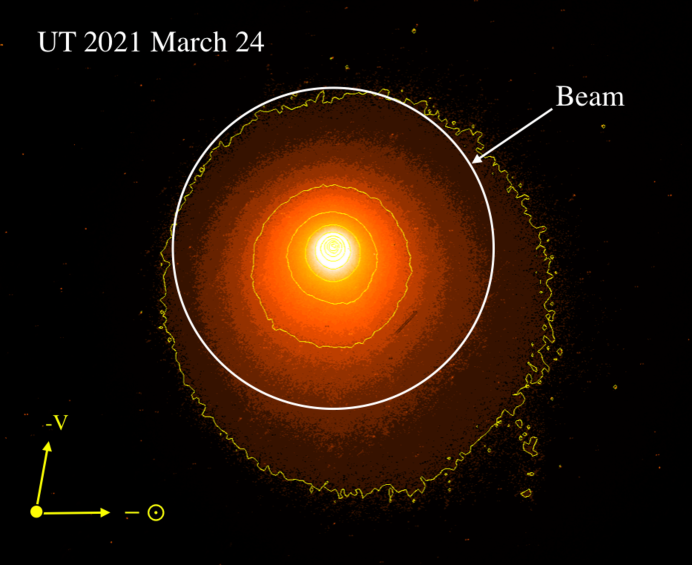
For reference, a Hubble Space Telescope (HST) optical image of K2 taken on UT 2021 March 24 is shown in Figure 1, with the size of the JCMT beam indicated by a white circle, corresponding to 1.0 km in diameter at the comet. The HST image, from program GO 16309, shows the distribution of dust. There is a strong central concentration (the surface brightness varies inversely with projected distance from the nucleus, consistent with steady-state outflow) with a slight asymmetry caused, in the region shown, by anisotropic ejection from the nucleus.
We made correction for the changing geocentric velocity because the cometary CO lines are very narrow, with widths of just a few 100 m s-1. The spectra were accumulated in groups typically with 918s integration each, then averaged after shifting to correct for changes in the geocentric velocity. The resulting composite spectra were then “baselined” by subtracting linear fits using two symmetric regions, from -10 to -3 km s-1 and from +3 to +10 km s-1, on each side of the nominal location of the CO J = 21 line. We experimented with baselines having different spectral windows and found that the choice of the fitted region and the method of the fit were not critical since the baseline deviates only very slightly from linearity in the data. The noise in the data was estimated from the root-mean-square (RMS) value of the main beam brightness temperature fluctuations within 10 km s-1 from the center of the CO line.
3. Results
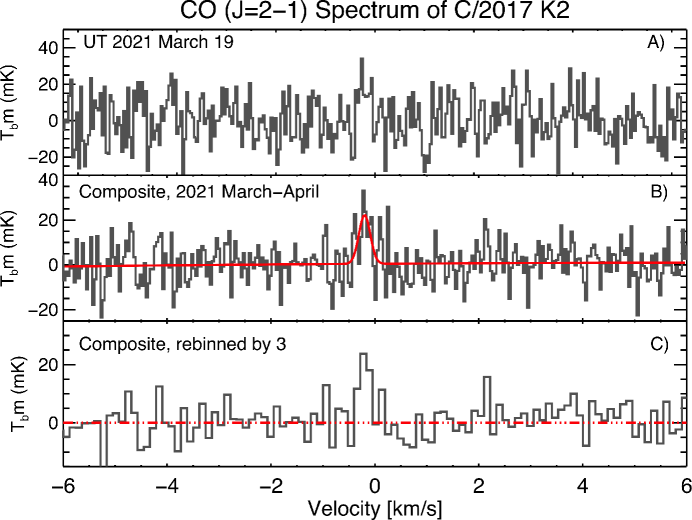
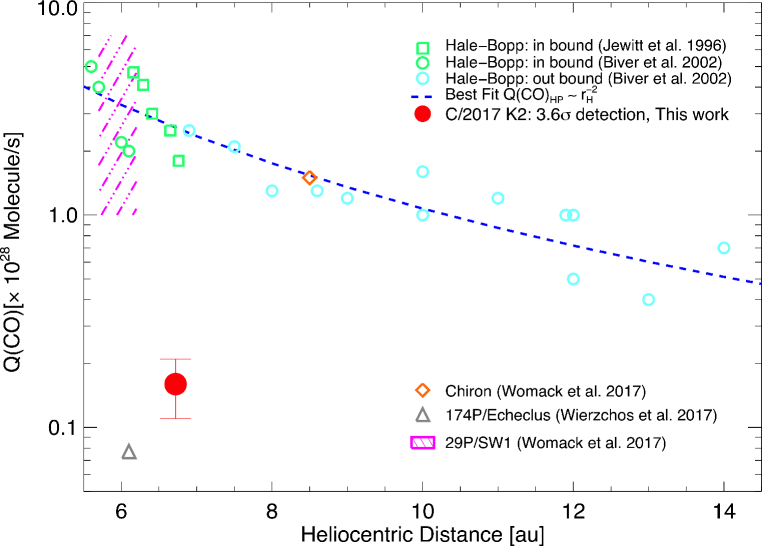
The CO(J=2-1) line was initially suspected on UT 2021 March 19 at the 2.7 level when the comet was 6.83 au from the Sun. We obtained and combined additional data from April 1 and 13 (Table 1) to generate a composite spectrum, shown in Figure 2. Our March observation is so far the furthest detection of CO in an inbound comet, as shown in Figure 3. Using the composite spectrum, we find the CO line has a full width at half maximum (FWHM) of 0.28 0.08 km s-1 (see Figure 2), consistent with the narrow CO lines detected in other comets (Senay & Jewitt, 1994; Jewitt et al., 1996; Biver et al., 1997). The line area is 8.3 2.3 mK km/s, corresponding to a 3.6 detection. In addition, the line is slightly blue shifted, with a central velocity at -0.200.03 km/s, likely owing to preferential sublimation of gas in the sunward direction.
Gas production rates from comets are estimated using a spatial model of the gas that takes account of the finite lifetimes of the species observed. Often, the Haser model is used (Haser, 1957). The solar ionizing flux varies as , leading to photodestruction lifetimes increasing with distance as , where =3.6 s (Huebner & Mukherjee, 2015) is the lifetime of CO molecule at 1 au. In the case of K2 at 6.72 au, we find = 1.6 s (about 5 years). This is orders of magnitude longer than the residence time of CO molecules in the beam and, therefore, photodissociation can be neglected. The expected density of CO molecules varies with linear distance from the nucleus as the inverse square, and the projected column density varies with the inverse of the angular distance from the nucleus (as is also true of the dust; Jewitt et al. (2021)).
We write the CO production rate as [s-1] and the gas outflow speed as [km/s]. Based on the measured line width and assume 10% thermal broadening effect, we adopted an expansion velocity = 0.25 km s-1, which is consistent with the empirical estimate by the measurements of other comets (Biver et al., 1999, 2000). The blackbody temperature at this distance is 104 K, but we expect that the temperature of the CO sublimating surface should be strongly depressed by the loss of energy to the destruction of bonds in the CO ice, for which the latent heat of sublimation is only J kg-1 (Huebner, 2006). We solved the energy balance equation for a flat and perfectly absorbing CO ice surface oriented perpendicular to the Sun-comet line and located at = 6.72 au, finding temperature depression to 26 K. Even lower rotational temperatures were measured in comets 29P/Schwassmann-Wachmann 1 near =6 au (T 10 K, Crovisier et al., 1995) and in C/1995 O1 (Hale-Bopp) near = 10 au (T = 8 K, Gunnarsson et al., 2003), where they result from adiabatic cooling as the gas expands away from the nucleus. With only a single rotational line, we have no independent measure of the temperature in K2, but we confidently assume that comparably low temperatures prevail in the coma of K2. Following the method described in Drahus et al. (2010), we assume local thermodynamic equilibrium (LTE) conditions are present throughout the coma and the photodissociation effects are negligible. With = 26 K, we derived a model dependent production rate of s-1.
4. Discussion
The equilibrium CO sublimation rate for a flat and perfectly absorbing surface oriented perpendicular to the Sun-comet line at = 6.7 au is kg m-2 s-1. To supply requires an exposed CO ice patch of area
| (1) |
where = 28 is the molecular weight of CO and kg is the mass of hydrogen. Substituting s-1, we find m2, corresponding to a circular patch only 0.5 km in radius.
High resolution imaging observations set only an upper limit to the radius of the nucleus, 9 km (Jewitt et al., 2017). Given this limiting radius, the effective fraction of the surface of the nucleus that is actively sublimating CO is a modest . This value may be compared to the active fractions of short-period comets, which occupy a wide range but which are commonly 1% (A’Hearn et al., 1995). It is additionally possible that part of the CO is released from the dust grains in the coma. Indeed, these grains strongly dominate the scattering cross-section of the comet relative to the of the nucleus, so some coma contribution might be expected.
We estimate the mass of CO lost from K2 since activity began (at 35 AU) from
| (2) |
where and are the start and end times and is from the JPL Horizons ephemeris. Substituting , we obtain kg, corresponding to an ice thickness = 155 m, where = 500 kg m-3 is the assumed density of the nucleus. In this view, sublimation from a 1 km2 exposed CO patch would have eroded a pit only a few meters deep. Sublimation could also occur from a larger area, excavated to a smaller depth, or from a different geometry. For example, some in-situ observations of active short-period comet nuclei suggest that sublimation proceeds by cliff erosion, not just from flat-bottomed pits (Keller et al., 2015).
The CO production rate from K2 is about 10% of that from comet C/1995 O1 (Hale-Bopp) when at similar heliocentric distance (Figure 3). If these two nuclei have the same active fractions, then the production rate ratio would indicate nucleus radii in the ratio . Estimates for the nucleus radius in C/1995 O1 (Hale-Bopp) vary over the range 13 50 km (Weaver & Lamy, 1997; Lamy et al., 1999), suggesting that 4 15 km. This range overlaps the limit, 9 km, set from the optical profile of K2 (Jewitt et al., 2017) but does not improve it. In C/1995 O1 (Hale-Bopp), the CO production varied as (Womack et al., 2017). If this variation holds in K2, we expect that the perihelion (1.80 AU) production rate will reach s-1 ( kg s-1).
The gas mass production rate in CO is which, by substitution, gives = 7523 kg s-1. This compares with the dust mass production rate inferred from measurements of the optical continuum, , with being the mean dust particle radius expressed in millimeters. Morphological considerations show that = 0.1 to 1 (Jewitt et al., 2019). At = 6.7 au, we find = 700 to 2200 kg s-1. Therefore, it is likely that the dust/gas ratio in K2 substantially exceeds unity. This is true of many or most comets (e.g. ratios up to 30 have been reported in 2P/Encke; Reach et al. (2000)), and is possible because although most of the mass is contained in solid grains, these grains are expelled slowly compared to the gas flow speed and the momentum is always dominated by the gas.
5. Summary
1) We used the James Clerk Maxwell Telescope to detect the J = 21 rotational transition of carbon monoxide in C/2017 K2 when inbound at heliocentric distance au. The line is blue-shifted by 0.200.03 km s-1 with area and width 8.32.3 mK km s-1 and 0.280.08 km s-1, respectively.
2) The corresponding carbon monoxide production rate is s-1 ( = 7523 kg s-1). This value is smaller than the production rate inferred from measurements of coma dust, indicating the dust/gas ratio 1.
3) The measured CO production can be supplied by surface sublimation of CO ice from a modest (1 km2) surface patch. We estimate that kg of CO has already been lost of the nucleus of C/2017 K2.
6. Acknowledgment
We thank the JCMT staff for their assistance. This work is based in part on observations made with the NASA/ESA Hubble Space Telescope, obtained from the archive at the Space Telescope Science Institute (STScI). STScI is operated by the association of Universities for Research in Astronomy, Inc. under NASA contract NAS 5-26555. These observations are associated with GO program 16309. Y.Z. thanks the National Natural Science Foundation of China (Grant Nos. 12073084, 11761131008). This work makes use of the JCMT data obtained under Program ID: S21AP001. The JCMT is operated by the EAO on behalf of NAOJ; ASIAA; KASI; CAMS as well as the National Key R&D Program of China (No. 2017YFA0402700). Additional funding support is provided by the STFC and participating universities in the UK and Canada.
References
- A’Hearn et al. (1995) A’Hearn, M. F., Millis, R. C., Schleicher, D. O., Osip, D. J., & Birch, P. V. 1995, Icarus, 118, 223
- Biver et al. (2002) Biver, N., et al. 2002, Earth Moon and Planets, 90, 32
- Biver et al. (2000) Biver, N., et al. 2000, AJ, 120, 1554
- Biver et al. (1999) Biver, N., et al. 1999, AJ, 118, 1850
- Biver et al. (1997) Biver, N., et al. 1997, Earth Moon and Planets, 78, 5
- Crovisier et al. (1995) Crovisier, J., Biver, N., Bockelee-Morvan, D., Colom, P., Jorda, L., Lellouch, E., Paubert, G., & Despois, D. 1995, Icarus, 115, 213
- Donn & Urey (1956) Donn, B., & Urey, H. C. 1956, ApJ, 123, 339
- Drahus et al. (2010) Drahus, M., Küppers, M., Jarchow, C., Paganini, L., Hartogh, P., & Villanueva, G. L. 2010, A&A, 510, A55
- Gunnarsson et al. (2003) Gunnarsson, M., et al. 2003, A&A, 402, 383
- Haser (1957) Haser, L. 1957, BSRSL, 43, 740
- Huebner (2006) Huebner, W. F., Benkhoff, J., Capria, M.-T., et al. 2006, Heat and Gas Diffusion in Comet Nuclei, (Bern, Switzerland: The International Space Science Institute)
- Huebner & Mukherjee (2015) Huebner, W. F., & Mukherjee, J. 2015, Planet. Space Sci., 106, 11
- Hui et al. (2018) Hui, M.-T., Jewitt, D., & Clark, D. 2018, AJ, 155, 25
- Jewitt et al. (2019) Jewitt, D., Agarwal, J., Hui, M.-T., Li, J., Mutchler, M., & Weaver, H. 2019, AJ, 157, 65
- Jewitt et al. (2017) Jewitt, D., Hui, M.-T., Mutchler, M., Weaver, H., Li, J., & Agarwal, J. 2017, ApJ, 847, L19
- Jewitt et al. (2021) Jewitt, D., Kim, Y., Mutchler, M., Agarwal, J., Li, J., & Weaver, H. 2021, AJ, 161, 188
- Jewitt et al. (1996) Jewitt, D., Senay, M., & Matthews, H. 1996, Science, 271, 1110
- Keller et al. (2015) Keller, H. U., et al. 2015, A&A, 583, A34
- Królikowska & Dybczyński (2018) Królikowska, M., & Dybczyński, P. A. 2018, A&A, 615, A170
- Lamy et al. (1999) Lamy, P. L., Toth, I., A’Hearn, M. F., & Weaver, H. A. 1999, Icarus, 140, 424
- Meech & Hainaut (2001) Meech, K. J., & Hainaut, O. R. 2001, Distant comet observations, ed. M. Y. Marov & H. Rickman, Vol. 261, 163–172
- Prialnik et al. (2004) Prialnik, D., Benkhoff, J., & Podolak, M. 2004, Modeling the structure and activity of comet nuclei, ed. M. C. Festou, H. U. Keller, & H. A. Weaver, 359
- Reach et al. (2000) Reach, W. T., Sykes, M. V., Lien, D., & Davies, J. K. 2000, Icarus, 148, 80
- Rettig et al. (1992) Rettig, T. W., Tegler, S. C., Pasto, D. J., & Mumma, M. J. 1992, ApJ, 398, 293
- Roemer (1962) Roemer, E. 1962, PASP, 74, 351
- Senay & Jewitt (1994) Senay, M. C., & Jewitt, D. 1994, Nature, 371, 229
- Wainscoat et al. (2017) Wainscoat, R. J., Wells, L., Micheli, M., & Sato, H. 2017, Central Bureau Electronic Telegrams, 4393, 1
- Weaver & Lamy (1997) Weaver, H. A., & Lamy, P. L. 1997, Earth Moon and Planets, 79, 17
- Wierzchos et al. (2017) Wierzchos, K., Womack, M., & Sarid, G. 2017, AJ, 153, 230
- Womack et al. (2017) Womack, M., Sarid, G., & Wierzchos, K. 2017, PASP, 129, 031001
| UT Date | tint aaTotal integration time in seconds. | bbAverage heliocentric distance. | ccAverage geocentric distance. | ddSolar phase angle (Sun-object-Earth). | eeAtmospheric optical depth at 225 GHz. |
|---|---|---|---|---|---|
| (s) | [au] | [au] | [deg] | ||
| 2021 April 13 | 12852 | 6.62 | 6.45 | 8.66 | 0.04 - 0.06 |
| 2021 April 01 | 8262 | 6.72 | 6.65 | 8.54 | 0.05 - 0.07 |
| 2021 March 19 | 6426 | 6.83 | 6.85 | 8.34 | 0.06 - 0.08 |