Stereo Matching Based on Visual
Sensitive Information
Abstract
The area of computer vision is one of the most discussed topics amongst many scholars, and stereo matching is its most important sub fields. After the parallax map is transformed into a depth map, it can be applied to many intelligent fields. In this paper, a stereo matching algorithm based on visual sensitive information is proposed by using standard images from Middlebury dataset. Aiming at the limitation of traditional stereo matching algorithms regarding the cost window, a cost aggregation algorithm based on the dynamic window is proposed, and the disparity image is optimized by using left and right consistency detection to further reduce the error matching rate. The experimental results show that the proposed algorithm can effectively enhance the stereo matching effect of the image providing significant improvement in accuracy as compared with the classical census algorithm. The proposed model code, dataset, and experimental results are available at https://github.com/WangHewei16/Stereo-Matching.
I Introduction
With the rapid development of Artificial Intelligence (AI), computer vision as an interdisciplinary subject has widely been used in advertising [1, 2], product placement [3, 4], remote sensing [5, 6], atmospheric study [7, 8], quality control [9, 10], biometrics [11], and amongst others. Eyes are the main source of capturing external information and information conveyed by vision is most abundant and intuitive. The visual information reflected by objects is transmitted to the brain through nerve tissue and then processed by the visual cortex of the brain with respect to the content and space respectively. The human eye has a strong ability to distinguish color information and has a great subjective influence, but the perception of gray level image is very poor. The emergence of machine vision can tackle this problem where the resolution of gray reaches 256 levels and has low environmental requirements. Stereo vision technology a sub field of computer vision has always been one of the hot spots of research. During the recent years, stereo matching technology was one of the discussed topics in research community. The depth map obtained by stereo matching technology is widely used in many intelligent fields. The depth information contained in each pixel of the depth map reflects the three-dimensional information of the scene, which has important application value for robot map construction (three-dimensional reconstruction), obstacle avoidance navigation and many other fields. The image source of this technology is usually captured by a binocular camera [12], which can provide the left and right perspectives of the image, to carry out the stereo matching operations.
I-A Related Works
With the recent developments in stereo matching technology, many research methodologies have been published in this area. Ysimoncelli et al. proposed a very classic Sum of Absolute Differences (SAD) stereo matching algorithm based on the difference between two gray regions [13]. Using the similar method, Da et al. furthermore improved the algorithm and used the gray features of the image to find the optimal matching region [14]. Some scholars use the whole stereo matching image to meet the requirements of the parallax map. In Jian Sun’s work [15], a single direction stereo matching algorithm is proposed, which limits the constraints of matching between two images and finds the optimal pixels. Yin Chuanli et al. segmented the image by color threshold, fitted the segmented region, and optimized the parallax results by minimizing the energy function. However, the threshold used for color segmentation was very strict, which can easily cause over-segmentation and under segmentation, [16]. Similar to SAD and Normalized Cross Correlation (NCC) feature extraction methods, Wang et al. constructed a real-time matching system, which can get a disparity image quickly, but the matching effect was poor, which can affect the subsequent application [17]. Furthermore, Savoy et al. in [18, 19] used ground-based sky cameras in a stereo setup to compute the cloud-base height.
I-B Contributions of the paper
According to the previous research done [20] on the stereo matching field, the algorithms based on the feature points often can not get depth of the image, and the classical SAD algorithm also needs to be improved for the matching effect. Keeping this point in mind, this paper proposes an image stereo matching algorithm based on visual sensitive information. Ensuring the matching effects, it can further refine the visual sensitive information such as edge points to reduce the false matching rate.
The main contributions of this paper are as follows:
-
•
We provide a systematic analysis of the related frameworks on stereo matching and identify the key shortcomings in them;
-
•
A novel stereo matching algorithm is proposed wherein we introduce the visual sensitivity factor in the cost calculation stage of the matching process to improve the matching degree; and
-
•
All the codes related to the different experiments in the paper are open-source111In the spirit of reproducible research, all the source code is available at https://github.com/WangHewei16/Stereo-Matching..
Primarily, the visual sensitivity factor is introduced in the cost calculation stage of the matching process to improve the matching degree of the contour area. During the cost aggregation stage, a multi-angle extension template based on visual factors is constructed to guide the whole aggregation process. Finally, through the experiments performed on the Middlebury image dataset, the effectiveness and superiority of this method is proved by both the subjective and objective means.
II Proposed method of stereo matching
The main objective of the proposed algorithm is to detect the edge points, contour points and other visual sensitive areas in the image. Furthermore, it analyzes the texture distribution difference between mentioned areas and smoothes them, and guides the judgment weight of degree of freedom extension in the subsequent aggregation stage. In the aggregation stage, the multi-directional extension template is used to process the covered pixels, and the extended pixel length is then guided according to the visual sensitivity to complete the whole image processing. The main flow chart is as shown in Figure 1.
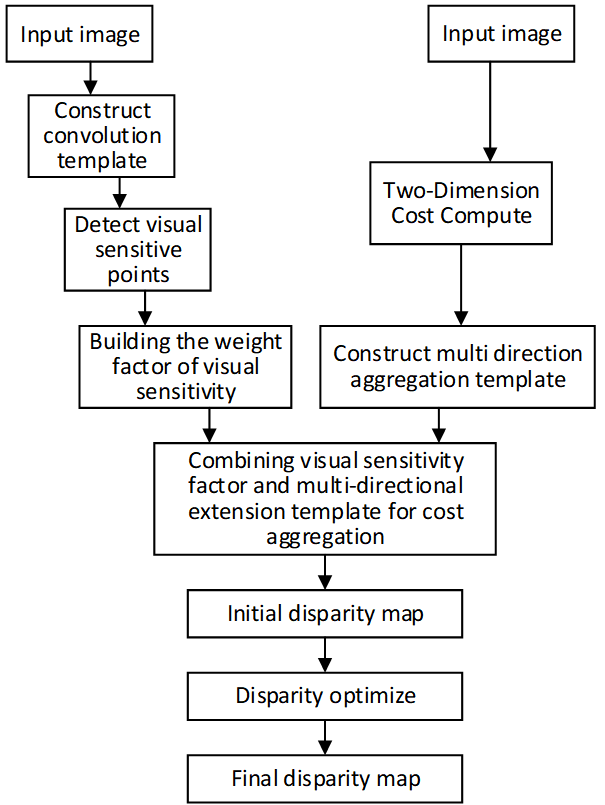
After taking the left and right view images as inputs, the step-by-step description of the proposed method is as follows. Firstly, a convolution template is constructed to convolute the covered pixels. The template image is shown in Figure 2.
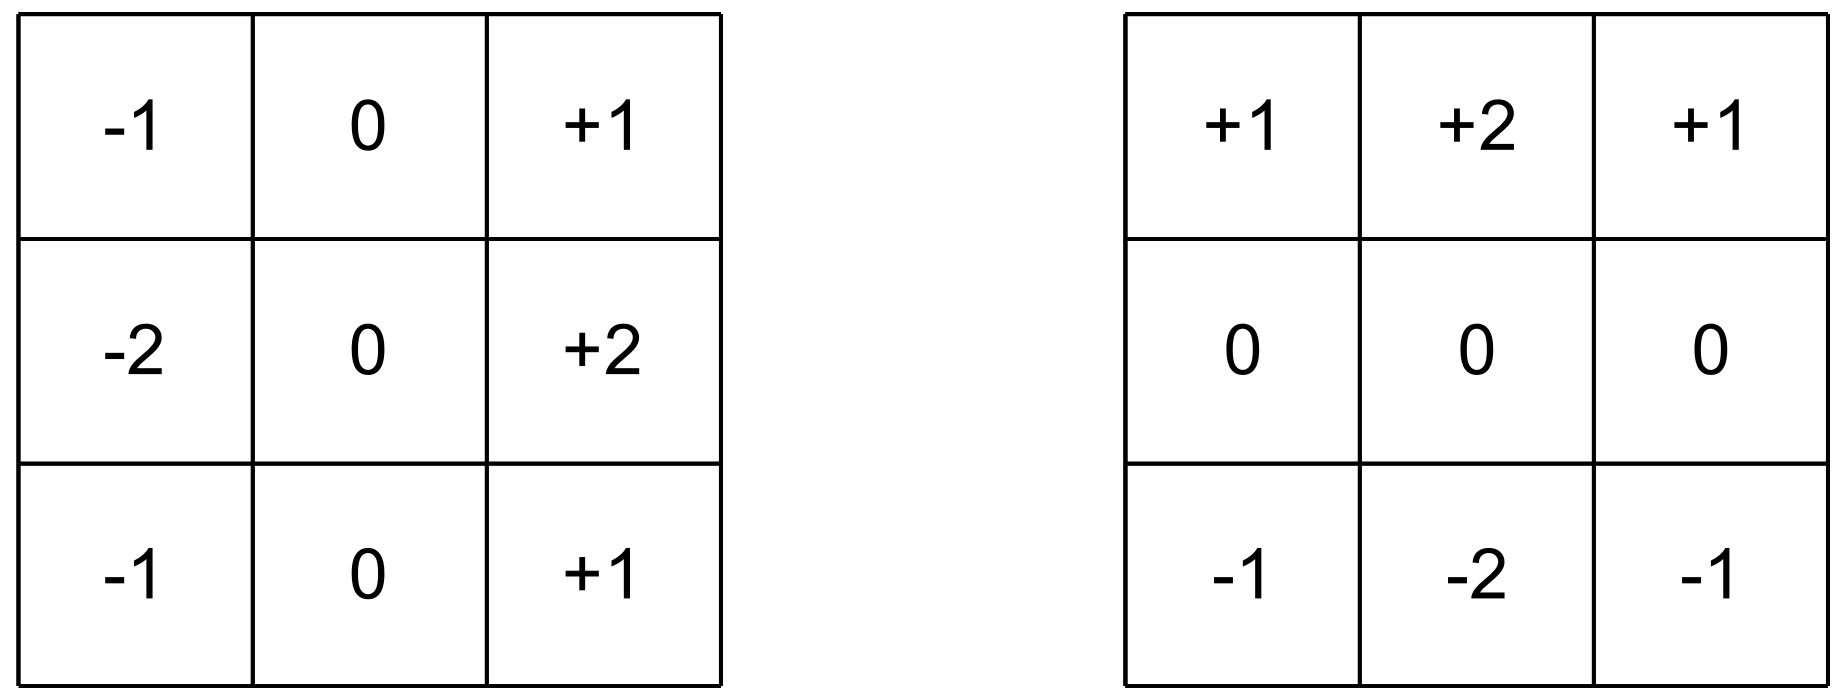
The template has the vertical and horizontal directions. is the horizontal convolution template whereas the is the vertical convolution template. After convolving with the covered pixels, two important factors can be obtained. One is the brightness difference value of the two directions, and the other is the gradient directivity in the region. Through these two factors, whether the region is a visual sensitive region can be judged. The brightness difference value is calculated as follows:
| (1) |
| (2) |
Where, A is the input image, is the transverse brightness value and is the longitudinal brightness value. By summing the absolute values of these two parameters, the gray value of a "point" representing the region can be obtained as follows:
| (3) |
Taking G as the second generation value to guide a certain region matching between two images, the first cost is to use the binary string generated according to the gray difference whose hamming distance represents the gray approximation of the two regions. When taking G as the visual sensitivity between two regions as the second condition of image matching, it further judges whether the difference value of G between two regions is less than a certain threshold. Not only the gray approximation should be satisfied, but also the sensitivity must be approximate, then the two regions are considered as candidate matching regions, and then the parallax values of the two regions are calculated. This calculation of the second cost can further constrain the matching conditions so that the accuracy of the matched region is higher.
The process of using two-generation values to judge in turn is represented by the following formula:
| (4) |
| (5) |
where, p represents the current pixel, d is the horizontal displacement difference of the points in the images, and , are the cost of the points in the two positions. is the mapping value of after a certain transformation, also called as gray approximation. After gray screening, the second cost value, is calculated and screened for the visual sensitivity. is an empirical parameter, which projects the generational values int the interval of 0 and 1.
The initial disparity map of the two images can be calculated by using the method mentioned above, but we can not get the optimal results. In stereo matching technology, the second stage i.e. the cost aggregation, is usually regarded as an important step. In this paper, we propose a cost aggregation method based on a non-directional growth template controlled by visual sensitive directional factor.
According to the calculation method of the second generation value mentioned above, we can easily get the direction of visual sensitivity in a certain area. The calculation is as follows:
| (6) |
This angle is called as the visual sensitivity factor of a target pixel. The visual sensitivity direction of different position points represents the direction of the fastest gray change, and each point has such a direct factor. In this paper, the direction factor is used to guide the cost aggregation between regions in the aggregation phase. A multi-degree freedom growth template guided by direction factor is designed.
Firstly, during the process of traversing the image, each point is used as a reference point to establish a cross weighted template to cover more regions with similar texture features. The establishment of the weighted template should meet the four degrees of freedom growth decision conditions. This process is expressed as follows:
| (7) |
| (8) |
| (9) |
| (10) |
| (11) |
In the formula, P represents the reference point, and represents the position point when it reaches/extends in a certain direction. The first function’s is used to calculate the distance between the reference point and the position point. We need to ensure that the range of the extended point is within a reasonable distance.
The second degree of freedom judgment condition represents the judgment condition of the gray level approximation between the extended position point and the reference point. The judgment process is related to the visual sensitivity factor . when the extended direction is consistent with or close to the direction of , it indicates that the gray level change rate of the direction is large. Therefore, the gray level threshold can be adjusted. Only when the extended position point is still less than the threshold, it is added to the template overlay within the scope. So that the represent the reasonable distance.
The third decision condition is to compare the color of the new extended position point with the position point at the previous time so that it is less than a certain threshold . If this condition is satisfied, the template will continue to be extended and expanded.
The fourth decision condition is that when the extended distance exceeds the reasonable range, we will re-specify the gray threshold , which is less than the previous gray threshold. In the same way, when the extension continues, it is still regulated by the direction factor, and a maximum distance parameter will be set at this time. When the extended distance exceeds the threshold, the extension will be terminated immediately.
III Experiments and Discussion
III-A Dataset
Middlebury official test dataset is utilized in this paper for the experimentation. This dataset have also used in other many literature [21][22]. The dataset mainly used for computer vision processing of binocular images including image restoration, stereo matching, image recognition and other. Because of space constraint, this paper mainly selects four kind of images from Middlebury 2.0 for experiments containing 24 left and right view color images and the real parallax images. The proposed algorithm is tested on windows 7, 64 bit operating system. Microsoft Visual Studio and Open CV2.4.9 framework were used for experiments.
III-B Subjective evaluation
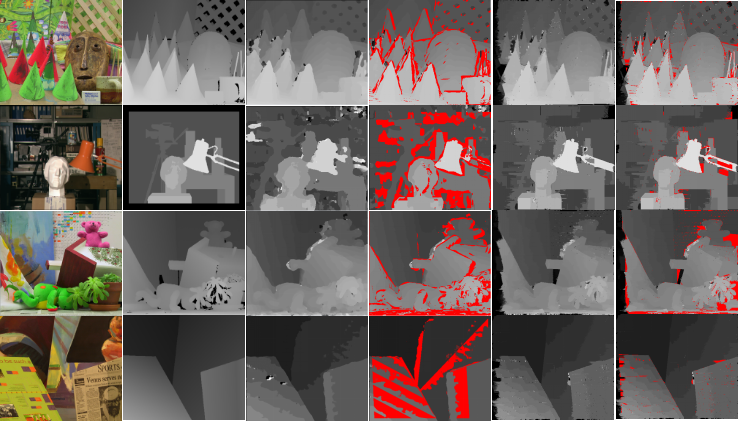
To clearly describe the concept of mismatch rate and the effectiveness of the proposed algorithm, this paper presents a subjective form to show the image matching effect and compares the test image obtained by proposed algorithm with the test image obtained by the classical algorithm.
Figure 3 shows the comparison results of the two, mainly for the four types of images from the mentioned data set. From top to bottom, the image categories are cones, Tsukuba, Teddy and Venus. The images are displayed into seven columns. After the experimentation performed by using two algorithms, the comparison results are shown, and a more detailed description is given in the figure below.
III-C Objective evaluation
Next, we have showed the objective data to prove the effectiveness of the proposed algorithm. Table I shows the error matching rate of the four types of images processed by the proposed algorithm and compares with other matching algorithms of the same kind.
| Algorithm | cones | tsukuba | teddy | venus | avg% |
|---|---|---|---|---|---|
| Census | 21.89 | 27.41 | 23.43 | 27.78 | 25.13 |
| Proposed | 4.10 | 2.01 | 7.84 | 1.35 | 3.82 |
| Reference[23] | 4.04 | 2.53 | 7.57 | 1.60 | 3.93 |
| SG-C[24] | 12.92 | 4.80 | 8.05 | 1.91 | 6.92 |
| Mp-C[22] | 6.78 | 4.50 | 11.32 | 3.55 | 6.53 |
These values are obtained by comparing them in the non-occluded area. The non-occluded region in the left and right view of the images is an area which matches in both the views without any event/object disturbance, we call this area a non-occluded region. Occlusion detection refers to the set of techniques employed to detect which areas of the images are occlusion boundaries or areas that appear occluded in views of the scene. Generally speaking, only comparing the matching effect of non-occluded regions is better than that of all image regions. It can be seen from Table I that the error matching rate of the proposed algorithm is lower than that of the same kind of algorithm, and the overall matching effect is better
III-D Impact of noise on mismatch rate
The algorithm proposed in this paper is more robust than the compared works. To prove this, we added different concentrations of Gaussian noise to the above four original images, and it is mainly expressed by the change of average mismatch rate with the increase of noise concentration. The proposed method also uses the improved adaptive aggregation template. The comparison results are shown in Table II, where “none” represents the case without the input noise. The results in the table proves that when the noise concentration increases, the change in the degree of error matching rate and the sensitivity to noise remains low.
| Noise | none | 2% | 5% | 10% | 15% |
|---|---|---|---|---|---|
| Ref. [25] | 4.54 | 6.67 | 11.73 | 26.88 | 48.63 |
| Proposed | 3.82 | 5.02 | 8.65 | 17.33 | 38.46 |
IV Conclusion & Future Work
In this paper, the stereo matching technology is studied, and a stereo matching algorithm based on visual sensitive information is proposed. In the cost calculation stage, the sensitive information factor is proposed, and the robustness of cost matching is enhanced. In the process of aggregation, the aggregation template is extended for each pixel according to the sensitivity factor. Finally, in the experimental part, the proposed algorithm is demonstrated subjectively and proved by objective data through the combination of graph and tables.Summing up, the proposed algorithm can effectively match the left and right view of images, and the matching effect is better than a variety of similar algorithms.
For the future work, we intend to further study the factors that have a direct impact on the parallax value, and the actual scene image depth map generation and three-dimensional environment reconstruction work, as far as possible to capture more actual scene images to form their data set.
References
- [1] M. Hossari, S. Dev, M. Nicholson, K. McCabe, A. Nautiyal, C. Conran, J. Tang, W. Xu, and F. Pitié, “ADNet: A deep network for detecting adverts,” in Proc. 26th Irish Conference on Artificial Intelligence and Cognitive Science (AICS), 2018.
- [2] S. Dev, M. Hossari, M. Nicholson, K. McCabe, A. Nautiyal, C. Conran, J. Tang, W. Xu, and F. Pitié, “Localizing adverts in outdoor scenes,” in 2019 IEEE International Conference on Multimedia & Expo Workshops (ICMEW). IEEE, 2019, pp. 591–594.
- [3] A. Nautiyal, K. McCabe, M. Hossari, S. Dev, M. Nicholson, C. Conran, D. McKibben, J. Tang, W. Xu, and F. Pitié, “An advert creation system for next-gen publicity,” in Proc. Joint European Conference on Machine Learning and Knowledge Discovery in Databases. Springer, 2018, pp. 663–667.
- [4] I. Bacher, H. Javidnia, S. Dev, R. Agrahari, M. Hossari, M. Nicholson, C. Conran, J. Tang, P. Song, D. Corrigan, and F. Pitié, “An advert creation system for 3D product placements,” in Proc. European Conference on Machine Learning and Principles and Practice of Knowledge Discovery in Databases (ECML-PKDD), 2020.
- [5] S. Dev, F. M. Savoy, Y. H. Lee, and S. Winkler, “Estimation of solar irradiance using ground-based whole sky imagers,” in Proc. IEEE International Geoscience and Remote Sensing Symposium (IGARSS). IEEE, 2016, pp. 7236–7239.
- [6] S. Dev, S. Manandhar, Y. H. Lee, and S. Winkler, “Detecting rainfall onset using sky images,” in Proc. IEEE Region 10 Conference (TENCON). IEEE, 2016, pp. 2036–2039.
- [7] S. Manandhar, S. Dev, Y. H. Lee, and Y. S. Meng, “Analyzing cloud optical properties using sky cameras,” in Proc. Progress in Electromagnetics Research Symposium-Fall (PIERS-FALL). IEEE, 2017, pp. 1994–1996.
- [8] S. Dev, S. Manandhar, Y. H. Lee, and S. Winkler, “Multi-label cloud segmentation using a deep network,” in Proc. USNC-URSI Radio Science Meeting (Joint with AP-S Symposium). IEEE, 2019, pp. 113–114.
- [9] R. Birla and A. P. S. Chauhan, “An efficient method for quality analysis of rice using machine vision system,” Journal of Advances in Information Technology Vol, vol. 6, no. 3, 2015.
- [10] D. Kaloni, Y. H. Lee, and S. Dev, “Impact of COVID19-induced lockdown on air quality in Ireland,” in Proc. International Geoscience and Remote Sensing Symposium (IGARSS), 2021.
- [11] G. G. Patil and R. K. Banyal, “A dynamic unconstrained feature matching algorithm for face recognition,” Journal of Advances in Information Technology Vol, vol. 11, no. 2, 2020.
- [12] Y. Jin and M. Lee, “Enhancing binocular depth estimation based on proactive perception and action cyclic learning for an autonomous developmental robot,” IEEE Transactions on Systems Man & Cybernetics, vol. 49, no. 1, pp. 169–180, 2018.
- [13] E. P. Simoncelli, E. H. Adelson, and D. J. Heeger, “Probability distribution of optical flow,” in IEEE Computer Society Conference on Computer Vision & Pattern Recognition, 1991.
- [14] F. Da, F. He, and Z. Chen, “Stereo matching based on dissimilar intensity support and belief propagation,” Journal of Mathematical Imaging & Vision, vol. 47, no. 1-2, pp. 27–34, 2013.
- [15] N.-N. Z. Jian Sun and H.-Y. Shum, “Stereo matching using belief propagation,” IEEE Transactions on Pattern Analysis & Machine Intelligence, vol. 25, no. 7, pp. 787–800.
- [16] L. D. M. Yin C L and S. J. Z, “An improved stereo matching algorithm based on image segmentation,” Journal of Computer Aided Design and Graphics, vol. 20, no. 6, pp. 808–812, 2008.
- [17] F. Wang, K. Jia, and J. Feng, “The real-time depth map obtainment based on stereo matching,” in The Euro-China Conference on Intelligent Data Analysis and Applications. Springer, 2016, pp. 138–144.
- [18] F. M. Savoy, S. Dev, Y. H. Lee, and S. Winkler, “Stereoscopic cloud base reconstruction using high-resolution whole sky imagers,” in Proc. IEEE International Conference on Image Processing (ICIP). IEEE, 2017, pp. 141–145.
- [19] ——, “Geo-referencing and stereo calibration of ground-based whole sky imagers using the sun trajectory,” in Proc. IEEE International Geoscience and Remote Sensing Symposium (IGARSS). IEEE, 2016, pp. 7473–7476.
- [20] Z. R and W. J, “Non-parametric local transforms for computing visual correspondence,” European Conference on Computer Vision, pp. 151–158, 1994.
- [21] J. C. Kwak, T. R. Park, S. K. Yong, and K. Y. Lee, Implementation of Improved Census Transform Stereo Matching on a Multicore Processor, 2013.
- [22] Z. Kang, Y. Fang, D. Min, L. Sun, and T. Qi, “Cross-scale cost aggregation for stereo matching,” Computer Vision & Pattern Recognition, 2014.
- [23] Y. F. Fan H R and P. X, “An improved census transform and gradient fusion stereo matching algorithm,” Journal of Optics, pp. 267–277, 2018.
- [24] G. Z. Yubo M and C. M, “A stereo matching algorithm based on four-moded census and relative confidence plane fitting,” Chinese Journal of Electronics, vol. 24, no. 4, pp. 807–812, 2015.
- [25] C. Y and C. X. J, “Stereo matching alogrithm based on joint matching cost & adaptive window,” Proc. IEEE 3rd Advanced Information Technology, Electronic & Automation Control Conference (IAEAC), pp. 442–446, 2018.