Octorber–5–2020 \AcceptedMay–19–2021 \Publishedpublication date
3-1-1 Yoshinodai, Chuo-ku, Sagamihara, Kanagawa 252-5210, Japan 33affiliationtext: Department of Astronomy, The University of Tokyo, Bunkyo, Tokyo 113-0033, Japan44affiliationtext: Japan Space Forum, Kanda-surugadai, Chiyoda-ku,Tokyo,101-0062, Japan
Galaxy: center, ISM: clouds, ISM: individual (G-0.02-0.07, 50 km s-1 Molecular Cloud), stars: massive, formation, radio lines: ISM
Hot Molecular Core Candidates in the Galactic Center 50 km s-1 Molecular Cloud
Abstract
We present the results based on the 2 \farcs 5-resolution observations using Atacama Large Millimeter/Submillmeter Array (ALMA) of the Galactic Center Molecular Cloud G0.020.07, or the 50 km s-1 Molecular Cloud (50 MC), in the SO (NJ=22-1 line and 86-GHz continuum emission, the combination of which is considered to trace “hot molecular core candidates” (HMCCs) appearing in the early stage of massive-star formation. In the 86-GHz continuum image, we identified nine dust cores in the central part of the 50 MC, in which four famous compact HII regions are located. No new ultra-compact HII regions were found. We also identified 28 HMCCs in the 50 MC with the SO line. The overall SO distribution had no clear positional correlation with the identified HII regions. The HMCCs in the 50 MC showed a variety of association and non-association with dust and Class-I CH3OH maser emissions. The variety suggests that they are not in a single evolutionary stage or environment. Nevertheless, the masses of the identified HMCCs were found to be well approximated by a single power law of their radii, MLTE/(M⊙)=5.44 105 (r/(pc))2.17 at Tex = 50–100 K. The derived HMCC masses were larger than those of the molecular cores with the same radii in the 50 MC and also than those of the molecular clumps in the Galactic disk. Additional observations are needed to confirm the nature of these HMCCs in the 50 MC.
1 INTRODUCTION
The Galactic Center 50 km s-1 Molecular Cloud (50 MC) is located only 3´ from Sagittarius A∗ (Sgr A∗) in the Central Molecular Zone (CMZ) (Morris1996). The hot and turbulent medium of the 50 MC is believed to have been generated by a strong tidal field, cloud-cloud collisions (CCCs), stellar winds, supernova shocks (Morris1996).
In the CMZ, a very steep power-law linewidth-size relation of N2H+ molecule has been observed down to 0.1 pc scale, which is likely to originate in the decay of supersonic gas motion in strong shocks (Kauffmann2017a). In such environment, star formation in the CMZ clouds may be suppressed (Kauffmann2017a). Many CMZ molecular clouds have also been observed to have unusually shallow density gradients (and corresponding steep mass-size relations) compared with most regions elsewhere in the Milky Way (Kauffmann2017b). Lu2019a argued that the star formation in the CMZ clouds is inactive overall. The dense gas fractions of the other observed clouds except Sgr C are smaller than 1 % and the star formation rate (SFR) is similarly low (Lu et al. 2019a). They also suggested that the low SFR in the CMZ could be because there is less gas confined in gravitationally bound cores (Lu2019a; Lu2019b). The cores may be prevented from gravitationally collapses by the strong turbulence in this region or if it started it may have only recently started. The extreme environment in the CMZ provides unique opportunities for studying star formation in the centers of external galaxies in general.
The 50 MC has a string of three compact HII regions (CHII) and one ultra-compact HII region (UCHII) in G0.020.07, or Sgr A East A–D (e.g. Ekers1983; Goss1985; Yusef-Zadeh2010; Mills2011). The HII regions appear to lie along a dense ridge of the 50 MC, the “molecular ridge” by Coil2000. The HII regions, Sgr A East A–D (hereafter we refer to them as HII-A, HII-B, HII-C, and HII-D as in Tsuboi2019, respectively, are thought to host a single late O-type or early B-type star for each and to be at the age of years, with HII-D being the youngest given its small nebular size (Yusef-Zadeh2010; Mills2011; Tsuboi2019).
The CMZ molecular clouds are known to contain strong shock waves (e.g. Tsuboi2012), which are responsible to generate filamentary structures often observed in the Galactic disk clouds (Rathborne2014; Rathborne2015; Bally2014). Similar filamentary structures have been found in the 50 MC (Uehara2017) and G0.253+0.016 (Rathborne2015).
Uehara2017; Uehara2021 identified 27 molecular-cloud filaments in the 50 MC and suggested that filaments are ubiquitous also in the molecular clouds in the CMZ (Andre2010). Furthermore, Uehara2019 showed that the cloud-cloud collision (CCC) efficiently formed massive bound cores even if the slope of the core mass function (CMF) was not greatly altered by CCC. Active star formation is expected to occur in these cold (20 K) cores, including those that created the above-mentioned three CHIIs and one UCHII. The cores will then collapse and evolve to warm (100 K) hot molecular cores (HMCs).
In the standard evolutionary scenario of massive stars, high-mass starless cores (HMSCs) represent the earliest evolutionary stage of massive star formation (Motte2018). In the next stage, high-mass protostellar objects (HMPOs) form in the HMSCs and the HMSCs evolve to HMCs. In the Galactic disk, HMCs have been observed in many molecular emission lines from millimeter to submillimeter wavelengths. The HMC has diameters 0.1 pc, densities 107 cm-3, and temperatures 100 K. The lifetimes of HMCs are 104–105 yr (Herbst2009; Battersby2017). The HMC is considered to represent the evolutionary stage in a massive star formation in which protostars grow through active accretion of circumstellar material (e.g. Kurtz2000; Beuther2007). Observations with a high angular resolution suggest that some HMCs are heated by embedded sources, which are usually suspected to be HMPOs or massive young stellar objects (MYSOs) (e.g. Rolffs2011; Serra2012; Sanna2014; Silva2017). As a result, HMPOs produce strong millimeter continuum and mid-infrared emission but no detectable centimeter emission (Sridharan2002). Since the centimeter emission is free-free emission from ionized gas, no significant centimeter emission implies that HMPOs have not yet reached the stage in which they produce Lyc photons and ionize the surrounding material. Subsequently, a central massive protostar comes to produce a large quantity of ionizing radiation and to form a hyper-compact HII region (HCHII), which evolves to an HII region after UCHII and CHII (DePree2004).
Here we focus on the evolutionary stage between the massive molecular cores and UCHIIs. It is important for understanding of the early stage of massive star formation in the CMZ to look for the objects between the HMSC and UCHII stages.
In this paper, we describe the radio continuum and spectral line observations of the 50 MC and data reduction in § 2. We show the observational results and identify Hot Molecular Core Candidates (HMCCs) in the cloud in § 3. We discuss results from the continuum and the SO, HC15N, and CH3OH data and discuss the role of the HMC in the early stage of massive star formation in the CMZ in § 4.
2 OBSERVATIONS AND DATA REDUCTION
The observations of SO (NJ = 22 – 11 at 86.09355 GHz), 34SO (NJ = 23 – 12 at 97.71540 GHz and NJ = 54 – 44 at 96.78176 GHz), HC15N (J=10 at 86.05497 GHz), CH3OH (J=21,1–11,0 E at 96.75551 GHz), and H42 at 85.68818 GHz were made as a part of the Atacama Large Millimeter/Submillmeter Array (ALMA) Cy 1 wide-field observation (2012.1.00080.S. PI M.Tsuboi). The observation consisted of a 136-pointing mosaic with the 12-m array and a 68-pointing mosaic with the 7m array (ACA), covering a total of 330\arcsec 330\arcsec area including both the 50 MC and Sgr A∗.
The frequency channel width was 244 kHz, corresponding to the velocity resolution of 1.7 km s-1 (488 kHz). The objects J00060623, J15172422, J7173342, J17331304, J17433058, J17443116, and J2148+0657 were used as the phase calibrators. The flux density scale was determined using Titan, Neptune, and Mars. We reduced the data using the standard packages of CASA (McMullin2007). The line emissions were separated from the continuum emission in the UV data using the CASA task UVCONTSUB. For the line emissions, the UV data for each channel was CLEANed and Fourier-transformed to a map, and all the resultant maps were combined to three-dimensional data cubes in the right-ascension, declination, and frequency space. The final images were made by applying natural weighting for the visibility (UV) data to obtain a better signal-to-noise ratio. The resultant synthesized beam size was 2\farcs491\farcs85 (PA=89\fdg70) for the continuum and SO, 34SO, and HC15N spectral line images. The CH3OH lines were detected in the other sideband. The synthesized beam size of the CH3OH maps was 2\farcs301\farcs66 (PA=86\fdg39). The typical 3 rms noise level was 1.0 mJy beam -1, or 35.4 mK, in all the maps. The line profiles of a channel were integrated over 2 km s-1 at both bands.
We adopt 8.5 kpc as the distance to the Galactic center; 24\arcsec corresponds to about 1 pc at the distance, and thus our beam size corresponds to about 0.1 pc. The field center was =17h45m520, =28∘59′300.
3 RESULTS AND HMCC IDENTIFICATION
3.1 86 GHz Continuum Emission
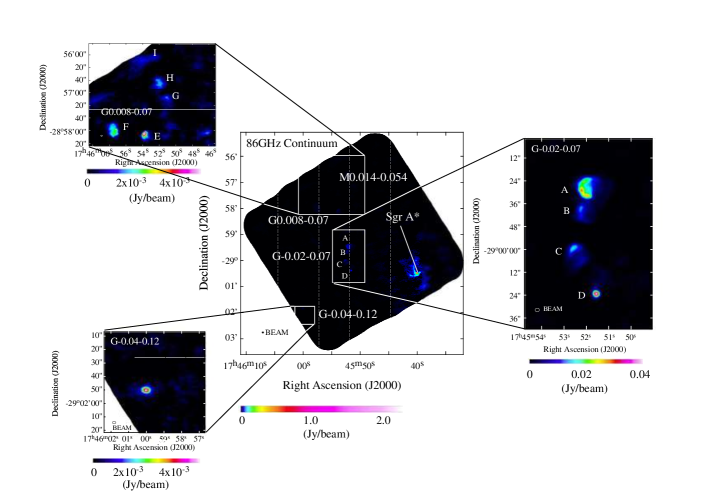
Figure1 shows the 86-GHz continuum image of the 50 MC region (see also Figure 1 in Tsuboi2019). Although a 96-GHz continuum image was obtained simultaneously, we do not use it in this continuum analysis because it is essentially the same as the 86-GHz image, which alone provides the sufficient sensitivity. The sources HII-A, HII-B, HII-C, and HII-D (sources A, B, C, and D), which are prominent in the centimeter continuum maps (Mills2011), are also prominent in the 86-GHz continuum image. The known centimeter-continuum faint sources in the region, G0.0080.07 (sources E and F) and G0.040.12 (e.g. Mills2011), are also clearly detected.
Although the millimeter continuum emission is considered to mainly originate from ionized gas through the free-free emission mechanism, a possibility of non-thermal origin characteristic in the Galactic center, e.g., emission related with Sgr A*, is not totally excluded. A reliable probe to distinguish the thermal and non-thermal origins is hydrogen recombination lines; if they are detected, the millimeter continuum emission from the source is likely to be in thermal origin. In this case, one of the hydrogen recombination lines, the H42 line, has been detected toward HIIs A–D, G0.0080.07, and G0.040.12 (e.g. Mills2011; Tsuboi2019). Therefore, their emission is likely to be in thermal origin. Figure 2 shows the distributions of the 86-GHz continuum and H42 line emissions. Although nine dust cores are detected in the 86-GHz continuum emission (sources a–i in Figure 2 Left panel; n.b., these sources are not detected in the H42 recombination line in Figure 2 Right panel). A similar situation has been also reported in M0.0140.054 (Tsuboi2021). In addition, Walker2018 have detected massive dust cores, which will eventually grow to HCHIIs, in the CMZ’s dust ridge.
Source a corresponds to the HC15N core located 45 northeast of “Northern Ridge”, which will be discussed in section 3.4.1. Sources b, c, e, h, and i are associated with HMCCs as mentioned later. Sources d, f, and g have no corresponding HMCCs.
By contrast, source j is detected also in the H42 recombination line (see the right panel of Figure 2). Hence, source j should have ionized gas and be regarded as a HCHII candidate. Table 1 lists these sources.
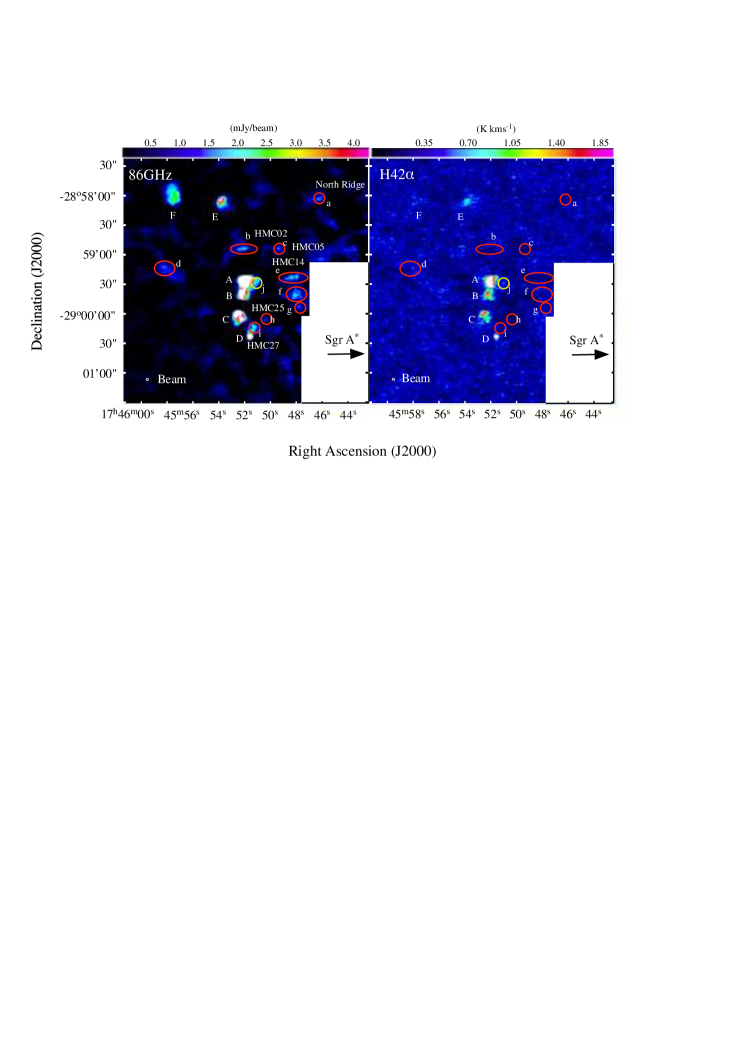
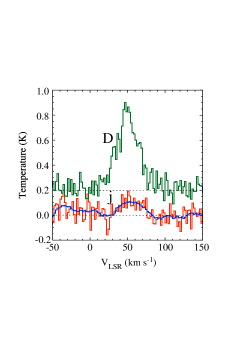
Figure 3 shows the H42 recombination-line spectra toward HII-D and source j. The spectrum toward HII-D has a single peak at around the LSR velocity of 50 km s-1. The spectrum toward source j also has a marginal peak at around the LSR velocity of 50 km s-1. The blue curve in the figure shows the 11-ch running mean of the spectrum. The peak is identified in the mean spectrum. The radio recombination lines from the HCHIIs are known to be extremely broad, typically V =40–50 km s-1 and sometimes greater than 100 km s-1(e.g. Sewilo2004; Sewilo2011), and the width tends to be broader at lower-frequency transitions. However, the observed velocity width of the H42 recombination line of source j is only 30 km s-1, which is greatly narrower than those of typical HCHIIs. In addition, the location of source j is adjacent to HII A. Therefore, we conclude that source j is a part of the shell-like structure of HII-A.
If the UCHIIs and HCHIIs exist in the 50 MC, their flux densities are expected to be 200–700 mJy on the basis of the typical flux density of the HCHIIs observed in the Galactic disk at 43 GHz (Sewilo2011). The observed flux densities of HII A–D at 86 GHz were 426, 141, 172, and 90 mJy, respectively (Tsuboi2019). Combining with the facts that their continuum emissions at 86 GHz are optically thin and have flat spectrum indexes (0.1) because they are free-free emission, we should be able to detect them at a similar intensity if the UCHIIs and HCHIIs exist in the 50 MC. However, we detected none. Therefore, we conclude that no new UCHIIs or HCHIIs exist in this region.
| 86GHz | Position | Size | Flux | Gas Mass | Gas Mass | Mean number | Mean number | Note | |
| Continuum | Right Ascension | Declination | Max Min | Td=50K | Td=100K | density Td=50K | density Td=100K | ||
| # | J(2000) | J(2000) | arcsec () | (mJy) | Mdust (M⊙) | Mdust (M⊙) | (cm-3) | (cm-3) | |
| a | 17h45m4629 | -28∘58′0332 | 6.16 3.23 | 2.92 | 3.52 102 | 1.80 102 | 1.43 106 | 7.31 105 | north of North Ridge |
| b | 17h45m5212 | -28∘58′5363 | 15.39 5.16 | 4.52 | 5.45 103 | 2.78 103 | 2.78 106 | 1.42 106 | HMC02, C1P1,C1P2 (Lu2019a) |
| c | 17h45m4939 | -28∘58′5339 | 6.25 4.49 | 7,26 | 8.76 102 | 4.47 102 | 2.13 106 | 1.09 106 | HMC05 |
| d | 17h45m5824 | -28∘59′1275 | 9.83 3.98 | 5.55 | 6.70 102 | 3.42 102 | 9.88 105 | 5.04 105 | |
| e | 17h45m4808 | -28∘59′2259 | 9.63 5.79 | 19.13 | 2.52 102 | 1.29 102 | 3.17 106 | 1.62 106 | HMC14 |
| f | 17h45m4805 | -28∘59′4091 | 7.75 4.69 | 10.08 | 2.31 103 | 1.18 103 | 2.00 106 | 1.02 106 | |
| g | 17h45m4781 | -28∘59′5250 | 7.28 4.37 | 8.18 | 1.22 103 | 6.21 102 | 2.00 106 | 1.02 106 | |
| h | 17h45m5045 | -29∘00′0583 | 2.96 2.32 | 1.42 | 9.87 102 | 5.04 102 | 1.98 106 | 1.01 106 | HMC24 or HMC25 |
| i | 17h45m5134 | -29∘00′1520 | 9.44 4.80 | 13.06 | 1.71 102 | 8.73 101 | 3.43 106 | 1.75 106 | HMC27 |
| j | 17h45m5108 | -28∘59′2782 | 2.73 1.56 | 2.64 | 1.58 103 | 8.04 102 | 1.30 106 | 9.54 105 | north of HMC15 |
| H42 | (mJy km s-1) | ||||||||
| HCHII | 17h45m5102 | -28∘59′2948 | 2.16 1.58 | 7.48 | — | — | — | — | source j H42 emission |
3.2 Molecular Line Emission as HMC Tracers
The HMC is generally characterized by a high gas temperature exceeding 100 K and rich chemistry observable in molecular emission lines in mm and sub-mm wavelengths. Molecular emission lines such as SO, SO2, CH3OH, and CH3CN are often detected in the spectra of HMCs. In the 50 MC, the SO (NJ = 22 - 11) emission line is clearly detected in spectra of the HMCCs. We find that although the NJ = 23 - 12 emission line of 34SO is also detected, the highly excited NJ = 54 - 44 emission line is not detected with a significance of 3. Then, we further analyze the SO molecular line in order to obtain the spatial and velocity distributions of the molecular gas in the HMCCs.
The CH3OH lines can also be used as tracers of HMCs. We detected six lines of CH3OH in the field of the 50 MC; among them, we here focus on J=21,1-11,0 A– at 96.75828 GHz, which is not blended with other lines above the 3 noise level. Four other lines of CH3OH, i.e., (J=2-1,2-1-1,1 E: 96.73936 GHz), (J=20,2-10,1A+: 96.74138 GHz), (J=20,2-10,1E: 96.74455 GHz), and (J=21,1-11,0E: 96.75551 GHz), are blended with each other and hence are not used in our analysis. The other line, CH3OH (J=6-2,5- 7-1,7E: 85.56808 GHz), is detected as an absorption line. It is known to become a Class-II maser line in some conditions (Cragg2005) and hence is ignored here. The observed frequency bands include several vt=1 high-excitation transitions of the above-mentioned CH3OH lines, which would be emitted from the cores with a high gas temperature (e.g. Barnes2019). However, they are not detected in our observed dust cores and HMCCs.
The other line of our interest is the HC15N emission line. It is optically thin, has a high critical density of 107 cm-3 (e.g. Rolffs2011), and has been used as a probe for high-density and warm cores. Boonman2001 reported that the HCN emission line is enhanced in the dense regions that are at the stage evolving from gravitationally bound cores to HMCs. Moreover, Stephan2018 modeled the spatio-temporal evolution of the chemistry of HMCs and their simulation showed significant HC15N and CH3OH line emissions from warm core. Line emissions from HMCs are not decreased during the evolution of the cores. Since the abundance ratio of 14N/15N varies greatly between 70 and more than 1000 as in prestellar cores (e.g. Ikeda2002), the HC15N emission often becomes weak. The line profiles of HMCCs at the SO emission line are similar to the HC15N emission line(Schilke2001). Consequently, HC15N is a good tracer of a dense and warm core.
Many theoretical and observational studies have been conducted on HMCs; they are generally categorized into two models: a core model with a dust sublimation zone in the vicinity of the central source (Central Source Model: CSM) and another core model in which some external source warms the core (External Source model: ESM) (e.g. Kauffman1998). In the HMC in the CSM, HMPO or earlier HCHII is placed in the center. The ESM is often preferred with observational results of HMCs with UCHIIs. In the ESM model, HMCs may be formed in situations where some shock compresses the molecular gas, resulting in gravitational collapse of the dense core. Nomura2004 studied the evolution of the molecular abundance in HMCs and the abundance ratio of the radius. SO molecules generally increase in abundance as approach the central source. It is known that the abundance of SO is a decreasing function of the radius. The abundances of SO and CH3OH are enhanced by ice evaporation and shock, both of which are triggered by molecular outflows (e.g. Tak2003). Then, the intensity of the emission line may vary even when the temperature is the same. Specifically, in the CMZ, the abundance of SO may have increased due to other shocks. Hence, a HMC can be present near the peak, and a weak filamentary structure may be observed in the vicinity. We should distinguish the SO emission of HMCCs from others such as turbulence and shock caused by CCC.
Tsuboi2015a found a half shell-like feature with a high temperature ratio of T(SiO)/T(H13CO+) in the 50 MC. Given that the abundance of SiO is increased by a C-shock in molecular clouds whereas that of H13CO+ is not affected by the shock (e.g. Amo2011), the feature would be evidence of shock wave propagation in the cloud. Barnes2019 reported signs of embedded star formation in Clouds D and E/F of a part of the CMZ and detected the SO (NJ = 34 - 43) emission, notably from Cloud E. Their images were compact to the extent that the target was not sufficiently resolved with the spatial resolution of their observation of Cloud E (1\farcs270\farcs90 (PA=0\fdg0)), whereas the peak in their images of SO (NJ = 56 – 45) was only moderately compact with weak environment emission. Barnes2019 suggested that the cores in Clouds D and E/F had evolved both physically and chemically and that molecules such as SO had probably originated from regions that harbored embedded star formation (e.g., due to strong shock).
Therefore, comparisons among the SO, CH3OH and HC15N lines, which will be discussed later, can provide clear indication of whether the HMCCs have denser and warmer conditions than the cores observed with the CS and H13CO+ emissions.