DAMPE Collaboration
Measurement of the cosmic ray helium energy spectrum from 70 GeV to 80 TeV with the DAMPE space mission
Abstract
The measurement of the energy spectrum of cosmic ray helium nuclei from 70 GeV to 80 TeV using 4.5 years of data recorded by the DArk Matter Particle Explorer (DAMPE) is reported in this work. A hardening of the spectrum is observed at an energy of about 1.3 TeV, similar to previous observations. In addition, a spectral softening at about 34 TeV is revealed for the first time with large statistics and well controlled systematic uncertainties, with an overall significance of . The DAMPE spectral measurements of both cosmic protons and helium nuclei suggest a particle charge dependent softening energy, although with current uncertainties a dependence on the number of nucleons cannot be ruled out.
pacs:
96.50.S-,96.50.sb,98.70.SaIntroduction. — Galactic cosmic rays (GCRs) are energetic particles traveling across the Galaxy as high-energy beams, and are a unique probe to explore the astrophysical particle accelerators and the interstellar medium of the Galaxy Grenier:2015egx . The energy spectrum of GCRs is expected to be a power-law form for energies below the “knee” (at PeV) according to the canonical shock acceleration of particles. However, several experiments surprisingly observed changes in the power-law spectral indices for protons, helium and heavy nuclei ATIC ; CREAM ; PAMELA ; AMS ; AMSHe ; DAMPEp ; CALET ; NUCLEON . Specifically, the spectra of GCRs become harder by at kinetic energies (or rigidities) of several hundred GeV/n (or GV), and become softer again by at energies of TeV (for protons and possibly helium). The deviations from single power-law of the spectra motivate extensive investigations for deeper understanding of the acceleration and propagation mechanisms or of new possible GCR sources (e.g., Model ).
Precise measurements of the GCR spectra, particularly for individual species, are mainly from magnetic spectrometers such as the Payload for Antimatter-Matter Exploration and Light-nuclei Astrophysics (PAMELA) and Alpha Magnetic Spectrometer (AMS-02) whose maximum measurable rigidity can reach only few TV. Direct measurements at higher energies were mostly done with balloon-borne calorimeter experiments in the past decades, and the uncertainties (both statistical and systematic) are somewhat large, hindering a good understanding of the spectral features above TeV energies ATIC ; CREAM ; NUCLEON ; SOKO ; TRACER .
The DArk Matter Particle Explorer (DAMPE; DAMPE ) is a satellite-borne particle and -ray detector launched on December 17, 2015. It consists of a Plastic Scintillator Detector (PSD) for charge measurement PSD ; PSDCharge , a Silicon Tungsten tracKer-converter (STK) for trajectory measurement STK ; STKalign ; Li:2019 , a Bi3Ge4O12 electromagnetic calorimeter (BGO) for energy measurement and electron-hadron discrimination BGO , and a NeUtron Detector (NUD) for additional electron-hadron discrimination Huang:2020skz . DAMPE is expected to significantly improve the measurement precision of GCR spectra up to 100 TeV energies, due to its large acceptance and a good energy resolution ( for electrons and -rays DAMPEe and for nuclei DAMPEp ). Dedicated calibrations of each sub-detector show that the instrument works very stably on-orbit DAMPECAL . In this letter we report the measurements of the helium spectrum with kinetic energies from 70 GeV to 80 TeV using 4.5 years of the DAMPE flight data. Our results give the first precise measurement of the helium spectral structure above TeV energies.
Monte Carlo simulations. — Extensive Monte Carlo (MC) simulations were carried out to explore the response to particles in the detector. The results presented in this work are based on the GEANT4 toolkit of version 4.10.5 GEANT with the FTFPBERT physics list for helium nuclei between GeV and TeV. For the higher energies ( TeV/n) we also tested the EPOSLHC model via linking the GEANT4 toolkit with the CRMC interface CRMC , and found that the differences were negligible (). The test beam data at 40 GeV/n and 75 GeV/n were used to validate the simulation, and we found a good agreement between data and simulation testbeam . The simulated events were generated with an isotropic source and an spectrum. During the analysis, the simulation data were re-weighted to an spectrum, and the systematic uncertainties from different spectral indices were studied. The isotope 3He was mixed with the 4He sample following the measurements of AMS-02 AMSHeIso , with an extrapolation at higher energies. For protons we used the GEANT4 FTFPBERT physics list between 10 GeV and 100 TeV, and the DPMJET3 model via the CRMC-GEANT4 interface between 100 TeV and 1 PeV DAMPEp .
To evaluate the impact from the uncertainties of hadronic models, we also performed simulations with the FLUKA version 2011.2x FLUKA , which uses DPMJET3 for nucleus-nucleus interaction above GeV/n. The same analysis procedures based on the two simulation samples were carried out, and the final differences of the energy spectra were taken as systematic uncertainties from the hadronic models Jiang:2020nph .
Event selection. — In this analysis we used months of the flight data recorded by DAMPE from January 1st, 2016 to June 30th, 2020. The events when the detector traveled across the South Atlantic Anomaly (SAA) region were excluded. After subtracting the instrumental dead time, which is 3.0725 ms per event ( of the operation time), the on-orbit calibration time (), the time between September 9, 2017 and September 13, 2017 when a giant solar flare affected the operation status of the detector solarflare , and the SAA passage time (), we got a total live time of s, corresponding to of the total operation time.
The data were further filtered with the following steps.
-
•
Pre-selection. A sample of good events was selected with a series of pre-selection criteria. The events passing the High Energy Trigger (HET) were used in this analysis. The HET requires that the energy depositions in the first three BGO layers are higher than about times the proton minimum ionizing particle (MIP) energy (about 23 MeV in one layer) and in the fourth layer is higher than 2.4 times proton MIP energy Zhang:2019 . Besides the HET, we further required that the energy deposition in the first two BGO layers was smaller than that in the third and fourth layers. These conditions guarantee that the shower starts in the beginning of the calorimeter and results in a fairly good energy resolution ( at 1 TeV and at 50 TeV). To avoid the geomagnetic rigidity cut-off effect GEOCUTOFF , the energy deposition in the first 13 layers of the BGO calorimeter was required to be larger than 20 GeV. In this work, the first 13 layers of the calorimeter were used to measure the event energy in order to minimize the effect of the saturation of readout electronic which is most severe in the last BGO layer due to the high gain of this layer. Finally, the energy recorded in each layer was required to be less than of the total deposited energy in the first 13 layers. This requirement effectively excludes particles entering from the sides of the detector.
-
•
STK Track selection. The number of hits of the reconstructed tracks was required to be . The track with the maximum total ADC was chosen if there were more than one candidate tracks passing the number of hits selection, and the reduced of the track fitting was required to be smaller than 35. Then we required a match between the selected STK track and the reconstructed BGO track, with the following two conditions: a) the projected distances on each PSD layer for the STK track and the BGO track were smaller than 90 mm, and b) the average projected distances between the STK track and the centroids of the energy depositions in the first four BGO layers were smaller than 25 mm. Furthermore, to ensure a good shower containment, the reconstructed track was required to be fully contained in the PSD, STK and BGO sub-detectors, and the bar with the maximum energy deposition in each layer was required to be not at the edge of the calorimeter.
-
•
Charge selection.
The helium candidates were selected by the charge measured in PSD and STK. The signal of the first hit in the STK track was requested to be higher than 2.5 times of the MIP-equivalent signal. This is a very loose STK charge selection to suppress proton events. To properly account for the increase of the energy deposition in the PSD bars with higher particle energies (due to the Bethe-Bloch formula and the backscattering particles), a deposited-energy-dependent selection of the charge reconstructed in both PSD layers (-layer for the first and -layer for the second),
(1) , was adopted. Note that the energy-dependence was not considered in the PSD charge reconstruction PSDCharge algorithm, and the “PSD charge” here was not equivalent to the real particle charge. Finally, the PSD charge reconstructed based on the selected track for both layers was required to be within a factor of 2.
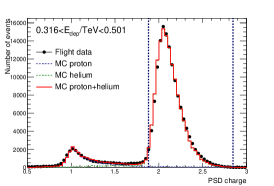
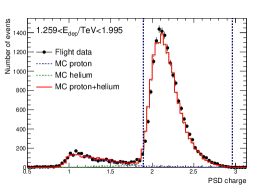
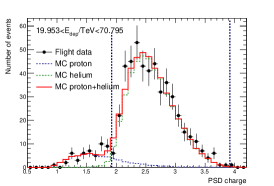
Fig. 1 shows the PSD charge (the minimum of and layer measurements111Note that we selected events using both charge in the and layers of PSD. However, for the background estimate, the template fitting algorithm which will be described below was applied to the one-dimensional PSD charge distribution defined as the minimum of and .) distributions for three selected deposited energy bins, GeV, GeV and TeV. The vertical dashed lines show the PSD charge selection conditions of Eq. (1). After the STK first-point cut, proton candidates were heavily excluded, which enabled a pure helium sample to be selected in our analysis.
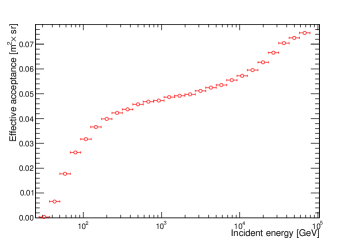
The efficiencies of the selections were obtained from MC simulations. The efficiencies vary with energy, and are about , , and for the pre-selection, track, and charge selections respectively, at 1 TeV. For the validations of the main efficiencies one can refer to the Supplemental Material. The effective acceptance after the selection, as a function of the incident energy for incoming helium nuclei, is shown in Fig. 2. Here the acceptance in the -th incident energy bin is computed as
| (2) |
where is the geometrical factor of the MC event generator sphere, refers to the number of events passing the helium selection, and is total number of generated events. Noteworthy that the effective acceptance in this analysis is higher than that of the proton analysis DAMPEp , mainly due to the fact that helium events have a higher HET efficiency.
Background subtraction. — The main background in helium selection comes from protons. The Landau tail of the proton PSD charge distribution can extend readily to the helium PSD charge window. We employed the MC PSD charge distributions as templates to fit to the data and estimated the background. The template fit was done on the one-dimensional PSD charge distribution of the minimum of and . The PSD charge values reconstructed from the MC data and the flight data did not match precisely, especially at high energies, probably due to the backscattering particles which were not well modeled in the MC simulations. Therefore a smearing of the PSD charge distribution of the MC simulations was applied. The MC templates were shifted and stretched in each deposited energy bin to match with the peaks and widths of the flight data distributions for protons and helium nuclei individually. After the charge smearing, the MC results can well fit the flight data, as shown in Fig. 1. The contaminations of protons were then estimated by counting the number of proton MC events lying in the helium charge window. The proton background varies between for deposited energy of 20 GeV and for 60 TeV. The background fraction in the full energy range is shown in Fig. S5 of the Supplemental Material.
Energy measurements and spectral unfolding. — In this work we used the first 13 layers of the BGO calorimeter to measure the energy of an event. We also performed two corrections of the energy measurement, as described below. A large energy deposit (approximately above 4 TeV) in a single BGO bar might result in a saturation even of the low-gain readout channel DAMPE ; SATURATION . In most cases, the saturation occurred only for a single BGO bar per event. The adoption of 13 layers can effectively exclude the events with multiple saturated bars. We developed a method based on the MC simulations to correct the energy measurements for the saturated events SATURATION . The other correction was performed in order to account for the Birks’ quenching in BGO, which occurred for very low velocity secondary particles Birks:1951 . The effect is more significant for heavy nuclei since more secondary particles with large charge and low velocity are produced. We took this effect into account through adding a quenching term in the MC simulations when the ionization energy density was larger than 10 MeV/mm Wei:2020 . The quenching effect would result in lower deposition of the shower energy for GeV incident energy, which translates into higher helium flux at such an energy after the unfolding. An impact of the quenching effect at different energies is demonstrated in Fig. S6 of the Supplemental Material.
An unfolding procedure is necessary to obtain the incident energy spectrum, since only a fraction of the energy of a nucleus can be deposited in the calorimeter. The observed number of events in the -th deposited energy bin is related to the incident numbers of events as
| (3) |
where is the probability that particles in the -th incident energy bin contributing to the -th deposited energy bin. The response matrix for helium nuclei from the GEANT4 FTFP_BERT simulations is given in Fig. S7 of the Supplemental Material. In this work we used the Bayesian unfolding method DAGOSTINI to derive the incident numbers of events, which were then used to obtain the incident energy spectrum.
Results. — The differential helium flux in the incident energy bin is given by
| (4) |
where is the energy bin width, is the unfolded number of events, is the effective acceptance, and is the total live time. The helium spectrum weighted by in the energy range from GeV to TeV is shown in the top panel of Fig. 3. The error bars show the statistical uncertainties, and the inner and outer shaded bands show the systematic uncertainties from the analysis procedure and the hadronic models, respectively. We also give the fluxes and the associated uncertainties of our measurement in Table S2 of the Supplemental Material. The bottom panel of Fig. 3 shows a comparison of the DAMPE measurement with previous direct measurements by space and balloon-borne detectors PAMELA ; AMSHe ; CREAM ; ATIC ; NUCLEON . Note that to convert the energy of a helium nucleus to the kinetic energy per nucleon, we assumed an isotope ratio of 3He/4He from the AMS-02 measurements AMSHeIso . For the results from other experiments, a pure 4He sample was usually assumed.
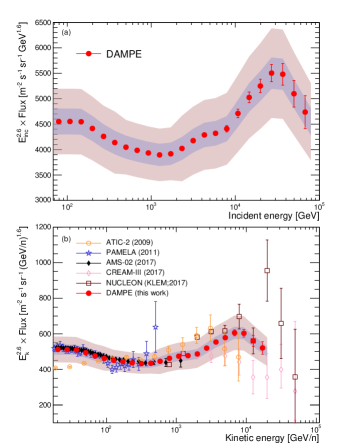
The statistical uncertainties come from the Poisson fluctuations of the number of detected events as well as the MC sample size. Due to the unfolding procedure, the statistical uncertainties cannot be simply translated into the incident energy bins. Following Ref. DAMPEp , we generated toy-MC samples based on the numbers of detected events and selected MC events following Poisson distributions in each deposited energy bin, and carried out the spectral unfolding for each simulated observation. The root-mean-square of the final helium fluxes in each incident energy bin is adopted as the statistical uncertainty.
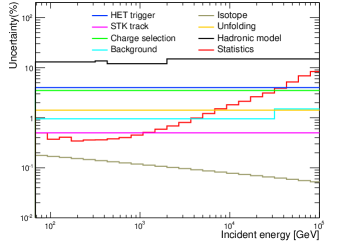
There are several sources of systematic uncertainties of the measurements. For the event selections, we used the differences between the flight data and the MC simulations for control samples to evaluate the systematic uncertainties. The results turn out to be about for the HET efficiency (), for the track selection efficiency (), for the charge selection efficiency (). We re-weighted the spectrum of the MC simulations with spectral index changing from 2.0 to 3.0, and found that the helium fluxes changed by . The analysis using energy measurements with 14 layers of the BGO calorimeter led to differences from the results presented here. These two were combined together to give systematic uncertainties from the spectral unfolding, . The 3He/4He isotope ratio, which mainly affects the calculation of the average number of nucleons, was estimated to contribute to about () of the fluxes at low energies ( GeV) and even smaller at higher energies via varying the ratio by which is conservative according to the AMS-02 measurements AMSHeIso . We also estimated the effect of background subtraction through varying the PSD charge selection of Eq. (1) by , and found that the results differed by about (). The total systematic uncertainty from the analysis was given by the quadrature sum of the above uncertainties, which was about . The absolute energy scale of the measurement, whose uncertainty was estimated to be based on the geomagnetic cutoff of scale , would result in a global but tiny shift of the spectrum, and was not included in the total systematic uncertainty. Different analyses obtained consistent results within the uncertainties.
The largest systematic uncertainty comes from the hadronic interaction models. In this work we used the differences between the results based on the GEANT4 and FLUKA simulations as the hadronic model systematic uncertainties, which turned out to be about for incident energies above GeV. At lower energies, we used the test beam data of Helium with kinetic energies 40 GeV/n and 75 GeV/n testbeam to estimate the efficiencies and energy deposit ratios, and obtained the flux differences between the test beam data and simulation data of . Thus the systematic uncertainties from the hadronic model below 300 GeV were estimated as . The statistical and systematic uncertainties for different incident energies are summarized in Fig. S8 of the Supplemental Material.
From Fig. 3 we can observe that the Helium spectrum experiences a hardening at TeV energies and then shows a softening around TeV. The spectral fitting (see the Supplemental Material which includes Ref. Abdollahi:2017nat ) gave a significance of the hardening of , and a hardening energy of TeV. What is more interesting is the softening feature which is clearly shown in the DAMPE spectrum. A possible softening of the spectrum was reported by previous measurements CREAM ; NUCLEON , but the limited statistics and the large systematic uncertainties prevented a conclusion on this specific point. The significance of the softening from the DAMPE measurements is about . The softening energy is found to be TeV, with a spectral change . Together with the softening energy of the DAMPE proton spectrum, TeV DAMPEp , the results are consistent with a charge-dependent softening energy of protons and helium nuclei, although a mass-dependent softening cannot be excluded by current data.
Summary. — The GCR helium spectrum from 70 GeV to 80 TeV is measured with 4.5 years of the DAMPE data. We confirm the hardening feature of the helium spectrum reported by previous experiments. The hardening is smooth with a hardening energy of TeV. The DAMPE data further reveals a softening feature at TeV with a high significance of . Combined with the proton spectrum, the softening energy is well consistent with a dependence on particle charge, although a dependence on particle mass can not be ruled out yet. These results will provide important implications in understanding GCR acceleration or propagation processes. Extending the DAMPE measurements to even higher energies is possible with new data and improved analysis performance.
Acknowledgements. — The DAMPE mission was funded by the strategic priority science and technology projects in space science of Chinese Academy of Sciences. In China the data analysis is supported by the National Key Research and Development Program of China (No. 2016YFA0400200), the National Natural Science Foundation of China (Nos. 11921003, 11622327, 11722328, 11851305, U1738205, U1738206, U1738207, U1738208, U1738127), the strategic priority science and technology projects of Chinese Academy of Sciences (No. XDA15051100), the 100 Talents Program of Chinese Academy of Sciences, the Young Elite Scientists Sponsorship Program by CAST (No. YESS20160196), and the Program for Innovative Talents and Entrepreneur in Jiangsu. In Europe the activities and data analysis are supported by the Swiss National Science Foundation (SNSF), Switzerland, the National Institute for Nuclear Physics (INFN), Italy, and the European Research Council (ERC) under the European Union’s Horizon 2020 research and innovation programme (No. 851103).
References
- (1) I. A. Grenier, J. H. Black, and A. W. Strong, Annu. Rev. Astron. Astrophys. 53, 199 (2015).
- (2) A. D. Panov et al. (ATIC Collaboration), Bull. Russ. Acad. Sci. Phys. 73, 564 (2009).
- (3) H. S. Ahn et al. (CREAM Collaboration), Astrophys. J. Lett. 714, L89 (2010); Y. S. Yoon et al. (CREAM Collaboration), Astrophys. J. 839, 1 (2017).
- (4) O. Adriani et al. (PAMELA Collaboration), Science 332, 69 (2011); O. Adriani et al. (PAMELA Collaboration), Adv. Space Res. 51, 219 (2013).
- (5) M. Aguilar et al. (AMS Collaboration), Phys. Rev. Lett. 114, 171103 (2015); M. Aguilar et al. (AMS Collaboration), Phys. Rev. Lett. 120, 021101 (2018); M. Aguilar et al. (AMS Collaboration), Phys. Rev. Lett. 124, 211102 (2020).
- (6) M. Aguilar et al. (AMS Collaboration), Phys. Rev. Lett. 115, 211101 (2015); M. Aguilar et al. (AMS Collaboration), Phys. Rev. Lett. 119, 251101 (2017);
- (7) Q. An et al. (DAMPE Collaboration), Science Advances 5, eaax3793 (2019).
- (8) O. Adriani et al. (CALET Collaboration), Phys. Rev. Lett. 122, 181102 (2019);
- (9) E. Atkin et al. (NUCLEON Collaboration), J. Cosmol. Astropart. Phys. . 07, 020 (2017).
- (10) A. E. Vladimirov, G. Johannesson, I. V. Moskalenko, and T. A. Porter. Astrophys. J. 752, 68 (2012); P. Blasi, E. Amato, and P. D. Serpico. Phys. Rev. Lett. 109, 061101 (2012); S. Thoudam and J. R. Hoerandel. Astron. Astrophys. 567, A33 (2014); P. Lipari, Astropart. Phys. 97, 197 (2018); C. Yue et al. Front. Phys. 15, 24601 (2020).
- (11) I. P. Ivanenko et al., Int. Cosmic Ray Conf. 2, 17 (1993).
- (12) A. Obermeier, et al., Astrophys. J. 742, 14, (2011).
- (13) J. Chang et al. (DAMPE Collaboration), Astropart. Phys. 95, 6 (2017).
- (14) Y. H. Yu et al., Astropart. Phys. 94, 1 (2017).
- (15) M. Ding et al., Res. Astron. Astrophys. 19, 47 (2019); T. K. Dong et al., Astropart. Phys. 105, 31 (2019).
- (16) P. Azzarello et al., Nucl. Instrum. Meth. A 831, 378 (2016).
- (17) A. Tykhonov et al., Nucl. Instrum. Meth. A 893, 43 (2018).
- (18) X. Li et al., PoS ICRC2019, 576 (2020).
- (19) Z. Zhang et al., Nucl. Instrum. Meth. A 836, 98 (2016).
- (20) Y. Y. Huang et al., Res. Astron. Astrophys. 20, 153 (2020).
- (21) G. Ambrosi et al. (DAMPE Collaboration), Nature 552, 63 (2017).
- (22) G. Ambrosi et al., Astropart. Phys. 106, 18 (2019); P. X. Ma et al., Res. Astron. Astrophys. 19, 082 (2019); A. Tykhonov et al., Nucl. Instrum. Meth. A 924, 309 (2019).
- (23) S. Agostinelli et al., Nucl. Instrum. Meth. A 506, 250 (2003).
- (24) CRMC (Cosmic Ray Monte Carlo package); https://web.ikp.kit.edu/rulrich/crmc.html; A. Tykhonov et al., PoS. ICRC2019, 143 (2019).
- (25) Y. Wei et al., Nucl. Instrum. Meth. A 922, 177 (2019); Y. Zhang et al., Nucl. Instrum. Meth. A 953, 163139 (2020).
- (26) M. Aguilar et al. (AMS Collaboration), Phys. Rev. Lett. 123, 181102 (2019).
- (27) T. T. Bohlen et al., Nucl. Data. Sheets 120, 211 (2014).
- (28) W. Jiang et al., Chin. Phys. Lett. 37, 119601 (2020).
- (29) https://solarflare.njit.edu/datasources.html
- (30) Y. Q. Zhang et al., Res. Astron. Astrophys. 19, 123 (2019).
- (31) E. Thébault, et al., Earth Planet. Space 67, 79 (2015).
- (32) C. Yue et al., Nucl. Instrum. Meth. A 984, 164645 (2020).
- (33) J. B. Birks, Proc. Phys. Soc. Sect. A 64, 874-877 (1951).
- (34) Y. F. Wei et al., IEEE Trans. Nucl. Sci. 67, 939-945 (2020).
- (35) G. D’Agostini, Nucl. Instrum. Meth. A 362, 487 (1995).
- (36) J. J. Zang et al., PoS ICRC2017, 197 (2017).
- (37) S. Abdollahi et al., Phys. Rev. D 95, 082007 (2017).
I Supplemental Material
I.1 Event topology
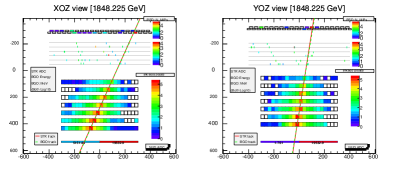
Fig. S1 shows the topology of a typical event in all sub-detectors of DAMPE passing the helium selection.
I.2 Efficiency validations
I.2.1 HET efficiency
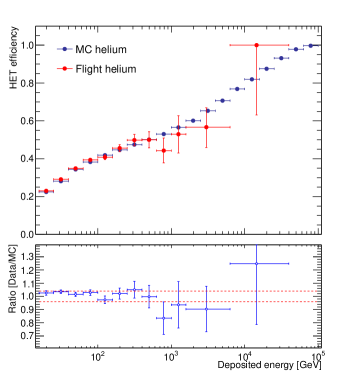
The DAMPE detector implements four different triggers: the Unbiased trigger (UNBT), the Minimum Ionizing Particle trigger (MIPT), the Low Energy trigger (LET), and the HET [13]. Different pre-scale factors are applied for the UNBT, MIPT, and LET events, when the satellite operates at different latitudes. The UNBT, which is the least restrictive trigger, is used to estimate the HET efficiency. The HET efficiency is calculated as
| (5) |
where is the number of events with both the HET and UNBT activated, and is the number of the UNBT events. The resulting HET efficiencies as functions of the deposied energy inside the BGO calorimeter for both the flight and MC data are shown in Fig. S2. The UNBT sample has a pre-scale factor of 1/512 (1/2048) when the satellite operates in (out of) the geographical latitude range . Therefore at high energies the statistical uncertainties of the flight data are large. The relative differences between the flight data and the simulated data were estimated to be , which were adopted as the systematic uncertainty from the trigger.
I.2.2 Track efficiency
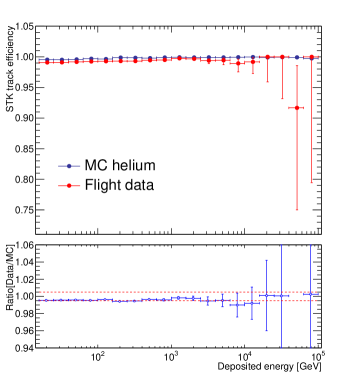
Given successful reconstruction of tracks of an event, two types of tracks are available: the ones reconstructed by STK and the one by BGO hits. The STK tracks are usually used in the standard analysis since they are much more precise than the BGO track. The evaluation of the STK track efficiency (including both reconstruction and selection) is performed through choosing a helium sample based on BGO tracks and PSD charge, and then investigating the efficiency that passes the STK track selection. The STK track efficiency is given by
| (6) |
where is the number of events selected with the BGO track matching with the PSD charge and is the number of events which further passes the STK track selection used in the present analysis. Fig. S3 shows the comparison of the track efficiency between the flight data and MC simulations, for different deposited energies. Small differences of about is observed.
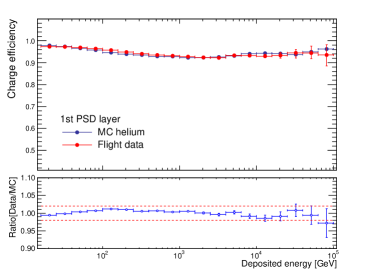
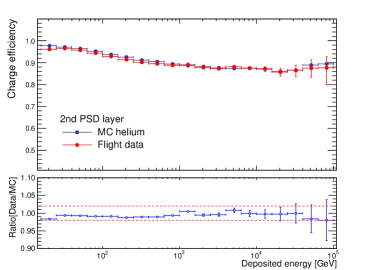
I.2.3 Charge selection efficiency
The efficiencies related to the charge selection are estimated independently for each PSD layer, using the measurements provided by the first cluster point of the STK track. As an example, the efficiency of the first PSD layer is calculated as the ratio of event number selected using the charge of both PSD layers and the first cluster point of STK track () to the number selected using only the second PSD layer and the first cluster of STK track ():
| (7) |
A similar way applies to the second PSD layer.
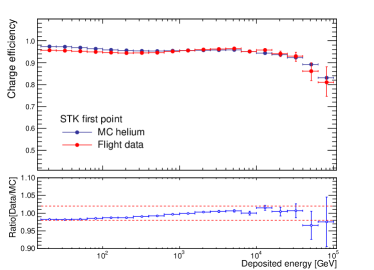
For the selection efficiency of the first STK cluster point, the control sample is selected using the PSD. The STK charge efficiency is calculated as
| (8) |
The comparison between flight data and MC simulations are shown in Figs. S4 and S5. The differences are found to be about for both PSD layers and for the STK cluster point, respectively. The total systematic uncertainties from the charge selection are thus adopted as .
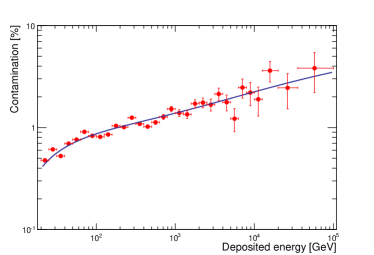
I.3 Background
After our selection procedure, the remaining background of helium nuclei is dominated by protons. The electron background and the background from heavier nuclei (such as lithium) are negligibly small. The fit of the PSD charge distribution (the minimum of the two PSD charge values) using the MC templates which are smeared to match with the data is performed in each deposited energy bin. The residual proton backgrounds are then estimated using the best-fit proton templates with the helium PSD charge selection of Eq. (1). The results are presented in Fig. S6.
I.4 Energy corrections
The linear region of the energy measurement of a single BGO crystal can extend up to TeV for the dynode-2 readout device [13]. For very few highest energy events, saturation may occur for usually the BGO bar with the maximum energy deposition. A correction method based on MC simulations was developed based on the shower transverse and longitudinal developments [31], which was applied for the energy correction of those saturated events.
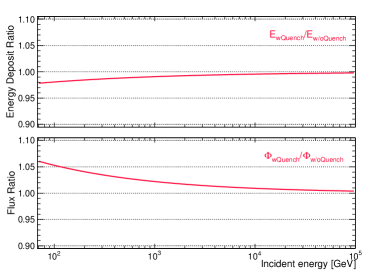
When the energies of secondary particles in the shower are low enough, large amounts of ionization energy are deposited in the scintillator within very short traveling distances, resulting a nonlinearity between the scintillation photons and the ionization energy, known as the quenching effect [32]. The quenching effect would result in an under-estimate of the true energy of a shower. Using the test beam ion data and the ion MIP events from the flight data, the quenching parameters of the DAMPE BGO scintillator were derived [33]. We implemented this quenching effect in the MC simulations, and investigated its impact on the energy measurement and response matrix calculation. The ratio of the mean energy deposition with the BGO quenching to that without the quenching is shown in the top panel of Fig. S7. Considering the quenching effect will lead to () lower energy deposition for helium incident energy of 80 GeV (80 TeV). Using the corresponding response matrix, we get the helium spectrum, whose ratio to the spectrum without considering the quenching effect is shown in the bottom panel of Fig. S7. The impact on the unfolded spectrum varies from at 80 GeV to at 80 TeV.
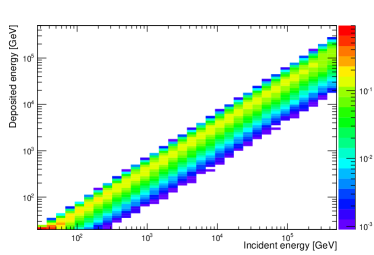
Fig. S8 shows the energy response matrix based on the GEANT4 FTFP_BERT model, after including the quenching effect. The color represents the relative probability that a helium nucleus with incident energy deposits energy in the calorimeter. The energy resolution of helium can thus be inferred to be about for incident energies from 100 GeV to 80 TeV.
I.5 Observed counts, unfolded fluxes, and systematic uncertainties
Table S1 gives the numbers of selected helium candidates for deposited energies from 20 GeV to 32 TeV. The contamination from protons as shown in Fig. S6 has not been subtracted.
| Counts | ||
|---|---|---|
| ( GeV) | ( GeV) | |
| 0.020 | 0.025 | 3921850 |
| 0.025 | 0.032 | 3379910 |
| 0.032 | 0.040 | 2748360 |
| 0.040 | 0.050 | 2128160 |
| 0.050 | 0.063 | 1586940 |
| 0.063 | 0.079 | 1145530 |
| 0.079 | 0.100 | 808389 |
| 0.100 | 0.126 | 562406 |
| 0.126 | 0.158 | 386395 |
| 0.158 | 0.200 | 264417 |
| 0.200 | 0.251 | 180063 |
| 0.251 | 0.316 | 122885 |
| 0.316 | 0.398 | 83617 |
| 0.398 | 0.501 | 57103 |
| 0.501 | 0.631 | 39222 |
| 0.631 | 0.794 | 27143 |
| 0.794 | 1.000 | 19057 |
| 1.000 | 1.259 | 13463 |
| 1.259 | 1.585 | 9538 |
| 1.585 | 1.995 | 6664 |
| 1.995 | 2.512 | 4747 |
| 2.512 | 3.162 | 3344 |
| 3.162 | 3.981 | 2486 |
| 3.981 | 5.012 | 1871 |
| 5.012 | 6.310 | 1319 |
| 6.310 | 7.943 | 950 |
| 7.943 | 10.00 | 720 |
| 10.00 | 12.59 | 561 |
| 12.59 | 15.85 | 332 |
| 15.85 | 19.95 | 243 |
| 19.95 | 25.12 | 157 |
| 25.12 | 31.62 | 99 |
Table S2 gives the helium fluxes after the background subtraction and the unfolding procedure. The relative uncertainties of the fluxes are shown in Fig. S9.
| ( GeV) | ( GeV) | ( GeV) | [GeV-1 m-2 s-1 sr-1] |
|---|---|---|---|
| 0.068 | 0.093 | 0.079 | () |
| 0.093 | 0.125 | 0.108 | () |
| 0.125 | 0.171 | 0.146 | () |
| 0.171 | 0.232 | 0.199 | () |
| 0.232 | 0.316 | 0.270 | () |
| 0.316 | 0.430 | 0.367 | () |
| 0.430 | 0.584 | 0.499 | () |
| 0.584 | 0.794 | 0.679 | () |
| 0.794 | 1.079 | 0.923 | () |
| 1.079 | 1.466 | 1.254 | () |
| 1.466 | 1.993 | 1.705 | () |
| 1.993 | 2.709 | 2.317 | () |
| 2.709 | 3.682 | 3.150 | () |
| 3.682 | 5.005 | 4.281 | () |
| 5.005 | 6.803 | 5.819 | () |
| 6.803 | 9.247 | 7.910 | () |
| 9.247 | 12.57 | 10.75 | () |
| 12.57 | 17.08 | 14.61 | () |
| 17.08 | 23.22 | 19.86 | () |
| 23.22 | 31.56 | 27.00 | () |
| 31.56 | 42.90 | 36.70 | () |
| 42.90 | 58.32 | 49.88 | () |
| 58.32 | 79.27 | 67.80 | () |
I.6 Spectral fitting
To quantify the spectral features, the fits to the helium spectrum (Table S3) are made. The function used in the fit is a smoothly broken power-law (SBPL) form
| (9) |
where is the flux normalization, is the spectral index for energies far below the break energy , is the change of the spectral indices above , and is a parameter describing the smoothness of the break.
The helium spectrum is characterized by a clear hardening at TeV followed by a softening approaching TeV (Fig. 3). We therefore carry out the fit in different energy ranges to address these features individually. To take into account possible bin-to-bin correlations of the systematic uncertainties, we employ the nuisance parameter method as described in detail in Refs. [7, 36]. The function is thus defined as
| (10) | |||||
where and are the median energy and flux of the measurement in the -th energy bin, is the covariance matrix of the fluxes derived from the toy MC simulation when evaluating the statistical uncertainties, is the model predicted flux, is a piecewise function defined by its value , and is the relative systematic uncertainty of the data in corresponding energy range covered by the -th nuisance parameter. The nuisance parameters enable flux adjustments in various bins. Note that here we single out the systematic uncertainties from the hadronic models.
| Hardening | Softening | |
| Fit range | TeV | TeV |
| Nuisance parameters | 3 | 2 |
| ( GeV-1 m-2 s-1 sr-1) | ||
| (TeV) | ||
| 5.0 (fixed) |
For the hardening feature, the fit is performed in the range of TeV, and 3 nuisance parameters are adopted. The SBPL fit results in a reduced chi-squared value of , where dof is the number of degrees of freedom. The value is big, possibly due to the small irregularities of the spectrum induced by the unfolding. The parameters are given in Table S3. Compared with a single power-law model fit with , the SBPL model is favored at a significance of for three more free parameters. A caveat is that this significance may be over-estimated given the large values in both fits with the SBPL and single power-law models. The spectral indices of the PAMELA helium measurement are , for rigidities below and above GV [4]. The results of AMS-02 are , , and the break rigidity is GV [6]. The low-energy spectral index of the DAMPE measurement () is slightly harder than those of PAMELA and AMS-02. The value of of the DAMPE measurement () lies between those of PAMELA and AMS-02. The break energy we get ( TeV) is higher than those of PAMELA and AMS-02. Part of the differences may come from the different energy ranges adopted in the fits. To estimate the effect on the fitting parameters from the hadronic models, we carry out separate fit to the fluxes derived with the FLUKA simulations, and the differences are given as the second errors in Table S3.
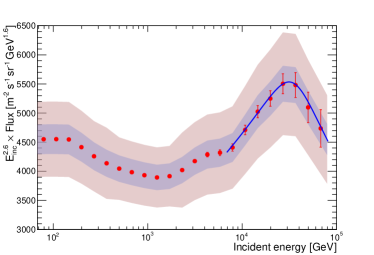
The softening is studied in the range of TeV. We adopt 2 nuisance parameters in this narrow energy range. Given the relatively large uncertainties of the data, the smoothness parameter cannot be effectively constrained by the data, and we fix it to be 5 for a consistency with that adopted in our proton analysis paper [7]. The fitting results are GeV-1 m-2 s-1 sr-1, , , TeV, and . For a fit with a single power-law function we get . Therefore we get a significance of the spectral softening of , given two more free parameters of the SBPL model. The best-fitting result of the softening structure, together with the DAMPE measurements, is shown in Fig. S10. Compared with the TeV break energy of the DAMPE proton spectrum [7], the softening energies of both protons and helium nuclei are consistent with a charge-dependent scenario. The break energy is higher if the FLUKA simulation is used (see Table S3). Therefore our current results cannot rule out a mass-dependent softening scenario.
We also assume an exponentially cutoff power-law (ECPL) function to describe the softening feature, and the fitting gives GeV-1 m-2 s-1 sr-1, , TeV, and . The current data may not be able to distinguish the ECPL model from the SBPL one. We expect that future measurement of the helium spectrum to higher energies by DAMPE with larger statistics and better control of systematic uncertainties will be very helpful in testing the detailed behavior of the spectral softening.