pnasresearcharticle \leadauthorWiggermann \authordeclarationThe authors have no conflicts of interest to declare. \correspondingauthoraCorresponding author. E-mail: vanessaw@drcmr.dk
In vivo investigation of the multi-exponential T2 decay in human white matter at 7 T: Implications for myelin water imaging at UHF
Abstract
Multi-component T2-mapping using a gradient and spin-echo (GraSE) acquisition has become standard for myelin water imaging at 3T. Higher magnetic field strengths promise signal-to-noise ratio benefits but face specific absorption rate limits and shortened T2 times. This study investigates compartmental T2 times in vivo and addresses advantages and challenges of multi-component T2-mapping at 7T. We acquired 3D multi-echo GraSE data in seven healthy adults at 7T, with three subjects scanned also at 3T. Stimulated echoes arising from B-inhomogeneities were accounted for by the extended phase graph (EPG) algorithm. We used the computed T2 distributions to determine T2 times that identify different water pools and assessed signal-to-noise and fit-to-noise characteristics of the signal estimation. We compared short T2 fractions and T2 properties of the intermediate water pool at 3T and 7T. Flip angle mapping confirmed that EPG accurately determined the larger B-inhomogeneity at 7T. Multi-component T2 analysis demonstrated shortened T2 times at 7T compared to 3T. Fit-to-noise and signal-to-noise ratios were improved at 7T but depended on B-homogeneity. Lowering the shortest T2 to 8 ms and adjusting the T2 threshold that separates different water compartments to 20 ms, yielded short T2 fractions at 7T that conformed to 3T data. Short T2 fractions in myelin-rich white matter regions were lower at 7T than at 3T, and higher in iron-rich structures. Adjusting the T2 compartment boundaries was required due to the shorter T2 relaxation times at 7T. Shorter echo spacing would better sample the fast decaying signal but would increase peripheral nerve stimulation. Multi-channel transmission will improve T2 measurements at 7T. We used a multi-echo 3D-GraSE sequence to characterize the multi-exponential T2 decay at 7T. We adapted T2 parameters for evaluation of the short T2 fraction. Obtained 7T multi-component T2-maps were in good agreement with 3T data.
keywords:
ultra-high field MRI myelin T2 relaxation gradient-echo spin-echo multi exponential EPGdoi:
bioRivThis is the pre-peer reviewed version of the following article: Wiggermann et al. NMR Biomed 2020, which has been published in final form at DOI:10.1002/nbm.4429. This article may be used for non-commercial purposes in accordance with Wiley Terms and Conditions for Use of Self-Archived Versions.
The ability to non-invasively obtain surrogate metrics for myelin concentrations in vivo, makes MRI ideally suited for studying brain myelination during early development (1, 2), alterations in myelin during healthy aging (3), concussion (4) and in neurodegenerative diseases, such as multiple sclerosis (MS) (5). The increased availability of 7 T MR scanners generates the need for transferring myelin-specific techniques from 3 T to ultra-high fields (UHFs). T2-based myelin water imaging (MWI), in particular, has proven to be specific to myelin lipids (6, 7, 8) and less sensitive to axons and variations in T1 (9) than other myelin-sensitive techniques (10, 11). Axonal myelin, which ensures rapid neural signal transmission, consists of multiple phospholipid bilayer sheaths. Water trapped within these bilayers, the myelin water (MW), has restricted mobility and thus exhibits faster T2 decay than water in intra- and extracellular spaces (IEW). In MWI, the short T2 signal fraction is extracted from measured multi-exponential T2 decay data, which are characteristic for myelinated tissues of the central and peripheral nervous system (12, 13).
To date, MWI has been performed at field strengths up to 3 T. Given that the MW fraction computation is sensitive to noise (14), MWI may benefit from the increased signal-to-noise ratio (SNR) at 7 T. However, increased B-inhomogeneity and specific absorption rate (SAR) (15) challenge its implementation at UHFs. With the introduction of the extended phase graph (EPG) (16, 17), the effect of B-inhomogeneity on the T2 decay can now be accurately modeled. Furthermore,whole brain 3D encoding has become possible by replacing the Carr-Purcell-Meiboom-Gill (CPMG) with an accelerated gradient- and spin-echo (GraSE) acquisition (18), which is now the standard at 3 T. Prolonged data acquisition times at UHFs that result from longer TR to meet SAR constraints can also be alleviated by GraSE acceleration.
Here, we adapted a multi-echo 3D GraSE protocol from 3 T to 7 T to investigate the feasibility and challenges of estimating the myelin-associated short T2 fraction in vivo at 7 T. Because changes in T2 times occur (19), it is critical to determine the 7 T T2 characteristics of all water pools for in vivo MWI (20). We performed multi-component T2 analysis of the acquired decay data, including application of the EPG algorithm (16, 17) to account for stimulated echoes due to imperfect signal refocusing. We then studied the T2 distributions in healthy white matter (WM) at 7 T and assessed the noise properties of the data. T2 component boundaries appropriate for 7 T were established based on data from three travelling brains. Estimated short T2 fractions in white and gray matter regions at 7 T were compared with those at 3 T.
Experimental
In vivo data acquisition
Seven healthy adults (5 male/ 2 female, age range 21 to 51 years, mean 29 years) were examined on an actively shielded 7 T whole-body Achieva MR system (software level R5.1, Philips Healthcare, Best, The Netherlands, located at the National 7 T facility in Lund, Sweden), using a dual transmit birdcage coil and a 32-channel receive array (Nova Medical, Boston, MA). For comparison, three of these subjects were also scanned on a 3 T Philips Achieva MR system at the University of British Columbia, Vancouver, Canada, using the body transmit coil and an 8-channel receive head coil. Examinations had been approved by the local ethics committees at both sites and written informed consent was obtained prior to each session.
In line with the current implementation of MWI at 3 T1 (18), an accelerated 3D 32-echo GraSE acquisition (EPI factor = 3) was used at both field strengths. Acquisition parameters were: TE1/TE = 10 ms/10 ms, acquired voxel size mm3 with a slice oversampling factor of 1.3, reconstructed to mm3, 40 transversal slices. The 3D volume was aligned to the subcallosal plane. TR was 1000 ms at 3 T and 1670 ms at 7 T, the minimum TR compliant with SAR limits. The latter value was obtained using non-selective radiofrequency pulses of the smallest permitted amplitude, 10 T. Over-contiguous slices were acquired and a SENSE factor of two was used in the left-right direction at both field strengths. At 7 T, the short axial extent the head coil allowed for additional SENSE acceleration in the head-feet direction by a factor of 1.5, yielding a total acquisition time of 11 min per scan as compared to 14 min at 3 T. In addition, a 3D turbo field echo T1-weighted anatomical reference of 200 sagittal images was acquired with TI = 1200 ms, 3500 ms shot interval, mm3 voxel size, readout TE/TR = 1.97/8 ms, flip angle (FA) = 8∘, SENSE = 2.5 in slice direction. Axial FA maps were acquired using DREAM (21) at TE/TE = 1.81 ms/1.4 ms, preparation FA = 40∘ and read-out FA = 7∘.
GraSE data processing
All data analysis was conducted at the University of British Columbia using in-house developed software running on MATLAB 2017b. A detailed description of the T2 analysis can be found elsewhere (20, 22). Briefly, EPG was employed to model stimulated echoes in the T2 decay arising from imperfect refocusing angles in the echo train (16, 17). Thereafter, T2 distributions were extracted on a voxel-by-voxel basis by regularized non-negative least squares fitting (T2 grid with 40 T2 times, / = 1.02). Different water compartments of a voxel were distinguished by their specific T2 intervals. The short fraction signifies signal contributions between the shortest T2 time (T2,min) and the T2 cut-off time (T2,cut), separating short T2 signal from other, intermediate T2 signal components. Adequate T and T were established by comparison of 7 T to 3 T data. By choosing the maximum T2 = 2s, we accounted for occasional long T2 signal originating from cerebrospinal fluid. T2 signal fractions were estimated from the integral of the respectively established T2 interval divided by the integral of the entire T2 distribution (12). In the following, we refer to short and intermediate T2 fractions, peaks and water pools, rather than explicitly calling them MW and IEW. In addition to estimating the pool fractions, the geometric mean T2 of the intermediate water pool, EPG-derived FA maps, as well as the signal-to-noise (SNR) and fit-to-noise ratio (FNR) per voxel were computed. The surrogate measure of SNR is the ratio of the signal from the first echo, relative to the square root of the variance of the fitting residuals, i.e. the difference between the computed and measured T2 decay. The FNR is the sum of all fitted T2 signal amplitudes relative to the square root of the variance of the fitting residuals. These parameters were assessed to establish goodness-of-fit and reliability of the short T2 estimation.
Region-of-interest (ROI) analysis
Quantitative ROI analysis was performed in each subject’s GraSE-space. The average short T2 fractions, the geometric meanT2 values and FNR were evaluated within seven ROIs. In line with literature comparing MWI at 1.5 T and 3 T (23, 24, 25), the ROIs comprised four WM regions: the genu and splenium of the corpus callosum (CC), the internal capsules (anterior and posterior, IC) as well as the superior longitudinal fasciculus, and three regions of gray matter (GM): the thalamus, putamen and cingulate gyrus. To obtain the ROIs, we reoriented the sagittal 3D T1-weighted volumes to axial slices, corrected for intensity biases by the N3-algorithm as implemented in FreeSurfer (26), and performed brain extraction in FSL (27). The T1-weighted volumes were then non-linearly registered to the MNI152 standard space using FLIRT (28, 29) and FNIRT (30, 31). Subsequently, the matrices were inverted to warp the Harvard-Oxford subcortical 1 mm atlas (32) and the Jülich ICBM-1mm labels (33) onto the individual T1-spaces. The T1-weighted images and the atlas-based ROIs were then mapped onto a single-echo of the 3D-GraSE sequence using NiftyReg (34). ROI voxels affected by interpolation and cerebrospinal fluid were removed by thresholding. To compare the 7 T and 3 T data in the travelling brains, the 7 T GraSE ROIs were linearly co-registered to the 3 T GraSE data using NiftyReg (34).
Results
Comparison of individual 3 T and 7 T GraSE images
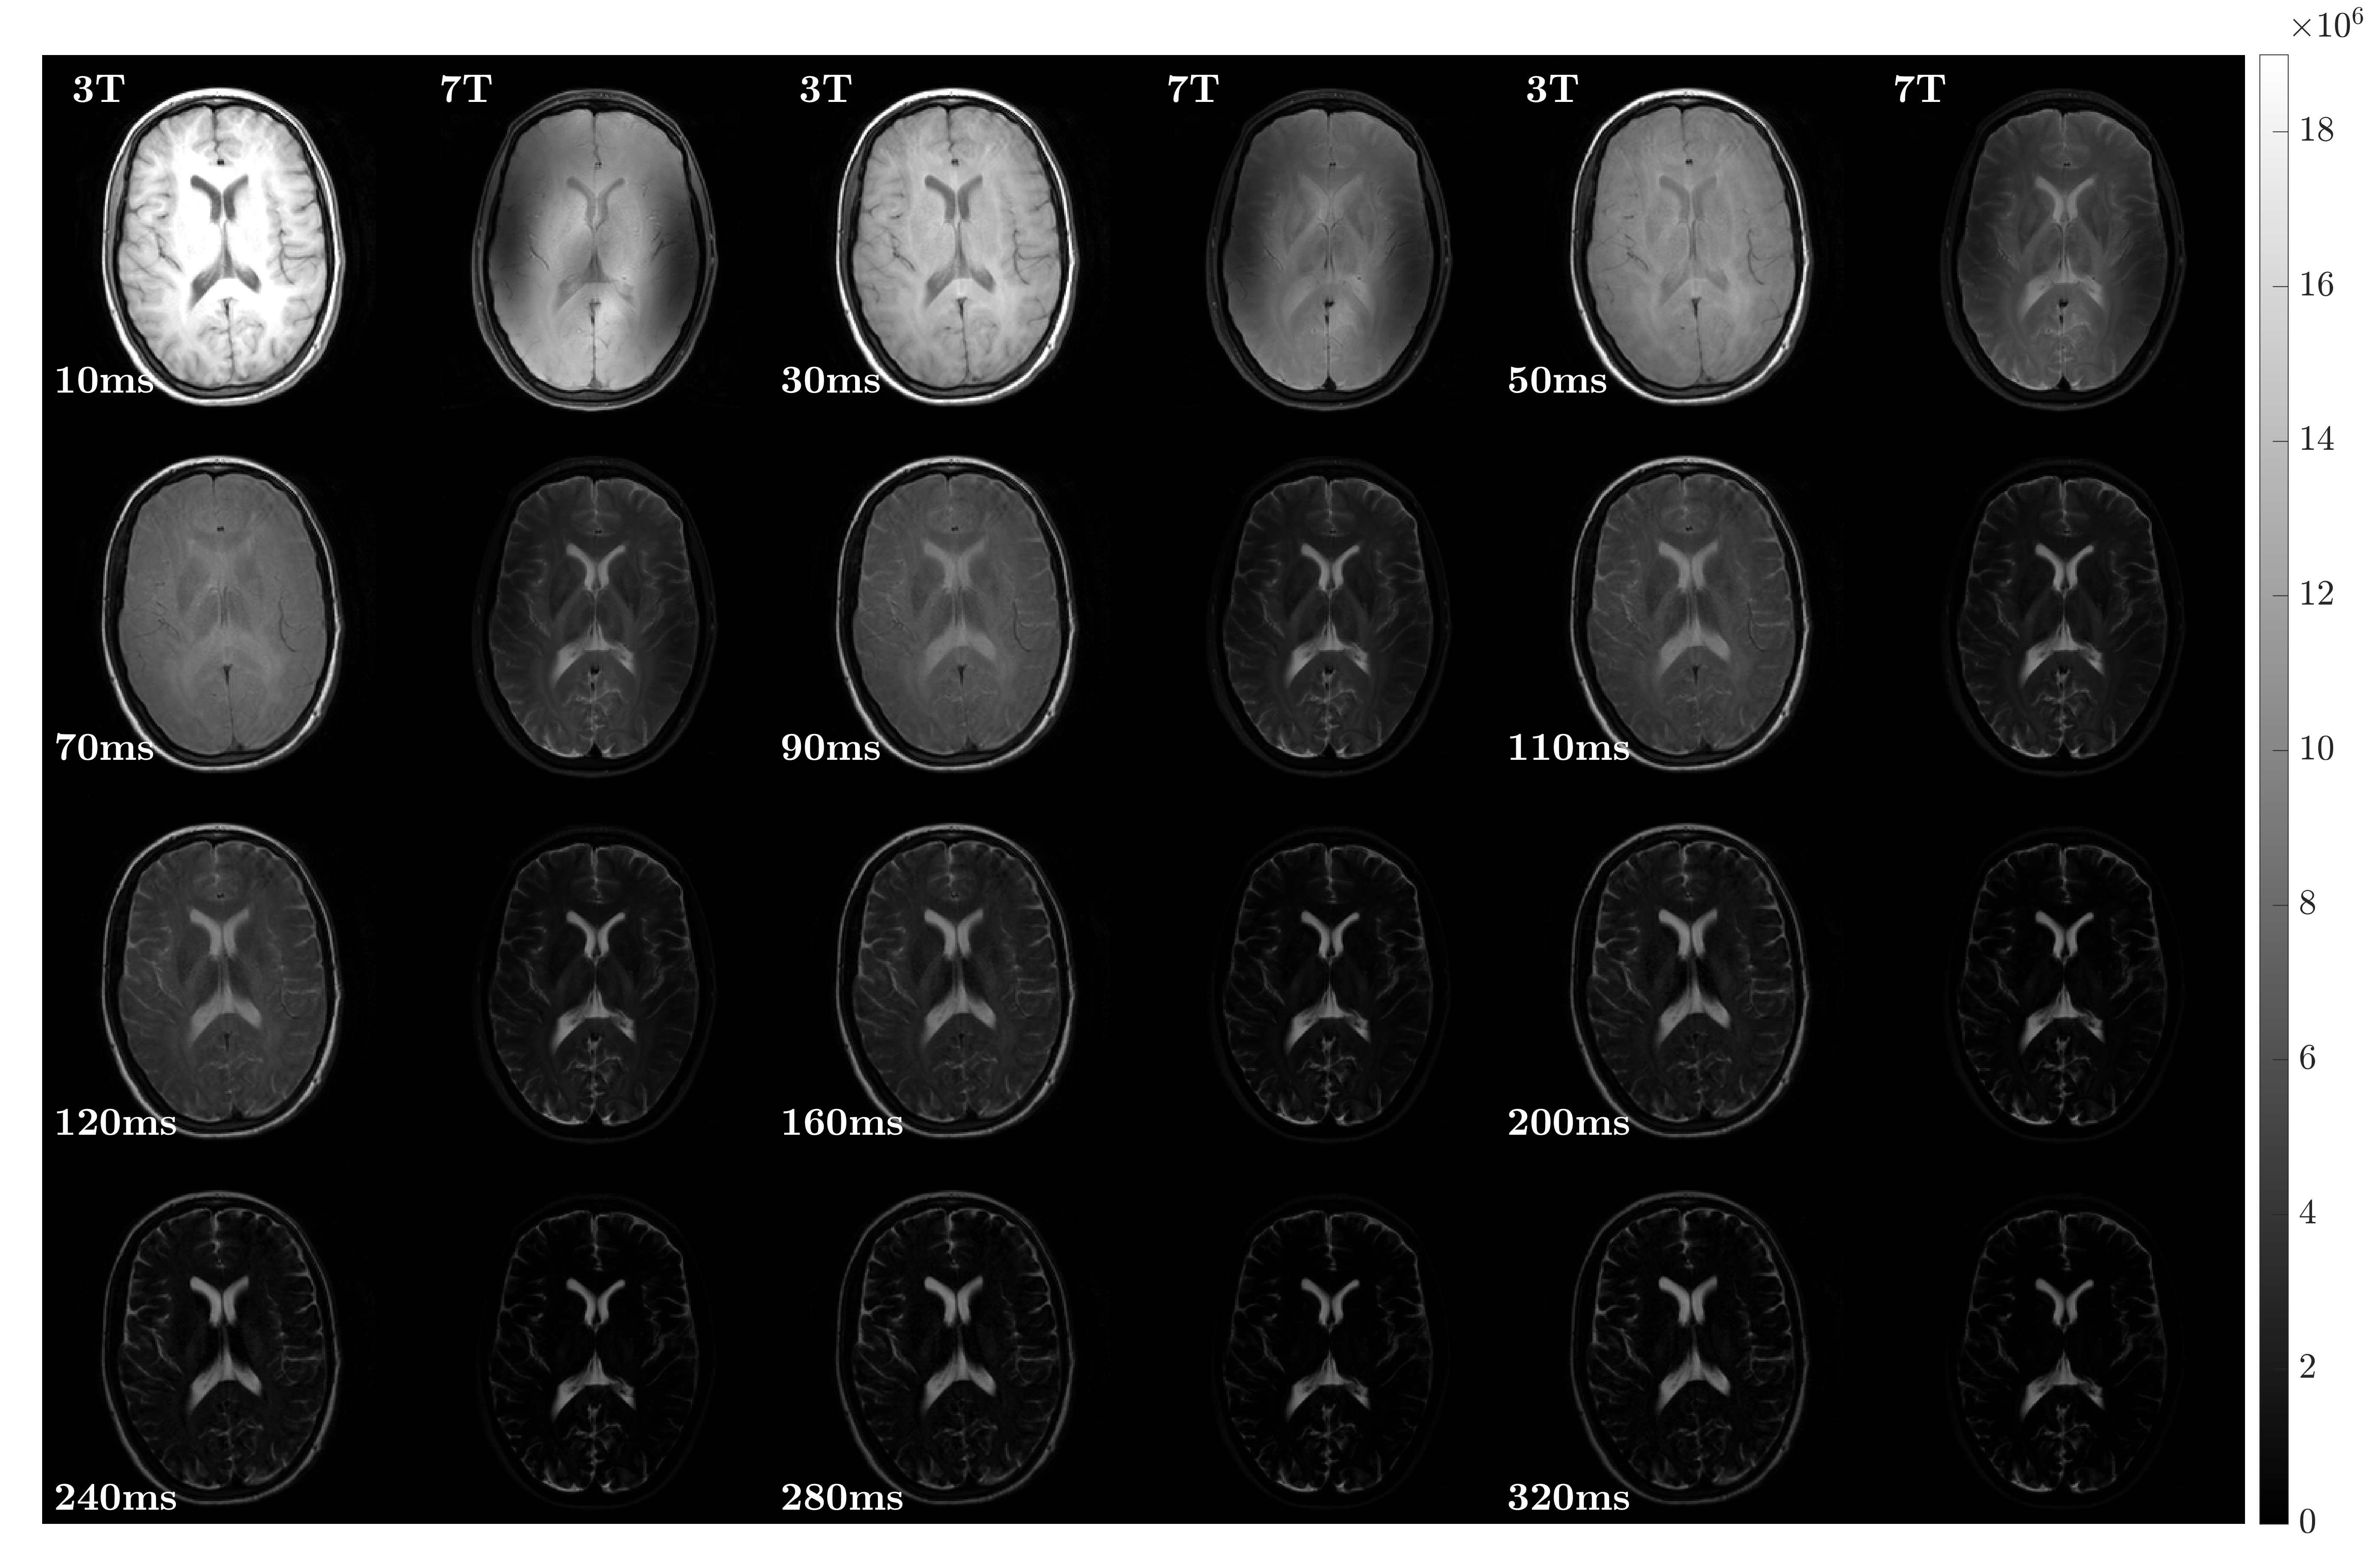
The TE dependence of unprocessed 3 T and 7 T GraSE images is shown in Fig. 1. Images at 7 T exhibited faster signal decay than the 3 T images. Signal loss was most prominent in the temporal lobes due to low effective B. The first echo also demonstrated that T1-weighting was much smaller at 7 T compared to 3 T, indicating that the SAR-related prolongation in TR compensated for longer T1 at 7 T.
Flip angle estimation by EPG
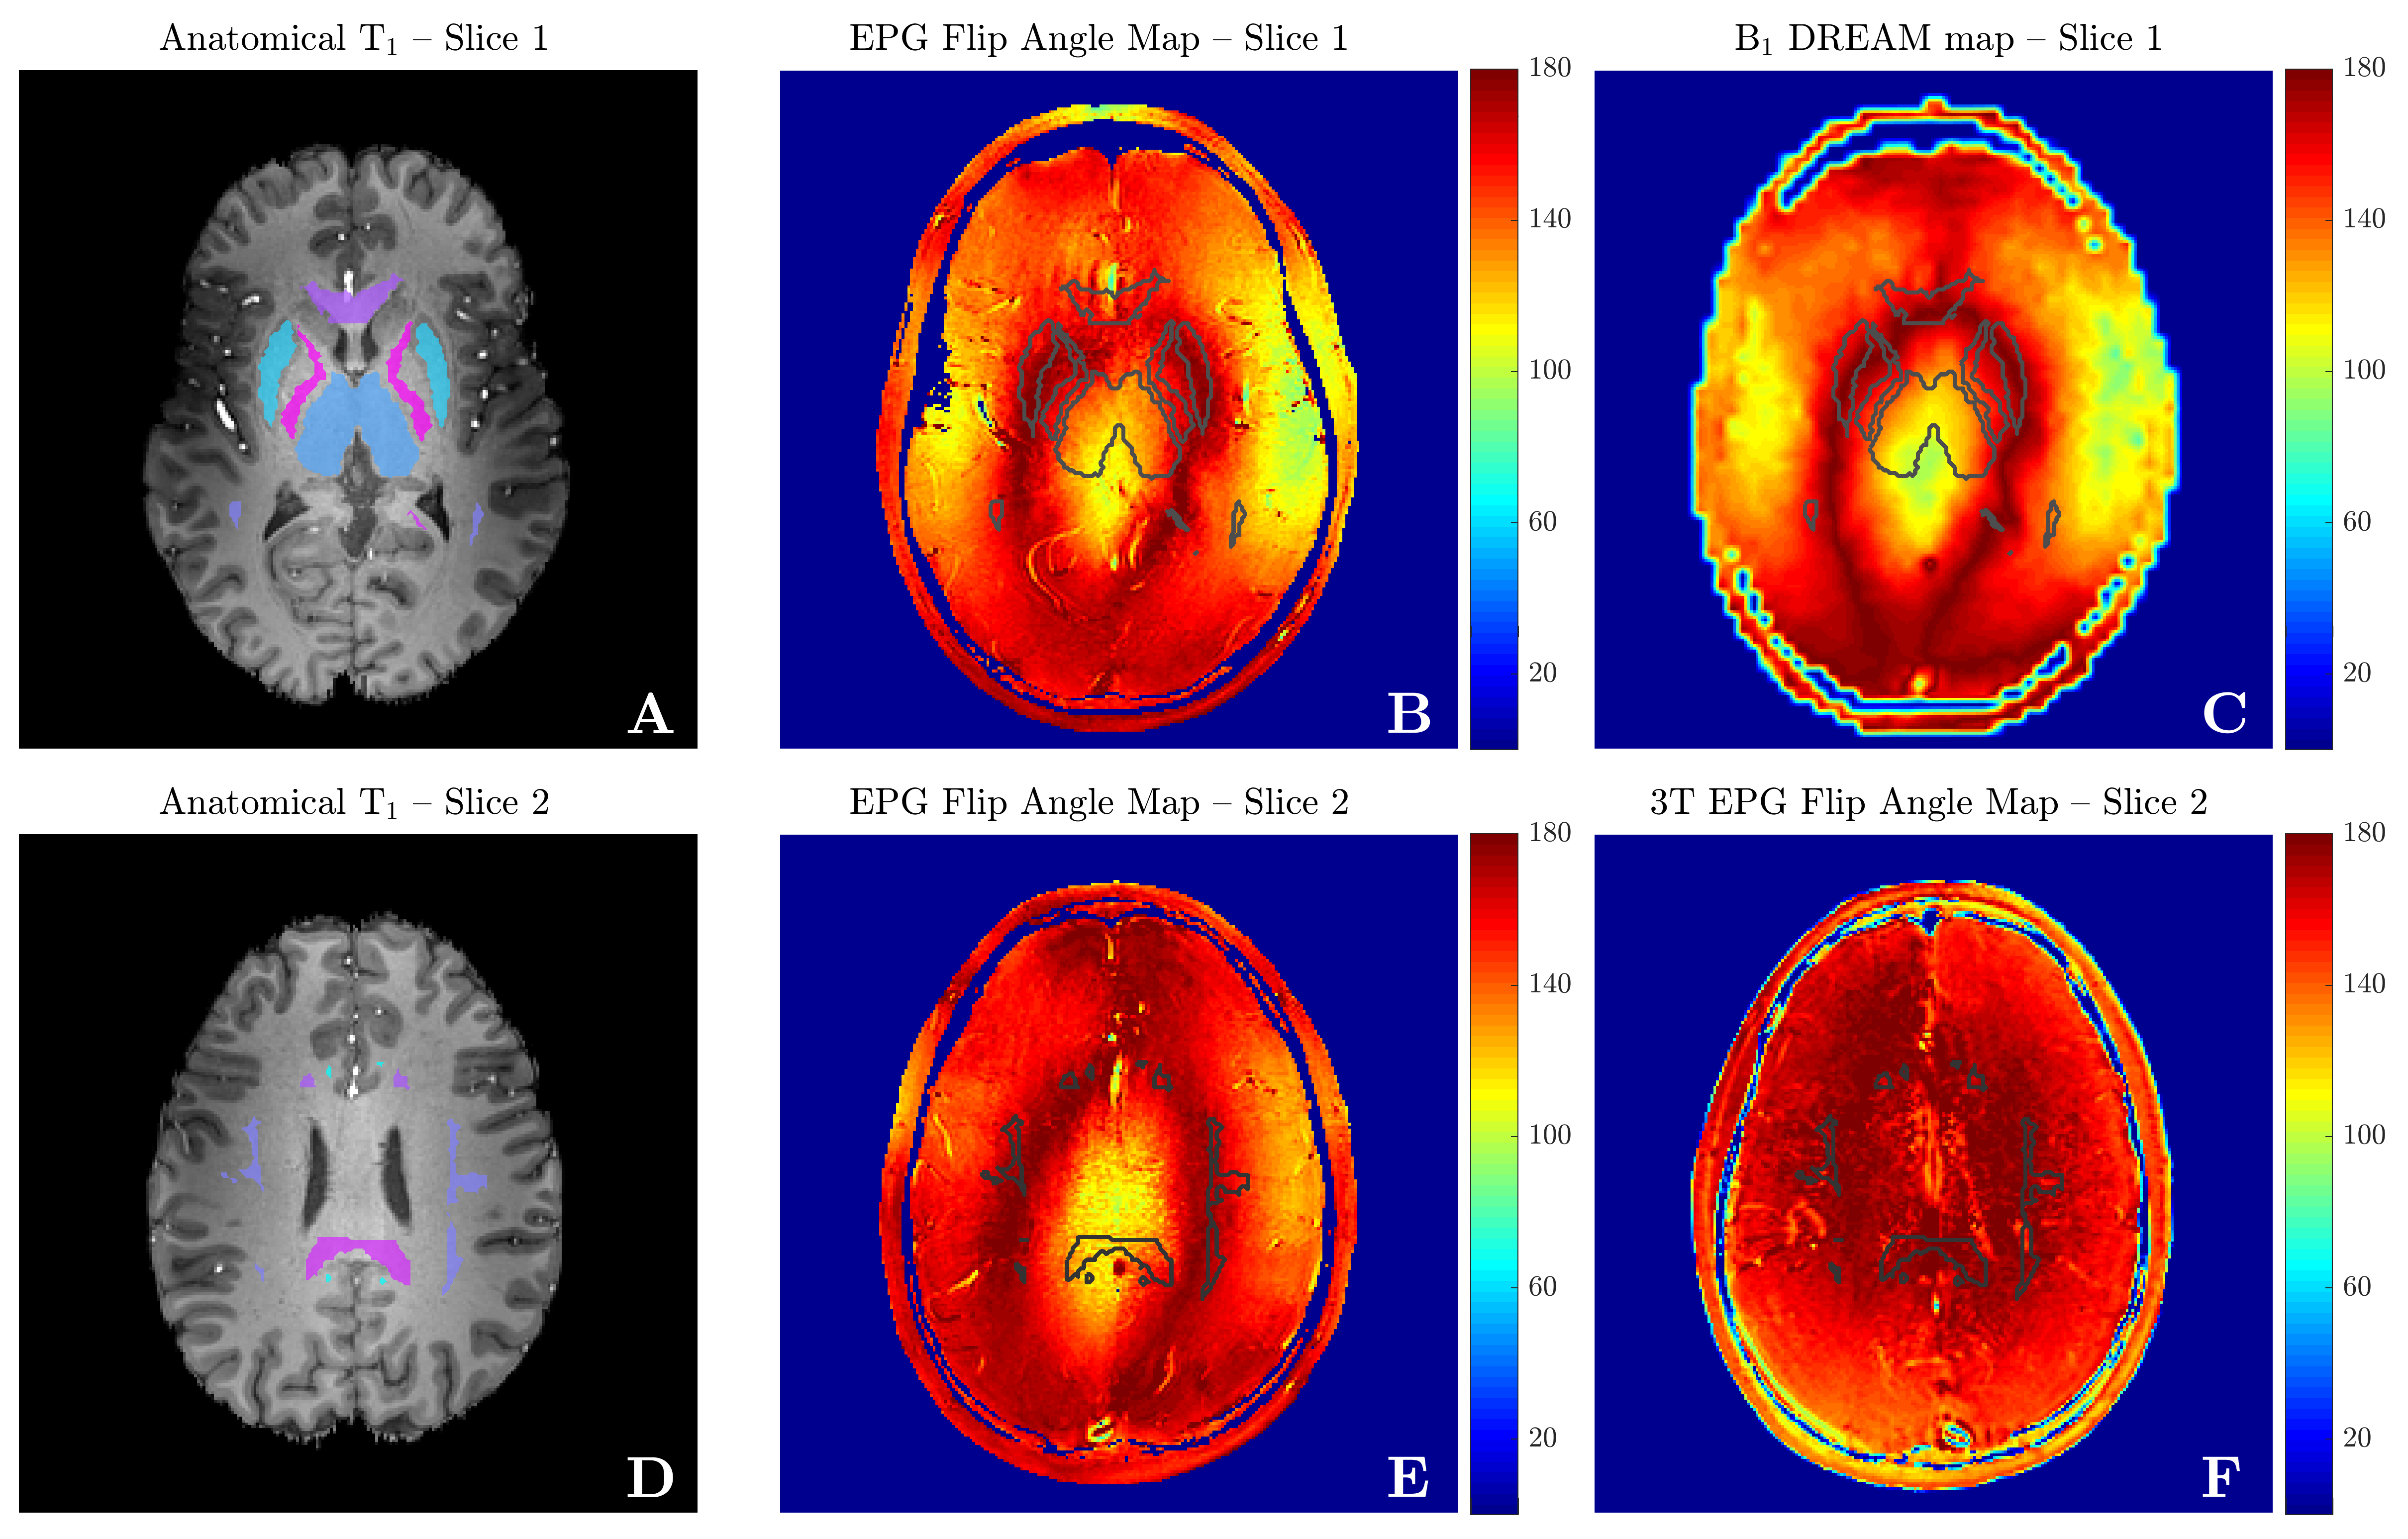
Fig. 2 shows anatomical and FA maps for two representative slices traversing the selected ROIs. EPG-estimates of refocusing FAs at 7 T agreed well with the independently acquired DREAM map (top row). The B-map was converted to refocusing FA 180∘ to match the output range of the EPG algorithm. Note the correspondence across the full B range from the 50% lateral drop-off to the 50% increased B in the centre of the brain. Thus, B-inhomogeneity throughout the brain at 7 T, including FAs of 140∘ – 240∘, was well accounted for when computing the individual T2 distributions. In most ROIs, the deviation from 180∘ was moderate. In the bottom row, EPG-estimated refocusing FA maps at 3 T and 7 T are compared. At 3 T, FAs were consistently close to 180∘ around the splenium. By contrast, EPG-FAs at 7 T in the same area ranged between 120∘ – 180∘ (180∘– 240∘ true FAs).
Adapting T and T for T2 distributions at 7 T
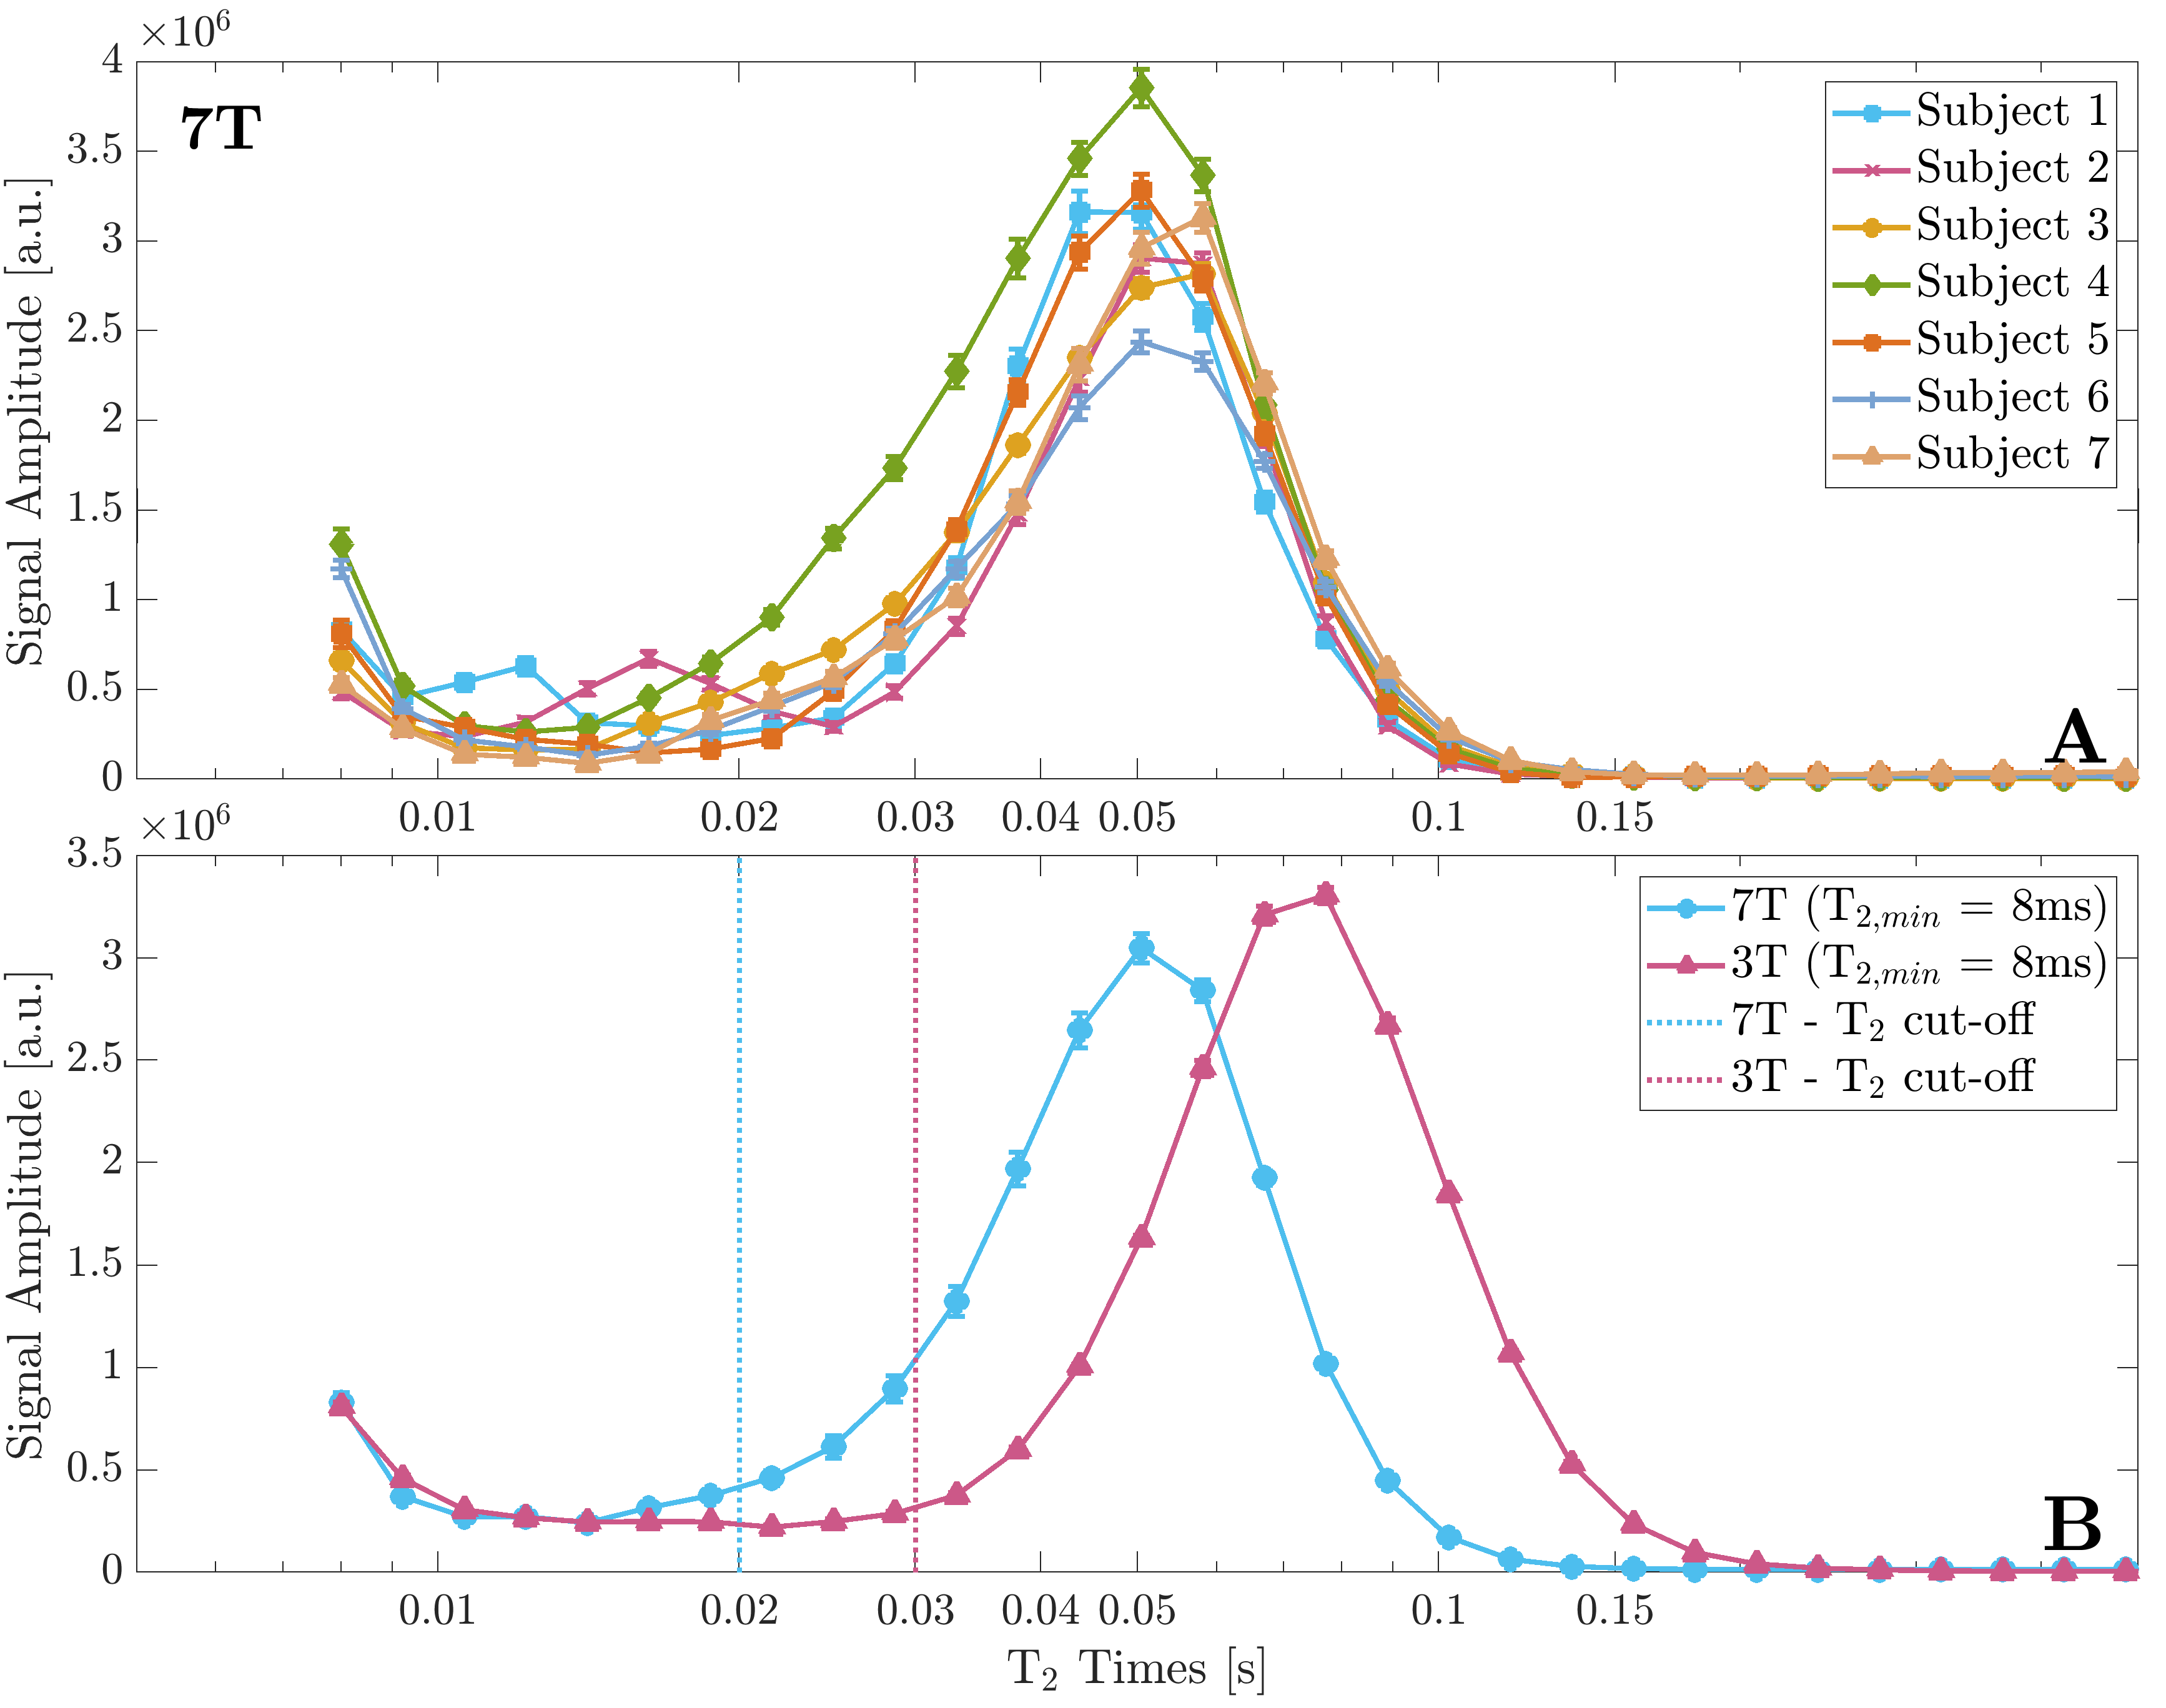
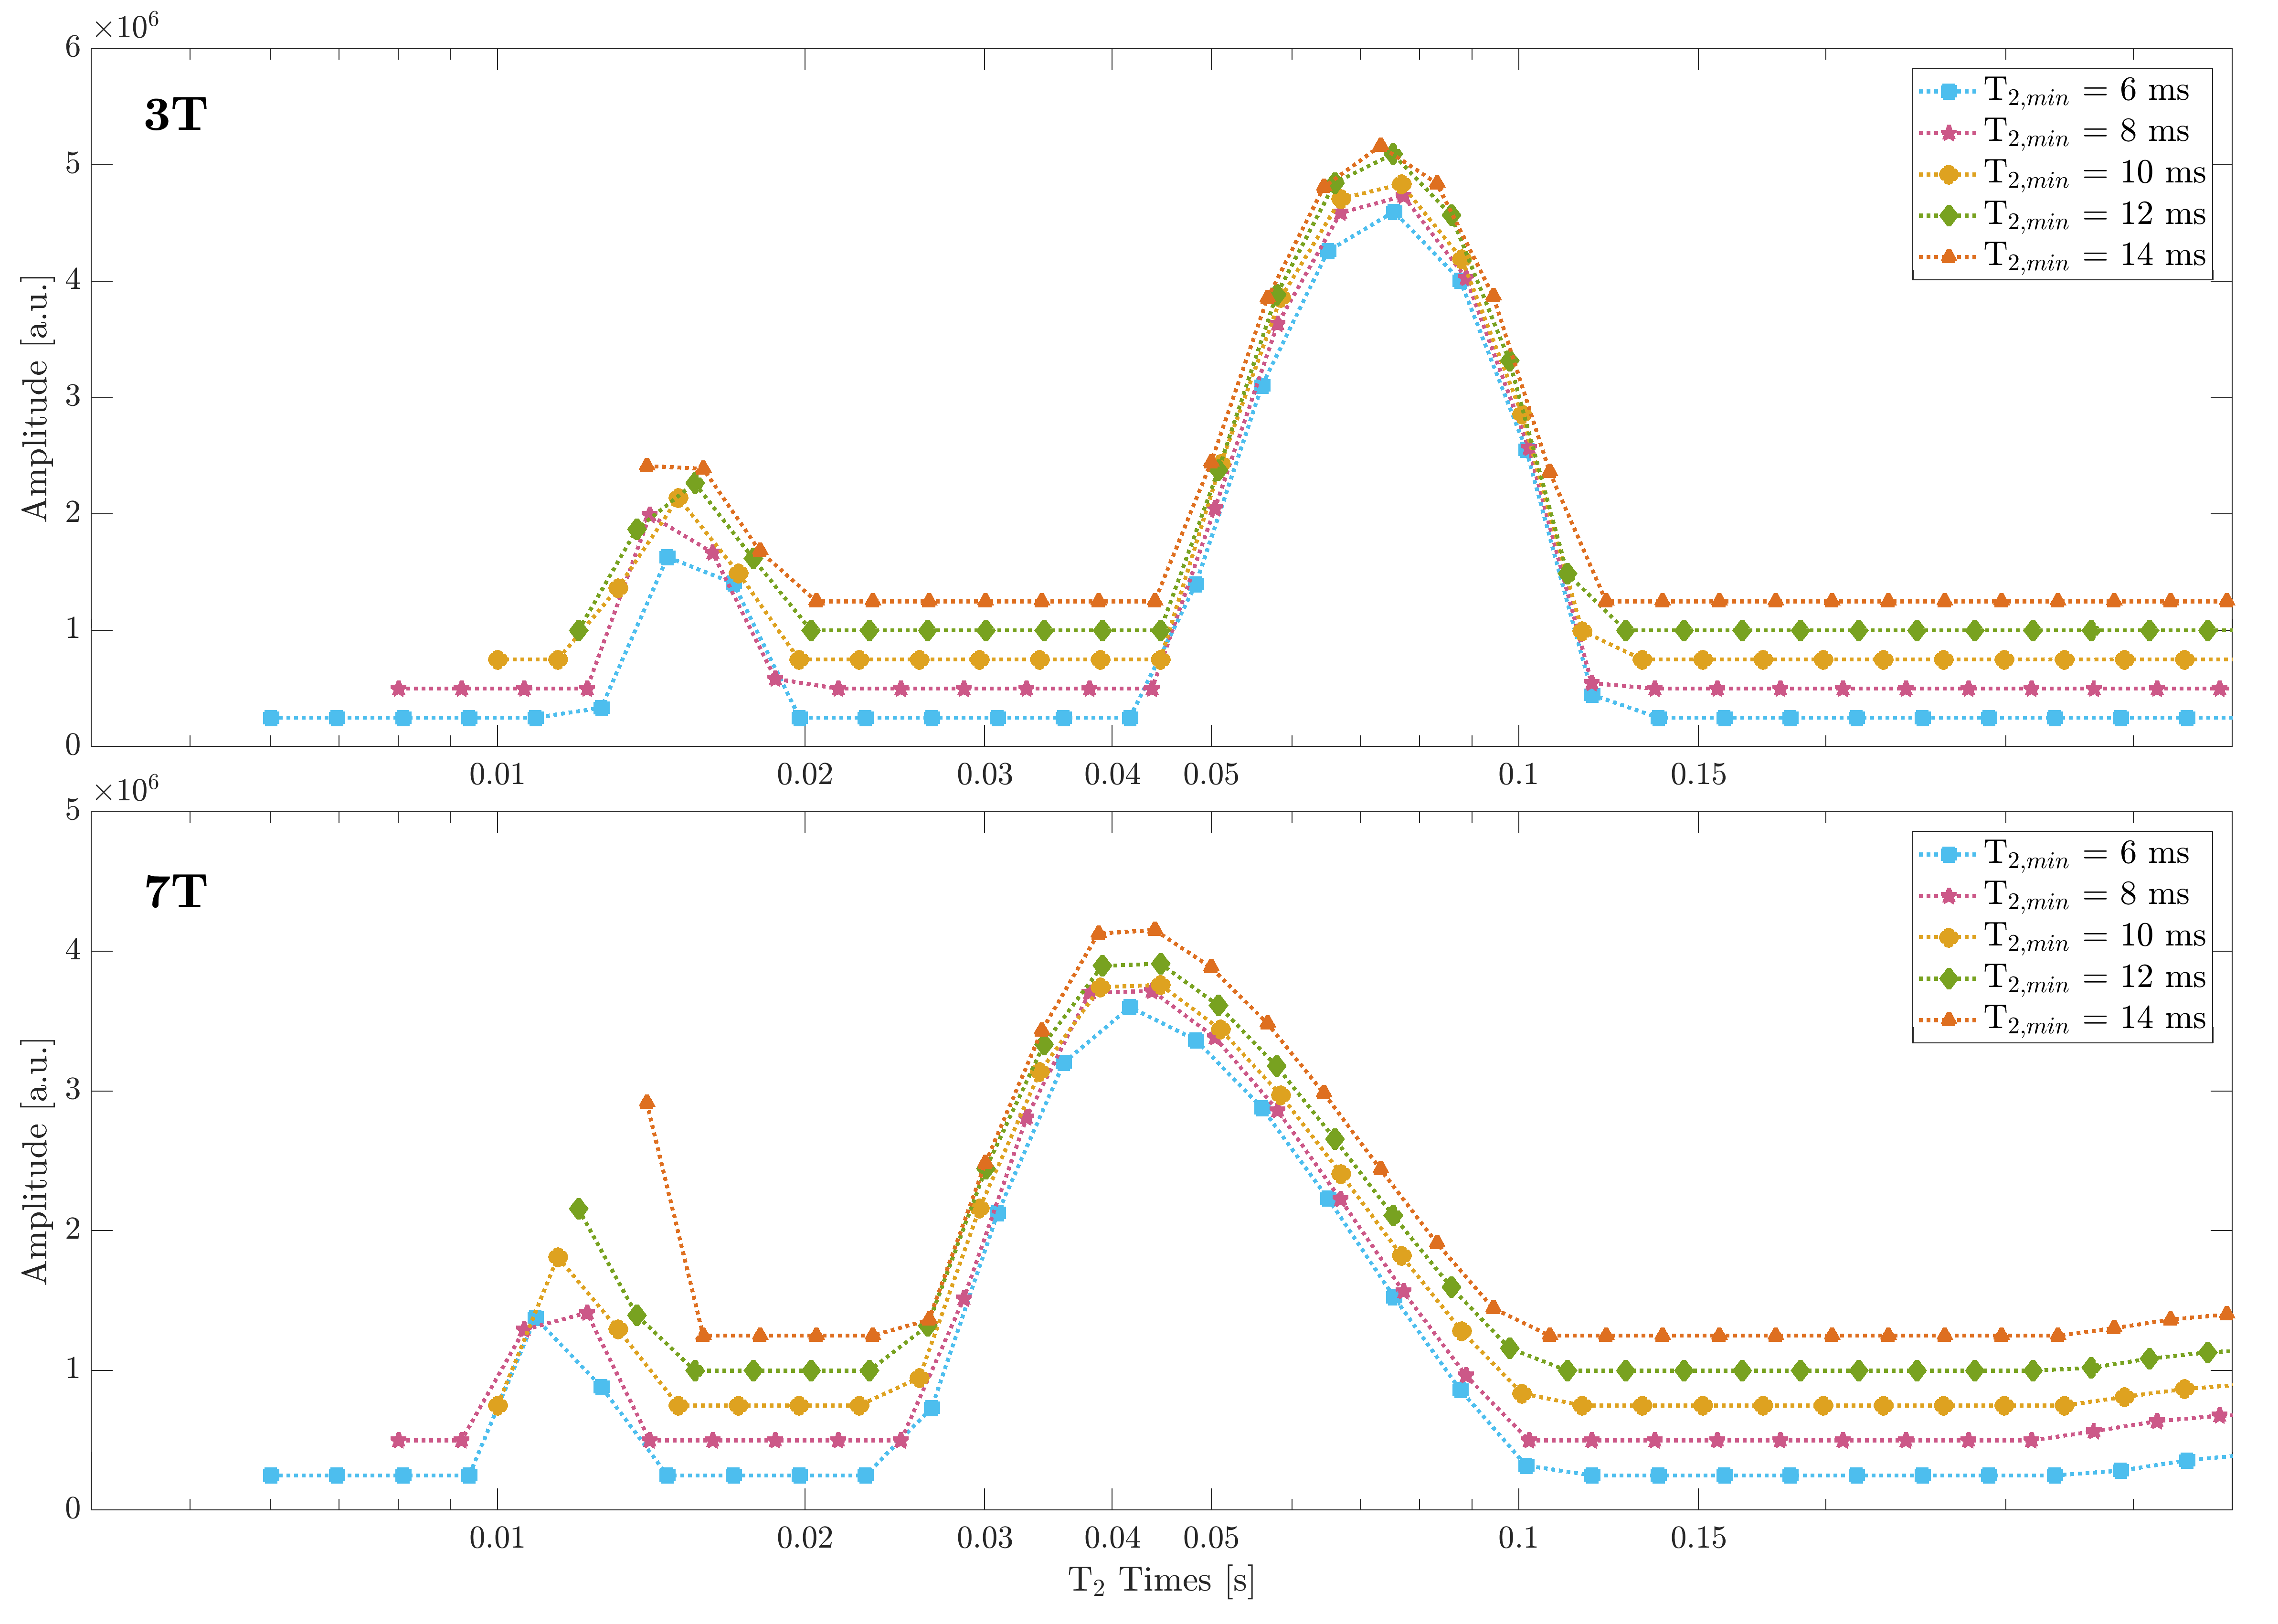
For healthy human brain WM at 3 T, it has been described that the short T2 fraction is encompassed by T = 15 ms and T = 40 ms, and the intermediate T2 component lays within 40 – 200 ms (23, 25). The faster decay observed at 7 T suggests that shortening both T, the lowest boundary of the T2 grid, and T, the threshold differentiating the two water pools, will be required to render short T2 fraction estimates consistent with 3 T. Using the 32-echo GraSE data of TE/TE = 10/10 ms at 3 T, a T = 10 ms was sufficient to encompass the short T2 signal in WM, which was located at approximately 15 ms (see Fig. S1). However, at 7 T, where the short T2 peak is located at approximately 11 – 12 ms, a T of 8 ms may be required to fully capture the short T2 signal. This selection of T agrees with recent simulation work, recommending T = TE1 – 2 ms (20). To determine T at 7 T, we compared in Figure 3A the 7 T T2 distribution across the splenium ROI for all volunteers. These distributions are averages of the single-voxel distributions. One can identify well separated modes of short and intermediate T2 in all volunteers despite some variation in the intermediate T2 peak, which comprised T2 times up to 150 ms at 7 T. In the bottom panel (B), the average 7 T T2 distribution of all subjects is compared with the average 3 T distribution, both for a logarithmically-spaced T2 grid of 8 ms to 2 s. The curves indicate that the T2 cut-off for 7 T should be on average about 20 ms to separate the different water peaks in all individuals. At 3 T, water pools seem best separated by choosing T = 30ms (see vertical lines in panel B). T2 values of the intermediate peak ranged up to 200 ms at 3 T (B), in line with previous reports (23).
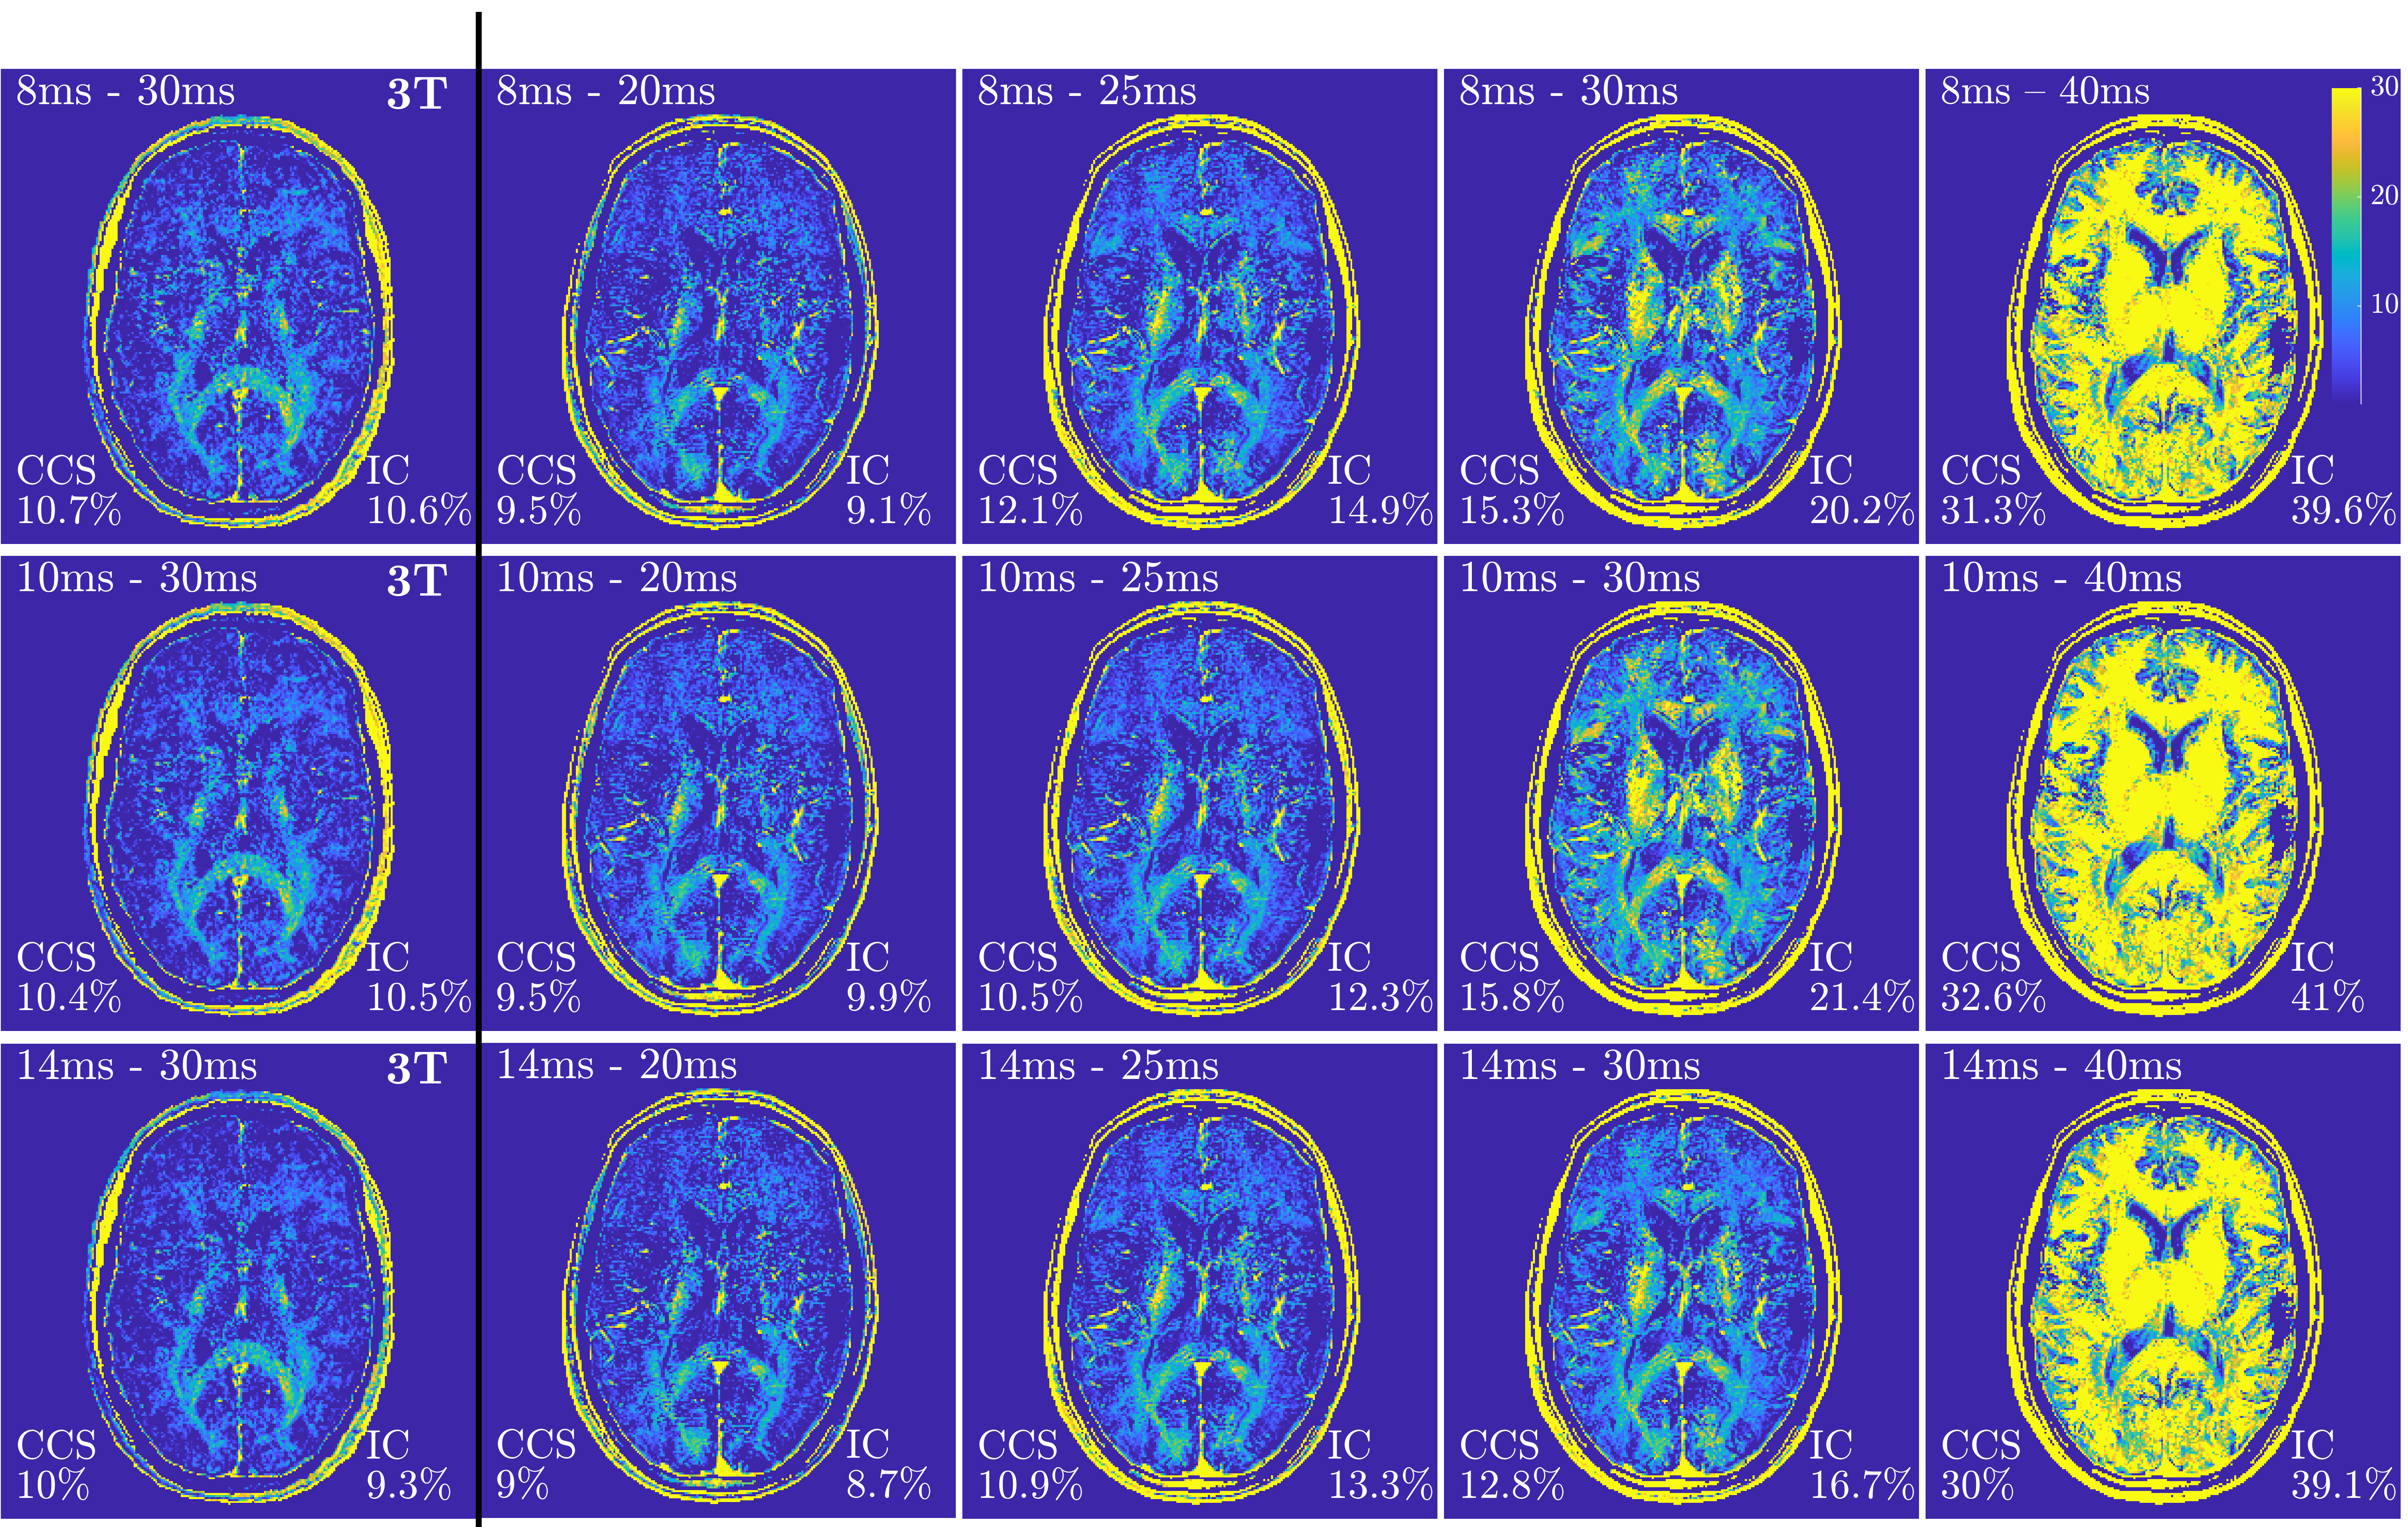
Further inspection of 7 T T2 distributions in the other WM regions confirmed that T = 8 ms and T = 20 ms were generally applicable in WM voxels. This is affirmed in Fig. 4, which depicts the impact of the selection of appropriate T and T for the computation of short T2 fraction maps. T was varied through 8, 10 and 14 ms (rows), while choosing different T between 20, 25, 30 and 40 ms for the 7 T data (columns 2–5). The resulting images are compared to 3 T maps obtained at short T2 intervals of 8 – 30 ms, 10 – 30 ms and 14 – 30 ms (column 1). The 7T short T2 fraction maps that closest resembled the 3 T maps were those with T of 8 ms or 10 ms and T of 20 ms or 25 ms. At the chosen cut-off T2 times, the 8 – 20 ms versus the 10 – 20 ms maps at 7 T and the 8 – 30 ms versus 10 – 30 ms maps at 3 T did hardly yield noticeable differences for any of the outcome measures, i.e. short T2 fraction, short and intermediate geometric mean T2, for the subject of Fig. 4 (Table S1). Changing T for a given T resulted in minor variations in the short T2 signal fraction of less than 1%. Note that a 25 ms cut-off may yield partial signal misassignment from the intermediate peak to the short T2 component window. This is more obvious at higher T2 cut-offs, especially at T = 40 ms, where it resulted in widespread and excessively high short T2 fractions of more than 30%. Iron-rich deep brain nuclei, for instance the putamen, were emphasized in the 7 T maps when choosing T = 30 ms or higher (column 4, Fig. 4). Larger veins were also more pronounced due to the shorter T2 of deoxygenated blood at 7 T (35).
Regional analysis of intermediate geometric mean T2 and short T2 fractions at 3 T and 7 T
The top row of Fig. 5 compares the geometric mean T2 of the intermediate T2 peak (A), and the regional FNR (B) at both field strength for all subjects. The geometric mean T2 was reduced at 7 T compared to 3 T for all ROIs. At 7 T, FNR was higher by a median of 1.36 – 1.85 over the 3 T FNR and SNR was increased by a factor of 1.10 – 1.67 over 3 T SNR (not shown). The iron-rich putamen exhibited the shortest geometric mean T2. In the bottom row, the median short T2 fractions are compared using the previously determined T2 ranges at the two field strengths, for the three “travelling brains” (C) and by ROI for the same subjects (D).
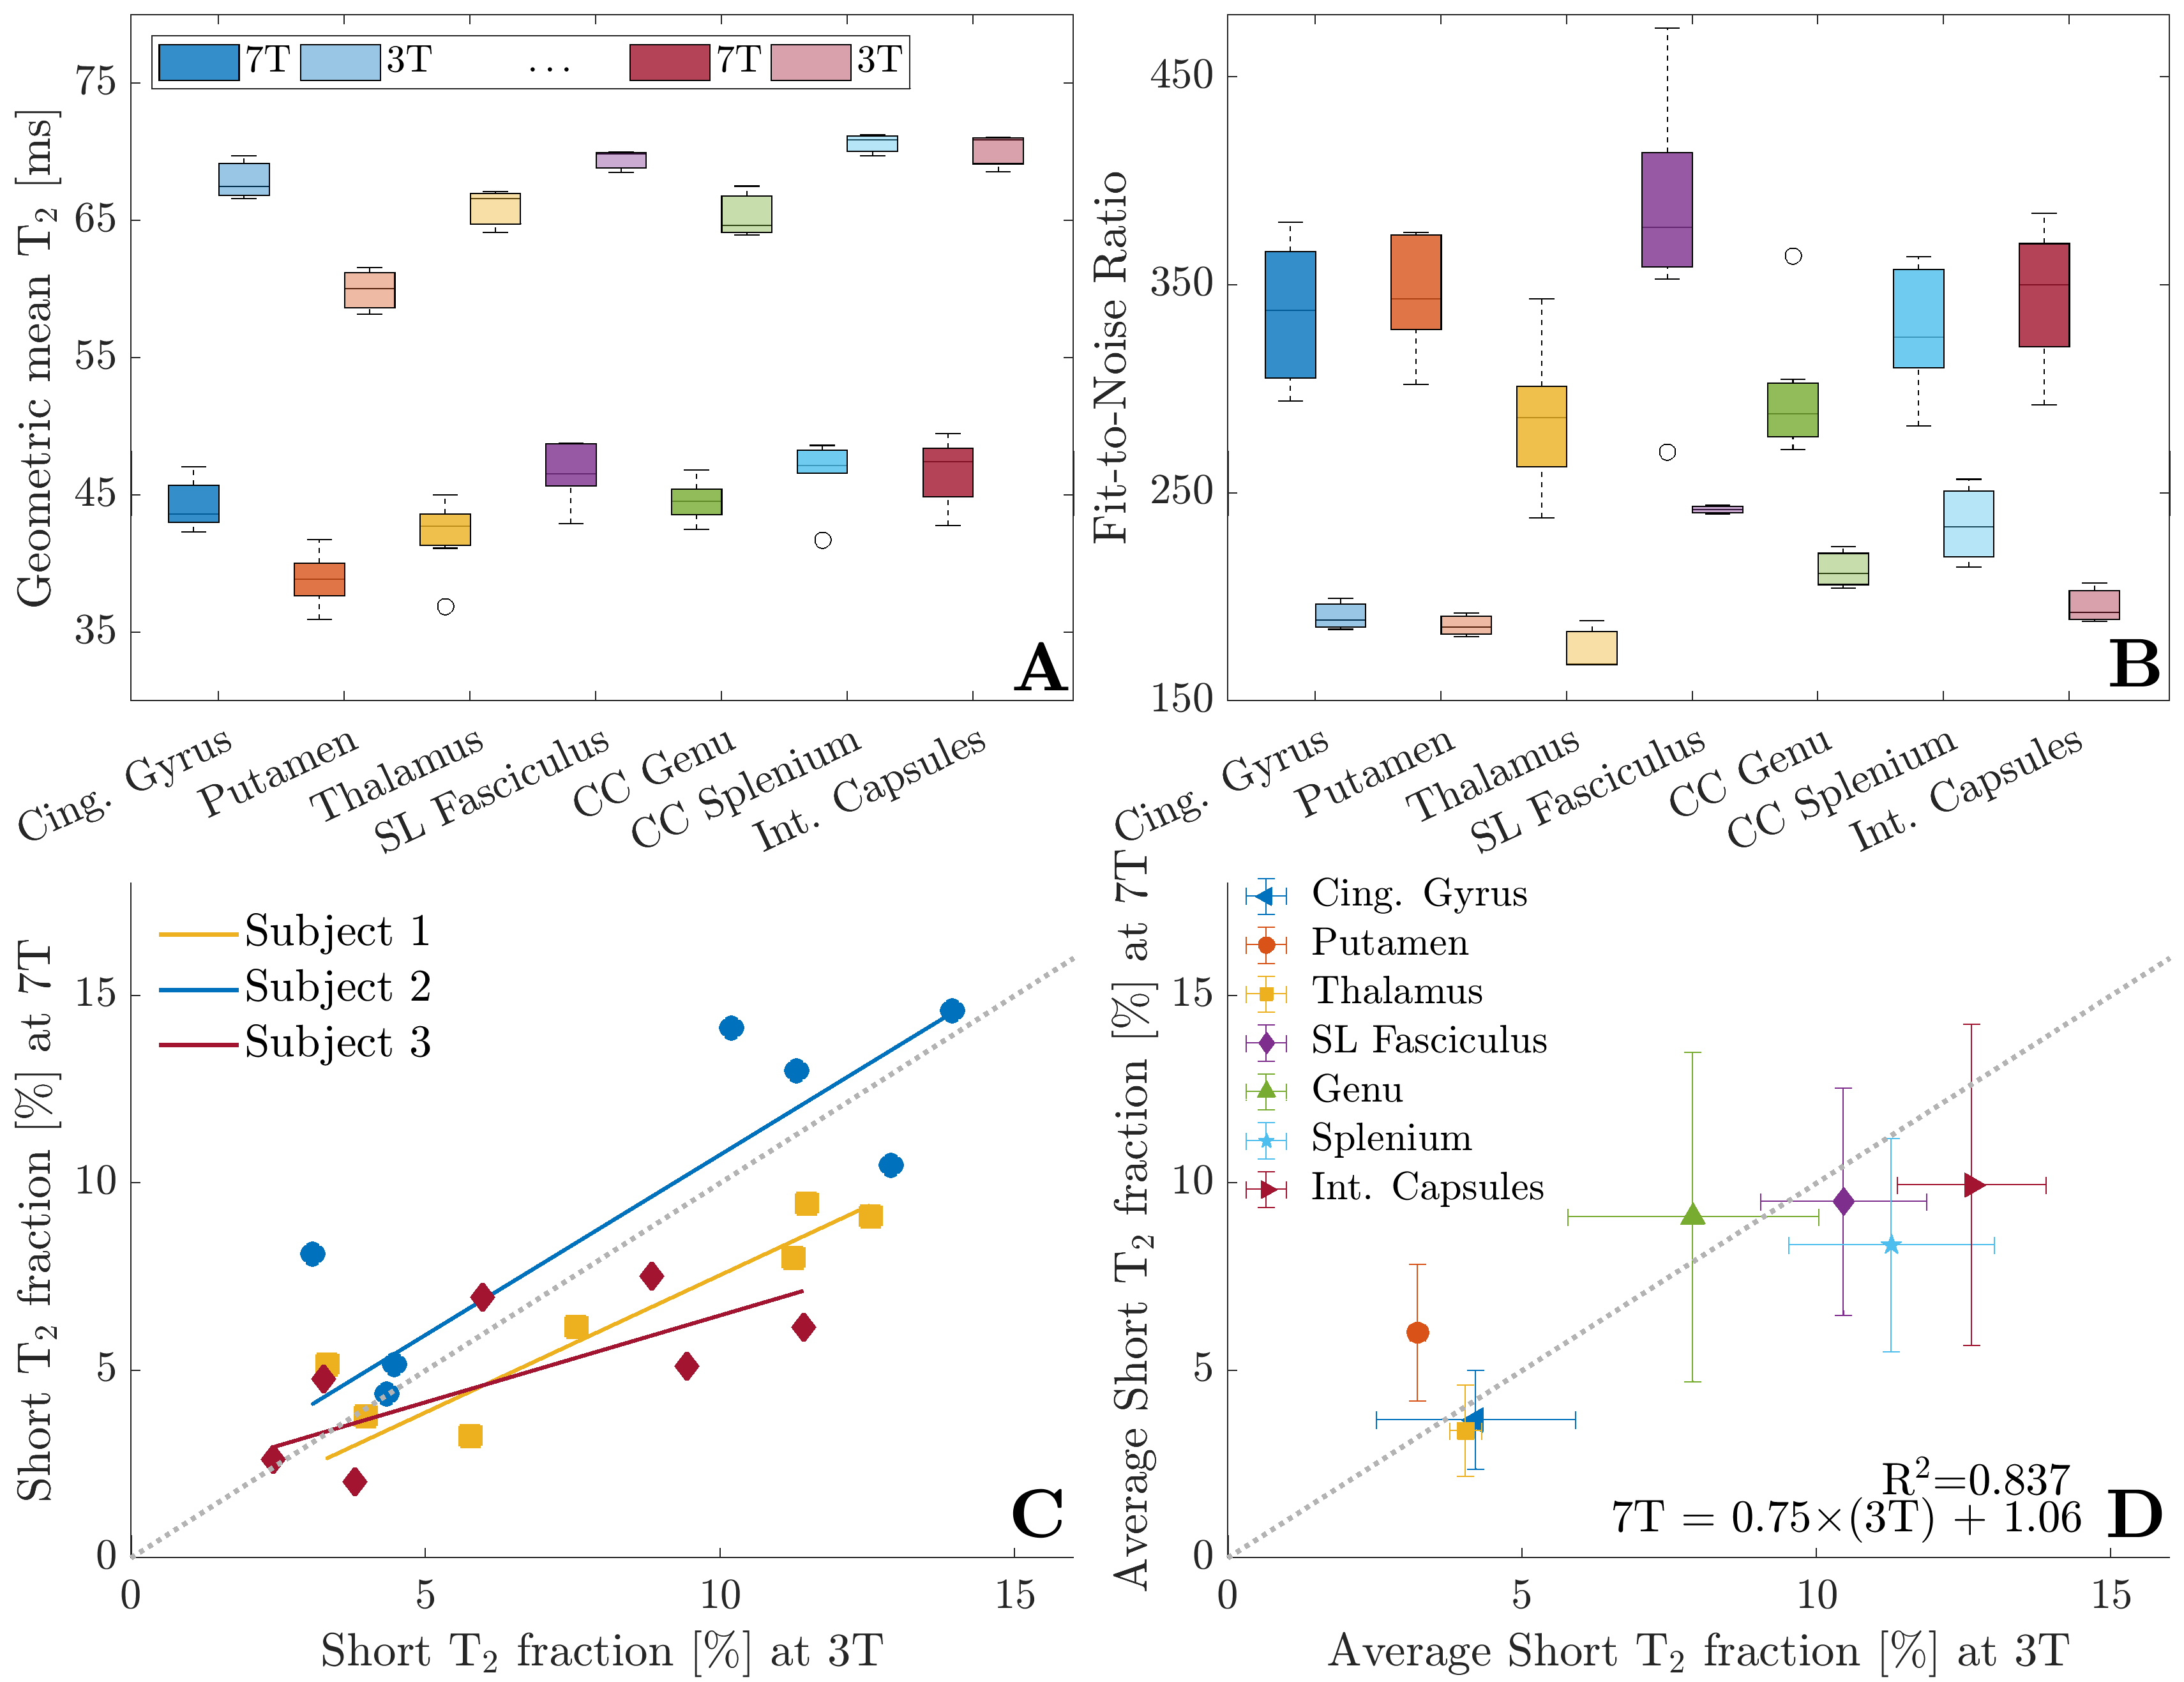
The three subject regression lines in Fig. 5 indicate that short T2 fractions tended to be slightly lower at 7 T. The individual regression slopes ranged from 0.46 – 0.96. Comparing separate ROIs (D), we noted good agreement between the two field strengths. With the exception of high MWF WM ROIs and the iron-rich putamen, the regional mean short T2 fractions were close to the unity line (gray dotted). Since high iron content can drive additional T2 shortening more at 7 T and thereby increase the measured apparent short T2 signal fraction (36), we excluded the putamen from the regression quoted in panel D and above. Note that the variance of all measures at 7 T was larger, likely due to a stronger influence of tissue iron and residual effects of B.
Discussion
We demonstrated the feasibility of in vivo multi-component T2 mapping at 7 T, building on the combination of multi-echo GraSE with EPG-modelling, as established at 3 T (18). T2 distributions of various brain structures at 7 T were computed and compared to 3 T data acquired in three “travelling brains” in order to determine T and T for estimating short T2 fractions at 7 T. The cohort size was limited due to the geographical distance between the participating labs. Our observations are intended to serve as a starting point for further refinement of multi-echo T2 measurements at 7 T.
7 T sequence implementation
To ensure comparability between the multi-echo GraSE protocols at 3 T and 7 T, only parameters relevant for safety and/or measurement time were adjusted. Notably, TR of the 32-echo GraSE sequence (18) needed to be prolonged at 7 T. In order to reduce scan time, additional acceleration in the head-feet direction was rendered possible by the smaller spatial coverage of the 7 T transmit coil and because the receive coils effectively suppress signal from inferior regions. In addition to SENSE acceleration, greater EPI acceleration might be of interest at 7 T. When a shorter TE of 8 ms or an EPI factor of 5 were attempted, peripheral nerve stimulation (PNS) increased to about 80% of the 1st control level and volunteers reported PNS. The specific gradient coil design may have contributed to the prevalence of PNS (37). Because this can only be alleviated by decreasing in-plane resolution, sequence adjustments were not further pursued for the sake of comparability. Using the traditional parameters (TE = 10 ms, EPI factor = 3), PNS was at 65% of the 1st control level and none of the subjects reported PNS or a feeling of warmth during GraSE.
At 7 T, the WM T1 is approximately 50% longer (38, 39, 40) than at 3 T (41, 42), thus, extending TR reduced T1-weighting at 7 T (Fig. 1). Lower short T2 fractions have been reported with longer TR (43, 44). This observation can be linked to residual T1-weighting affecting the signal due to multi-exponential T1 relaxation of WM as reported by Labadie et al. (45). However, as higher Mz is available at longer TR, the estimation of the short T2 component will also be more accurate as SNR is improved (14, 20). Reduced noise levels are advantageous as positive noise in the first data points of the T2 decay can falsely enhance short T2 components (14). At 7 T, SNR was also improved by the use of a 32-channel receive array. As indicated by the up to 85% increase in FNR and up to 67% increase in SNR, there is potential for further improvements regarding acceleration and spatial resolution at 7 T. The measured FNR increase was just below the predicted SNR gain of 1.91 when going from 3 T to 7 T, which is obtained from the ratio of the field strengths and considering the SENSE acceleration factors (46), ignoring differences in coil geometries and T1-weighting. In addition to noise, B inhomogeneity significantly affects T2 estimations (20). We showed that the larger deviations from the ideal refocusing FA at 7 T were well accounted for by the EPG algorithm, as demonstrated by comparison to DREAM B-mapping (Fig. 2). However, FA deviations led to a more rapid signal loss, especially in the temporal lobes. In turn, this may have compromised the T2 characterization. High permittivity dielectric pads (47) may be used to improve B homogeneity, but mainly to achieve higher FA in the cerebellum. Parallel transmit techniques (48, 49) were not employed here as the 8-channel transmit coil was not set up at the time of data acquisition.
T2 distributions, selection of T and T for 7 T
At 7 T, T2 times of all water pools were shortened, so that the short T2 signal was below 20 ms and intermediate water signal between 20 to 150 ms. At clinical field strength, MWI studies have traditionally used T longer than TE1. Recent simulation work, however, demonstrated that limiting the T2 range may lead to underestimations of the MWF (20). In particular at 7 T, short T2 might on average be approximately equal or shorter than 10 ms. We selected T = 8 ms, for both 3 T and 7 T in line with recent detailed investigation of these dependencies via signal simulations (20). We found that T at 7 T should be at about 20 ms to exclude contamination from intermediate T2 signal. This considerably less than the 40 ms reported at 3 T (23). Moreover, investigation of the 3 T distributions suggested that the equivalent threshold at 3 T should be at 30 ms. Thus, the 3 T short T2 fractions obtained here may be systematically lower than previously reported. Diffusion and a larger contribution from stimulated echoes make the signal susceptible to T2 shortening from static field inhomogeneities, especially in iron-rich structures. Recent histopathological work demonstrated the effect of tissue iron on the short T2 component estimation (36). Given the amplification of microscopic field inhomogeneities at UHFs, brain iron in both healthy and neurodegenerative conditions deserves particular attention in future multi-component T2 studies at 7 T. To our knowledge, this is first description of in vivo human central nervous system tissue multi-component T2 properties at 7 T. Other literature pertains to animal work or fixed human brain tissue at 7 T. Both, in vivo animal work (50) and post-mortem human tissue studies reported T = 20 ms (6), in line with our in vivo human WM findings. It should be noted that these cut-offs will change with field strengths and tissue fixation (6, 23) and SNR differences, e.g. achieved by signal averaging when imaging anesthetized animals, will play a role in the estimation of the short T2 fraction. Our cut-off level recommendations should thus be confirmed in future studies.
7 T – 3 T comparison of geometric mean T2 times, FNR and short T2 fraction estimates
Literature on T2 in brain tissue at 7 T is scarce due to the difficulties of measuring T2 at UHFs. Mono-exponential T2 studies at 7 T reported approximately 55 ms in human WM (51). This estimate is roughly in line with the 47 ms geometric mean T2 of the intermediate peak in WM (Fig. 5). Field strength dependent changes in the relaxation rate of 1/T2 have been reported to vary from linear to quadratic (52, 53, 54), depending on the tissue of interest. Exchange between protons in bulk water and exchangeable protons on the surface of macromolecules (54) may also contribute to the field strength dependent apparent shortening of T2 in central nervous system tissues (51). The short T2 fractions at 7 T were close to the fractions obtained at 3 T, but slightly smaller in some WM regions. Differences between 3 T and 7 T short T2 fractions were smaller than variations between individuals. Finally, and although indiscernible on visible inspection, the iron-rich putamen presented with larger short T2 components at 7 T compared to 3 T (Fig. 5). T2 shortening due to the presence of iron appeared to be more relevant in our comparison of 7 T and 3 T than in previous studies comparing short T2 fractions at 1.5 T and 3 T (23).
Roadmap to myelin water imaging at UHFs
The presented protocol transfer to 7 T and comparisons to 3 T lay the groundwork for future optimization of multi-echo T2 acquisitions at 7 T. Using the TE settings established at lower field strength, the short T2 fraction maps displayed only some improvement in SNR compared to 3 T despite higher signal FNR and SNR. This may have been a consequence of artefacts from arterial inflow, due to the influence of iron and due to some short T2 signal decaying before the first echo at 7 T. Further improvements of 7 T multi-echo T2 acquisitions should aim at reducing TE1 and TE. This may require sacrificing in-plane resolution in order to maintaining acceptable PNS levels, in particular for patient studies. Reducing TE may also require increasing the number of echoes. Recent MWI implementations at 3 T have used a GraSE sequence with 48 echoes at 8 ms echo spacing, albeit at voxel sizes of mm3 (55). Although the T2 relaxation characterization of human brain tissues at 7 T will likely improve at shorter TEs, SAR limits and increased PNS may hamper practical implementation. Upon establishment of suitable TE, further optimization will thus deal with how to best spend the available SNR between voxel size and acceleration.
Conclusions
We demonstrated the feasibility of multi-echo T2 GraSE measurements in vivo at 7 T for exploring the T2 distributions of the brain’s WM. An accelerated T2 decay was observed compared to 3 T. By variation of the T2 boundaries, we established an intermediate T2 range encompassing 20 – 150 ms and a short T2 peak below 20 ms. The stronger B-inhomogeneity at 7 T was well estimated by the EPG algorithm. Use of a multi-channel transmit coil and shortening of the echo spacing for a better definition of the short and intermediate T2 water peaks will likely improve the estimation of the myelin-related, short T2 component at 7 T.
VW was supported by a graduate studentship award from the Multiple Sclerosis Society of Canada (EGID 2002) and is grateful for travel support from BC Children’s Hospital Research Institute through the former CFRI Research and Methodology Training Grant. ALM acknowledges support from the Natural Science and Engineering Research Council of Canada (NSERC). GH acknowledges support from the Swedish Research Council (Vetenskapsrådet, NT 2014-6193). Lund University Bioimaging Centre (LBIC) is acknowledged for providing experimental resources (equipment grant VR-RFI 829-2010-5928). AR acknowledges support from NSERC, the National Multiple Sclerosis Society and Canada Research Chairs. We wish to thank Emil Ljungberg, Shannon Kolind and John Kramer for contributing data from their studies to this project. We are very grateful for the training data for FIRST, particularly to David Kennedy at the CMA, and also to: Christian Haselgrove, Centre for Morphometric Analysis, Harvard; Bruce Fischl, Martinos Center for Biomedical Imaging, MGH; Janis Breeze and Jean Frazier, Child and Adolescent Neuropsychiatric Research Program, Cambridge Health Alliance; Larry Seidman and Jill Goldstein, Department of Psychiatry of Harvard Medical School; Barry Kosofsky, Weill Cornell Medical Center.
References
References
- S.C.L. et al. (2012) Deoni S.C.L., Dean III D.C., O’Muircheartaigh J., Dirks H., and Jerskey B.A. Investigating white matter development in infancy and early childhood using myelin water fraction and relaxation time mapping. NeuroImage, 63(3):1038–1053, 2012.
- A.M. et al. (2020) Weber A.M., Zhang Y., Kames C., and Rauscher A. Myelin water imaging and R2* mapping in neonates: Investigating R2* dependence on myelin and fibre orientation in whole brain white matter. NMR Biomed, 33(3):e4222, 2020.
- T. et al. (2015) Billiet T., Vandenbulcke M., Mädler B., and et al. Age-related microstructural differences quantified using myelin water imaging and advanced diffusion MRI. Neurobiol Aging, 36(6):2107–2121, 2015.
- A.D. et al. (2016) Wright A.D., Jarrett M., Vavasour I., and et al. Myelin water fraction is transiently reduced after a single mild traumatic brain injury – A prospective cohort study in collegiate hockey players. PLoS One, 11(2):e0150215, 2016.
- C. et al. (2004) Laule C., Vavasour I.M., Moore G.R.W., and et al. Water Content and Myelin Water Fraction in Multiple Sclerosis: A T2 Relaxation Study. J Neurol, 251(3):284–293, 2004.
- C. et al. (2008) Laule C., Kozlowski P., Leung E., Li D.K.B., MacKay A.L., and Moore G.W. Myelin water imaging of multiple sclerosis at 7T: correlations with histopathology. NeuroImage, 40(4):1575–1580, 2008.
- C. et al. (2006) Laule C., Leung E., Li D.K.B., and et al. Myelin water imaging in multiple sclerosis: quantitative correlations with histopathology. Mult Scler, 12(6):747–753, 2006.
- S. et al. (2003) Webb S., Munro C.A., Midha R., and Stanisz G.J. Is multicomponent T2 a good measure of myelin content in peripheral nerve? Magn Reson Med, 49(4):638–645, 2003.
- I.M. et al. (2011) Vavasour I.M., Laule C., Li D.B.K., Traboulsee A.L., and MacKay A.L. Is the magnetization transfer ratio a marker for myelin in multiple sclerosis? J Magn Reson Imaging, 33(3):710–718, 2011.
- D.J. et al. (1999) Werring D.J., Clark C.A., Barker G.J., Thompson A.J., and Miller D.H. Diffusion tensor imaging of lesions and normal-appearing white matter in multiple sclerosis. Neurology, 52(8):1626–1632, 1999.
- J.T. et al. (2008) Chen J.T., Collins D.L., Atkins H.L., and et al. Magnetization transfer ratio evolution with demyelination and remyelination in multiple sclerosis lesions. Ann Neurol, 63(2):254–262, 2008.
- A. et al. (1994) MacKay A., Whittall K., Adler J., Li D., Paty D., and Graeb D. In vivo visualization of myelin water in brain by magnetic resonance. Magn Res Med, 31:673–677, 1994.
- M.D. and R.E.. (1996) Does M.D. and Snyder R.E.. Multiexponential T2 relaxation in degenerating peripheral nerve. Magn Reson Med, 35(2):207–213, 1996.
- T.A. et al. (2010) Bjarnason T.A., McCreary C.R., Dunn J.F., and Mitchell J.R. Quantitative T2 analysis: The effects of noise, regularization, and multivoxel approaches. Magn Reson Med, 63:212–217, 2010.
- M.A. et al. (2004) Bernstein M.A., King K.F., and Zhou X.J. Handbook of MRI pulse sequences, page 33. Burlington: Elsevier Academic Press, 2004.
- J. (1988) Henning J. Multiecho imaging sequences with low refocusing flip angles. Magn Reson Med, 78:397–407, 1988.
- T. et al. (2012a) Prasloski T., Mädler B., Xiang Q.-S., MacKay A., and Jones C. Applications of stimulated echo correction to multicomponent T2 analysis. Magn Reson Med, 67(6):1803–1814, 2012a.
- T. et al. (2012b) Prasloski T., Rauscher A., MacKay A.L., Hodgson M., Vavasour I.M., Laule C., and Mädler B. Rapid whole cerebrum myelin water imaging using a 3D GRASE sequence. NeuroImage, 63:533–539, 2012b.
- P.A. et al. (2012) Bandettini P.A., Bowtell R., Jezzard P., and Turner R. Ultrahigh field systems and applications at 7t and beyond: progress, pitfalls and potential. Magn Res Med, 67(2):317–321, 2012.
- V. et al. (2020) Wiggermann V., Vavasour I.M., Kolind S.H., MacKay A.L., Helms G., and Rauscher A. Non-negative least squares computation for in vivo myelin mapping using simulated multi-echo spin-echo T2 decay data. NMR Biomed, page e4277, 2020.
- K. et al. (2014) Nehke K., Versluis M.J., Webb A., and Börnert P. Volumetric B1(+) mapping of the brain at 7T using DREAM. Magn Reson Med, 71(1):246–256, 2014.
- K.P. and A.L. (1989) Whittall K.P. and MacKay. A.L. Quantitative interpretation of NMR relaxation data. J Magn Reson, 84:134–152, 1989.
- S.H. et al. (2009) Kolind S.H., Mädler B., Fischer S., Li D.K.B., and MacKay A.L. Myelin water imaging: implementation and development at 3.0T and comparison to 1.5T measurements. Magn Reson Med, 62(1):106–115, 2009.
- J. et al. (2016) Davies-Thompson J., Vavasour I., Scheel M., Rauscher A., and Barton J.J. Reduced myelin water in the white matter tracts of patients with niemann-pick disease type c. AJNR Am J Neuroradiol, 37(8):1487–1489, 2016.
- S.M. et al. (2009) Meyers S.M., Vavasour I.M., Mädler B., Harris T., Fu E., Li D.K.B., Traboulsee A., MacKay A.L., and Laule C. Reproducibility of myelin water fraction analysis: a comparison of region of interest and voxel-based analysis methods. Magn Reson Imaging, 27(8):1096–1103, 2009.
- J.G. et al. (1998) Sled J.G., Zijdenbos A.P., and Evans A.C. A nonparametric method for automatic correction of intensity nonuniformity in MRI data. IEEE Trans Med Imaging, 17(1):87–97, 1998.
- S.M. (2002) Smith S.M. Fast robust automated brain extraction. Hum Brain Mapp, 17(3):143–155, 2002.
- M. and M. (2001) Jenkinson M. and Smith M. A global optimization method for robust affine registration of brain images. Med Image Anal, 5(2):143–156, 2001.
- M. et al. (2002) Jenkinson M., Bannister P., Brady M., and Smith S. Improved optimisation for the robust and accurate linear registration and motion correction of brain images. NeuroImage, 17(2):825–841, 2002.
- J.L.R. et al. (2010) Andersson J.L.R., Jenkinson M., and Smith S. Non-linear registration, aka spatial normalisation. FMRIB technical report, TR07JA2, 2010.
- M. et al. (2012) Jenkinson M., Beckmann C.F., Behrens T.E.J., Woolrich M.W., and Smith S.M. Fsl. NeuroImage, 62(2):782–790, 2012.
- R.S. et al. (2006) Desikan R.S., Ségonne F., Fischl B., and et al. An automated labeling system for subdividing the human cerebral cortex on MRI scans into gyral based regions of interest. NeuroImage, 31(3):968–980, 2006.
- S. et al. (2005) Mori S., Wakana S., Van Zijl P.C., and Nagae-Poetscher L.M. MRI atlas of human white matter. Amsterdam: Elsevier, 2005.
- M. et al. (2014) Modat M., Cash D.M., Daga P., Winston G.P., Duncan J.S., and Ourselin S. Global image registration using a symmetric block-matching approach. J Med Imaging, 1(2):024003, 2014.
- E. et al. (2001) Yacoub E., Shmuel A., Pfeuffer J., and et al. Imaging brain function in humans at 7T. Magn Reson Med, 45(4):588–594, 2001.
- C. et al. (2019) Birkl C., Birkl-Toeglhofer A.M., Endmayr V., Höftberger R., Kasprian G., Krebs C., Haybaeck J., and Rauscher A. The influence of brain iron on myelin water imaging. Neuroimage, 199:545–552, 2019.
- B. et al. (2020) Hansson B., Markenroth Bloch K., Owman T., and et al. Subjectively reported effects experience in an actively shielded 7T MRI: A large scale study. J Magn Reson Med, 52(4):1265–1276, 2020.
- H. et al. (2020) Olsson H., Andersen M., Lätt J., Wirestam R., and Helms G. Reducing bias in dual flip angle T1-mapping in human brain at 7T . Magn Reson Med, 84(3):1347–1358, 2020.
- W.D. et al. (2007) Rooney W.D., Johnson G., Li X., and et al. Magnetic field and tissue dependencies of human brain longitudinal 1H20 relaxation in vivo. Magn Reson Med, 57(2):308–318, 2007.
- R. et al. (2016) Pohmann R., Speck O., and Scheffler K. Signal-to-noise ratio and MR tissue parameters in human brain imaging at 3, 7, and 9.4 tesla using current receive coil arrays. Magn Reson Med, 75(2):801–809, 2016.
- G.J. et al. (2005) Stanisz G.J., Odrobina E.E., Pun J., and et al. T1, T2 relaxation and magnetization transfer in tissue at 3T. Magn Reson Med, 54(3):507–512, 2005.
- P.J. et al. (2008) Wright P.J., Mougin O.E., Totman J.J., and et al. Water proton T1 measurements in brain tissue at 7, 3, and 1.5T using IR-EPI, IR-TSE, and MPRAGE: results and optimization. MAGMA, 21(1-2):121–130, 2008.
- S. et al. (2013) Kalantari S., Komeilizadeh N., Vavasour I.M., Sahabjavaher R., and MacKay A. Variation in myelin water fraction as a function of TR. In Proc Intl Soc Magn Reson Med, page 1226, 2013.
- C. et al. (2020) Birkl C., Doucette J., Fan M., Hernandez-Torres E., and Rauscher A. Myelin water imaging depends on white matter fiber orientation in the human brain. Magn Reson Med, EarlyView, 2020. 10.1002/mrm.28543.
- C. et al. (2014) Labadie C., Lee J.H., Rooney W.D., Jarchow S., Aubert-Frécon M., Springer Jr. C.S., and Möller H.E. Myelin water mapping by spatially regularized longitudinal relaxographic imaging at high magnetic fields. Magn Reson Med, 71(1):375–387, 2014.
- K.P. et al. (1999) Pruessmann K.P., Weiger M., Scheidegger M.B., and Boesiger P. SENSE: Sensitivity encoding for fast MRI. Magn Reson Med, 42:951–962, 1999.
- W.M. et al. (2012) Teeuwisse W.M., Brink W.M., and Webb A.G. Quantitative assessment of the effects on high-permittivity pads in 7 Tesla MRI of the brain. Magn Reson Med, 67(5):1285–1293, 2012.
- G. et al. (2005) Adriany G., van de Moortele P.F. abd Wiesinger F., and et al. Transmit and receive transmission line arrays for 7 Tesla parallel imaging. Magn Reson Med, 53:434–445, 2005.
- U. and P. (2006) Katscher U. and Börnert P. Parallel RF transmission in MRI. NMR Biomed, 19(3):393–400, 2006.
- P. et al. (2008) Kozlowski P., Liu J., Yung A.C., and Tetzlaff W. High-resolution myelin water measurements in rat spinal cord. Magn Reson Med, 59(4):796–802, 2008.
- R. et al. (2002) Bartha R., Michaeli S., and et al. Merkle H. In vivo 1H2O T2+ measurement in the human occipital lope at 4T and 7T by Carr-Purcell MRI: Detection of microscopic susceptibility contrast. Magn Reson Med, 47(4):742–750, 2002.
- K. et al. (2009) Uludaǧ K., Müller-Bierl B., and Uǧurbil K. An integrative model for neuronal activity-induced signal changes for gradient and spin echo functional imaging. NeuroImage, 48(1):150–165, 2009.
- A. et al. (2009) Hocq A., Brouette N., Saussez S., Luhmer M., Gillis P., and Gossuin Y. Variable-field relaxometry of iron-containing human tissues: a preliminary study. Contrast Media Mol, 4:157–164, 2009.
- F. et al. (2012) Mitsumori F., Watanabe H., Takaya N., and et al. Toward understanding transverse relaxation in human brain through its field dependence. Magn Res Med, 68:947–953, 2012.
- I.M. et al. (2017) Vavasour I.M., Sun P., and et al. Kolind S.H. Using myelin water and diffusion basis spectrum imaging to differentiate demyelination, inflammation, oedema and axonal damage in subjects with multiple sclerosis. In Proc Intl Soc Mag Reson Med, volume 25, page 216, 2017.
Supplemental Materials
| T | Short T2 fraction [%] | Geom. mean short T2 peak [ms] | Geom. mean intm. T2 peak [ms] | EPG-FA estimation [∘] | Fit-to-noise ratio (FNR) | |
| ROI 1 | 7T8ms | 3.273.5 | 11.23.2 | 46.43.4 | 159.013.0 | 372.098.6 |
| 7T10ms | 3.223.5 | 12.42.9 | 46.53.4 | 159.013.0 | 369.896.9 | |
| 3T8ms | 5.764.5 | 11.05.1 | 67.55.5 | 174.94.3 | 184.450.0 | |
| 3T10ms | 5.224.0 | 13.05.4 | 67.65.6 | 175.04.3 | 182.349.9 | |
| ROI 2 | 7T8ms | 5.176.0 | 11.13.9 | 38.84.4 | 174.25.4 | 372.3101.1 |
| 7T10ms | 5.346.0 | 12.83.7 | 39.04.4 | 174.45.5 | 367.998.8 | |
| 3T8ms | 3.334.4 | 12.76.9 | 60.05.7 | 165.47.3 | 185.135.9 | |
| 3T10ms | 3.044.0 | 14.87.0 | 60.15.7 | 165.57.2 | 183.434.9 | |
| ROI 3 | 7T8ms | 3.784.9 | 11.43.6 | 41.95.0 | 131.112.3 | 276.280.4 |
| 7T10ms | 3.744.8 | 13.03.5 | 42.05.1 | 131.212.3 | 274.679.7 | |
| 3T8ms | 3.984.6 | 11.85.5 | 64.15.7 | 159.57.5 | 167.042.0 | |
| 3T10ms | 3.614.3 | 13.55.5 | 64.25.8 | 159.77.5 | 165.541.2 | |
| ROI 4 | 7T8ms | 8.025.0 | 12.43.6 | 48.83.1 | 164.112.0 | 377.4144.9 |
| 7T10ms | 8.335.0 | 13.63.4 | 49.13.2 | 164.212.0 | 373.4142.4 | |
| 3T8ms | 11.24.0 | 10.73.5 | 68.52.9 | 176.54.0 | 243.944.7 | |
| 3T10ms | 10.63.7 | 12.03.1 | 68.82.9 | 176.73.9 | 239.644.3 | |
| ROI 5 | 7T8ms | 6.187.4 | 11.53.3 | 45.53.6 | 159.212.4 | 287.7106.1 |
| 7T10ms | 6.157.4 | 12.63.1 | 45.73.7 | 159.312.4 | 285.2104.2 | |
| 3T8ms | 7.565.7 | 14.16.6 | 63.93.8 | 164.39.2 | 223.949.4 | |
| 3T10ms | 7.325.5 | 15.66.6 | 64.23.9 | 164.59.1 | 221.548.9 | |
| ROI 6 | 7T8ms | 9.466.3 | 11.43.1 | 48.63.2 | 146.818.1 | 318.790.8 |
| 7T10ms | 9.476.2 | 12.52.8 | 48.93.3 | 146.918.1 | 315.289.3 | |
| 3T8ms | 11.55.2 | 13.55.3 | 69.73.4 | 172.57.2 | 256.353.9 | |
| 3T10ms | 11.25.0 | 14.45.1 | 70.03.4 | 172.57.0 | 253.553.1 | |
| ROI 7 | 7T8ms | 9.127.2 | 13.33.7 | 48.26.7 | 160.812.8 | 346.481.6 |
| 7T10ms | 9.867.4 | 14.53.4 | 48.76.9 | 161.012.9 | 343.179.7 | |
| 3T8ms | 12.67.0 | 16.86.2 | 71.08.4 | 166.28.1 | 192.639.8 | |
| 3T10ms | 12.66.9 | 17.95.9 | 71.78.7 | 166.47.9 | 190.738.9 |