Fusion of 16O+165Ho at deep sub-barrier energies
Abstract
Fusion cross-sections have been measured for the asymmetric system 16O+165Ho at energies near and deep below the Coulomb barrier with an aim to investigate the occurrence of fusion hindrance for the system. Fusion cross sections down to 700 nb have been measured using the off-beam -ray technique. The fusion cross sections have been compared with the coupled channel calculations. Although the onset of fusion hindrance could not be observed experimentally, an indication of a small deviation of the experimental fusion cross-sections with respect to the calculated cross-sections could be observed at the lowest energy measured. However, the energy onset of fusion hindrance has been obtained from the extrapolation technique and is found to be about 2 MeV below the lowest energy of the present measurement.
I. INTRODUCTION
Extensive studies on fusion reactions at sub-barrier energies in different mass regions have unraveled the fundamentals of quantum mechanical tunnelling and distribution of potential barriers between two interacting nuclei. Fusion in the vicinity of Coulomb barrier is a probe to discern the indispensable role of different intrinsic features of the interacting nuclei on the reaction process. Enhancement of fusion cross sections observed in heavy-ion collisions at sub-barrier energies has been well explained by the coupled channels model [1; 2].
On extending the measurements from sub-barrier down to deep sub-barrier energies, for a wide range of reactions [3; 5; 6; 4; 7; 8; 9; 10; 11; 12; 13; 14; 15; 16; 17; 18; 19], a steep fall-off of fusion excitation function has been observed compared to the standard coupled channels calculations, although fusion cross sections are still enhanced with respect to single-barrier penetration model calculations. This phenomenon of change of slope in the fusion excitation function at deep sub-barrier energies is termed as "fusion hindrance". Observation of fusion hindrance at deep sub-barrier energies, especially in light systems like 12C+12C and 16O+16O [4] have astrophysical implications, as some of the light systems transpire in the late evolutionary stages of massive stars.
Fusion hindrance was initially observed in the symmetric medium-heavy system 60Ni+89Y [3], having negative Q-value. Subsequently, studies of several symmetric and nearly-symmetric [5; 6; 7; 8; 9; 10; 11; 12; 13] and asymmetric [14; 15] systems over a wide range of mass and fusion Q-values have also exhibited similar observation. By contrast, fusion of weakly bound light projectiles 6,7Li with 198Pt does not manifest hindrance at deep sub-barrier energies [16; 17]. However, in fusion with relatively heavier projectiles 11B and 12C on the targets 197Au [18] and 198Pt [16], respectively, hindrance has been observed. From these studies, it appears that for asymmetric heavy systems, fusion hindrance becomes increasingly significant with increasing mass and charge of the projectiles.
Several models with different physical foundations have been proposed to describe this phenomenon. Among them, the model developed by Mişicu and Esbensen [20; 21] is based on sudden approximation. A soft repulsive core was incorporated with the density folded M3Y potential in this model, to consider the nuclear incompressibility in the overlapping region of the two interacting nuclei. The adiabatic model proposed by Ichikawa et al. [22; 23] introduces an additional damping factor on the nuclear coupling potential. The damping factor is a function of the internuclear distance, which takes into consideration of the smooth change from sudden to adiabatic transition while the two nuclei are going through fusion deep below the barrier. More recently, Simenel et al. have studied the effect of Pauli repulsion on heavy ion fusion by implementing the density-constrained frozen Hartree-Fock method [24]. Despite having different physical origins, these models have been quite successful in reproducing the experimental results for different systems at deep sub-barrier energies [4].
In the light of the problem of fusion hindrance, we have recently measured fusion cross-sections for 16O+165Ho system at energies near and deep below the Coulomb barrier. Owing to the large deformation of nuclei in the rare-earth region, systems involving such nuclei usually exhibit strong coupling effects between relative motion and internal degrees of freedom in the sub barrier fusion mechanism. The target nucleus 165Ho has a large deformation parameter [25], whereas the projectile 16O is a tightly bound spherical nucleus and therefore subdues the projectile effect of different coupling schemes on the fusion mechanism. It has been perceived that stiff systems, where coupling effects are small, typically show fusion hindrance more readily than soft systems [4]. The dominance of the influence of different direct reaction channels, like inelastic scattering, transfer and breakup, in reactions involving soft nuclei are believed to be responsible for the occurrence of fusion hindrance at much lower energies than stiff systems [4]. The system 16O+165Ho lies between stiff and soft systems having a negative Q-value (Q=23.1 MeV) for fusion. It would be interesting to study fusion mechanism in the system of tightly bound projectile 16O on the deformed nucleus 165Ho, especially at deep sub-barrier energies.
The complete fusion(CF) cross sections of 16O+165Ho at above-barrier energies have been reported in the literature [26]. Present study overlaps some of the energies of the reported measurement. The measurement has been extended towards below barrier to deep sub-barrier energy region. An off-beam -ray detection technique has been implemented to measure the cross sections of the -active evaporation residues. Section II recounts the detailed experimental method that have been implemented to perform the experiment. The procedure of data analysis have been explained in Section III. The details of theoretical coupled channel calculations and comparison with experimental results have been described in Section IV. Section V consists of a discussion followed by a summary of the present work in Section VI.
II. EXPERIMENTAL DETAILS
The experiment was performed at the 14UD BARC-TIFR Pelletron-LINAC facility, Mumbai. Self-supporting, rolled, natural foils of 165Ho, having thickness in the range 1.02-1.9 mg/cm2 were irradiated by beams of 16O, in the energy range Elab=62-85 MeV. Each target foil of 165Ho was followed by an Al catcher foil, sufficiently thick to stop the heavy evaporation residues (ERs) produced in the reaction. The thickness of each target and catcher foil was measured by the -transmission method. For each irradiation, a fresh target-catcher foil assembly was used. Typical beam current during the irradiations was 2-10 pnA. To correct for beam fluctuations during the irradiation, the beam current was recorded at regular intervals of 1 min using a CAMAC scaler. The energies of the incident beam were corrected for the loss of energy in the target material by employing SRIM [27], at half-thickness of the target . As all the ERs were -active and yielded delayed -rays, the activation technique was employed to determine the fusion cross sections for the system. After each irradiation, the target-catcher foil assembly was removed from the chamber and placed in front of an efficiency calibrated HPGe detector, which detected the delayed -rays emitted by the ERs.
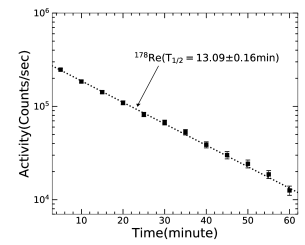
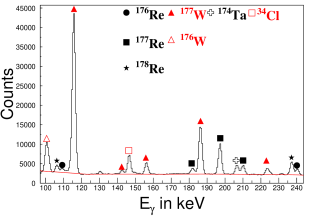
The target-catcher foil assembly was placed either at a distance of 10 cm from the face of the detector or on the face of the detector, depending on the activity of the irradiated sample. The energy calibration and absolute efficiency measurement of the detector were carried out using the standard radioactive sources, 152Eu, 133Ba and 60Co, mounted in the same geometry as the target. The measurement was done in a low background setup with Pb-Cu graded shielding to reduce the background -rays. Data were recorded using a digital data acquisition system employing a CAEN N6724 digitizer and the data were analyzed using the ROOT data analysis framework [28]. A typical off-beam -ray spectrum, after the irradiation at Elab= 84 MeV, is shown in Fig. 1. The complete fusion ERs 176-178Re occurring from the decay of the compound nucleus 181Re were uniquely identified from the characteristic -rays emitted by their daughter nuclei and by following the half-lives. Half lives of the ERs were measured from the time sliced yields of the characteristic -rays and compared with the previously measured values [29], to ensure the absence of any contribution from sources other than the complete fusion residues. The half-life plot for 178Re at Elab= 70 MeV has been shown in Fig. 2.
III. ANALYSIS AND RESULTS
If Nγ represents the number of counts under a particular -ray peak, corresponding to a given ER in the spectrum, then from the principle of radioactive decay the corresponding ER cross-section () is given as [30]:
| (1) |
where NB is the number of incident nuclei, NT is the number of target nuclei per unit area, is the decay constant of the ER, tirr is the irradiation time, tw is the time elapsed between the end of irradiation and the beginning of counting, tc is the counting time, is the efficiency of the detector for a given -ray energy, and Fγ is the absolute intensity of a -ray decay.
The -ray peak corresponding to 34Cl, seen in the spectrum (Fig. 1), arises from the reaction of 16O with the Al catcher foil. Different and channels, corresponding to isotopes of W and Ta respectively, populated in the reaction of 16O+165Ho are marked in the spectrum. The channel can be populated as an ER of compound nucleus and also from the decay product of Re (e.g. 177Re 177W). The procedure to calculate the true weight of ERs from the cumulative cross-sections have been discussed by Cavinato et al. [31]. In the energy region of the present measurement, it has been found that majority of the -ray peaks corresponding to channels are due to the decay of Re nuclei. The contribution of ERs, i.e. the direct decay product of compound nucleus falls within the error limit of respective cross-sections at different energies and thus have not been estimated rigorously. The channels are populated either by incomplete fusion (ICF) or via the decay of compound nucleus(CF). To estimate the contribution of channels arising from the CF residues, statistical model calculation has been performed using the PACE4 code [32].
| Residue | (min) | (keV) | (%) | |
|---|---|---|---|---|
| 178Re(3) | 13.2 | 3+ | 237.0 | 44.5 |
| 106.0 | 23.4 | |||
| 177Re(4) | 14.0 | 5/2- | 196.9 | 8.4 |
| 209.8 | 2.8 | |||
| 176Re(5) | 5.3 | 3+ | 240.3 | 54.0 |
| 109.1 | 25.0 | |||
| 174Ta() | 68.4 | 3+ | 206.5 | 60.0 |
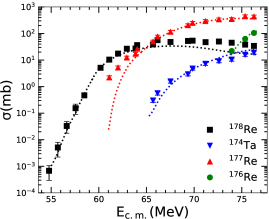
To obtain a relatively better agreement between theoretical and experimental cross-sections, the neutron and alpha potentials in the code have been modified according to Ref.[33] and Ref.[34], respectively. Fission barrier was fixed at 21.89 MeV following Ref.[26] and the level density parameter "" was taken to be 9. The other parameters in the code were set to the default values. Calculated cross section for each partial wave by coupled channel calculation (detailed discussion in next section) has been fed as input to the PACE4 calculations. The production of 174Ta via ICF is energetically possible at higher energies (80-85 MeV) but at lower energies, it becomes unlikely that 174Ta will be populated as an ICF product. It has also been observed that within the energy range of the measurement, the experimental cross-sections of channel (174Ta) reasonably agree with the statistical model, which exclusively deals with CF process. The experimentally measured cross-sections of other channels are distinctly underestimated by the statistical model calculations. Similar trend has also been observed in Ref.[26]. As the PACE4 code has been able to reproduce the cross-sections of and channels relatively well, it can be inferred that all the other channels, or at least an exceedingly significant part of them have been populated via incomplete fusion(ICF). Fig.3 shows a comparison of the statistical model calculations with the measured ER channel cross-sections.
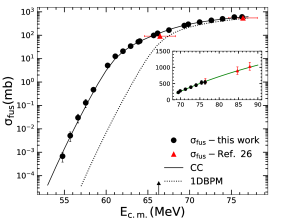
The total fusion cross-sections have been determined by adding the measured cross sections of and channels and are shown in Fig. 4. Fusion cross section down to 678 nb has been measured in this work. Statistical errors, as well as errors ensuing from the measurement of beam current, target thickness and detector efficiency have been taken into account.
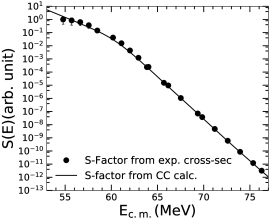
The astrophysical S-factor, often used in nuclear astrophysics to study the low-energy behavior of nuclear reactions, is defined as,
| (2) |
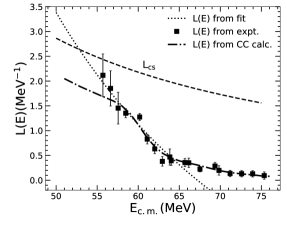
where E is the center-of-mass energy, is the fusion cross-section and = is Sommerfield parameter with being the beam velocity. The experimental S-factor curve corresponding to the measured fusion cross-sections for the present system has been plotted in Fig. 5. Appearance of a maximum in the S-factor curve has been presented in previous studies at an energy where the hindrance in fusion cross-section sets in. In the present study, although no clear maximum could be seen in the S-factor curve within the measured energy range, an indication of a change of slope at the lowest energy could be observed. An alternative representation, the logarithmic slope of the fusion excitation function is defined as [3],
| (3) |
The values of , extracted from the measured fusion cross sections for 16O+165Ho are plotted in Fig. 6. These representations are independent of any theoretical model and are alternative approaches to manifest any deviation in the slope of excitation function. From eqns. (2) and (3), one gets the relation,
| (4) |
The derivative becomes zero when S-factor becomes maximum, and from eqn. (3) one finds that this corresponds to the logarithmic derivative for constant S-factor, , given by:
| (5) |
The dashed curve for the present system is shown in Fig. 6 by the dashed line. The experimental values of have been fitted with a function [36; 37], and is shown in Fig. 6 by the dotted line. The crossover point of the curves and fitted corresponds to the maximum of the S-factor curve and is related to the threshold energy () for the occurance of fusion hindrance [4]. In the measured energy regime of the present work, the fitted curve does not intersect the curve. However, it can be seen from Fig. 6 that an extrapolation of the fitted curve intersects the curve at the energy 52.780.78 MeV. The value of calculated from the empirical equation [38] is 53.17 MeV. The estimation of obtained from the touching point configuration in adiabatic picture [22; 23] is 56.1 MeV.The present measurement has been performed down to E = 54.78 MeV, which is 2 MeV above the extrapolated value and 1.3 MeV below the prediction from adiabatic model. This shows that the value for 16O+165Ho system will be lower than that predicted by the adiabatic model.
IV. COMPARISON WITH COUPLED CHANNELS CALCULATIONS
The data obtained in the present work have been analyzed in the framework of coupled channels (CC) calculations, using the code CCFULL [39]. These calculations require an initial set of potential parameters. They were obtained by fitting the fusion cross sections well above the barrier using Wong’s formula[41], as the fusion cross sections in this energy regime are expected to be fairly insensitive to the form or magnitude of the couplings. The nuclear potential was taken to be of Woods-Saxon form,
| (6) |
where is the depth, is the radius parameter, and is the diffuseness of the nuclear potential. The potential parameters were obtained by fixing to be 0.63 fm, and varying and to obtain a good fit to the high energy part of the cross sections. The parameters thus obtained are: 102 MeV, 1.15 fm and 0.63 fm. The inset in Fig. 4 shows the resulting fit. The potential parameters for the same system has also been compared with Ref. [40]; both results are found to be identical.
The CCFULL calculations in the no-coupling limit are shown by the dotted curve in Fig. 4, and are seen to underpredict the data, suggesting strong effects of deformation in the target nucleus. The CCFULL code estimates the effects of deformation by linear as well as non linear coupling to the pure rotational bands of the deformed nucleus. The target nucleus 165Ho is deformed with a valence proton. The rotational states of 165Ho may be considered to be built up by the coupling of the unpaired valence proton particle (or proton hole) with the 0+,2+,4+,…rotational states of the neighboring even-even nucleus 164Dy (or 166Er). To remain within the model space of CCFULL, the excitation energies and deformation parameters for the target nuclues 165Ho were taken to be the averages of those of the neighboring even-even nuclei 164Dy and 166Er [42; 43]. The resulting ground state rotational band upto 12+ state (=0.32 , =0.02 ) was included in the calculations. The results of these calculations are shown by the solid curve in the figure. They are seen to be in fairly good agreement with the data, except the lowest energy data which appears to be slightly below the calculated value.
The solid curve in Fig. 5 shows the calculated astrophysical S-factor values extracted from the CC cross sections and are found to agree well with the experimental value, except the lowest energy point. Although no clear maximum in the experimental S-factor plot or deviation from the the CC calculations could be observed in the measured energy range, an indication of a small deviation could be seen at the lowest energy measured. The dot-dashed curve in Fig. 6 shows the calculated values extracted from the CC cross sections and and are also seen to agree well with the experimental values, although the trend of the two extreme low energy points show an indication of possible deviation at still lower energies.
V. DISCUSSION
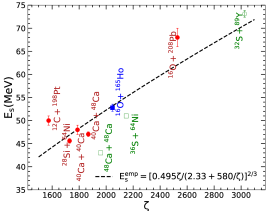
For a systematic study of the energy onset of fusion hindrance, the value of predicted for the system 16O+165Ho in the present work has been compared in Fig. 7 with the values of other heavy systems as a function of the system parameter . The parameters are the mass number and atomic number of projectile and target. In this comparison, we have considered only the systems in the range 1500-3000, for which are available in the literature. The parameter contains information of the mass and Coulomb barrier of the target-projectile system. The dashed line in the figure corresponds to the empirical form of [38]. The extrapolated value of obtained in the present work lies very close to the result obtained from the empirical form ; although it should be pointed out that an actual measurement down to the predicted threshold energy will confirm the result. On the other hand, the limit, obtained from the adiabatic model, has been crossed but hindrance for this system was not experimentally observed within the measured energy range.
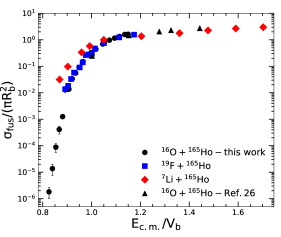
A systematic comparison of fusion excitation functions have been carried out for systems involving the target nucleus 165Ho and different projectiles and is shown in Fig. 8. The systems involving 165Ho target nucleus, for which sub-barrier fusion cross sections have been reported in literature are 19F+165Ho [44] and 7Li+165Ho [46]. The projectile 16O in the present system is a stiff nucleus, while 19F is relatively heavier and less bound than 16O, and 7Li is a well known weakly bound stable nucleus. For comparison of different projectile-target systems, the fusion excitation functions have been plotted in a reduced scale. Barrier radii = and Coulomb barrier for each system was obtained by performing 1DBPM model calculation, using the Akyüz-Winther parametrization of Woods-Saxon potential [47].
| System | (MeV) | (fm) | |||
|---|---|---|---|---|---|
| 16O+165Ho | 66.34 | 10.93 | |||
| 19F+165Ho | 72.24 | 11.26 | |||
| 7Li+165Ho | 25.0 | 10.76 |
Fig. 8 shows that the reduced fusion excitation functions for the three systems overlap reasonably well with each other at above barrier energies. But there are no reported fusion cross sections at deep-sub-barrier energies for the systems 19F+165Ho and 7Li+165Ho. At sub-barrier energies, the fusion cross-sections for 19F+165Ho and 16O+165Ho agree fairly well with each other; while the fusion cross-sections for 7Li+165Ho are enhanced in the reduced scale. It would be interesting to see how the deep sub-barrier fusion cross sections for the two systems compare with the present 16O+165Ho system.
VI. SUMMARY
The fusion cross-sections for 16O+165Ho have been measured down to 678 nb, from above-barrier to deep sub-barrier energies. The present measurement agrees with the earlier reported data [26], in the overlapping above-barrier energy region. Statistical model calculation of different evaporation residues occurring from CF yielded similar results with experimental data. The experimental CF cross-sections have been well reproduced by the coupled channels calculations. No clear evidence of fusion hindrance has been observed in the fusion excitation function in the measured energy range of the present work. However, the trend of the extreme low energy points in the S-factor and plots show an indication of possible deviation at still lower energies. The extrapolation of suggests the onset of fusion hindrance at 52.780.78 MeV, approximately 2 MeV lower than the lowest energy measured in the present work, in accordance with the prediction from systematics. Further measurement at lower energies may confirm the result.
Acknowledgements.
We sincerely thank the staff of BARC-TIFR Pelletron facility for an uninterrupted supply of beam. We would like to extend our gratitude towards Dr. Sanjoy Pal of TIFR, Mumbai; for helping with the digital data acquisition.References
- [1] A.B. Balantekin and N. Takigawa, Rev. Mod. Phys. 70, 77 (1998), and references therein.
- [2] M. Dasgupta, D.J. Hinde, N. Rowley, and A.M. Stefanini, Annu. Rev. Nucl. Part. Sci. 48, 401 (1998), and references therein.
- [3] C. L. Jiang, H. Esbensen, K. E. Rehm, B. B. Back, R. V. F. Janssens, J. A. Caggiano, P. Collon, J. Greene, A. M. Heinz, D. J. Henderson, I. Nishinaka, T. O. Pennington, and D. Seweryniak, Phys. Rev. Lett. 89, 052701 (2002).
- [4] B. B. Back, H. Esbensen, C. L. Jiang, and K. E. Rehm, Rev. Mod. Phys. 86, 317 (2014), and references therein.
- [5] C. L. Jiang, K. E. Rehm, R. V. F. Janssens, H. Esbensen, I. Ahmad, B. B. Back, P. Collon, C. N. Davids, J. P. Greene, D. J. Henderson, G. Mukherjee, R. C. Pardo, M. Paul, T. O. Pennington, D. Seweryniak, S. Sinha, and Z. Zhou, Phys. Rev. Lett. 93, 012701 (2004).
- [6] C. L. Jiang, K. E. Rehm, H. Esbensen, R. V. F. Janssens, B. B. Back, C. N. Davids, J. P. Greene, D. J. Henderson, C. J. Lister, R. C. Pardo, T. Pennington, D. Peterson, D. Seweryniak, B. Shumard, S. Sinha, X. D. Tang, I. Tanihata, S. Zhu, P. Collon, S. Kurtz, and M. Paul, Phys. Rev. C 71, 044613 (2005).
- [7] A. M. Stefanini, G. Montagnoli, L. Corradi, S. Courtin, E. Fioretto, A. Goasduff, F. Haas, P. Mason, R. Silvestri, P. P. Singh, F. Scarlassara, and S. Szilner, Phys. Rev. C 82, 014614 (2010).
- [8] C. L. Jiang, A. M. Stefanini, H. Esbensen, K. E. Rehm, L. Corradi, E. Fioretto, P. Mason, G. Montagnoli, F. Scarlassara, R. Silvestri, P. P. Singh, S. Szilner, X. D. Tang, and C. A. Ur, Phys. Rev. C 82, 041601 (2010).
- [9] G. Montagnoli, A. M. Stefanini, C. L. Jiang, H. Esbensen et al., L. Corradi, S. Courtin, E. Fioretto, A. Goasduff, F. Haas, A. F. Kifle, C. Michelagnoli, D. Montanari, T. Mijatović, K. E. Rehm, R. Silvestri, Pushpendra P. Singh, F. Scarlassara, S. Szilner, X. D. Tang, and C. A. Ur, Phys. Rev. C 85, 024607 (2012).
- [10] G. Montagnoli, A. M. Stefanini, L. Corradi, S. Courtin, E. Fioretto, F. Haas, D. Lebhertz, F. Scarlassara, R. Silvestri, and S. Szilner, Phys. Rev. C 82, 064609 (2010).
- [11] G. Montagnoli, A. M. Stefanini, H. Esbensen, C. L. Jiang, L. Corradi, S. Courtin, E. Fioretto, A. Goasduff, J. Grebosz, F. Haas, M. Mazzocco, C. Michelagnoli, T. Mijatovic, D. Montanari, C. Parascandolo, K. E. Rehm, F. Scarlassara, S. Szilner, X. D. Tang, and C. A. Ur, Phys. Rev. C 87, 014611 (2013).
- [12] C. L. Jiang, A. M. Stefanini, H. Esbensen, K. E. Rehm, S. Almaraz-Calderon, B. B. Back, L. Corradi, E. Fioretto, G. Montagnoli, F. Scarlassara, D. Montanari, S. Courtin, D. Bourgin, F. Haas, A. Goasduff, S. Szilner, and T. Mijatovic, Phys. Rev. Lett. 113, 022701 (2014).
- [13] C. L. Jiang, B. B. Back, H. Esbensen et al., J. P. Greene, R. V. F. Janssens, D. J. Henderson, H. Y. Lee, C. J. Lister, M. Notani, R. C. Pardo, N. Patel, K. E. Rehm, D. Seweryniak, B. Shumard, X. Wang, S. Zhu, S. Mişicu, P. Collon, and X. D. Tang, Phys. Rev. C 78, 017601 (2008).
- [14] M. Dasgupta, D. J. Hinde, A. Diaz-Torres, B. Bouriquet, Catherine I. Low, G. J. Milburn, and J. O. Newton, Phys. Rev. Lett. 99, 192701 (2007).
- [15] A. M. Stefanini, G. Montagnoli, H. Esbensen, L. Corradi, S. Courtin, E. Fioretto, A. Goasduff, J. Grebosz, F. Haas, M. Mazzocco, C. Michelagnoli, T. Mijatovic, D. Montanari, G. Pasqualato, C. Parascandolo, F. Scarlassara, E. Strano, S. Szilner, and D. Torresi, Phys. Lett. B 728, 639 (2014).
- [16] A. Shrivastava, K. Mahata, S. K. Pandit, V. Nanal, T. Ichikawa, K. Hagino, A. Navin, C. S. Palshetkar, V. V. Parkar, K. Ramachandran, P. C. Rout, A. Kumar, A. Chatterjee, and S. Kailas, Phys. Lett. B 755, 332 (2016).
- [17] A. Shrivastava, A. Navin, A. Lemasson, K. Ramachandran, V. Nanal, M. Rejmund, K. Hagino, T. Ichikawa, S. Bhattacharyya, A. Chatterjee, S. Kailas, K. Mahata, V. V. Parkar, R. G. Pillay, and P. C. Rout, Phys. Rev. Lett. 103, 232702 (2009).
- [18] A. Shrivastava, K. Mahata,V. Nanal, S. K. Pandit,V. V. Parkar, P. C. Rout, N. Dokania, K. Ramachandran,A. Kumar, A. Chatterjee and S. Kailas, Phys. Rev. C 96, 034620 (2017).
- [19] G. Montagnoli, A. M. Stefanini, C. L. Jiang, K. Hagino, F. Galtarossa, G. Colucci, S. Bottoni, C. Broggini, A. Caciolli et al., Phys. Rev. C 97, 024610 (2018).
- [20] S. Mişicu and H. Esbensen, Phys. Rev. Lett. 96, 112701 (2006).
- [21] S. Mişicu and H. Esbensen, Phys. Rev. C 75, 034606 (2007).
- [22] T. Ichikawa, K. Hagino, and A. Iwamoto, Phys. Rev. Lett. 103, 202701 (2009).
- [23] T. Ichikawa, Phys. Rev. C 92, 064604 (2015).
- [24] C. Simenel, A. S. Umar, K. Godbey, M. Dasgupta, and D. J. Hinde, Phys. Rev. C 95, 031601(R) (2017).
- [25] P. Möller, A. J. Sierk, T. Ichikawa, and H. Sagawa, At. Data Nucl. Data Tables, 109-110, 1 (2016).
- [26] Kamal Kumar, Tauseef Ahmad, Sabir Ali, I. A. Rizvi, Avinash Agarwal, R. Kumar, K. S. Golda and A. K. Chaubey, Phys. Rev. C 87, 044608 (2013).
- [27] J. F.Ziegler, M. D. Ziegler, and J. P. Biersack, Nucl. Instrum. Methods B 268, 1818 (2010).
- [28] Rene Brun, and Fons Rademakers, Nucl. Instrum. Methods Phys. Res. A 389, 81 (1997).
- [29] https://www.nndc.bnl.gov.
- [30] P.R.S. Gomes, and T.J.P. Penna, Nucl. Instrum. Methods Phys. Res. A 280, 395 (1989).
- [31] M. Cavinato, E. Fabrici, E. Gadioli, E. Gadioli Erba, P. Vergani, M. Crippa, G. Colombo, I. Redaelli, and M. Ripamonti, Phys. Rev C 52, 2577 (1995).
- [32] A. Gavron, Phys. Rev. C 21, 230 (1980).
- [33] R. L. Walter and P. P. Guss, Radiafron Effecfs, 95/1-4, 73 (1986).
- [34] L. McFadden, and G. R. Satchler, Nucl. Phys. 84, 177 (1966).
- [35] N. Rowley, G. R. Satchler and P. H. Stelson, Phys. A Lett. B 254, 25 (1991).
- [36] C. L. Jiang, B. B. Back, H. Esbensen, R. V. F. Janssens, and K. E. Rehm, Phys. Rev. C 73, 014613 (2006).
- [37] C. L. Jiang, B. B. Back, R. V. F. Janssens, and K. E. Rehm, Phys. Rev. C 75, 057604 (2007).
- [38] C. L. Jiang, K. E. Rehm, B. B. Back, and R. V. F. Janssens, Phys. Rev. C 79, 044601 (2009).
- [39] K. Hagino, N. Rowley, and A. T. Kruppa, Comput. Phys. Commun. 123, 143 (1999).
- [40] K. Hagino and S. Sakaguchi, Phys. Rev. C, 100, 064614 (2019).
- [41] C. Y. Wong, Phys. Rev. Lett. 31, 12 (1973).
- [42] A. Mukherjee, Subinit Roy, M.K. Pradhan, M. Saha Sarkar, P. Basu, B. Dasmahapatra, T. Bhattacharya, S. Bhattacharya, S.K. Basu, A. Chatterjee, V. Tripathi, S. Kailas, Phys. Lett. B 636, 91 (2006).
- [43] S. Raman, C. H. Malarkey, W. T. Milner, C. W. Nestor, Jr, and, P. H. Stelson, At. Data Nucl. Data Tables 36, 1 (1987).
- [44] A. Navin, A. Chatterjee, S. Kailas, A. Shrivastava, P. Singh, and S. S. Kapoor, Phys. Rev. C54, 767(1996).
- [45] A.M. Stefanini, G. Montagnoli, R. Silvestri, L. Corradi, S. Courtin, E. Fioretto, B. Guiot, F. Haas, D. Lebhertz, P. Mason, F. Scarlassara, S. Szilner, Phys. Lett. B 679, 95 (2009).
- [46] V. Tripathi, A. Navin, K. Mahata, K. Ramachandran, A. Chatterjee, and S. Kailas, Phys. Rev. Lett. 88, 17 (2002).
- [47] O. Akyüz and A. Winther, Proceedings of the International School of Physics "Enrico Fermi", Course LXXVII, edited by R. A. Broglia, R. A. Ricci, and C. H. Dasso (North-Holland,Amsterdam), p. 492 (1981).