The morpho-kinematical structure and chemical abundances of the complex planetary nebula NGC 1514
Abstract
We present high-resolution, long-slit optical spectra and images of the planetary nebula NGC 1514. The position velocity maps of the [O iii] emission line reveal complex kinematics with multiple structures. A morpho-kinematical analysis suggests an inner shell, originally spherical and now distorted by several bubbles, and an attached outer shell. The two well-defined, mid-infrared rings of NGC 1514 are not detected in our high-resolution, long-slit spectra, which prevented us from doing a kinematical analysis of them. Based exclusively on their morphology, we propose a barrel-like structure to explain the rings. Several ejection processes have been possibly involved in the formation of the nebula although a time sequence is difficult to establish with the current data. We also analyze intermediate-resolution, long-slit spectra with the goal of studying the physical parameters and chemical abundances of NGC 1514. The nebular spectra reveal a moderate-excitation nebula with weak emission lines of [Ar iii], [Ne iii], He i and He ii. No [N ii] neither other low-excitation emission lines are detected. We found an electron temperature around 14000 K in the gas and an electron density in the range of 2000 and 4000 cm-3.
keywords:
planetary nebulae: individual: NGC 1514 – ISM: kinematics and dynamics – ISM: abundances1 Introduction
Among the planetary nebula (PN) zoo one can find a great diversity of morphologies. In general terms, PNe were originally classified as round, elliptical, bipolar, and irregular. However, this is a very broad scheme and not all the PNe can be clearly classified in one of these groups. Observations at higher angular resolution of PNe have revealed more complex features and microstructures, which led to other morphological types like quadrupolar, multipolar and point-symmetric (see e.g., Manchado et al., 1996a, b). In addition, other structures like jets, knots, and rings are also identified in many PNe (see e.g. Miszalski et al., 2009b; Boffin et al., 2012; Guerrero & Miranda, 2012), which complicates enormously the classification and, therefore, the study of the physical processes that may be involved in their shaping. In addition, some PNe present different morphologies or structures when observed at different wavelengths (see e.g., Ramos-Larios et al., 2008).
NGC 1514 ( 04h 09m 169, +30∘ 46′ 33′′, equinox 2000.0) is a PN with a complex morphology that does not clearly fit in the “defined" morphological types. In the optical wavelength range, this nebula presents an irregular inner shell composed of several bubbles and a fainter attached outer shell. The nebula was classified as type II multiple-shell PN by Chu et al. (1987). Furthermore, a pair of axisymmetric rings contained within the outer shell, are only visible in the mid-infrared wavelengths (Ressler et al., 2010). In addition to this complex morphology, this PN is also interesting for its peculiar central source (BD+30∘623). It belongs to the small group of PNe with an absorption spectrum of a cool central star (spectral type A through K; Lutz, 1977; Méndez, 1978). These peculiar central stars should have a faint hot companion, which would be the responsible for the excitation of the PN. It is the case of BD+30∘623, with a typical A-type spectrum that shows signatures of a hot companion. The binarity of the central star has been further discussed in the literature (see Aller et al., 2015; Méndez et al., 2016, for a review of the issue) and BD+30∘623 was recently confirmed to be the widest binary central star to date, with an orbital period of 3300 days (Jones et al., 2017).
There is no doubt now that binary central stars play a key role in the formation of a remarkable number of PNe with non-spherical morphologies (see Boffin & Jones 2019 for an extensive review of the issue). In particular, the fraction of close binary central stars, i.e. those that have experienced the common envelope (CE) phase and have orbital periods between a few hours and several days, seem to represent at least 12 – 21% of the central stars of PNe, although this number may be a lower limit (Miszalski et al., 2009a). In addition, hydrodynamic simulations (see e.g., Theuns et al., 1996; Edgar et al., 2008) have demonstrated that also wide binaries can influence the shape of PNe via mass transfer by stellar winds. Nevertheless, just a few PNe hosting wide binaries have been discovered so far, mainly due to the large observational efforts required.
Since it was first discovered by William Herschel in 1790, NGC 1514 has been extensively studied to date. However, the unique spatio-kinematical analysis of NGC 1514 so far is that presented by Muthu & Anandarao (2003). They used an imaging Fabry-Pérot spectrometer and concluded that the nebula consists of three structures: an inner ellipsoidal shell, a faint outer shell, and polar bright blobs embedded inside the main shell that do not follow a bipolar morphology. However, the proposed model does not fully account for the structural complexity of NGC1514. In addition, Muthu & Anandarao (2003) were unable to derive a systemic radial velocity for the nebula. High-resolution spectroscopy had not been used so far and it is really needed to fully understand all the components and structures presented in the nebula.
In this work, we present high-resolution, long-slit spectra and images of NGC 1514 which allow us to describe in detail the internal kinematics and morphology of the nebula. In addition, we also present intermediate-resolution, long-slit spectra with the aim of deriving their physical conditions and chemical abundances.
2 Observations
2.1 Optical imaging
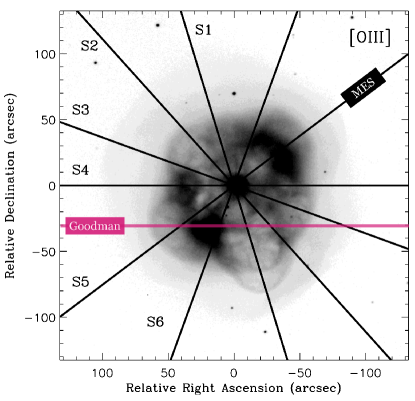
Figure 1 shows the narrow-band [O iii] image obtained on 2011 January 16 with the Calar Alto Faint Object Spectrograph (CAFOS) at the 2.2-m telescope on Calar Alto Observatory111Data here reported were acquired at Centro Astronómico Hispano Alemán (CAHA) at Calar Alto operated jointly by Instituto de Astrofísica de Andalucía (CSIC) and Max Planck Institut für Astronomie (MPG). Centro Astronómico Hispano en Andalucía is now operated by Instituto de Astrofísica de Andalucía and Junta de Andalucía. (Almería, Spain). A SITe 2k2k–CCD was used as detector, with a plate scale of 0.53 arcsec pixel-1 and a circular field of view of 16 arcmin in diameter. The total exposure time was 1900 s (1100 s + 3600 s) in [O iii] filter ( = 5007 Å, FWHM = 87 Å). An H image ( = 6563 Å, FWHM = 15 Å) was also obtained (1100 s + 3600 s) during the same observing run. The H image does not present significant differences with the [O iii] one and is not shown here. The seeing was 1.5 arcsec. The images were reduced following standard procedures for direct images within the iraf and midas packages.
As can be seen in Figure 1, NGC 1514 presents a very complex morphology with a main shell composed of several bubbles and features. In addition, a diffuse attached shell, that will be referred hereafter as outer shell, is also recognized in the image. All these structures along with the pair of infrared rings discovered by Ressler et al. (2010) will be analyzed in detail in Sections 3 and 4.
2.2 High-resolution optical spectra
High-resolution, long-slit spectra were obtained with the Manchester Echelle Spectrometer (MES, Meaburn et al., 2003) at the 2.1 m telescope on San Pedro Mártir Observatory (OAN-SPM)222The Observatorio Astronómico Nacional at the Sierra de San Pedro Mártir (OAN-SPM) is operated by the Instituto de Astronomía of the Universidad Nacional Autónoma de México. during two observing runs: one on 2012 November 26-27 and the other on 2014 October 12-13. A 2k2k Marconi CCD was used as detector in 44 binning mode (0.702 arcsec pixel-1). A = 50 Å filter was used to isolate the [O iii] emission line (114th order), with a dispersion of 0.08 pixel-1. The slit (6′ long, 2′′ wide) was centered on the central star and spectra were obtained at six position angles (PAs): 17∘, 42∘, 70∘, 90∘, -53∘, and -20∘. These slits (denoted S1, S2, S3, S4, S5, and S6, respectively) are superimposed on the [O iii] image in Fig. 1. Exposure time was 1200 s for the S1, S2 and S6 spectra and 1800 s for S3, S4, and S5. A Th-Ar lamp was used for wavelength calibration to an accuracy of 1 km s-1. The resulting spectral resolution (FWHM) is 12 km s-1. Seeing was 2′′ during the observations.
The spectra were cleaned of cosmic rays, de-biased, and wavelength calibrated using standard routines for long-slit spectroscopy within the iraf and midas packages.
2.3 Intermediate-resolution optical spectra
Intermediate-resolution, long-slit spectra were obtained on 2017 December 28 with the Goodman High Throughput Spectrograph (Clemens et al., 2004) mounted on the 4.1m Southern Astrophysical Research (SOAR) Telescope333Based on observations obtained at the Southern Astrophysical Research (SOAR) telescope, which is a joint project of the Ministério da Ciência, Tecnologia, Inovações e Comunicações (MCTIC) do Brasil, the U.S. National Optical Astronomy Observatory (NOAO), the University of North Carolina at Chapel Hill (UNC), and Michigan State University (MSU)., located on Cerro Pachón (Chile). We used the Red Camera equipped with a 40964112 pixel, back-illuminated, e2v 231-84 CCD. We used a 600 lines mm-1 dispersion grating, giving a dispersion of 0.65 pixel-1, and covering the 3500–6160 and 6300–8930 spectral ranges in the Blue and Red mode, respectively. The resulting spectral resolution is 4 . Two spectra were obtained with the Blue mode, with exposures times of 300 s and 900 s, and three in the Red one, with 300 s each; all of them with the slit at PA 90∘ and at 30 arcsec southern of the central star. The slit width was 1 arcsec and seeing was 0.8 arcsec during the observations.
The spectra were reduced following standard procedures for long-slit spectroscopy within the iraf packages. The reduction included bias subtraction and flat-field correction. Then, the spectra were wavelength calibrated, sky subtracted and, finally, flux calibrated.

3 Spatio-kinematical analysis
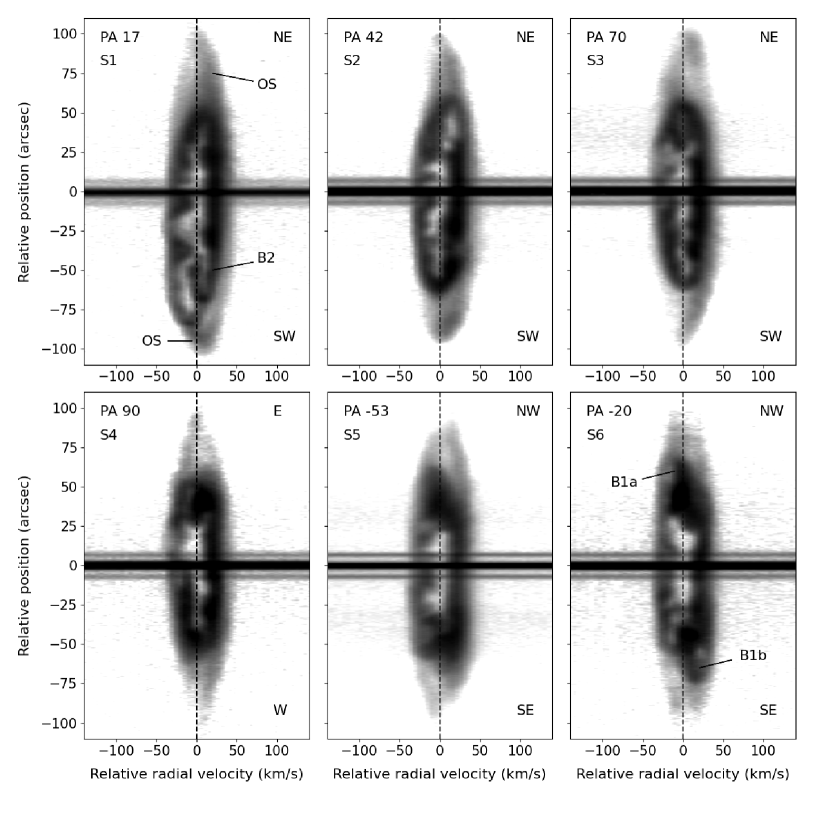
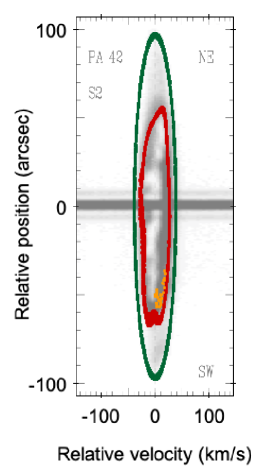
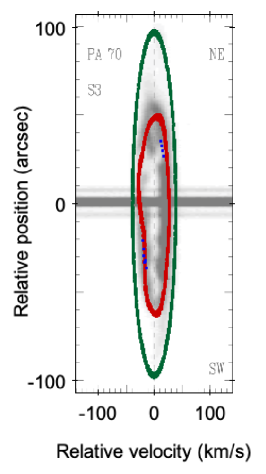
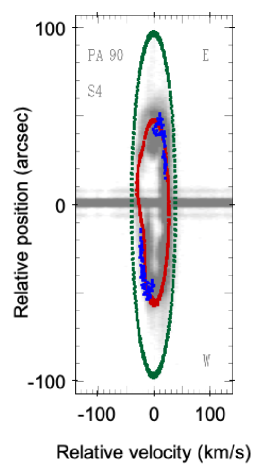
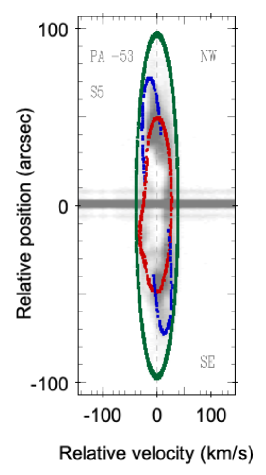
Figure 2 shows position-velocity (PV) maps of the [O iii] emission line at the six observed PAs. These PV maps allow us to reconstruct the true structure of the nebula and to impose some constraints on the shaping processes of NGC 1514.
From the velocity centroid of the line emission features at all PAs we derive a heliocentric systemic velocity of . Previous measurements of the systemic velocity of NGC 1514 range from 41.55.5 km s-1 to 91.09.0 km s-1 (see Schneider et al., 1983, and references therein). However, none of these measurements were derived from high resolution spectra, so an accurate value had not been determined so far. For the first time, we present a reliable value for the systemic velocity, which is also in a relatively good agreement with the systemic velocity of the binary central star system (48.70.5 km s-1, Jones et al., 2017). Internal radial velocities will be quoted hereafter with respect to the systemic velocity derived in the present work. The origin of radial velocities in the PV maps is the systemic velocity and the origin for projected angular distances is the position of the central star, as given by the intensity peak of the stellar continuum that is detected in all long-slit spectra.
The PV maps present very complex kinematics that are described in the following paragraphs.
At a first look, the PV map at S1 shows a velocity ellipse with additional complex features inside. It is clearly asymmetrical in size with respect to the stellar position, extending up to 50 towards the north-east (NE) and 82 towards the south-west (SW), fitting very well the size of the nebula along this PA (see Fig. 1). The velocity ellipse is slightly tilted with the northeastern part moving away from the observer and the southwestern part approaching to the observer. In addition, the image shows two bubbles in the SW part of the nebula, that are also recognized in the PV map, revealing that they are, indeed, two different structures with different kinematics. The smaller one, with the tip at 66 ″south of the stellar position, is redshifted, whereas the bigger one is blueshifted, with its vertex at ″south the stellar position and coinciding with the end of the velocity ellipse. Inside the velocity ellipse, some bright features are also observed in the blueshifted part of the spectrum, much more noticeable towards the SW, with a wide distribution of velocities (from almost the systemic velocity up to the maximum radial velocity). These bright features coincide with “clumps” observed in the image (see Fig. 1). This could suggest that in these regions the inner shell is not completely empty but there is a concentration of material in these areas. Beyond the velocity ellipse, faint extended emission is also visible up to 100 approximately, being probably another velocity ellipse which corresponds to the faint outer shell observed in the image. This more diffuse velocity ellipse, which is visible in all the PV maps, appears slightly redshifted at the southwestern tip in the PV map at S1. However, the velocity ellipse seems to be centered at the systemic velocity in the rest of the PV maps.
The PV maps at S2 and S3 show similar features to each other. They both show a velocity ellipse of a size similar to the inner shell seen in Fig. 1. At S2, the velocity ellipse is tilted in the same way as the PV map at S1 (with the NE towards red and the SW towards blue), whereas the tips of the ellipse in S3 seem to be very close to the systemic velocity. In the case of S3, an arc-like feature is also identified in the NE. Finally, as in the case of the PV map at S1, a second and fainter velocity ellipse is marginally detected beyond the main one in both PV maps, corresponding to the outer shell.
The appearance of PV map at S4 is slightly different from the previous ones. In this case, the velocity ellipse appears to have a flattened shape in the tips. In addition, the main characteristic is that a protrusion is clearly visible in the blueshifted part of the spectrum (specially prominent to the east of the stellar position). This “bump” would indicate the presence of a possible bubble in the direction of our line of sight that it is not recognized in the optical image.
Finally, the PV maps at S5 and S6 present similar characteristics to each other, somewhat differing from the rest of the PAs. In these PV maps, the velocity ellipse appears disrupted, specially at the tips. The extremes of S5 clearly includes the line split corresponding to the bubbles seen in the image (that we will name structures B1a and B1b in Sect. 4). These bubbles are also identified in the PV map at S6, although they are not so clear since in this case the slit is only grazing the bubbles on their edges.
All the PV maps reveal that the emission is considerably stronger in the redshifted part of the nebula than in the blueshifted one, which may suggest interaction with the interstellar medium.
| Name | Structure | Radius1 | PA (°) | (°) | Notes | |
|---|---|---|---|---|---|---|
| (arcsec) | ( km s-1) | |||||
| B1a | Bubble 1a | 78 | 63 | 42 | Aligned to S5; NW bubble. | |
| B1b | Bubble 1b | 78 | +127 | 117 | 42 | Aligned to S5; SE bubble. |
| B2 | Bubble 2 | 68 | +127 | 71 | 39 | Aligned to S1; SW small bubble. |
| OS | Outer Shell | 98 | 0 | 0 | 39 | Spherical shell. |
| IS | Inner Shell2 | 48 | 0 | 0 | 26 | Irregular shell (originally spherical). |
1The number corresponds to the distance from the central star to the tip of the structure.
2The radius corresponds to that of the original sphere and to its expansion velocity. This sphere is distorted
by some ‘bumps’.
4 Kinematical reconstruction
4.1 Ionized nebula
To try to understand the multiple components observed in the PV maps, we used the software shape (Steffen et al., 2011), a three-dimensional modeling tool, in order to reproduce the main morphological structures and substructures in NGC 1514. This software allows us to propose structures, assign them a velocity law, and vary their parameters to adjust both the image and the spectra (PV maps), interactively.
We start with two spheres, one of them represents the faint outer shell of the nebula, whereas the other one corresponds to the inner shell. This last structure was distorted by some modifiers called “bumps” that make a protuberance that can be controlled with some parameters related to size and the direction of the protrusion. Three other structures were modeled as the tips of ellipsoidal shells, given the morphology seen in the images, but such structures are used as auxiliary tools to fit images and spectra.
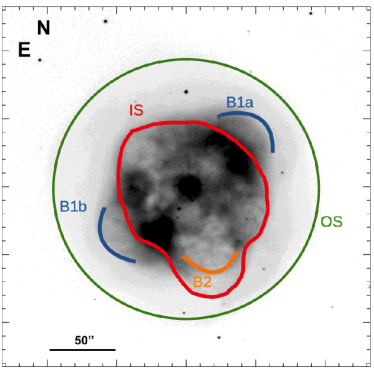
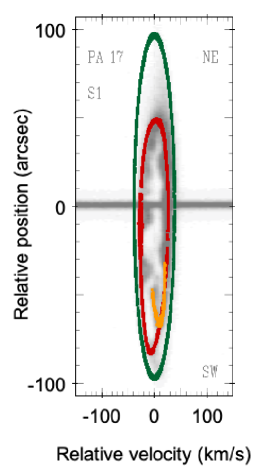
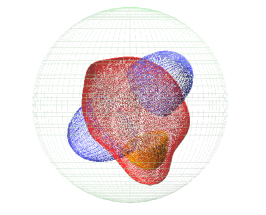
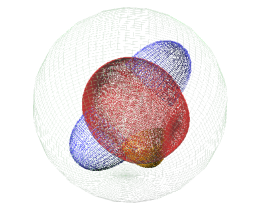
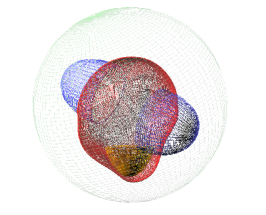
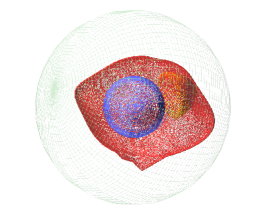
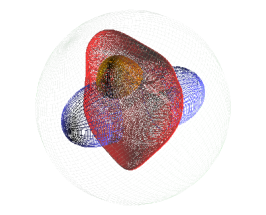
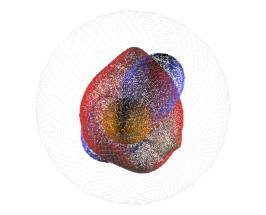
A sketch based on the final shape model is shown in Figure 3, and main parameters of the structures are listed in Table LABEL:parameters. Figure 4 shows a comparison between the observed PV-maps of NGC 1514 and the synthetic PV-maps generated in shape and in Fig 5 the different structures of the shape model are seen at different viewing angles. The main structures that fit image and PV diagrams are described, namely:
Outer Shell (OS). Although there is a tentative ellipticity from the PV map at S1, the evidence is not significant and the ellipticity would be very low. Therefore, this does not make a substantial difference with respect to the spherical model we propose for the outer shell. This structure expands radially at 39 km s-1, following a velocity law of , being the angular radius in arcsec.
Inner Shell (IS): A distorted (although originally spherical) shell forms the main structure of the nebula. Expansion velocity of the original spherical shell was found as 26 km s-1, which is in good agreement with previous determinations (Sabbadin & Hamzaoglu, 1982; Muthu & Anandarao, 2003). We needed up to seven “bump” modifiers to model protrusions and cavities and thus distorting the original shell. The assumed velocity law for this shell is , the same as for the bubbles (structures B1a,b and B2; see below). This velocity law allows us to reproduce very well both high-resolution spectra and images.
Bubbles 1 (B1a, B1b): Two bubbles are mostly symmetrically located in the nebula and they were modeled as the polar regions of a prolate ellipsoid. The NW (SE) bubble is labeled as B1a (B1b), and is located at PA (127°) with an inclination angle of (; with respect to the plane of the sky), being therefore blueshifted (redshifted). The deprojected polar velocity of these bubbles is km s-1.
Bubble 2: Another bubble was modeled as the SW region, aligned at the same PA as one of the bumps (), but with different kinematics. Deprojected polar velocity of this structure was km s-1.
The equatorial expansion velocity and radius of the different structures (see Table LABEL:parameters), along with the distance of 4544 pc from the (GEDR3; Gaia Collaboration et al., 2020), yield a kinematical ages (assuming homologous expansion, i.e., velocity proportional to radius) of, approximately, 5410 yr (OS), 4000 yr (B1a, B1b), 3750 yr (B2) and 3970 yr (IS). All these estimates have uncertainties of yr. This would mean that IS, B1 and B2 are, indeed, coeval estructures, as already expected having all of them the same velocity law. However, this result has to be taken with caution since, although it is true that the spherical shell model with bubbles seems to be appropriate, it is not possible to fully constrain the velocity law for each individual structure (or even to be sure that there is a unique velocity law for each structure), existing therefore a possible degeneracy. This is a usual problem in morpho-kinematical analysis. For this reason, in spite of the similar kinematical ages derived above, we propose in Section 5 different scenarios that may explain the formation of the bubbles and the other structures.
4.2 Rings model
As expected, there is no evidence of the mid-infrared rings of NGC 1514 in our high-resolution optical spectra. If present, they have to be extremely faint. This is consistent with the conclusion by Ressler et al. (2010) that the nebula seems to contain a significant quantity of ionized gas while the rings do not. As already noted by Ressler et al. (2010), the rings of NGC 1514 closely resemble similar structures observed in other nebulae like the PN MyCn 18 (Clyne et al., 2014; Sahai et al., 1999) or the inner regions of the symbiotic nebula Hen 2-104 (also known as the Southern Crab; Santander-García et al., 2008). Both have confirmed binary systems in their nuclei which are most likely responsible for the ring-like structures around them. Similar ring-like structures are seen in Abell 14 (Akras et al., 2016) although, in this case, the binarity of the central source has been proposed but not confirmed yet (Akras et al., 2020). Finally, the rings of NGC 1514 are also comparable to the structures present in SN1987A (Martin & Arnett, 1995; Sugerman et al., 2005). All of the mentioned examples are visible at optical wavelengths, unlike the rings detected in NGC 1514, which are only seen in the infrared. In most of these cases, the basic structure to describe the rings is a sort of hourglass with a tight waist and open rims.
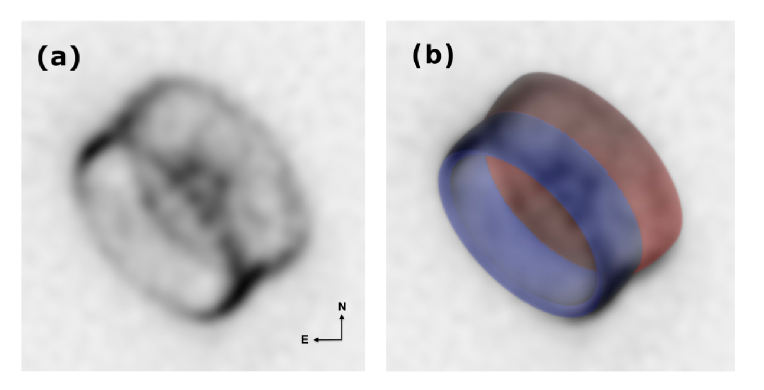
With this in mind, we attempted to reproduce the rings seen in NGC 1514 by using shape. This is certainly challenging since we do not have information about the kinematics of the rings, a key point to constrain their morphology and inclination. Fig. 6a shows the result of applying a deconvolution process (Masci & Fowler, 2009) to the WISE W4 image (named as W4decon), where the rings are clearly recognized. As it can be seen in this image, the two ellipses formed by the rings are slightly different (with equal semi-major axis but different semi-minor axis). Therefore, if we assume that such ellipses are the two borders of an open bipolar outflow (we can think, for example, in a diabolo-like structure), the difference in size could be interpreted as a different inclination angle for one outflow respect to the other. This is certainly plausible but we could more easily reproduce the rings with a simpler geometry using a barrel-shaped structure with a pinched waist (or, similarly, a diabolo with a broader waist) and with its axis at =28∘, as illustrated in Fig. 6b. In this geometry, we do not need to invoke different orientations for the outflows, since the east part of the NW outflow would correspond indeed to the waist of the barrel-like structure. In addition, the NE and SW brightest regions of the rings are quite well explained with this structure instead of a pure diabolo model. Given the lack of kinematic information of the barrel-like structure, its orientation can not be easily interpreted, being the one showed in Fig. 6b (with the SE outflow to the blue and the NW outflow to the red) just one possibility.
5 Possible formation scenarios
The different structures seen in the the PV maps of NGC 1514 would indicate that several ejection processes may have been involved in the formation of the nebula. However, this would apparently clash with the kinematical ages derived for the inner shell and the bubbles (see Sect 4). Nevertheless, and as mentioned before, to constrain the velocity law of each structure is definitively a really difficult task, leading to a possible degeneracy. Therefore, we only propose here several scenarios that could have happened during the mass ejection.
We can presume that the outer shell was the first structure to be formed, and may represent the spherical AGB wind from the star progenitor. Then, the dusty rings might have formed although, without their kinematical information, it is really difficult to put constraints on their formation (indeed, they could have even preceded the formation of the ionized nebula). A bipolar outflow would have sculpted the bubbles B1a and B1b. Finally, a subsequent spherical ejection could have formed the distorted inner shell. The visible deformation of this shell could be consequence of the interaction of the fast isotropic wind with the material of inhomogeneous density already present in the nebula. In this scenario, the wind is able to go through the low density regions of the nebula but is blocked by the high density regions, deforming the initial structure and forming the bubbles we see in the image (see Steffen et al., 2013). Another possibility is that the inner (originally spherical) shell would have been formed after the outer shell and the dusty rings. Later, the ejection of a bipolar outflow (B1a and B1b) would have deformed the inner shell.
As already mentioned, the nucleus of NGC 1514 is a long-period ( 9 years) binary system with an eccentricity of 0.5 (Jones et al., 2017). The influence of such wide binaries in PN morphologies is still uncertain (mainly due to the few PNe known to host long-period binaries, a consequence of the observational difficulties). In fact, hydrodynamical simulations show that the mass-transfer from an Asymptotic Giant Branch (AGB) star to its wide companion could also play a role in the shaping process of the nebula (see e.g., Theuns et al., 1996; Edgar et al., 2008). In the case of NGC 1514, the highly aspherical shape and, more importantly, the presence of the pair infrared rings could be evidence of the impact of the binary central star on the formation of the nebula.
In this context, we have investigated the scenario in which the complex morphology (and particularly the rings) may be the result of asymmetries in the mass-loss process of the primary star when the binary system was on a (hypothetical) shorter orbital period. If in this shorter orbit both components did not interact, then as a result of the mass-loss of the primary, the orbit could have increased. In order to numerically evaluate this scenario, we have calculated the initial separation of the binary system from the current separation ( 20 au, being the semi-major axis) and assuming the masses of both stars published in Jones et al. (2017). With these numbers, we derived an initial separation of 3 au (Villaver & Livio, 2007). We can in principle exclude the CE interaction on the basis of the current period of the system ( 3300 days), since the final period of a CE interaction would have been at least an order of magnitude shorter than the current period of the system and it is hard to conceive an CE interaction the result of which is a system with the eccentricity observed in the binary pair of NGC 1514. However, even without undergoing a CE evolution, with an initial separation of 3 au the system could still suffer significant interaction and mass transfer via, for example, wind Roche lobe overflow (Theuns et al., 1996), which allows high accretion rates. Indeed, some interaction mechanism like this is needed, since single models do not succeed in keeping the necessary surface rotational velocity for magnetic mechanisms to operate and create bipolar morphologies (García-Segura et al., 2016).
Due to the relatively high eccentricity of the system, another possibility for the formation of the rings is that they were triggered by a periastron passage of the companion. This may be a plausible scenario if we take into account the numbers reported in Boffin & Jones (2019) for this to occur. Unfortunately, the lack of kinematic information about the rings, prevents us to properly evaluate this scenario as done, for example, in Kashi & Soker (2010) for Eta Carinae.
Finally, it is worthy to mention that the complex morphology of the nebula also lead Bear & Soker (2017) to propose NGC 1514 as one of the PNe shaped by a triple central star, although we do not have any evidence that supports such idea.
6 Physical conditions and chemical abundances
For the analysis of the physical parameters and chemical abundances we used the Goodman spectrum. The position of the Goodman slit, at 30 arcsec south from the central star, is shown in Figure 1 (pink line). We have analyzed a region of 193.7 arcsec containing the whole nebula (including the outer shell). In addition, we have also extracted separately the outer shell region (by adding both west and east parts) to check for the contribution of this outer shell to the inner one, and found that only H, H and [O iii]4959,5007 are presented, as well as a very faint He ii 5876 emission line in the west part of it. These lines only represent the 5% of the total flux measured on the whole nebula (see below). Other small regions along the inner shell were also extracted, checking that the line intensity ratios and physical conditions were similar to those found for the whole region. Therefore, we will only describe the results obtained from the whole region in the following.
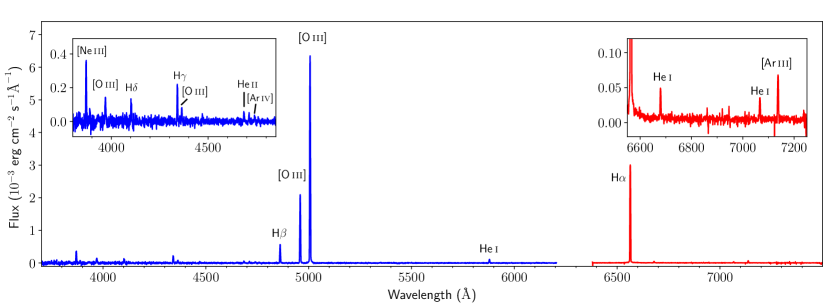
Figure 7 shows the intermediate-resolution, long-slit spectra of NGC 1514 in the whole region. Apart from the strong H, H, and [O iii]4959,5007 emission lines, we can identify other faint nebular emissions, like [Ar iii], [Ne iii], and He i emission lines. Also, we identify a very faint He ii 4686 emission line, suggesting moderate excitation. Although the lack of a deeper and high-resolution, long-slit spectrum prevents us from making a complete and detailed chemical analysis of the nebula, we can extract some conclusions from the present spectra.
We used the nebular software Anneb (Olguín et al., 2011) to compute the physical and chemical conditions of NGC 1514. Anneb integrates the nebular package of iraf/stsdas (Shaw & Dufour, 1995). The nebular version used is the one contained in iraf 2.16. From the fluxes of the identified emission lines in the spectrum, Anneb calculates the logarithmic extinction coefficient (H) and both the electron temperature () and density () in an iterative way. It starts by assuming a case B recombination (=104 K, =103 cm-3) and a theoretical H/H ratio of 2.85 (Osterbrock & Ferland, 2006) as a first step. After convergence, it derives the dereddened line intensities and recalculates the final values of (H), , and again (from different intensity ratios). Several extinction laws can be used in Anneb and a proper error propagation is performed.
For the calculations of , the most used emission lines ratios are [S ii]6716/6731 and [O ii]3729/3726. However, the lack of these emission lines in the spectrum of NGC 1514 prevents us from deriving from those ratios. For that reason, we have used the [Ar iv]4711/4740 ratio, also used for the calculation of . But we have to take with caution this ratio since the [Ar iv]4711 emission line is blended with the He i 4713 line in our spectrum, so we have estimated the contribution of the He i 4713 line in the observed fluxed and corrected this contribution according to the ratio (4713)/(4471)=0.154 (Benjamin et al., 1999).
| Line | Iλ | |
| [Ne iii] 3869 | 0.223 | 102 16 |
| He i H8 3889 | 0.219 | 19.0 6.8 |
| H [Ne iii] 3970 | 0.202 | 48 11 |
| H 4101 | 0.171 | 31.2 7.6 |
| H 4340 | 0.129 | 51.4 6.9 |
| [O iii] 4363 | 0.124 | 19.6 4.2 |
| He i 4471 | 0.096 | 5.5 2.3 |
| He ii 4686 | 0.042 | 12.5 2.7 |
| He i [Ar iv] 4711 | 0.036 | 8.2 2.0 |
| [Ar iv] 4740 | 6.6 2.8 | |
| H 4861 | 0.000 | 100.0 6.8 |
| [O iii] 4959 | 355 19 | |
| [O iii] 5007 | 1064 54 | |
| He i 5876 | 12.7 1.5 | |
| H 6563 | 280 20 | |
| He i 6678 | 3.59 0.63 | |
| He i 7065 | 2.43 0.50 | |
| [Ar iii] 7136 | 4.97 0.72 | |
| logHβ(erg cm-2 s-1) | 0.021 | |
| (H) | 0.876 0.067 | |
| ([O iii]) () | 14800 2200 | |
| ([Ar iv])a (cm-3) | 3200 1100 |
a For the calculation of from the [Ar iv]4711/4740 intensity ratio, we have estimated and subtracted the contribution of He i 4713 to the observed [Ar iv] 4711 emission line (see the text).
Table LABEL:fig:emission_lines lists the emission line intensities and their Poissonian errors. The emission line fluxes have been dereddened with the corresponding derived (H) (see bottom part of the table) and the extinction law () of Seaton (1979). and are also included in the table. Neither nor shows substantial fluctuations along the nebula. is in agreement with that derived from other authors previously (Manchado et al., 1989; Milanova & Kholtygin, 2009). In contrast, our derived electron density is much higher than that previously reported by Kohoutek (1967), who obtained = 290 cm-3 for the inner shell based on the H flux and assuming a spherical shell with a uniform distribution of radiating matter. Likewise, Ressler et al. (2010) inferred an electron density below 103 cm-3 based on the [S iii] 18.7/33.5 m line ratio, also considerably lower than our result.
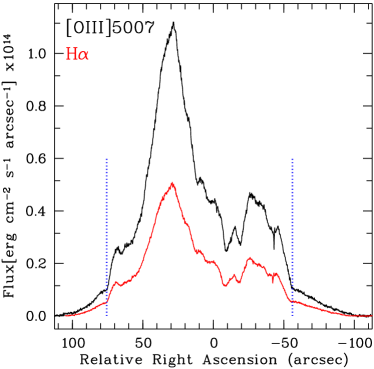
From the outer shell spectrum we derived a mean (H)0.85, similar to the whole nebula (see Table LABEL:fig:emission_lines) although it is slightly larger (0.98) in the west part than in the east one (0.72). Fig. 8 shows the surface brightness profiles of the [O iii]5007 and H emission lines along the slit. It is noticeable that the outer shell brightness profile follows a roughly linear dependence with the angular distance, as expected from a type II multiple-shell PN with an attached shell (Chu et al., 1987; Guerrero et al., 1998). Due to the few emission lines detected in the outer shell, no physical conditions or chemical abundances can be derived for this region.
Ionic abundances of the whole nebula covered by our slit are listed in Table 3. For those ions with more than one line observed in the spectrum, the reported ionic abundance value was calculated as a weighted average using as weight the signal-to-noise ratio of the line. Obtaining the elemental abundances is not immediate, mainly due to the fact that not all the stages of ionization are seen for all the elements. Therefore, we only can provide a lower limit for most of the elements (argon, neon, and oxygen), since we only have one stage of ionization (two in the case of the argon, where abundance has been calculated as a sum of the individual ionic abundances of Ar2+ and Ar3+). Finally, the helium abundance was calculated by using the method of Kwitter & Henry (2001). The results are listed in Table 3. The values obtained are in agreement with previous abundance determinations from other authors (Manchado et al., 1989; Costa et al., 2004; Stanghellini et al., 2006). In contrast to other previous authors (see, e.g., Milanova & Kholtygin, 2009; Manchado et al., 1989), we are not able to derive a nitrogen abundance.
Finally, for comparison purposes, we have also calculated the chemical abundances of NGC 1514 using the code PyNeb (v. 1.1.14; Luridiana et al., 2015). The obtained ionic and elemental abundances are listed in Table 3 and, as can be compared, all of them are in very good agreement with those obtained with Anneb. Regarding the physical conditions, similar values to those derived with Anneb are also obtained in PyNeb, being ([O iii]) = 145001500 K and ([Ar iv]) = 28001800 cm-3.
| Ratio | Abundance (Anneb) | Abundance (PyNeb) |
|---|---|---|
| He+/H+ | (8.410.92) | (7.82.1) |
| He2+/H+ | (1.010.22) | (1.080.25) |
| Ne2+/H+ | (2.680.41) | (2.91.5) |
| O2+/H+ | (1.1620.043) | (1.210.30) |
| Ar2+/H+ | (2.060.30) | (1.880.65) |
| Ar3+/H+ | (5.21.1) | (6.54.2) |
| He/H | 0.0940.010 | 0.089 0.021 |
| Ne/Ha | (2.680.41) | (2.91.5) |
| O/H a | (1.1620.043) | (1.210.30) |
| Ar/Hb | (7.9 1.2) | (8.384.3) |
a These are lower limits since they have been calculated with an only ionization state. b Argon abundance calculated as a sum of the individual ionic abundances of Ar2+ and Ar3+.
We would like to note that a deeper and higher resolution spectrum is required for doing a comprehensive and detailed chemical analysis both from the optical recombination lines and collisionally excited lines.
7 Conclusions
We present, for the first time, a detailed morpho-kinematical analysis of the complex planetary nebula NGC 1514 based on optical high-resolution, long-slit spectra. From the position-velocity (PV) maps and with the help of the software shape, we generated a 3D model of NGC 1514, which provides information on the main structural components as well as their kinematics. We propose an inner distorted shell (originally spherical) with some additional and well-defined bubbles (two of them mostly symmetrically located in the nebula) and an outer spherical attached shell. Except for this diffuse outer shell that was the first component to be ejected, the rest of the structures might follow the same velocity law and, therefore, the kinematical ages of those structures would be apparently the same.
The two large mid-infrared rings detected by Ressler et al. (2010) in the WISE images are not identified in our high-resolution spectra, which prevented us from doing a kinematical analysis of them. Nevertheless, in view of their resemblance to similar structures in other nebulae as, e.g., the PNe MyCn 18, Abell 14, or the symbiotic nebula Hen 2-104, we propose a barrel-like structure with an inclination of =28∘ (based only in the morphological information) to explain the rings.
Finally, we also present an analysis of the physical parameters and chemical abundances of the nebula by means of intermediate-resolution, long-slit spectra. The nebular spectra reveal a moderate-excitation nebula with emission lines of [Ar iii], [Ne iii], He i and He ii (and also weak [Ar iv]). An electron temperature of 15000 K and an electron density between 2000 and 4000 cm-3 have been obtained for the nebula, the latter being substantially higher than previously reported values.
Acknowledgements
We are very grateful to our referee, Martin A. Guerrero, for his valuable comments which have improved the presentation of the paper. Also, we would like to thank Eva Villaver and David Jones for the very useful discussion on the evolutionary status of the binary system. AA acknowledges support from Government of Comunidad Autónoma de Madrid (Spain) through postdoctoral grant ‘Atracción de Talento Investigador’ 2018-T2/TIC-11697 and support from FONDECYT through postdoctoral grant 3160364. R.V. acknowledges support from UNAM-PAPIIT IN106720, LFM acknowledges partial support by MCIU grant AYA2017-84390-C2-1-R, co-funded with FEDER funds, and financial support from the State Agency for Research of the Spanish MCIU through the “Center of Excellence Severo Ochoa" award for the Instituto de Astrofísica de Andalucía (SEV-2017-0709). The work of MER was carried out at the Jet Propulsion Laboratory, California Institute of Technology, under a contract with NASA. This research has made use of the SIMBAD database, operated at the CDS, Strasbourg (France), Aladin, NASA’s Astrophysics Data System Bibliographic Services. This research has made use of the Spanish Virtual Observatory (http://svo.cab.inta-csic.es) supported from the Spanish MINECO/FEDER through grant AyA2017-84089. This research has been partly funded by the Spanish State Research Agency (AEI) Project MDM-2017-0737 at Centro de Astrobiología (CSIC-INTA), Unidad de Excelencia María de Maeztu. Authors also acknowledge the Calar Alto Observatory for the service observations. Finally, authors also acknowledge support from OAN-SPM staff, in particular to Mr. Francisco Guillén for his assistance during night operations.
Data availability
The data underlying this article will be shared on reasonable request to the corresponding author.
References
- Akras et al. (2016) Akras S., Clyne N., Boumis P., Monteiro H., Gonçalves D. R., Redman M. P., Williams S., 2016, MNRAS, 457, 3409
- Akras et al. (2020) Akras S., Monteiro H., Aleman I., Farias M. A. F., May D., Pereira C. B., 2020, MNRAS, 493, 2238
- Aller et al. (2015) Aller A., Montesinos B., Miranda L. F., Solano E., Ulla A., 2015, MNRAS, 448, 2822
- Bear & Soker (2017) Bear E., Soker N., 2017, MNRAS, 468, 140
- Benjamin et al. (1999) Benjamin R. A., Skillman E. D., Smits D. P., 1999, ApJ, 514, 307
- Boffin & Jones (2019) Boffin H. M. J., Jones D., 2019, The Importance of Binaries in the Formation and Evolution of Planetary Nebulae, doi:10.1007/978-3-030-25059-1.
- Boffin et al. (2012) Boffin H. M. J., Miszalski B., Rauch T., Jones D., Corradi R. L. M., Napiwotzki R., Day-Jones A. C., Köppen J., 2012, Science, 338, 773
- Chu et al. (1987) Chu Y.-H., Jacoby G. H., Arendt R., 1987, ApJS, 64, 529
- Clemens et al. (2004) Clemens J. C., Crain J. A., Anderson R., 2004, in Moorwood A. F. M., Iye M., eds, Proc. SPIEVol. 5492, Ground-based Instrumentation for Astronomy. pp 331–340, doi:10.1117/12.550069
- Clyne et al. (2014) Clyne N., Redman M. P., Lloyd M., Matsuura M., Singh N., Meaburn J., 2014, A&A, 569, A50
- Costa et al. (2004) Costa R. D. D., Uchida M. M. M., Maciel W. J., 2004, A&A, 423, 199
- Edgar et al. (2008) Edgar R. G., Nordhaus J., Blackman E. G., Frank A., 2008, ApJ, 675, L101
- Gaia Collaboration et al. (2020) Gaia Collaboration Brown A. G. A., Vallenari A., Prusti T., de Bruijne J. H. J., Babusiaux C., Biermann M., 2020, arXiv e-prints, p. arXiv:2012.01533
- García-Segura et al. (2016) García-Segura G., Villaver E., Manchado A., Langer N., Yoon S. C., 2016, ApJ, 823, 142
- Guerrero & Miranda (2012) Guerrero M. A., Miranda L. F., 2012, A&A, 539, A47
- Guerrero et al. (1998) Guerrero M. A., Villaver E., Manchado A., 1998, ApJ, 507, 889
- Jones et al. (2017) Jones D., Van Winckel H., Aller A., Exter K., De Marco O., 2017, A&A, 600, L9
- Kashi & Soker (2010) Kashi A., Soker N., 2010, ApJ, 723, 602
- Kohoutek (1967) Kohoutek L., 1967, Bulletin of the Astronomical Institutes of Czechoslovakia, 18, 103
- Kwitter & Henry (2001) Kwitter K. B., Henry R. B. C., 2001, ApJ, 562, 804
- Luridiana et al. (2015) Luridiana V., Morisset C., Shaw R. A., 2015, A&A, 573, A42
- Lutz (1977) Lutz J. H., 1977, A&A, 60, 93
- Manchado et al. (1989) Manchado A., Mampaso A., Pottasch S. R., 1989, Ap&SS, 157, 23
- Manchado et al. (1996a) Manchado A., Guerrero M. A., Stanghellini L., Serra-Ricart M., 1996a, The IAC morphological catalog of northern Galactic planetary nebulae
- Manchado et al. (1996b) Manchado A., Stanghellini L., Guerrero M. A., 1996b, ApJ, 466, L95
- Martin & Arnett (1995) Martin C. L., Arnett D., 1995, ApJ, 447, 378
- Masci & Fowler (2009) Masci F. J., Fowler J. W., 2009, in Bohlender D. A., Durand D., Dowler P., eds, Astronomical Society of the Pacific Conference Series Vol. 411, Astronomical Data Analysis Software and Systems XVIII. p. 67 (arXiv:0812.4310)
- Meaburn et al. (2003) Meaburn J., López J. A., Gutiérrez L., Quiróz F., Murillo J. M., Valdéz J., Pedrayez M., 2003, Rev. Mex. Astron. Astrofis., 39, 185
- Méndez (1978) Méndez R. H., 1978, MNRAS, 185, 647
- Méndez et al. (2016) Méndez R. H., Kudritzki R.-P., Urbaneja M. A., 2016, ApJ, 829, 73
- Milanova & Kholtygin (2009) Milanova Y. V., Kholtygin A. F., 2009, Astronomy Letters, 35, 518
- Miszalski et al. (2009a) Miszalski B., Acker A., Moffat A. F. J., Parker Q. A., Udalski A., 2009a, A&A, 496, 813
- Miszalski et al. (2009b) Miszalski B., Acker A., Parker Q. A., Moffat A. F. J., 2009b, A&A, 505, 249
- Muthu & Anandarao (2003) Muthu C., Anandarao B. G., 2003, AJ, 126, 2963
- Olguín et al. (2011) Olguín L., Vázquez R., Contreras M. E., Jiménez M. Y., 2011, in Revista Mexicana de Astronomia y Astrofisica Conference Series. pp 193–193
- Osterbrock & Ferland (2006) Osterbrock D. E., Ferland G. J., 2006, Astrophysics of gaseous nebulae and active galactic nuclei
- Ramos-Larios et al. (2008) Ramos-Larios G., Guerrero M. A., Miranda L. F., 2008, AJ, 135, 1441
- Ressler et al. (2010) Ressler M. E., Cohen M., Wachter S., Hoard D. W., Mainzer A. K., Wright E. L., 2010, AJ, 140, 1882
- Sabbadin & Hamzaoglu (1982) Sabbadin F., Hamzaoglu E., 1982, A&A, 110, 105
- Sahai et al. (1999) Sahai R., et al., 1999, AJ, 118, 468
- Santander-García et al. (2008) Santander-García M., Corradi R. L. M., Mampaso A., Morisset C., Munari U., Schirmer M., Balick B., Livio M., 2008, A&A, 485, 117
- Schneider et al. (1983) Schneider S. E., Terzian Y., Purgathofer A., Perinotto M., 1983, ApJS, 52, 399
- Seaton (1979) Seaton M. J., 1979, MNRAS, 187, 73P
- Shaw & Dufour (1995) Shaw R. A., Dufour R. J., 1995, PASP, 107, 896
- Stanghellini et al. (2006) Stanghellini L., Guerrero M. A., Cunha K., Manchado A., Villaver E., 2006, ApJ, 651, 898
- Steffen et al. (2011) Steffen W., Koning N., Wenger S., Morisset C., Magnor M., 2011, IEEE Transactions on Visualization and Computer Graphics, Volume 17, Issue 4, p.454-465, 17, 454
- Steffen et al. (2013) Steffen W., Koning N., Esquivel A., García-Segura G., García-Díaz M. T., López J. A., Magnor M., 2013, MNRAS, 436, 470
- Sugerman et al. (2005) Sugerman B. E. K., Crotts A. P. S., Kunkel W. E., Heathcote S. R., Lawrence S. S., 2005, ApJS, 159, 60
- Theuns et al. (1996) Theuns T., Boffin H. M. J., Jorissen A., 1996, MNRAS, 280, 1264
- Villaver & Livio (2007) Villaver E., Livio M., 2007, ApJ, 661, 1192