Temperature Study of Rydberg Exciton Optical Properties in \ceCu2O
Abstract
Rydberg excitons in \ceCu2O can be an emergent platform for solid-state quantum information processing by utilizing the exaggerated properties of high-lying excited states within the material. To develop practical quantum systems, high-temperature operation is desirable. Here, we study the temperature-dependence of the yellow and green Rydberg exciton resonances in a thin \ceCu2O crystal via broad-band phonon-assisted absorption spectra between 4 K and 100 K. At 4 K, we can identify the principal quantum number yellow and green Rydberg exciton states, beyond which we are limited by the spectral resolution of standard absorption techniques. Above liquid nitrogen boiling temperature (80 K), the yellow and green Rydberg exciton states are readily captured and higher-temperature yellow Rydberg exciton optical properties still exhibit the standard scaling laws seen at low temperatures. This promising result lays the groundwork for a new route to build a high-temperature Rydberg quantum information processing architecture with solid-state \ceCu2O.
I Introduction
Rydberg atoms have been actively investigated for the purpose of building promising quantum information science and technologies based on their exaggerated optical properties stemming from high-lying excited states. These states typically have a large principal quantum number of 100, leading to stronger interaction strength and higher sensitivity to environmental effects like electric fields Saffman et al. (2010); Adams et al. (2019). One manifestation of these optical properties is the set of beautiful scaling laws of the binding energies, spectral linewidth, and oscillator strength with respect to principal quantum number . Similar to Rydberg atoms, Rydberg excitons refer to highly excited hydrogen-like quantum quasi-particles in solid-state systems. Their presence were seen in two solid-state systems: one is transitional dichalcogenide monolayers up to = 4 or 5 Chernikov et al. (2014); Stier et al. (2018), and the other is cuprous oxide, \ceCu2O. The previous record high of = 25 from the P-series yellow excitons in \ceCu2O, observed via high-resolution absorption spectroscopy at 1.2 K Kazimierczuk et al. (2014), was recently surpassed by an observation of = 28 at 760 mK Heckötter et al. (2020). Since 1952, when excitons in \ceCu2O were first observed Hayashi (1952); Hayashi and Katsuki (1952), the material has been at heart of both experimental and theoretical studies to explore fundamental physics and engineering applications Itoh and Narita (1975); Elliott (1957); Kubouchi et al. (2005); Yoshioka and Kuwata-Gonokami (2012); Snoke and Kavoulakis (2014); Forman et al. (1971); Olbrychski et al. (1975); Ito et al. (1998); Malerba et al. (2011). Dipole-forbidden 1S-para excitons in \ceCu2O are long-lived ( 300-500 ns for a high-purity sample) and have become a promising solid-state candidate to realize excitonic Bose-Einstein condensation (BEC) Snoke and Kavoulakis (2014). Bulk \ceCu2O has also been used to make low-cost photovoltaic cells to harness solar energy Abdu and Musa (2009); Malerba et al. (2011).
The recent observation of giant Rydberg excitons and their optical properties from the yellow P-excitons in a thin \ceCu2O crystal Kazimierczuk et al. (2014) has ignited new research activities including the exploration of a potential solid-state Rydberg system for quantum information processing Khazali et al. (2017); Heckötter et al. (2020); Ziemkiewicz (2020); Ziemkiewicz and Zielińska-Raczyńska (2020). Although the highest of the Rydberg exciton is only 28, comparatively lower than the typical 100 number of Rydberg atoms, at this lower principal quantum number Rydberg excitons exhibit compatible optical properties in terms of beautiful scaling laws similar to their atomic counterparts Kazimierczuk et al. (2014); Heckötter et al. (2017); Zielińska-Raczyńska et al. (2016); Schweiner et al. (2017); Heckötter et al. (2017); Kitamura et al. (2017); Schöne et al. (2017); Semina (2018); Stolz et al. (2018); Takahata and Naka (2018): a micron-sized average exciton radius, a huge Blockade volume ( 1000 m3) arising from a strong dipole-dipole interaction, and an increased lifetime of 1 ns, 1,500 times longer than the short lifetime of the 2P exciton state. J. Heckötter et al. thoroughly discussed the scaling law of the yellow excitons in \ceCu2O and their responses to electric and magnetic fields at temperatures lower than 2 K Heckötter et al. (2017); Takahata et al. provided a complete photoluminescence (PL) spectroscopy and spectroscopic analysis, including temperature dependence of the energy shift of P-series of the yellow excitons between 6 and 100 K Takahata and Naka (2018).
Indeed, Rydberg energies in \ceCu2O of 80 - 150 meV, one-fold larger than those of typical semiconductors (e.g. GaAs 4 meV), can stabilize excitons against a thermal environment at higher temperatures. Here, we measure the optical properties of both yellow and green Rydberg excitons over a range of temperatures (4 - 100 K) followed by careful analysis in order to examine practical uses of \ceCu2O Rydberg excitons at elevated temperatures in quantum applications. High-temperature operation is an attractive way to circumvent some of the technological barriers of other platforms, such as the necessity of dilution refrigeration in many solid-state quantum materials. Our analysis aims to cover a gap left in the research of this system, since Rydberg excitons in \ceCu2O have so far been predominantly studied at low temperatures of around 1.5 K or below.
According to our systematic and thorough analysis of Rydberg exciton resonances obtained at various temperatures above 4 K, we conclude that Rydberg excitons with 8 - 10 are stable enough to show exaggerated Rydberg properties which could be utilized for high-temperature quantum information processing. Ultimately, we seek for a scalable room-temperature (RT) solid-state system to build quantum hardware. As a promising RT material, quantum defects in diamond and SiC have been demonstrated as foundations for forming a qubit and favorable RT experimental results are reported Wrachtrup (2010); Weber et al. (2010); Bassett et al. (2019). However, successful coherent qubit operations of quantum defect qubits remain at low temperatures below 10 K, where the environmental thermal effect is reduced. In addition, the mutual interaction between quantum defects is natively weak. So far, there are currently no solid-state platforms capable of high-temperature operation for introducing long-range interaction. Hence, we envision that \ceCu2O Rydberg excitons can offer a novel quantum Rydberg architecture at above liquid-nitrogen temperature.
We organize our paper as follows: First, Sec. II summarizes the band structures of \ceCu2O to introduce the yellow and green exciton series followed by our experimental setup and measurement methods. We present our phonon-assisted absorption spectra and results from our extensive analysis in Sec. III. We examine the scaling law behavior (Sec. IV) and their temperature dependence (Sec. V) of both yellow and green excitons. Sec. VI discusses the comparison of Rydberg excitons with Rydberg atoms in terms of their optical properties and potential future quantum information processing applications.
II Band Structure and Experiments
II.1 Band Structure
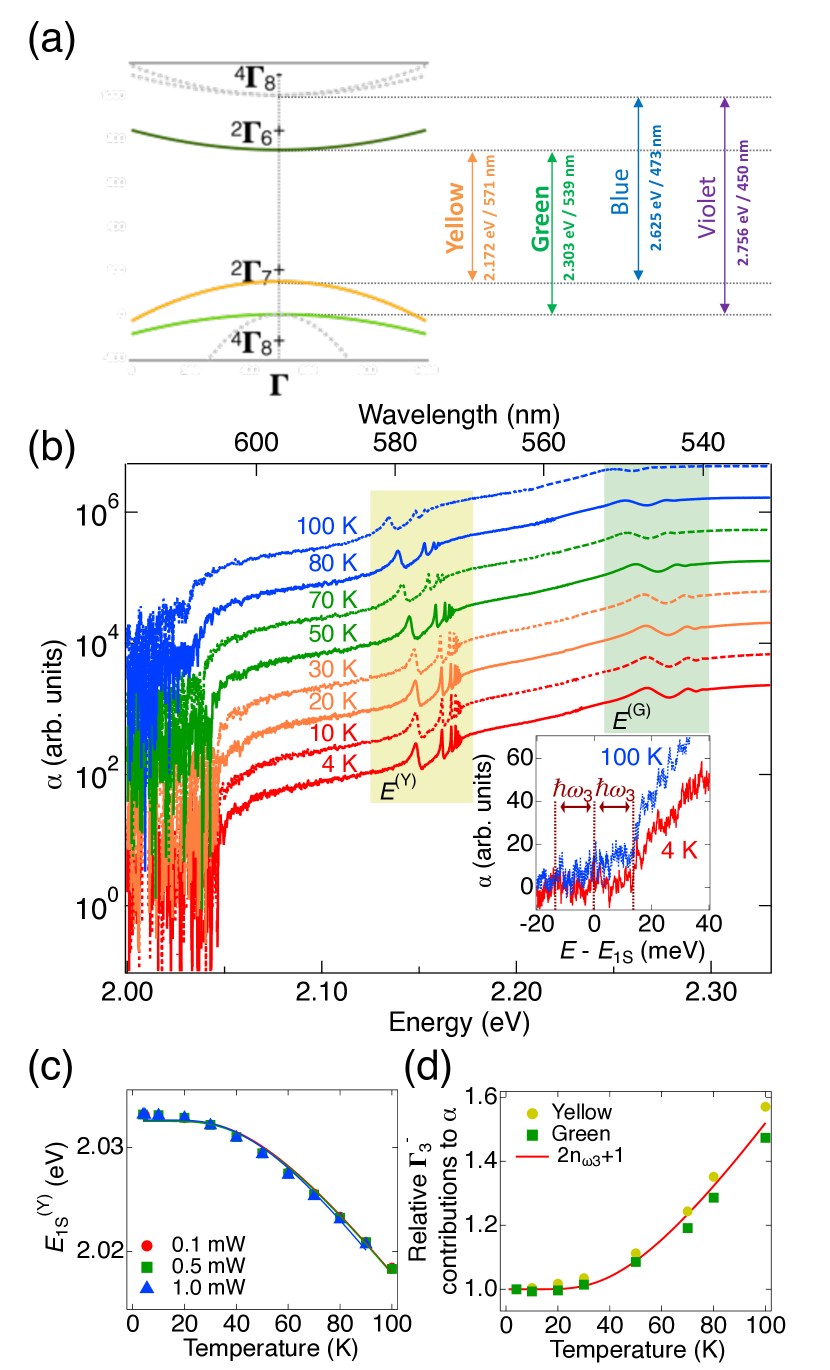
Cu2O crystal has a cubic structure with full octahedral symmetry, whose basic bandstructures are formed by Cu 3 and 4 electron orbitals. As can be seen in Fig. 1(a), there are two lowest conduction bands with symmetry of and two highest valence bands with Schöne et al. (2017). \ceCu2O is a direct bandgap semiconductor Kavoulakis et al. (1997), where the yellow or green exciton transitions occur in the visible wavelength range (530 - 580 nm) between the conduction band and or valence bands which are separated by a spin-orbit interaction energy of 131 meV. There also exist well-known higher-energy series, the so-called blue or violet excitons, between the conduction band and or valence bands, respectively. Due to the same parity of the envelope functions, the lowest 1S excitons in the yellow and green series are dipole-forbidden but quadrupole allowed, while the P excitons are dipole allowed. Consequently, the P-excitons of both series are optically accessible, appearing in standard absorption spectra, which led to the observation of the yellow P-excitons with high numbers of up to 28 Heckötter et al. (2020). This work focuses on both the yellow and green P-excitons.
II.2 Experimental Methods
Natural crystalline \ceCu2O from Namibia was cut and polished to be roughly 65 m-thick. We placed this thin \ceCu2O crystal in a strain-free sample holder inside a temperature controllable 4\ceHe cryostat, and we measured transmission spectra covering the yellow and green exciton series at varying temperatures (4 K 100 K). An incident light was shined and focused onto the surface of the sample, with a broad-band white light (Ando AQ-4303B, power density of 150 W/mm2) for the yellow excitons and a green light emitting diode for the green excitons.
We also took PL spectra with a green laser at 520 nm. In order to quantify physical parameters of exciton energies, binding energies, spectral linewidth, and oscillator strength, we collected and analyzed transmission signals with a monochromator (Princeton Instruments SP2750) whose focal length is 750 mm and spectral resolution is 80 eV, equivalent to 20 pm or 19.3 GHz. Following a standard procedure, we normalize the measured spectra to have zero-absorption at an energy of 2.03 eV (610 nm) that corresponds to the lowest energy of phonon-assisted absorption, effectively removing artificial loss like surface reflection and scattering. We obtain experimental absorption coefficient spectra () as a function of energy () at different temperatures () from the aforementioned transmission spectroscopy
by assuming the crystal thickness to be = 65 m.
III Absorption spectroscopy for Rydberg exciton series in Cu2O
III.1 Phonon-Assisted Absorption Spectra
Figure 1(b) plots at eight different temperatures, where each spectrum is vertically shifted for clarity. The overall primarily consists of the environmental broad S-exciton absorption , the exponential Urbach tail and dipole-allowed sharp P-exciton resonances both in yellow (, 570 - 580 nm) and green (, 530 - 550 nm) color regions.
III.1.1 Thermal-Phonon Dependence
First, the continuum part of is associated with the phonon scattering processes of 1S-ortho exciton, which follows the well-known Elliott’s formula, proportional to a quasi-square-root of the energy difference from the absorption origin energy, for example, 1S-exciton energy () within the second-order perturbation theory Elliott (1957). In \ceCu2O, phonon energy ( = 13.6 meV) is most significant among other symmetricity-allowed phonons such as ( = 82.1 meV) and minor phonons. The dominance of phonons is explicitly justified by two independent absorption and PL experimental results. The band edge of the absorption spectra at a particular temperature occurs exactly shifted by 13.6 meV (Fig. 1(b), inset). The phonon-associated 1S-ortho exciton PL peak also resides at the energy away from the 1S-ortho exciton PL peak by (Fig. 9 in Appendix C).
| Power (mW) | (meV) | (meV) | (K) |
|---|---|---|---|
| 0.1 | 2048.13 | 15.06 | 112.33 |
| 0.5 | 2047.93 | 14.86 | 111.01 |
| 1.0 | 2046.97 | 13.88 | 106.04 |
| average | 2047.68 0.62 | 14.60 0.63 | 109.79 3.32 |
As temperature () increases, the band edge, the P-exciton resonances in the absorption spectra and the phonon-assisted 1S-exciton peaks in the PL are all progressively red-shifted. The 1S-exciton energy , is plotted along in Fig. 1(c). This temperature dependence fits very well to the following equation (solid lines):
| (1) |
where , and are fitting coefficients. The fitting results from the PL data at three laser power values are in Table 1, which tells us that these power levels do not heat our sample above the cryostat temperature.
As expected, phonon contributions get stronger for higher temperatures, which is explicitly visible in Fig. 1(d). We evaluate them from the ratio of the absorption coefficient values at each temperature with respect to that of 4 K by integrating the spectra in the energy window ( eV) for the yellow and ( eV) for the green excitons. The data perfectly follows 2+1, the sum of both phonon creation and destruction processes neglecting the phonon-energy shift without any fitting parameters, where is the phonon density in the form of a Bose-Einstein distribution,
where is the Planck constant divided by 2 and is a Boltzmann constant. In addition to the continuum thermal phonon background, the P-exciton absorption spectra still contains an Urbach tail due to material quality near the band edge and distinctive sharp peaks at optical dipole resonance transitions. Figure 7 in Appendix A depicts major and minor phonon-assisted contributions to the broad background signal.
III.1.2 Rydberg Exciton Resonances
After subtracting the continuum thermal phonon background and Urbach tail, the remaining part of the P-exciton absorption spectra is series of distinctive sharp peaks attributed to optical dipole P-exciton resonance transitions. These multiple peaks form asymmetric Lorentzian shapes, which are well formulated by Toyozawa Toyozawa (1958):
| (2) |
| Color | (meV) | (meV) | (meV) | (meV) |
|---|---|---|---|---|
| Yellow | 2172.20 0.18 | -25.93 0.75 | 95.61 0.05 | 1.76 0.22 |
| Green | 2302.70 0.47 | -36.79 2.03 | 139.07 1.59 | -9.31 6.84 |
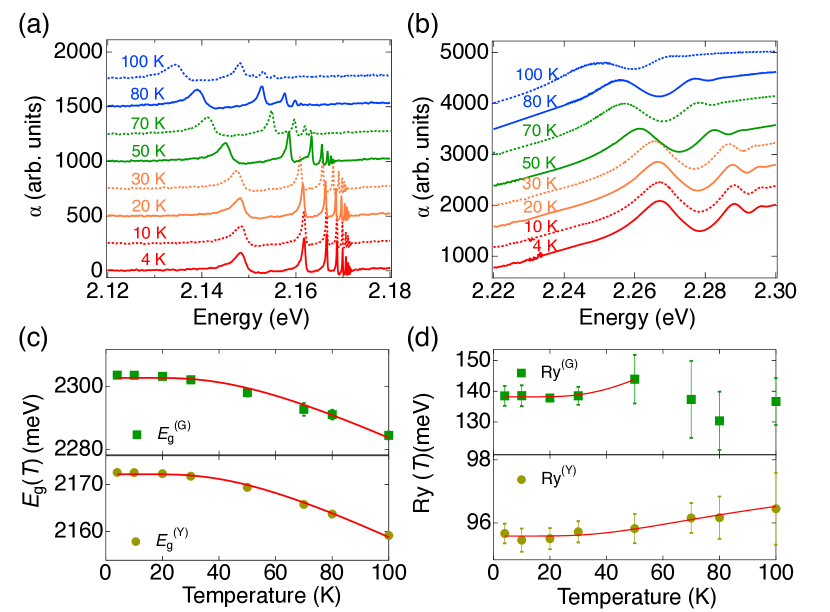
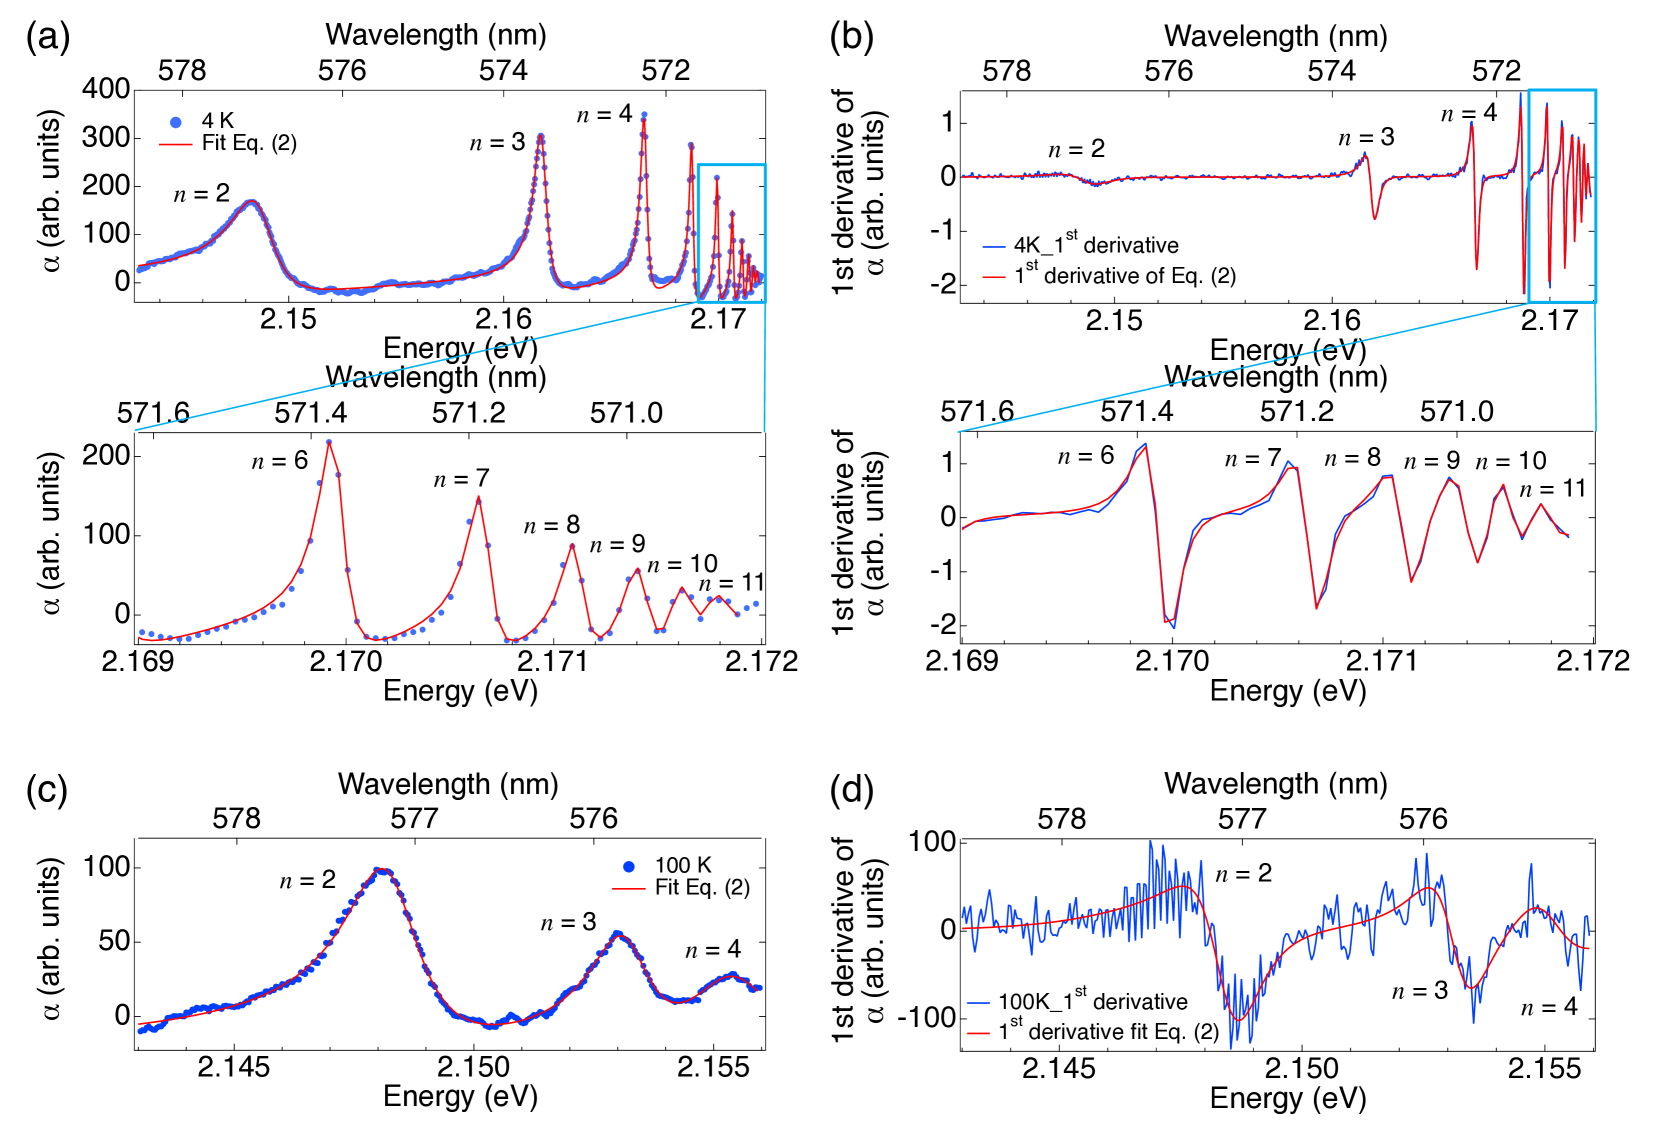
where is related to the oscillator strength that is computed from the absorption coefficient integrated over frequency, is the linewidth of the exciton resonant peak at the energy , and represents the degree to which the Lorentzian lineshape is asymmetric. The isolated yellow and green P-exciton resonance spectra at different temperatures are collected in Fig. 2(a) and 2(b), respectively. At 4 K, the highest = 11 of the yellow exciton resonant peak is clearly visible and stable, whereas the maximum of clear resonance peaks decreases down to = 5 at 100 K. Note that the maximum of the yellow exciton transitions observed in our low-temperature spectra (4 - 50 K) is limited by the spectral resolution of our monochromator (80 eV). The resolution-limited access to the highest Rydberg excitons can be overcome by the use of a narrow linewidth tunable laser. The upper bound of -th observable Rydberg exciton states can be found by thermal energy at finite temperatures. The maximum = 5 Rydberg exciton state at 100 K is reasonably close to where the binding energy of the yellow excitons is 90 meV.
On the other hand, the green P-exciton resonance peaks are still on top of a residual continuous broad background signal even after the subtraction of the major phonon-assisted continuum and Urbach tail. This implies that green P-excitons may be masked by other unknown absorption processes. We account for this remaining background spectrum by adding a constant offset term to our fitting. For more details on the background removal, see Appendix A. At all measurement temperatures, only = 2 - 4 green exciton peaks are observable, which was not due to our equipment resolution. Our result is consistent with other reports Itoh and Narita (1975); Schöne et al. (2017). We conjecture that the unobserved peaks with the higher numbered for green excitons below 50 K may be buried in the measurement noise and larger unknown phonon background absorption in our sample. This aspect needs to be further investigated in future.
The asymmetric Lorentzian-shaped peaks are fitted by Eq.(2) to extract various parameters: yellow and green exciton resonance energy , spectral full-width at half maximum (FWHM) linewidth , oscillator strength from , and asymmetry of the peaks . In Appendix C, we explain the details of our Toyozawa-formula fitting procedure to capture P-exciton peaks from spectra at the two extremes of our temperature measurement range (4 K and 100 K). Among these parameters, we first examine the yellow (Y) and green (G)-exciton band gap energy and the excitonic Rydberg energy . According to the hydrogen-like Rydberg energy states, the P-exciton resonance energy is written similar to the famous Rydberg formula for hydrogen with , , and Schöne et al. (2016),
| (3) |
where the quantum defect accounts for non-hydrogenic features that may arise from the complex valence band structures Schöne et al. (2016). Since the actual values of and are closely connected, for simplicity, we neglect the quantum defect () here and save the quantum defect analysis for Sec. III.
A straightforward fit of Eq.(3) with gives and for yellow and green series as a function of temperature plotted in Fig. 2(c) and 2(d), respectively. The red shift of by temperature increase is clearly observed in both excitons, whose tendency agrees with the 1S-ortho exciton energy measured from PL experiments (See Fig. 1(c)). The temperature-dependence of these parameters can be explained by Eliott’s theory similar to Itoh and Narita (1975):
| (4) |
where and are temperature-independent terms. The terms of and are associated with dominant -phonons. Under the assumption of -independence and = 13.6 meV, we obtain the fitting results of the Eq. 4 parameter values, which are summarized in Table 2. Our results are consistent with literature values taken at 4 K Itoh and Narita (1975); Gross (1956). Theoretically, the values of at 4 K are estimated by with effective exciton mass and dielectric constant = 7.5 from the hydrogen Rydberg constant Ry = 13.6 eV. Depending on the choice of the effective mass essentially from the band structure curvatures, ranges between 86 and 96 meV ( fluctuation) Zielińska-Raczyńska et al. (2016). Our value of 95.6 meV from hydrogen-like scaling laws falls within this range. Furthermore, Table 3 provides the several Ry values of \ceCu2O excitons chosen in the literature.
Comparing the two exciton series, green P-excitons have a temperature dependence term which is larger than the yellow exciton term by about 42%. Since both excitons are transiting from the same conduction band, the larger indicates that the splitting between two valence-bands grows as temperature rises. Temperature dependence of the Rydberg energy is expected to originate from the lattice constant change at different temperatures, consequently modifying the band gap energy and the dielectric constant. The exhibits a reasonable coincidence with that in Ref. Itoh and Narita (1975); however, the Ry values in green series are relatively insensitive to temperatures with large error bars probably due to the small number of accessible Rydberg states and broadness of the peaks, which may hinder the accurate evaluation of the temperature-effect.
IV Scaling Laws
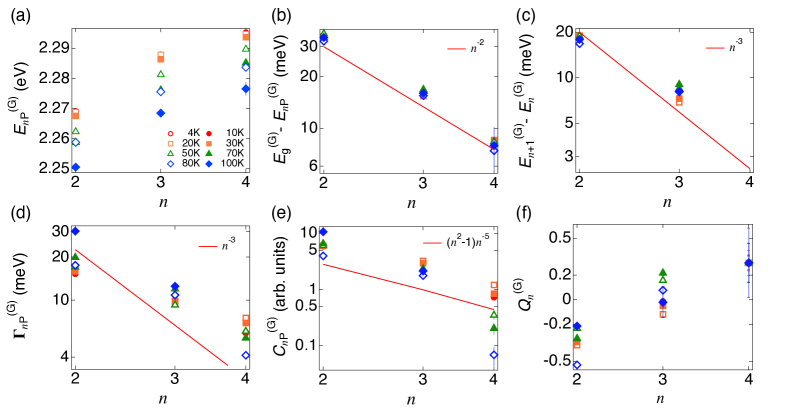
This section is devoted to investigate the scaling laws of the yellow and green Rydberg exciton optical properties in terms of at each temperature between 4 K to 100 K based on the Toyozawa’s asymmetric Lorentzian fitting analysis. Specifically, we examine four properties of -dependence : the P-exciton energies, the energy spacing between adjacent P-exciton states, the lifetime of the states from the spectral linewidth, and oscillator strength proportional to the amplitude of absorption coefficient. We also look at the asymmetry of Lorentzian shapes.
IV.1 Yellow Excitons
First, Rydberg-exciton resonance energies, , are plotted against in a linear scale (Fig. 3(a)). At a given temperature, as is increased, gets saturated towards the bandgap energy , which follows well with Eq. 3. The increase in temperature leads to the smaller values of (red-shift) closely related to the red-shift trend of in Fig. 2 (c). In order to observe the scaling behavior, we remove this temperature dependence by computing at all experimental temperatures. As can be seen in Fig. 3(b), this data is well fit by a single line, following the famous scaling behavior. The exponent of from our linear regression analysis with all experimental plots in a log scale is on average -2.039 0.014, with shading representing the uncertainty. Since we are able to detect the states of = 7 or 8 routinely above 50 K, we predict that the higher 10 Rydberg states may be captured by high-resolution spectroscopy above liquid-nitrogen temperatures.
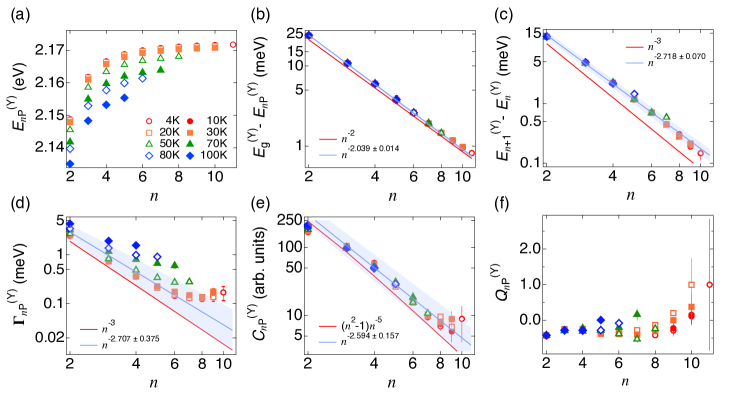
The energy difference between the two-adjacent exciton energy is expected to exhibit a universal power law of at each temperature from this simple derivation,
| (5) | ||||
The evaluated are included for yellow P-excitons plotted in Fig. 3(c). Again the data for all temperatures converges into one line, and the exponent value is -2.718 0.070 (with the uncertainty represented by shading) and the theoretical guide line with in red straight line (Fig. 3(c)). Our result matches well with the theory within a deviation of .
The next Rydberg property we examine is the FWHM, , which is expected to have the dependence of Toyozawa (1958). Figure 3(d) collects experimental , where we notice two different regimes. For low temperatures below 30 K, decreases along the line below = 8 but pinned around 100 eV above = 8. This saturation results from the convolution of the exciton resonance and our monochromator spectral transfer function, whose minimum spectral resolution is 80 eV. On the other hand, the increase of temperature over 30 K causes the departure from the trend for even lower states () owing to the thermal broadening. The average value of the power exponent is -2.707, which is not significantly deviated from -3, but the standard deviation is noticeably bigger due to the aforementioned reasons. Furthermore, we plot in Fig. 3(e) to assess the scaling of oscillator strength. The obtained reasonably match with the theoretical expectation of except the 2 state Heckötter et al. (2017); Krüger and Scheel (2019). All temperature data sit reasonably well-overlapped without any adjustment, which implies that the magnitude of the oscillator strength remains similarly in our temperature range. at the larger -valued states is more sensitive to additional disturbance factors to yield the discrepancy from the scaling relation. Most resonance peaks which fit very well to Eq. (2) exhibit strong asymmetry (), which reveals the interband effect associated with exciton band structures Toyozawa (1958). For example, the high energy tail in positive implies the Fano-type exciton-continuum part interference. At all temperatures, starts with negative values in smaller numbers but progressively moves to the positive side. For we see a strong trend towards positive asymmetry with a high degree of uncertainty, which we attribute to the resolution limit of our spectrometer.
| Reference | Ry (meV) | Temperature (K) | |
|---|---|---|---|
| Ziemkiewicz et al. (2020)Ziemkiewicz et al. (2020) | 91.5∗ | 0.083∗ | 10 |
| Stolz et al.(2018)Stolz et al. (2018) | 87.653∗ | 0.1986∗ | 1.2 |
| Schöne et al. (2017) Schöne et al. (2017) | 87 | 0 | 2 |
| Schöne et al. (2016)Schöne et al. (2016) | 86.04 | 0.32 ( | |
| Kazimierczuk et al. (2014)Kazimierczuk et al. (2014) | 92 | 0.23 | 1.2 |
| Uihlein et al. (1981)Uihlein et al. (1981) | 87 | 0 | 4.2 |
| Itoh et al. (1975)Itoh and Narita (1975) | 93 | 0 |
| (meV) | (meV) | (meV) | (meV) |
| 2172.20 0.18 | -25.77 0.15 | 91.11 0.08 | 1.99 0.34 |
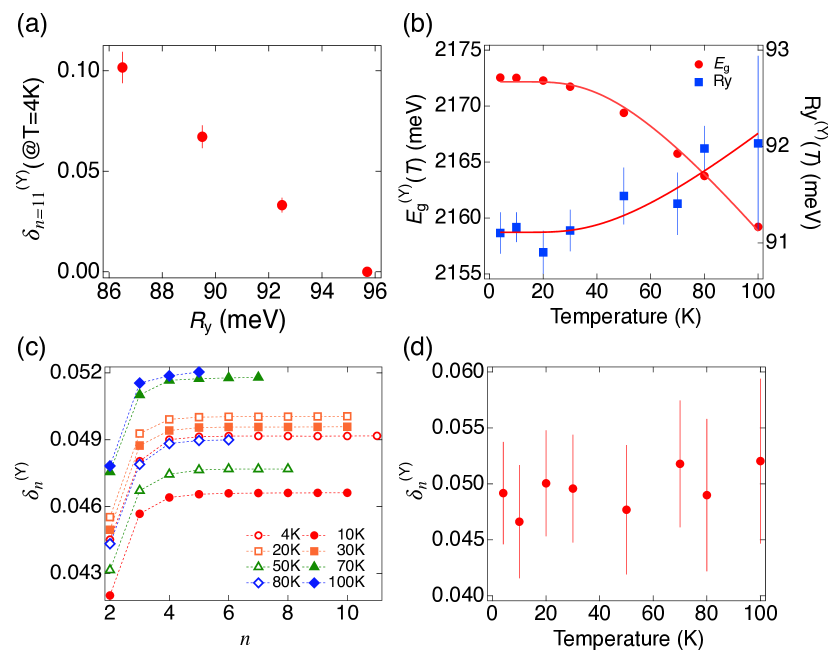
Our analysis so far neglects the effect of the quantum defect by setting = 0 in Eq. (3); however, the non-hydrogenic nature was reported in \ceCu2O excitons Schöne et al. (2016). Now we discuss the effect of quantum defect in our temperature-dependent data and evaluate and Ry with non-zero according to Eq. (3). At a fixed temperature, the bandgap energy values remain almost the same between zero and non-zero , with a difference smaller than 0.002%, whereas the value of Ry is extremely sensitive to the value of in study in Fig. 4(a). The plot shows as a function of different Ry values at 4 K. As can be seen, decreases as Ry increases. Table 3 surveys the Ry and values in a small set of the literature. Ry values sit between 86 and 93 meV with a wide range of the values between 0 and around 0.32. Equation (3) tells us that Ry and are anticorrelated for a fixed , namely a smaller Ry accompanies a larger . Indeed, this trend appears in the Table 3; however, a concerning point is that even for the same experimental Rydberg data Kazimierczuk et al. (2014), the chosen are spread out significantly while Ry values are within 10 - 11% range similar to the theoretical Ry uncertainty 10 Kazimierczuk et al. (2014); Ziemkiewicz et al. (2020); Schöne et al. (2016). Note that extensive theoretical discussions are given about central-cell corrections in Rydberg excitons in \ceCu2O, where several factors are explicitly treated, including the nonparabolicity of the bands which can modify the bare electron and hole masses, the momentum and frequency dependent dielectric function associated with the coupling of electrons and holes to the longitudinal optical phonons, and exchange interactions Kavoulakis et al. (1997); Schöne et al. (2016, 2016); Uihlein et al. (1981). Thus, we remark that the non-converging values of and Ry from experimental data would require further careful studies both in experiments and theoretical calculations.
Despite this uncertainty, we show our best attempt to assess our experimental data by incorporating the quantum defect . We assume that both and Ry are independent of at a given temperature. Inspired by previous work Schöne et al. (2016), where approaches steady values above , we evaluate vs. for the data. Figure 4(b) shows the updated and Ry using this method with non-zero for the yellow excitons. Ry is taken by the study, finding optimized Ry values through the standard deviation of with different values. Both and Ry still obey hyperbolic cotangent temperature relations in Eq. (4). The fitting results of two cases are summarized in Table 4. Compared to Figs. 2(c) and (d), is almost the same, within a 2% difference, while Ry with the non-zero is between 91 and 92 meV, about 5% lower than earlier Ry 95 - 96 meV. This discrepancy agrees with the previous reports which consider Ry with or without quantum defects Gross (1956); Schöne et al. (2016); Heckötter et al. (2017). Regarding Fig. 4(d), appears to have no observable trend over the temperature range considered here, with the largest deviation from the mean of the values being only 11%. Thus, we assume to be constant as a function of temperature.
IV.2 Green Excitons
For green P-excitons, we can distinguish only three resonance peaks ( = 2, 3, 4) at all temperatures so that we encounter technical challenges in performing reliable scaling analysis. Despite the existence of increasing residual background absorption, we apply the same hydrogen-like exciton model to green absorption data (Fig. 2(b)), similarly to yellow excitons. The -dependence of various parameters at different temperatures is presented in Fig. 5.
Using the green band-gap and Rydberg energies reported in Figs. 2(c) and (d), we are able to pinpoint of the green P-excitons, which merge into a single line (Fig. 5(b)). We find that has an excellent agreement with . The energy gap between adjacent states in Fig. 5(c) reduces as goes up along the -trend, but two data points cannot validate our linear regression analysis result conclusively.
We notice the different spectral linewidth trend of green exciton from that of yellow excitons. is much broader than that of the yellow excitons. Although (Fig. 5(d)) of the green exciton resonance is broader than our minimum spectral resolution, it still does not follow the expected scaling law of like the yellow excitons. We may understand the linewidth of the green excitons in terms of several factors different from the yellow excitons. Similar to the yellow excitons, the green excitons also couple to various components of phonons and non-resonant Urbach tail. Since the green exciton peaks are located in the yellow absorption continuum region, they are coupled to free electron-hole pairs in the yellow continuum via the valence bands so that they are not truly bound like the yellow excitons. The valence bands are degenerate with two different effective masses, which may play a role in the broader spectral linewidth of the green excitons. Recently, Rommel et al. calculate that the linewidths from the yellow-continuum coupling only follow the scaling law Rommel et al. (2020). Thus, we conjecture that if we can isolate this yellow-continuum contribution only, we may observe the expected scaling law of the spectral linewidths in the green excitons.
Significant thermal broadening is also seen at temperatures 50 K, indicating stronger phonon scattering. The of the green P-excitons are 20 - 30 times larger than those of their yellow counterparts. The theoretically derived ratio of oscillator strength between yellow and green excitons is 15 Elliott (1957); Itoh and Narita (1975), which is on the same order as our estimate. From the trend of in Fig. 5(e), we guess that the oscillator strength will decrease much more rapidly than the scaling law of . The origin of this departure from the known scaling law may be common to the cause of the broadened . Some non-radiative processes in green excitons can broaden the resonance linewidth and reduce the radiative path, and consequently the oscillator strength. The green exciton resonance peaks are also asymmetric Lorentzians with non-zero negative at , which moves to positive at . This transition resembles the yellow-exciton . Unlike the yellow exciton series, we are unable to perform the reliable quantum defect analysis for the green excitons due to only having 2-3 data points.
V Temperature dependence of Rydberg Exciton properties: spectral linewidth, lifetime, peak areas, and asymmetry
In this section, we focus on the temperature behavior of the experimental parameters. The temperature dependence of the yellow and green exciton resonant spectra has been studied previously in several works Itoh and Narita (1975); Iwamitsu et al. (2012); however, these discussions were mainly restricted to the 2P-exciton only. We expand the temperature study to higher P-excitons for the purpose of high-temperature solid-state Rydberg applications. The assessment of the temperature-independent and dependent components using Eqs. (6) and (7) provides the intuitive view for how the phonon-originated broadening is critical in the measured spectra at higher temperatures.
We revisit the temperature-dependent 1S-ortho exciton energy, bandgap energy, and Rydberg binding energy obtained by fitting the hyperbolic cotangent functions explicitly written in Eqs. (1) and (4). The average value of at the zero-temperature limit is 2.0615 eV, and the at = 4 K of 2.0332 eV almost perfectly matches with the reported value of 2.0327 eV within 0.03 % error Biccari (2009). The coefficient of the hyperbolic cotangent function in Eq. (1) is expressed as , where is related to the material constant and = 13.6 meV Biccari (2009). The values of in Table 1 give = 2.128 0.071, around 13 % higher than the expected value of 1.89. Similarly, the zero-temperature and Ry0 values are consistent with the literature values Itoh and Narita (1975). In this case, yields 1.906 with = 13.6 meV, within 1 % error of the expected value of 1.89.
| (meV) | (meV) | (arb. units) | (arb. units) | |
|---|---|---|---|---|
| 2 | 2.46 0.05 | -3.35 1.26 | 0.1760 0.00306 | -0.0835 0.0831 |
| 3 | 0.71 0.03 | -2.19 0.86 | 0.1030 0.00159 | 0.0124 0.0430 |
| 4 | 0.33 0.03 | -2.22 0.81 | 0.0572 0.00131 | 0.0165 0.0356 |
| 5 | 0.12 0.13 | -3.45 3.63 | 0.0258 0.00389 | -0.0463 0.1060 |
| 6 | 0.12 0.07 | -2.83 3.72 | 0.0148 0.00268 | -0.0462 0.1370 |
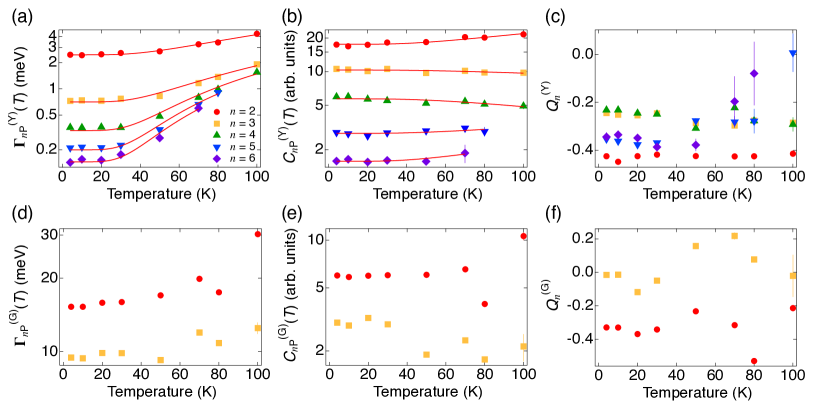
We observe the thermal broadening of the yellow- and green-exciton spectra lines in Figs. 6(a) and 6(e): the higher temperatures, the broader the exciton resonance peaks arising from phonons. Specifically, of the exciton resonance increases more rapidly above 60 K, and the degree of broadening is dependent. The thermal impact is more noticeable for higher P-yellow excitons. This phonon-related broadening is formulated as a function of temperature with a dominant -phonon process via Itoh and Narita (1975),
| (6) |
The fitting results of the first five yellow excitons are summarized in Table 5 and plotted in Figs. 6(a) and (b). A linear relation between and T for P excitons ( = 2 - 6) is observed above 50 K. This observation is explained from the first two terms in the Taylor expansion of the hyperbolic cotangent function. From the theoretical asymptotic approximation, the linear term in is dominant above 45.6 K, which agrees well with our measurements and fitting results. The temperature effect on the yellow P-exciton linewidth is primarily influenced by the -phonon process, which is consistent with the earlier study of the yellow 2P-exciton Itoh and Narita (1975).
The exciton lifetimes are estimated from the FWHM through , assuming lifetime is the dominant contribution to the linewidth Kazimierczuk et al. (2014). For example, the linewidth of a yellow exciton with , about 0.2 meV, corresponds to the lifetime of 20 ps as a lower bound. At higher temperatures, the P yellow excitons are short-lived and the impact of the temperature is significant in higher P excitons. Since the yellow exciton peaks are much narrower than the green ones, yellow exciton lifetimes are longer by a factor of 10 to 50 times. The weaker temperature-sensitivity of green exciton lifetimes is the consequence of the much broader linewidths.
The vs. at different are drawn in Figs. 6(b) and 6(e). In the same manner as the linewidth, we made an attempt to express the temperature dependence of oscillator strength term with the -function given by
| (7) |
The fitting coefficients for the vs. for different are displayed in Table 5. Lastly, the temperature behavior of yellow and green exciton are presented in Figs. 6(c) and 6(f). When we examine the yellow-exciton - data, we observe that low-lying states preserve their asymmetric Lorentzian shapes until 100 K; however, higher states become symmetric above 50 K related to the thermal broadening. We omit the = 4 case for the green exciton in Figs. 6(d)-(f) since the results in these cases are inconclusive and off-trend.
∗Radiative lifetime is estimated through from the spectral linewidth reported in Ref. Kazimierczuk et al. (2014).
∗∗The van der Waals coefficients for Rydberg excitons are assumed to be P-P asymptote for , the first row in the Table 1 of Ref. Walther et al. (2018).
§The Blockade radius of Rydberg excitons is estimated from the equation .
†The data are obtained from the Alkali Rydberg Calculator. The radiative lifetime are for 1S1/2, 60P1/2 and 80P1/2. The dipole-dipole interaction coefficient is between the states 60P3/2,60P and 61S1/2,60S or 80P3/2,80P and 81S1/2, 80S. The van der Waals interaction coefficient is from the second-order perturbation theory.
‡The atomic Rydberg blockade radius is calculated for the laser linewidth 3.0 MHz.
| Yellow, \ceCu2O | Cs | ||||||
|---|---|---|---|---|---|---|---|
| quantity | = 2 | = 10 | = 25 | = 6 | = 60 | = 80 | Unit |
| Binding energy (Ry/) | 0.023 | 0.009 | 0.0015 | 3.8 | 0.008 | 0.0017 | eV |
| Orbital/atomic radius () | 4 | 164 | 1030 | 0.340 | 503 | 980 | nm |
| Radiative lifetime | 0.0002∗ | 0.026 | 1.03 | 30† | 5.60e5 | 1.4e6 | ns |
| Dipole-Dipole interaction ( | 6∗ | 234∗ | 54† | 343† | eVm3 | ||
| van der Waals interaction () | 4.6∗∗ | 1.49e5∗∗ | 1.2e3† | 1.33e5† | eVm6 | ||
| Blockade radius | 0.7§ | 7.3§ | 6‡ | 11‡ | m | ||
VI Discussions and Conclusion
We have provided a thorough analysis of the yellow and green P-exciton absorption spectra in \ceCu2O, focusing on the behavior of various scaling laws at different temperatures, specifically, in terms of , , , the FWHM, oscillator strength, and asymmetry for the Lorentzian excitonic resonance peaks. Up to temperatures of 100 K, for not limited by the spectral resolution of our monochromator, yellow P-excitons exhibit the expected scaling behaviors, whereas only the first three green excitons are seen.
Our observation of Rydberg scaling behavior in \ceCu2O excitons is encouraging for the development of a Rydberg solid-state system for both fundamental and applied research and engineering applications. In comparison to Rydberg atoms, the evaluation of Rydberg excitons in semiconductors facilitates an understanding of Rydberg physics in the presence of large number of electrons by identifying similarities and differences between atomic and solid-state systems. Furthermore, quantum Rydberg-exciton technologies may offer advantageous features such as compact footprints, fast operations, and integrated architectures via advanced semiconductor lithographic and etching processes. Other advantages include that the excitons are “stationary” in a host material, which can be in principle be created on demand on a particular position space. For Rydberg atoms, however, the atoms would need to be rearranged to the particular configurational state.
One notable benefit in Rydberg excitons is that even the = 10 state may still enjoy reasonably strong Rydberg properties because of smaller Rydberg energy, larger Bohr radius, stronger interaction term and bigger Blockade radius. In Table 6, we compare our \ceCu2O yellow P-excition with Caesium (Cs) Rydberg atom in terms of several quantities. For example, large electric dipole moment with the elementary charge is beneficial when one Rydberg particle interacts with another. Table 6 reads that the = 25 yellow P-exciton of \ceCu2O would possess the characteristic dipole matrix element as large as that of = 80 Cs Rydberg atom. Therefore, we learn that the dipole-dipole interaction strength, the van der Waals interaction strength and the blockade radius are comparable in both systems.
The study of solid-state Rydberg quantum platforms, while an interesting problem, still remains in its infancy. In particular, most studies of Rydberg excitons take place at low temperatures. Motivated by the numerous research activities to search for RT solid-state quantum systems, in this work, we present our spectroscopic measurements and analysis of Rydberg excitons from 4 K to 100 K in order to assess the feasibility of higher temperature Rydberg applications using \ceCu2O. Although the number of observed resonance peaks in simple absorption spectra decreases at high temperatures, the Rydberg exciton states are robust and continue to exhibit the expected scaling behavior in the Rydberg exciton energies, spectral linewidth, and oscillator strength, even over liquid nitrogen temperatures. Our studies tell us that RT Rydberg excitons may not be advantageous in \ceCu2O since the stable maximum would be 3 or 4 limited by thermal energy. However, we think high-temperature Rydberg systems would surely be an interesting venue for thorough studies at elevated temperatures. In contrast to viable solid-state quantum defects which actually still require cryogenic operations for sharp optical transition lines and also need a mediating bus for a submicron-ranged particle-particle interaction, Rydberg excitons inherently enjoy direct dipole-dipole and/or van der Waals interactions. Their sufficiently longer lifetime would bring a plus compared to the interaction coefficients. Hence, we believe that our temperature studies provide promising results to access robust Rydberg exciton states with reasonably high values around 10 for yellow series above 70 K. Future research plans may include quantifying the Rydberg blockade Khazali et al. (2017); Heckötter et al. (2020), defining a qubit and demonstrating single and two-qubit operations via standard and sophisticated optical techniques at high temperatures.
References
- Saffman et al. (2010) M. Saffman, T. G. Walker, and K. Mølmer, Quantum information with rydberg atoms, Rev. Mod. Phys. 82, 2313 (2010).
- Adams et al. (2019) C. S. Adams, J. D. Pritchard, and J. P. Shaffer, Rydberg atom quantum technologies, J. Phys. B: At. Mol. Opt. Phys. 53, 012002 (2019).
- Chernikov et al. (2014) A. Chernikov, T. C. Berkelbach, H. M. Hill, A. Rigosi, Y. Li, O. B. Aslan, D. R. Reichman, M. S. Hybertsen, and T. F. Heinz, Exciton binding energy and nonhydrogenic rydberg series in monolayer , Phys. Rev. Lett. 113, 076802 (2014).
- Stier et al. (2018) A. V. Stier, N. P. Wilson, K. A. Velizhanin, J. Kono, X. Xu, and S. A. Crooker, Magnetooptics of exciton rydberg states in a monolayer semiconductor, Phys. Rev. Lett. 120, 057405 (2018).
- Kazimierczuk et al. (2014) T. Kazimierczuk, D. Fröhlich, S. Scheel, H. Stolz, and M. Bayer, Giant Rydberg excitons in the copper oxide \ceCu2O, Nature 514, 343 (2014).
- Heckötter et al. (2020) J. Heckötter, D. Janas, R. Schwartz, M. Aßmann, and M. Bayer, Experimental limitation in extending the exciton series in \ceCu2O towards higher principal quantum numbers, Phys. Rev. B 101, 235207 (2020).
- Hayashi (1952) M. Hayashi, Absorption Spectrum of Cuprous Oxide in the Visible Region, J. of the Faculty of Science, Hokkaido University, Japan, Ser. II 4, 343 (1952).
- Hayashi and Katsuki (1952) M. Hayashi and K. Katsuki, Hydrogen-Like Absorption Spectrum of Cuprous Oxide, J. Phys. Soc. Jpn 7, 599 (1952).
- Itoh and Narita (1975) T. Itoh and S. I. Narita, Analysis of Wavelength Derivative Spectra of Exciton in \ceCu2O, J. Phys. Soc. Jpn 39, 140 (1975).
- Elliott (1957) R. J. Elliott, Intensity of optical absorption by excitons, Phys. Rev. 108, 1384 (1957).
- Kubouchi et al. (2005) M. Kubouchi, K. Yoshioka, R. Shimano, A. Mysyrowicz, and M. Kuwata-Gonokami, Study of orthoexciton-to-paraexciton conversion in \ceCu2O by excitonic lyman spectroscopy, Phys. Rev. Lett. 94, 016403 (2005).
- Yoshioka and Kuwata-Gonokami (2012) K. Yoshioka and M. Kuwata-Gonokami, Relaxation explosion of a quantum degenerate exciton gas in \ceCu2O, New J. Phys. 14, 055024 (2012).
- Snoke and Kavoulakis (2014) D. Snoke and G. M. Kavoulakis, Bose-Einstein condensation of excitons in \ceCu2O: progress over 30 years, Rep. Prog. Phys. 77, 116501 (2014).
- Forman et al. (1971) R. Forman, W. Brower, and H. Parker, Phonons and the green exciton series in cuprous oxide, cu2o, Phys. Lett. A 36, 395 (1971).
- Olbrychski et al. (1975) K. Olbrychski, R. Kołlodziejski, M. Suffczyński, and H. Kunert, Selection rules for the space group of \ceCu2O, at four symmetry points of the brillouin zone, J. Phys. France 36, 985 (1975).
- Ito et al. (1998) T. Ito, H. Yamaguchi, K. Okabe, and T. Masumi, Single-crystal growth and characterization of \ceCu2O and CuO, J. Mater. Sci. 33, 3555 (1998).
- Malerba et al. (2011) C. Malerba, F. Biccari, C. Leonor Azanza Ricardo, M. D’Incau, P. Scardi, and A. Mittiga, Absorption coefficient of bulk and thin film \ceCu2O, Sol. Energy Mater Sol. Cells 95, 2848 (2011).
- Abdu and Musa (2009) Y. Abdu and A. Musa, Copper(I) Oxide (\ceCu2O) Based Solar Cells - A review, BAJOPAS 2, 8 (2009).
- Khazali et al. (2017) M. Khazali, K. Heshami, and C. Simon, Single-photon source based on rydberg exciton blockade, J. Phys. B: At. Mol. Opt. Phys. 50, 215301 (2017).
- Heckötter et al. (2020) J. Heckötter, V. Walther, S. Scheel, M. Bayer, T. Pohl, and M. Aßmann, Asymmetric rydberg blockade of giant excitons in cuprous oxide (2020), arXiv:2010.15459 .
- Ziemkiewicz (2020) D. Ziemkiewicz, Electromagnetically induced transparency in media with rydberg excitons 1: Slow light, Entropy 22 (2020).
- Ziemkiewicz and Zielińska-Raczyńska (2020) D. Ziemkiewicz and S. Zielińska-Raczyńska, Electromagnetically induced transparency in media with rydberg excitons 2: Cross-kerr modulation, Entropy 22 (2020).
- Heckötter et al. (2017) J. Heckötter, M. Freitag, D. Fröhlich, M. Aßmann, M. Bayer, M. A. Semina, and M. M. Glazov, Scaling laws of rydberg excitons, Phys. Rev. B 96, 125142 (2017).
- Zielińska-Raczyńska et al. (2016) S. Zielińska-Raczyńska, G. Czajkowski, and D. Ziemkiewicz, Optical properties of rydberg excitons and polaritons, Phys. Rev. B 93, 075206 (2016).
- Schweiner et al. (2017) F. Schweiner, J. Main, G. Wunner, and C. Uihlein, Even exciton series in \ceCu2O, Phys. Rev. B 95, 195201 (2017).
- Kitamura et al. (2017) T. Kitamura, M. Takahata, and N. Naka, Quantum number dependence of the photoluminescence broadening of excitonic rydberg states in cuprous oxide, J. Lumin. 192, 808 (2017).
- Schöne et al. (2017) F. Schöne, H. Stolz, and N. Naka, Phonon-assisted absorption of excitons in \ceCu2O, Phys. Rev. B 96, 115207 (2017).
- Semina (2018) M. A. Semina, Fine Structure of Rydberg Excitons in Cuprous Oxide, Phys. Solid State 60, 1527 (2018).
- Stolz et al. (2018) H. Stolz, F. Schöne, and D. Semkat, Interaction of rydberg excitons in cuprous oxide with phonons and photons: optical linewidth and polariton effect, New J. Phys. 20, 023019 (2018).
- Takahata and Naka (2018) M. Takahata and N. Naka, Photoluminescence properties of the entire excitonic series in \ceCu2O, Phys. Rev. B 98, 195205 (2018).
- Wrachtrup (2010) J. Wrachtrup, Defect center room-temperature quantum processors, Proc. Natl. Acad. Sci. 107, 9479 (2010).
- Weber et al. (2010) J. R. Weber, W. F. Koehl, J. B. Varley, A. Janotti, B. B. Buckley, C. G. Van de Walle, and D. D. Awschalom, Quantum computing with defects, Proc. Natl. Acad. Sci. 107, 8513 (2010).
- Bassett et al. (2019) L. C. Bassett, A. Alkauskas, A. L. Exarhos, and K.-M. C. Fu, Quantum defects by design, Nanophotonics 8, 1867 (2019).
- Kavoulakis et al. (1997) G. M. Kavoulakis, Y. C. Chang, and G. Baym, Fine structure of excitons in \ceCu2O, Phys. Rev. B 55, 7593 (1997).
- Toyozawa (1958) Y. Toyozawa, Theory of Line-Shapes of the Exciton Absorption Bands, Prog. Theor. Phys. 20, 53 (1958).
- Schöne et al. (2016) F. Schöne, S. O. Krüger, P. Grünwald, M. Aßmann, J. Heckötter, J. Thewes, H. Stolz, D. Fröhlich, M. Bayer, S. F. Scheel, M. Bayer, and S. Scheel, Coupled valence band dispersions and the quantum defect of excitons in \ceCu2O, J. Phys. B: At. Mol. Opt. Phys. 49, 134003 (2016).
- Schöne et al. (2016) F. Schöne, S.-O. Krüger, P. Grünwald, H. Stolz, S. Scheel, M. Aßmann, J. Heckötter, J. Thewes, D. Fröhlich, and M. Bayer, Deviations of the exciton level spectrum in \ceCu2O from the hydrogen series, Phys. Rev. B 93, 075203 (2016).
- Gross (1956) E. F. Gross, Optical spectrum of excitons in the crystal lattice, Il Nuovo Cimento 3, 672 (1956).
- Krüger and Scheel (2019) S. O. Krüger and S. Scheel, Interseries transitions between rydberg excitons in \ceCu2O, Phys. Rev. B 100, 085201 (2019).
- Ziemkiewicz et al. (2020) D. Ziemkiewicz, K. Karpiński, G. Czajkowski, and S. Zielińska-Raczyńska, Excitons in \ceCu2O: From quantum dots to bulk crystals and additional boundary conditions for rydberg exciton-polaritons, Phys. Rev. B 101, 205202 (2020).
- Uihlein et al. (1981) C. Uihlein, D. Fröhlich, and R. Kenklies, Investigation of exciton fine structure in \ceCu2O, Phys. Rev. B 23, 2731 (1981).
- Rommel et al. (2020) P. Rommel, P. Zielinski, and J. Main, Green exciton series in cuprous oxide, Phys. Rev. B 101, 075208 (2020).
- Iwamitsu et al. (2012) K. Iwamitsu, S. Aihara, T. Shimamoto, A. Fujii, and I. Akai, Wavelength-modulated excitonic spectra in green series of \ceCu2O thin films sandwiched by \ceMgO plates, Phys. Status Solidi C 9, 2489 (2012).
- Biccari (2009) F. Biccari, Defects and Doping in \ceCu2O, Ph.D. thesis, University of Rome (2009).
- Walther et al. (2018) V. Walther, S. O. Krüger, S. Scheel, and T. Pohl, Interactions between rydberg excitons in \ceCu2O, Phys. Rev. B 98, 165201 (2018).
- Grun et al. (1961) J. Grun, M. Sieskind, and S. Nikitine, Etude spectrophotometrique des spectres continus de \ceCu2O a diverses temperatures, J. Phys. Chem. Solids. 19, 189 (1961).
- Urbach (1953) F. Urbach, The long-wavelength edge of photographic sensitivity and of the electronic absorption of solids, Phys. Rev. 92, 1324 (1953).
- Dow and Redfield (1972) J. D. Dow and D. Redfield, Toward a unified theory of urbach’s rule and exponential absorption edges, Phys. Rev. B 5, 594 (1972).
- Rai (2013) R. C. Rai, Analysis of the urbach tails in absorption spectra of undoped \ceZnO thin films, J. Appl. Phys. 113, 153508 (2013).
- Yoshioka (2012) K. Yoshioka, Bose-Einstein condensation transition of spin-forbidden excitons, Ph.D. thesis, University of Tokyo (2012).
Acknowledgments
D.D.K., A.G., H.B.Y., and N.Y.K. acknowledge the support of Industry Canada, the Ontario Ministry of Research & Innovation through Early Researcher Awards, the Canada First Research Excellence Fund-Transformative Quantum Technologies (CFREF-TQT), and Canada Foundation for Innovation 2017 Innovation Fund program (CFI-IF Project 36255). D.D.K. thanks T. Yoon for his help to build an optical setup. N.Y.K. thanks Prof. Makoto Kuwata-Gonokami for sample preparation support and fruitful discussions.
Appendix
A. Estimation of the environmental background absorption
The absorption spectra obtained by the transmission spectroscopy includes the background absorption as well as P-exciton dipole transitions. We use a broadband white light from Ando AQ4303B in the range of 400 – 1800 nm, whose reference spectrum is taken with an 1800 g/mm grating (blaze wavelength 500 nm) in a Princeton Instrument Spectrometer SP-2758. An average power density of the white light at the end of a single-mode fiber is 150 W/mm2, which is weak enough not to create the free carriers. According to Ref. Heckoetter2018, the laser induced free carriers can cause the linewidth broadening, the noticeable bandgap shift, relative oscillator strength reduction and the flat continuum background. We have not observed any of these features associated with free carriers in our absorption spectra.
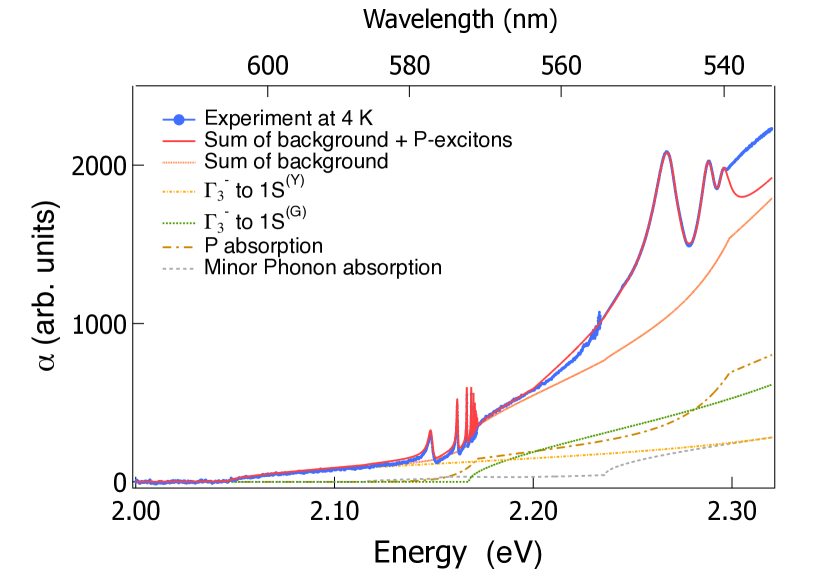
A recent work Schöne et al. (2017) reports that at near-zero temperature, the phonon-assisted absorption spectrum related to the S-exciton is expressed primarily by the , phonon-assisted transition to the yellow and green 1S excitons. The continuum part of comes mainly from 1S-ortho excitons with emission or absorption of phonons (). Considering the Elliott’s famous formula Elliott (1957); Grun et al. (1961), we can write
| (8) | ||||
for only a dominant phonon with the phonon density in the form of Bose-Einstein distribution
where contains material constants, a dipole transition element, and a phonon interaction element with a deformation potential, explicitly written in supplementary materials Schöne et al. (2017).
For example, the expression for the yellow excitons is derived as
| (9) |
with
and
where is denoted as an available phonon index such as , and others; is phonon energy; is the dipole transition element between Bloch states of conduction and valence bands; are the overlap factors; is the refractive index around the excitation energy; is the Bohr radius of the blue exciton; is the 1s yellow exciton mass. The values of parameters and material constants in are chosen from Ref. Schöne et al. (2017).
The bulk phonon-assisted absorption has been typically analyzed by the square root of energy, , commonly called as the Elliott form Elliott (1957) within the second-order perturbation theory. A recent paper by Schöne Schöne et al. (2017) describes an accurate understanding of the dominant phonon-assisted absorption by 1S ortho-exciton resulting from an arbitrary energy level at a blue exciton level to a yellow exciton level accompanying phonons. Several phonon contributions from theoretical calculations at 4 K are individually plotted in Fig. 7 as a respresentative example. The absorption based on minor phonons such as ( = 82.1 meV) are also taken into account as the Elliott form with the coefficients from the values fitted in Ref. Schöne et al. (2017). The temperature dependence is embedded in phonon occupancy, , given by Elliott (1957). Thus is multiplied by the original phonon-assisted absorption for the phonon creation process and by for the phonon destruction process. The red straight line in Fig. 7 displays the overall calculated phonon-assisted absorption spectra, which matches very well with experimental data in most regions.
We also consider the residue of background absorption as P-exciton non-resonant absorption including Urbach tail and continuum absorption. Specifically, we add the thermal broadening of the Urbach tail in semiconductors, which is given by Ref. Urbach (1953),
| (10) |
and the well-established phonon theory Dow and Redfield (1972); Rai (2013) writes
| (11) |
As a result of thorough systematic examinations, the overall background absorption spectra is satisfactorily reproduced for the yellow excitons, from which the yellow P-exciton spectra are confidently isolated in Fig. 2 (a) and their fitted scaling laws are acquired with reliable coincidence to the theoretical expectation in Fig. 3. On the other hand, in the case of green excitons, there still exists a non-negligible discrepancy between the experimental absorption coefficient spectrum and the theoretical/fitted background spectrum. Our practical approach to handle the influence of the residual background is to introduce a constant offset term added to Eq. (2) during the fitting process. We found that a constant term was sufficient to accommodate for this residual background and obtain good fitting results for the region of the spectrum shown in Fig. 2 (b), and that additional polynomial terms did not yield any significant improvements to the fit. We think the careful study of absorption process associated with green excitons needs to be done further.
B. Yellow P-exciton resonances
In this section, we explicitly explain the fits of Toyozawa’s formula to yellow P-exciton resonances in the absorption spectra at two representative temperatures, 4 K (Figs. 8(a) and 8(b)) and 100 K (Figs. 8(c) and 8(d)). This work is the basis for the extraction of optical properties presented in Figs. 3 and 5 from Toyozawa’s exciton model. In order to access higher -exciton states, we inspect the absorption coefficient spectra and their energy derivatives. Experimental data are presented in blue symbols and the model fits are shown in red straight lines in Fig. 8.
By and large, the Toyozawa’s asymmetric Lorentzian fits work extremely well both in the original and the first energy derivative of the absorption spectra. At 4 K (Fig. 8(a)), it is clear that the peaks of 8-9 are asymmetric Lorentzian shaped, whereas the higher peaks are more ambiguously shaped, partly because they are convoluted with the spectral resolution of our monochromator. As temperature increases, despite the spectral linewidth broadening, the peaks look still closer to asymmetric Lorentzian as can be seen in the spectra at 100 K (Figs. 8(c) and 8(d)). The analysis of the first derivative confirms the values of the parameters for exciton binding energies, FWHM, peak areas and the asymmetry of the peaks.
C. Photoluminescence of the yellow exciton series in \ceCu2O
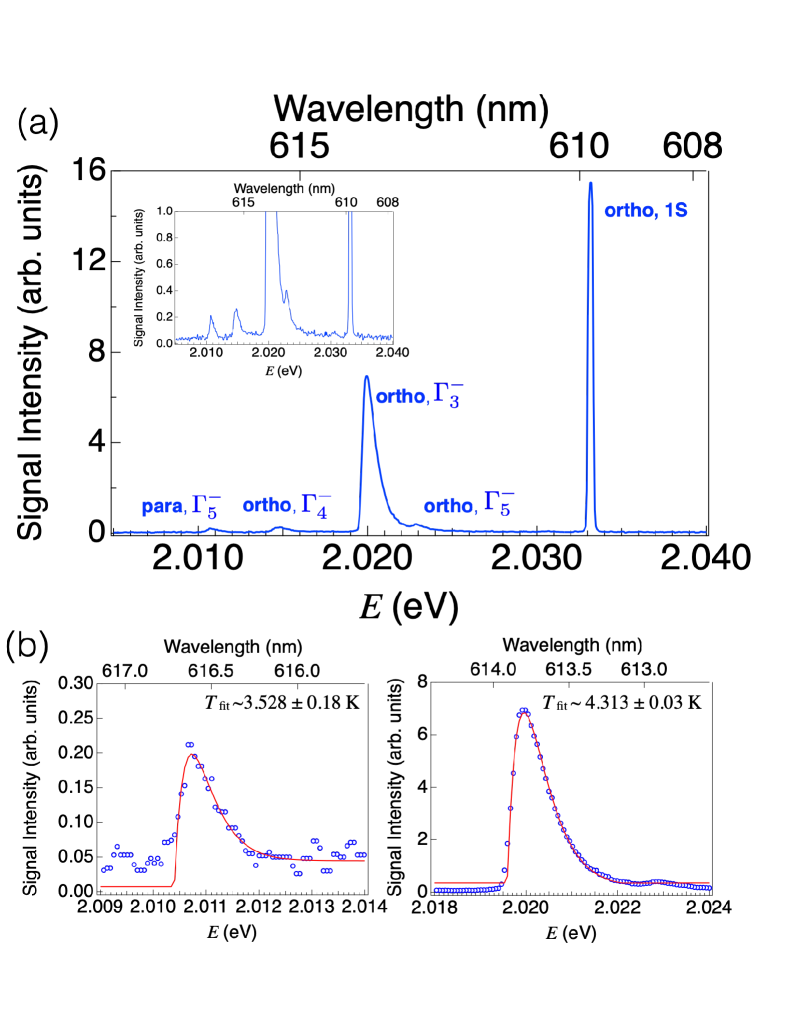
The yellow 1S exciton is dipole-forbidden; however, the direct luminescence of the 1S ortho-exciton (triplet) is still the most dominant radiative recombination process via electric quadrupole transition Takahata and Naka (2018). Since PL spectroscopy enables us to assess the 1S ortho-exciton related peaks, both direct and phonon side bands, we perform PL measurements in a transmission configuration with the excitation of a 520 nm semiconductor laser diode, and collect the luminescence signal in forward direction. The representative spectrum at 4 K is obtained around the 1S yellow-exciton energy level (Fig. 9(a)). Similarly to previous papers Takahata and Naka (2018), the 1S ortho-exciton peak appears at 2.033 eV (609.8 nm), with several phonon-assisted signal peaks. As temperature goes up, the 1S ortho-exciton energy exhibits a red-shift (Fig. 1(c)). The binding energy of 1S ortho-exciton from in Fig. 2 is about 139.4 meV at 4 K, with a slightly larger value of 141.3 meV at 100 K.
We draw the attention to the fact that the ortho-exciton peak (-phonon replica) is the largest peak, being the dominant phonon in \ceCu2O and providing evidence of the interaction between the phonon and 1S exciton. Furthermore, this peak exhibits an energy shift identical to the 1S ortho-exciton across the observed temperature ranges, keeping the phonon energy at a constant value of 13.6 meV. We apply the Maxwell-Boltzmann distribution to the phonon-assisted peak for extracting the peak energy at effective temperature in the intensity expression given by Takahata and Naka (2018),
| (12) |
Our PL spectra also supports our crystal being of high quality, with the clear observation of the para-exciton signal (-phonon replica) at 2.01066 eV (616.635 nm) (Fig. 9(a),inset). Furthermore, the relative intensity strengths of the quadrupole resonance and the para-exciton peak with respect to the ortho-exciton peak are 2.2 and 0.08, which is comparable to the values of 3.9 and 0.06 from the PL spectra of the high-purity \ceCu2O crystal taken at 2 K Yoshioka (2012).
We further confirm the very high-purity of our sample from the Maxwell-Boltzmann (MB) distribution fits to the 1s, ortho-exiton (-phonon replica) and the 1s, para-exciton (-phonon replica) luminescence signals shown in Fig. 9(b). Both peaks match very well with the MB fitting from which we can find the effective temperatures. While the ortho-excitons reside at around 4.31 0.03 K, the very long-lived para-excitons are indeed lower at 3.53 0.18 K, which would be the lattice temperature.