1Department of Physics and Astronomy, Midnapore City College, Paschim Medinipur, West Bengal, India 721129
ALMA detection of hydrogen cyanide (HCN) in the atmosphere of Saturn
Abstract
In the planetary atmosphere, hydrogen cyanide (HCN) is an important nitrogen-bearing molecule that plays a key role in the formation of several biomolecules via chain reactions. The presence of an HCN characterizes the stratospheric composition of the solar gas planets and exoplanets. For several years, many observations have failed to detect the emission lines of HCN from the atmosphere of Saturn using ground- and space-based radio telescopes. We present the successful detection of the rotational emission line of HCN from the atmosphere of Saturn using the Atacama Large Millimeter/Submillimeter Array (ALMA) band 7. We detected the J = 4–3 transition line of the HCN from the eastern and western limbs of Saturn with statistical significance. The derived abundances of HCN in the western and eastern limbs were 6.19 ppb and 2.90 ppb, respectively. We claim that HCN was formed in the atmosphere of Saturn via the photolysis of methane (CH4) and ammonia (NH3).
keywords:
planets and satellites: Saturn–planets and satellites: atmospheres– Radio lines: planetary systems– Astrochemistry– Astrobiologyarijitmanna@mcconline.org.in
—-
xyz/123 \artcitid#### \volnum000 2021 \pgrange1–11 \lp11
1 Introduction
In the planetary atmosphere, hydrogen cyanide (HCN) is an important nitrogen (N) bearing molecule for the synthesis of several complex organic molecules (Tokunaga et al., 1981; Kaye & Strobel, 1984). The HCN molecule contains a –C N functional group, which plays a major role in the formation of peptides, nucleic acids, amino acids, and both nucleobases, which have the capacity to be the building blocks of DNA and RNA in the planetary atmosphere (Miller, 1957; Oró, 1961). The HCN molecule may play an important role in the formation of adenine (C5H5N5) via the neutral-neutral reactions (Oró, 1961). Adenine is one of the nucleobases of DNA and RNA and plays a major role in the origin of life’s possible primitive Earth conditions (Oró, 1961). HCN molecules may also be responsible for the production of chromophores in planetary atmospheres (Woeller & Ponnamperuma, 1969). The HCN molecule acts as a potential tracer of disequilibrium processes such as the transport of materials from the deep atmosphere or lightning (Lewis, 1980). In a planetary atmosphere, HCN are mainly formed via the dissociation of methane (CH4) and nitrogen (N2) (Catling & Kasting, 2007; Pearce et al., 2019). Several energy sources can dissociate CH4 and N2 in planetary atmospheres, including galactic cosmic rays, lightning, and ultraviolet light (Pearce et al., 2019, 2020).
In our solar system, Saturn’s Moon Titan had the most HCN-rich atmosphere because of its high atmospheric C/O ratio (Rimmer & Rugheimer, 2019). Earlier, four instruments aboard the Cassini spacecraft detected the HCN from the lower (600 km) and upper (700 km) atmospheres of Titan with mixing ratios 0.1–10 ppm (parts per million) and 0.1%–5% (parts per thousand) (Magee et al., 2009; Vinatier et al., 2010; Adriani et al., 2011; Koskinen et al., 2011). The galactic cosmic rays and ultraviolet lights are responsible for dissociating CH4 and N2 to create radical compounds in the upper and lower atmospheres of Titan (Gronoff et al., 2009, 2011; Vuitton et al., 2019). The emission lines of HCN were also detected in the atmosphere of Neptune and Pluto, with abundances 1 ppb (parts per billion) and 40 ppm, respectively, (Marten et al., 1993; Lellouch et al., 2017). Iino et al. (2020) detected the belt-like distribution of HCN in the atmosphere of Neptune using the ALMA. In the equatorial region and 60∘ S of Neptune, the abundance of HCN was 1.66 ppb and 1.17 ppb, respectively (Iino et al., 2020). The concentration of HCN in the upper atmosphere of Uranus is 0.1 ppb (Marten et al., 1993). Previously, Tokunaga et al. (1981) detected an HCN from Jupiter with a mixing ratio of 210-9.
In our solar system, the study of HCN in the atmosphere of Saturn at sub-millimeter wavelengths is important because HCN acts as a possible precursor of many major prebiotic molecules (Lellouch et al., 1984). In the last several years, scientists have attempted to detect evidence of HCN in the atmosphere of Saturn without success. Earlier, Tokunaga et al. (1981) searched for evidence of HCN in the atmosphere of Saturn in the infrared wavelength range, but they did not find any evidence of HCN in the atmosphere of Saturn because of the low signal-to-noise ratio (SNR). Tokunaga et al. (1981) calculated the upper-limit mixing ratio of HCN in Saturn’s atmosphere to be 510-10. Earlier, Kaye & Strobel (1984) suggested that the HCN mixing ratio in the atmosphere at Saturn was 510-10 which was estimated based on photochemical reactions. According to Lellouch et al. (1984), the submillimeter spectral range is the best for searching for evidence of HCN in Saturn’s atmosphere because, using the heterodyne technique, the possibility of HCN line resolving power is at least 106 and the four strongest HCN rotational lines lie between 800 m and 3 mm.
In this letter, we present the detection of the rotational emission line of HCN in the atmosphere of Saturn using ALMA. In Section 2, we briefly describe our observations and data reduction. The result and discussion of the detection of HCN are described in Section 3 The conclusion is presented in Section 4
2 Observation and data reductions
We used publicly available archival data of the solar gas planet Saturn, which was observed using the high-resolution Atacama Large Millimeter/Submillimeter Array (ALMA) band 7 with a 12 m array (PI: Fouchet, Thierry). The main aim of this observation was to study the rotational emission line of HCN with transition J = 4–3 in the stratosphere of Saturn. Saturn was observed on May 25, 2018, with an observed phase center of () = 18:37:56.412, –22:15:52.617. During the observation, a total of forty-four antennas were used, with an on-source integration time of 476.40 sec. The observed frequency ranges were 340.98–342.96 GHz, 342.98–344.96 GHz, 354.42–354.54 GHz, and 354.98–356.96 GHz, with spectral resolutions of 1128.91 kHz, 70.56 kHz, 282.23 kHz, and 1128.91 kHz, respectively. During the observation, the angular diameter of Saturn was 17.44′′, the geocentric distance was 9.21 AU, and the angular resolution was 0.70′′, 0.78′′, 0.82′′, and 0.85′′ for the corresponding frequency ranges of 340.98–342.96 GHz, 342.98–344.96 GHz, 354.42–354.54 GHz, and 354.98–356.96 GHz, respectively. The minimum and maximum baselines during the observation were 15.0 m and 313.7 m. The shortest baseline was used to directly measure Saturn’s stratospheric winds between the eastern and western limbs. During the Saturn observation, the flux and bandpass calibrators were taken as J1750+0939, and the phase calibrator was taken as J1832–2039.
After downloading the archival raw data of Saturn from the ALMA archive, we used the Common Astronomy Software Application (CASA 5.4.1) with a standard data reduction pipeline delivered by the ALMA observatory for data analysis and imaging (McMullin et al., 2007). We imported the ALMA data into CASA using task IMPORTASDM. During the data analysis, we used the Perley-Butler 2017 flux calibrator model to match the continuum flux density of the flux calibrator with 5% accuracy using the task SETJY in CASA (Perley & Butler, 2017). We applied the CASA pipeline tasks hifa_bandpassflag and hifa_flagdata to flag the bad antenna data. During bandpass calibration, we carefully removed the telluric effect from the data. After the flux, bandpass, and gain calibration, we separated the target dataset into another dataset using the task MSTRANSFORM with all available rest frequencies. After splitting the target data, we used task TCLEAN with the HOGBOM algorithm to create the continuum image of Saturn. After continuum analysis, we used the CASA task UVCONTSUB for continuum subtraction because continuum subtraction is essential for studying the spectral line. After continuum subtraction, we used the task TCLEAN for each rest frequency to create the spectral data cubes of Saturn. To correct the primary beam pattern in the synthesized image, we applied the IMPBCOR task in the CASA.
3 Result and discussion
3.1 Continuum emission towards Saturn
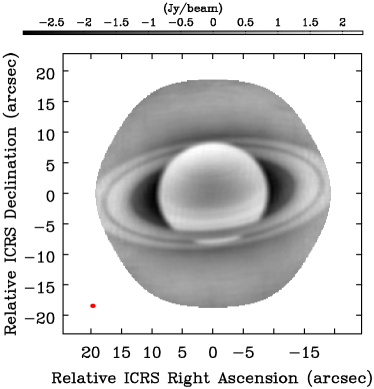
We present the 856.19 m (350.14 GHz) wavelength continuum emission image of the gas planet Saturn in Figure 1. The surface brightness colour scale in the continuum image has units of a Jy beam-1. In the continuum image, the ring pattern of Saturn is clearly visible at sub-millimeter wavelengths. The synthesized beam size of the continuum image was 0.780.61′′. The disk average (except ring) continuum flux density of Saturn is 1.600.35 Jy beam-1. Previously, Davies & Williams (1966) detected the first radio continuum emission from Saturn at wavelength 21.2 cm with a flux density of 0.080.02 Jy, which indicates that the obtained flux density was associated with error owing to the low resolution of the telescope. Davies & Williams (1966) also explained that the synchrotron emission was responsible for the continuum emission at a wavelength of 21.2 cm from Saturn, but the continuum emission at a frequency of 350.14 GHz is mainly coming from thermal emission.
3.2 Line emission towards Saturn
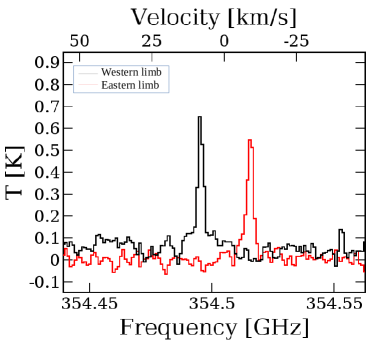
From the spectral data cubes, we find that the emission line of HCN with transition J = 4–3, whose rest frequency is 354.505 GHz, originates from both the eastern and western limbs of Saturn. We do not detect any line emissions from the equatorial region of Saturn. We extract the molecular emission spectra from the eastern and western limbs of spectral data cubes of Saturn. For spectral extraction, we created a diameter circular region in the eastern limb of Saturn centred at RA (J2000) = (18h35m51.873s), Dec (J2000) = (–22∘19′27′′.982). We applied the same method for spectral extraction from the western limb. We created a diameter circular region in the western limb centred at RA (J2000) = (18h33m53.128s), Dec (J2000) = (–22∘19′29′′.406). The extracted spectra of HCN from the eastern and western limbs of Saturn are shown in Figure 2. In Figure. 2, the center position (i.e., 0 km s-1) is the theoretical peak position of the HCN (354.505 GHz), but we find that the HCN spectra in the eastern limb (red line) shifted –9.2 km s-1 (354.516 GHz) from the center (i.e., 0 km s-1), and for the western limb (black line), the peak of the HCN was shifted to 8.36 km s-1 (354.494 GHz). This spectral shift could have been caused by strong stratospheric winds between the eastern and western limbs of Saturn. Earlier, Cavalié et al. (2010) also showed the millimeter-wavelength spectral line of Saturn was shifted – 9.2 km s-1 for the eastern limb line-of-sight and 7.7 km s-1 for the western limb line-of-sight using the atmospheric radiative transfer model. Our estimated shift in the HCN emission line for both the eastern and western limbs is similar to that of Cavalié et al. (2010). Except for HCN, we could not find any other molecular emission lines from other parts of Saturn because of the short baseline observations.
3.3 Determination of the abundance of HCN
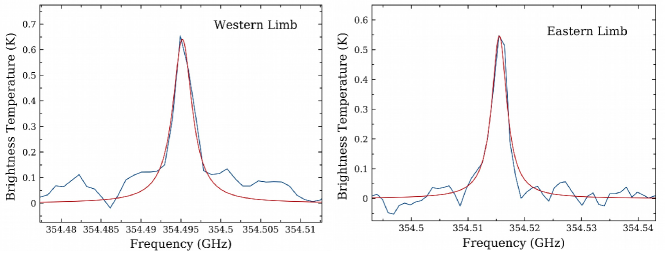
To determine the abundance of HCN in the atmosphere of Saturn, we used the Planetary Spectrum Generator (PSG) (Villanueva et al., 2018). PSG is a radiative transfer suite for spectrum simulation of the solar planets, exoplanets, comets, and other minor objects in our solar system. PSG combines radiative transfer modelling, planetary ephemeris databases (using JPL), and spectroscopic molecular databases to demonstrate the simulated spectra. During the computation of the simulated spectra, we used the line-by-line and correlated-k approaches for better spectral resolution. PSG is also able to fit the modelled spectra of the detected molecules over the observed spectra to determine the abundance of those molecules and the temperature and altitude of the atmospheric levels (Villanueva et al., 2018). For spectral modelling, the pressure levels of the vertical atmospheric structure ranged from 10 to 100 bar with 60 atmospheric layers (Moses, 2005). For the temperature profile, we used the disk-averaged retrieved result from Lellouch et al. (1984). We used the HITRAN molecular database for spectroscopic parameters to obtain the abundance of HCN from the western and eastern limbs of Saturn. For fitting the modelled spectra of atmospheric HCN over the observed spectra of HCN, we used the least-squares method, which is well described in Iino et al. (2020). During the spectral fitting, we used = 8.36 km s-1 for the western limb and = –9.26 kms-1 for the eastern limb, which occurred due to high-velocity stratospheric winds. After spectral fitting, the derived vertical mixing ratio (VMR) of HCN towards the western and eastern limbs of Saturn was 6.19 ppb and 2.90 ppb, respectively. The modelled fitted spectral line of HCN is shown in Figure 3. Earlier, Lellouch et al. (1984) simulated the VMR in the atmosphere of Saturn to be 3.58 ppb, which is nearly similar to our observed abundance of HCN in the atmosphere of Saturn.
3.4 Retrieval profile of HCN
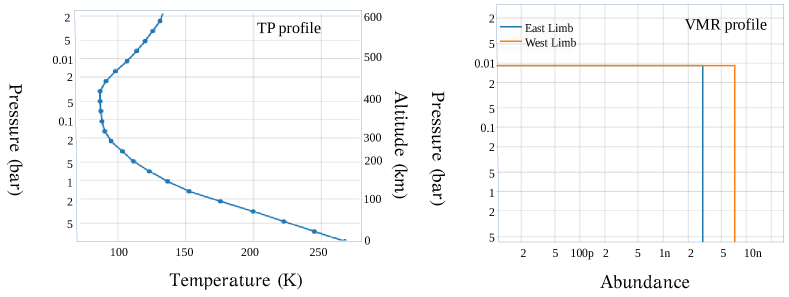
To understand the distribution of HCN in the atmosphere of Saturn, we computed the VMR retrival profile of HCN using the PSG. We used the optimal estimation method to compute the retrival model of HCN using the PSG. The pressure levels in the retrival profile were between 10 bar and 100 bar. The temperature profile derived from the disk-averaged result was obtained from Lellouch et al. (1984). For the vertical abundance profiles of CH4, C2H6, C2H2, NH3, and NH4SH, except for the HCN, we use default values available in PSG (Moses, 2005). During the VMR analysis of HCN, spectroscopic parameters of HCN are obtained from the HITRAN database. In the VMR retrival profile of the HCN on Saturn, we used 60 atmospheric layers in the PSG (Moses, 2005). To compute the retrival profile, we used the abundance of HCN at 6.19 ppb (western limb) and 2.90 ppb (eastern limb) in the PSG. In the retrival profile, we find that the VMR of HCN is saturated at a pressure level of 0.001 bar. This means that the HCN molecule is distributed up to 475 km in the stratosphere of Saturn. To understand the temperature of the HCN, we also generated the temperature-pressure (TP) retrival profile of Saturn within a pressure level of 10 bar to 100 bar using the PSG. The TP profile clearly shows that the temperature is saturated at a pressure level of 0.001 bar, and within this pressure level, the temperature varies between 100 and 250 K. The TP and VMR retrival profiles of the HCN in the atmosphere of Saturn are shown in Figure 4.
3.5 Spatial distribution of HCN in Saturn
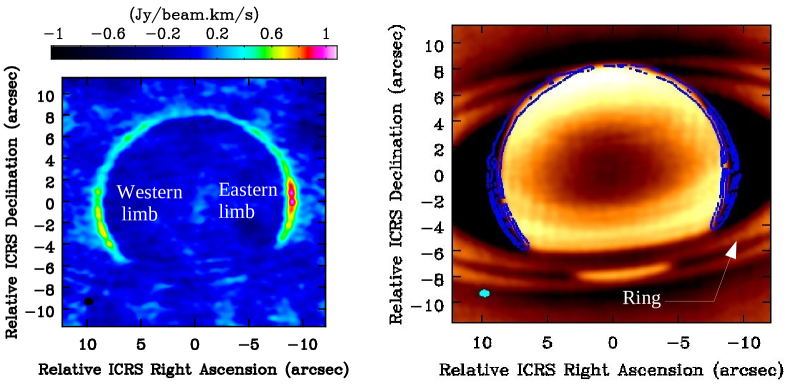
We create an integrated emission map of the HCN in Saturn using the task IMMOMENTS in CASA. Integrated emission maps are created by integrating the spectral data in the velocity range where the emission line of the HCN is detected. After the generation of the integrated emission map, we find that the emission line of HCN emit from the eastern and western limbs of Saturn. We overplot the integrated emission map of HCN over the 856.19 m continuum emission map of Saturn to determine the proper location of HCN emissions in Saturn. The integrated emission map and the overplotted map are shown in Figure 5. We observe the integrated map of HCN is resolved because the line emitting region is larger than synthesized beam of the integrated emission map.
3.6 Possible formation mechanism of HCN in the atmosphere of Saturn
Earlier, Tokunaga et al. (1981) claimed that the formation mechanism of HCN in the atmosphere of Saturn is similar to that of Jupiter. Tokunaga et al. (1981) stated that the photolysis of CH4 and NH3 is the most likely pathway for the formation of HCN in both Saturn and Jupiter. The laboratory experiment by Raulin et al. (1979) shows that HCN can be produced by photochemical reactions in a mixture of H2, CH4 and NH3 under ultraviolet light. During the experiment, Raulin et al. (1979) observed that NH3 abundance is low in the stratosphere of Jupiter, and most of the HCN is produced by photolysis reactions in the lower stratosphere and upper troposphere of Jupiter. If this mechanism holds true in Saturn’s atmosphere, the abundance of HCN in Saturn is lower than that in Jupiter because Saturn’s atmosphere contains a much lower abundance of NH3 (Encrenaz et al., 1974; Tokunaga et al., 1981). Tokunaga et al. (1981) calculated the mixing ratio of HCN in Jupiter’s atmosphere to be (0.9–4.2)10-9, and we calculated the mixing ratio of HCN in Saturn’s atmosphere to be (2.90–6.19) ppb. This comparison indicates that the abundance of HCN in the atmosphere of Saturn is slightly less than the abundance of HCN in the atmosphere of Jupiter. This implies that the laboratory experiment of Raulin et al. (1979) is valid in the atmosphere of Saturn, i.e. the HCN in the atmosphere of Saturn is produced by the photolysis of CH4 and NH3. Further photochemical modelling is needed to establish the most efficient pathways for the production of HCN in the atmosphere of Saturn.
4 Conclusion
In this letter, we analyzed the ALMA band 7 data for Saturn. The main results are as follows.
We successfully detected the rotational emission line of HCN with transition J = 4–3 from the atmosphere of Saturn using ALMA.
We observe that the emission line of the HCN mainly arises from the eastern and western limbs of Saturn.
The derived abundances of HCN in the western and eastern limbs were 6.19 ppb and 2.90 ppb, respectively. We also computed the TP and VMR retrival profiles using the PSG. After retrival analysis, we observed that the HCN is distributed up to 475 km in the stratosphere of Saturn. Similarly, from the TP profile, the temperature of HCN varied between 100 and 250 K.
We also discuss the possible formation mechanism of HCN towards Saturn and claim that the photolysis of CH4 and NH3 is responsible for the production of HCN.
ACKNOWLEDGEMENTS
AM acknowledges the Swami Vivekananda Merit-cum-Means Scholarship (SVMCM) for financial support for this research. This paper makes use of the following data: ADS /JAO.ALMA#2017.1.00636.S. ALMA is a partnership of ESO, NSF (USA), and NINS (Japan), together with NRC (Canada), MOST and ASIAA (Taiwan), and KASI (Republic of Korea), in cooperation with the Republic of Chile. The Joint ALMA Observatory is operated by ESO, AUI/NRAO, and NAOJ.
References
- Adriani et al. (2011) Adriani, A., Dinelli, B. M., López-Puertas, M., et al. 2011, Icar, 214, 584
- Catling & Kasting (2007) Catling, D., & Kasting, J. F. 2007, in Planetary Atmospheres and Life, ed. W. T. Sullivan, III & J. A. Baross (Cambridge: Cambridge Univ. Press), 91
- Cavalié et al. (2010) Cavalié, T., et al. 2010, A&A, 510, A88.
- Davies & Williams (1966) Davies, R. D., Williams, D., 1966, 14, 1,15
- Encrenaz et al. (1974) Encrenaz, TH., Owen, T., Woodman, J. H. 1974, A&A, 37, 49-55.
- Gronoff et al. (2009) Gronoff, G., Lilensten, J., Desorgher, L., & Fluckiger, E. 2009, A&A, 506, 955
- Gronoff et al. (2011) Gronoff, G., Mertens, C., Lilensten, J., et al. 2011, A&A, 529, A143
- Iino et al. (2020) Iino, T., Sagawa, H., Tsukagoshi, T., Nozawa, S., 2020, APJL, 903, L1
- Kaye & Strobel (1984) Kaye, J. A. and Strobel, D. F., 1984, Icarus, 59, 314
- Koskinen et al. (2011) Koskinen, T. T., Yelle, R. V., Snowden, D. S., et al. 2011, Icar, 216, 507
- Lewis (1980) Lewis, J. S. 1980, Icarus 43, 85-95
- Lellouch et al. (1984) Lellouch, E., Encrenaz, T., & Combes, F. 1984, A&A, 135, 371
- Lellouch et al. (2017) Lellouch, E., Gurwell, M., Butler, B., et al. 2017, Icar, 286, 289
- Miller (1957) Miller, S. L. 1957, Biochim. Biophys. Acta, 23, 480
- Moses (2005) Moses, J. I. 2005, JGRE, 110, E08001
- McMullin et al. (2007) McMullin, J. P., Waters, B., Schiebel, D., Young, W., & Golap, K. 2007, in Astronomical Society of the Pacific Conference Series, Vol. 376, Astronomical Data Analysis Software and Systems XVI, ed. R. A. Shaw, F. Hill, & D. J. Bell, 127
- Müller et al. (2005) Müller, H. S. P., SchlMder, F., Stutzki, J. & Winnewisser, G. 2005, Journal of Molecular Structure, 742, 215–227
- Magee et al. (2009) Magee, B. A., Waite, J. H., Mandt, K. E., et al. 2009, P&SS, 57, 1895
- Marten et al. (1993) Marten, A., Gautier, D., Owen, T., et al. 1993, ApJ, 406, 285
- Oró (1961) Oró, J. 1961, Nature, 191, 4794
- Perley & Butler (2017) Perley, R. A., Butler, B. J. 2017, ApJ, 230, 1538
- Pearce et al. (2019) Pearce, B. K. D., Ayers, P. W., & Pudritz, R. E. 2019, JPCA, 123, 1861
- Pearce et al. (2020) Pearce, B. K. D., Molaverdikhani, K., Pudritz, R. E., Henning, T., & Hébrard, E. 2020, Astrophys. J, 901, 110
- Pickett et al. (1998) Pickett, H. M., Poynter, R. L., Cohen, E. A., et al. 1998, Journal of Quantitative Spectroscopy and Radiative Transfer, 60, 883
- Raulin et al. (1979) Raulin, F., Bossard, A., Toupance, G., Ponnamperuma, C. 1979, Icarus 38, 358-366
- Rimmer & Rugheimer (2019) Rimmer, P. B., & Rugheimer, S. 2019, Icar, 329, 124
- Tokunaga et al. (1981) Tokunaga, A. T., Beck, S. C., Geballe, T. R., Lacy, J. H., & Serabyn, E. 1981, Icarus, 48, 283
- van der Tak et al. (2007) van der Tak, F. F. S., Black, J. H., Schöier, F. L., Jansen, D. J., van Dishoeck, E. F., 2007, A&A, 468, 2
- Villanueva et al. (2018) Villanueva, G. L., Smith, M. D., Protopapa, S., Faggi, S., & Mandell, A. M. 2018, JQSRT, 217, 86
- Vinatier et al. (2010) Vinatier, S., Bézard, B., Nixon, C. A., et al. 2010, Icar, 205, 559
- Vuitton et al. (2019) Vuitton, V., Yelle, R. V., Klippenstein, S. J., Horst, S. M., & Lavvas, P. 2019, Icar, 324, 120
- Woeller & Ponnamperuma (1969) Woeller, F., & Ponnamperuma, C,. 1969. Icarus 10, 386-392