Detection of Spin Coherence in Cold Atoms via Faraday Rotation Fluctuations
Abstract
We report non-invasive detection of spin coherence in a collection of Raman-driven cold atoms using dispersive Faraday rotation fluctuation measurements, which opens up new possibilities of probing spin correlations in quantum gases and other similar systems. We demonstrate five orders of magnitude enhancement of the measured signal strength than the traditional spin noise spectroscopy with thermal atoms in equilibrium. Our observations are in good agreement with the comprehensive theoretical modeling of the driven atoms at various temperatures. The extracted spin relaxation rate of cold rubidium atoms with atom number density 10cm3 is of the order of 20.5 kHz at 150 K, two orders of magnitude less than 250 kHz of a thermal atomic vapor with atom number density 10cm3 at 373 K.
pacs:
67.57.Lm; 32.80.PjThe prospects of non-invasive measurement schemes have found increasing research interests in the recent decades to detect equilibrium and non-equilibrium properties of microscopic and mesoscopic quantum systems Pezzè et al. (2018); Hammerer et al. (2010). The modern scientific disciplines, in particular, quantum information science Suter and Álvarez (2016), quantum sensing Degen et al. (2017) and metrology Mitchell and Palacios Alvarez (2020) can take advantage of the direct applications of these non-destructive measurements. Optical measurements employing dispersive light-matter interactions such as detecting the Faraday or Kerr rotation of an off-resonant probe light are examples of such measurements that disturb the measured samples minimally. The non-destructive optical Faraday and Kerr rotation measurements have been proposed and applied to a broad range of systems, including the read-out of a single electron’s spin state in a semiconductor quantum dot Bányai and Koch (1993); Atatüre et al. (2007); Mikkelsen et al. (2007) and the quantum gas microscope Yamamoto et al. (2017); Kristensen et al. (2017); Gajdacz et al. (2013); Yang et al. (2018); Meineke et al. (2012) for site-resolved imaging of single isolated atoms in an optical lattice.
In the absence of finite magnetization along the light propagation direction, the dynamical magnetic properties of the sample can be found from the temporal fluctuations of dispersive Faraday rotation. Such Faraday rotation noises have been extensively studied within the spin noise spectroscopy (SNS) Zapasskii (2013); Kozlov et al. (2021); Sinitsyn and Pershin (2016) technique to detect the intrinsic spin dynamics in atomic vapors Crooker et al. (2004); Swar et al. (2018); Lucivero et al. (2016); Tang et al. (2020), semiconductor heterostructures Oestreich et al. (2005), quantum dots Roy et al. (2013); Glazov (2013), spin-exchange collisions Roy et al. (2015a); Katz et al. (2015) and exciton-polaritons Glazov et al. (2013); Ryzhov et al. (2020). The SNS is also applied for precision magnetometry by using a spectral resolution of the spin noise signals from thermal atomic vapors Crooker et al. (2004); Swar et al. (2018) or semiconductors Ryzhov et al. (2016).
However, Faraday rotation fluctuation signals have not been detected so far in ultracold atoms and quantum gases, where direct measurement of spin fluctuations is predicted to be extremely useful in understanding quantum phases Recati and Stringari (2011); Altman et al. (2004); Roy et al. (2015b); Jepsen et al. (2020) and precision magnetometry Cohen et al. (2019); Gosar et al. (2021). Moreover, the cold atomic systems are ideal testbeds for demonstrating quantum effects due to their ultra-low temperatures Bloch et al. (2008).
In this Letter, we focus on detecting spin coherences in cold atoms using Faraday-rotation fluctuation measurements. We theoretically develop and experimentally realize this measurement method to demonstrate an enhancement of signal strength as much as 105 in thermal atoms, which allows us to detect spin coherence in ultracold atoms.
A pair of phase-coherent Raman radiation fields derived from an external cavity diode laser (ECDL) interacts with a -type three-level system (3LS) formed by two ground states , and one excited state as depicted in Fig. 1 and its inset. The frequency, intensity, and polarization of the Raman fields are controlled by separate acousto-optic modulators (AOMs) and wave-plates.
The semiclassical interaction Hamiltonian of the 3LS with the Raman fields can be written as Scully and Zubairy (1997):
| (1) |
where, we define the dipole transition operators of the 3LS by , , . Here, and are the resonant Rabi angular frequency of the Raman field 1 (R1) and Raman field 2 (R2), respectively. The detunings of the Raman fields from the related optical transitions are , , where is the angular frequency of the Raman field 1(2), and is that of the state . The symbols denote the polarizations (linear or circular) of the two Raman fields.
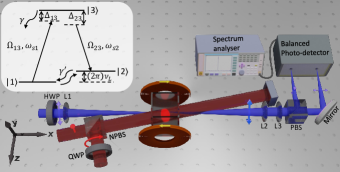
An off-resonant, linearly polarized probe laser field generated from another ECDL propagating along -direction dispersively detects the temporal fluctuations of the population between the Zeeman states within a ground hyperfine level of rubidium atoms. The measured temporal Faraday rotation fluctuations of the probe field are proportional to population fluctuations represented by a two-time correlation of density matrix coherence between these states in the laboratory frame. We write the power spectrum by taking the Fourier transform of such a correlation:
| (2) |
where the expectation is performed over equilibrium thermal noise.
In the absence of driving () by the Raman fields, the intrinsic spin noise (SN) power spectrum for the spontaneous fluctuations of the population in equilibrium is given by MS (2)
| (3) |
where is the relaxation rate from state to of the atoms and is the number of atoms in the observation region. is a Lorentzian centered around and with a full-width at half maximum (FWHM) of .
In the presence of the Raman fields, the atoms are driven out of equilibrium, and the population of the Zeeman states starts to oscillate coherently with increasing and . For a strong driving, the intrinsic fluctuations (related to equilibrium noise) form a broad background in the measured power spectrum. Therefore, we ignore the equilibrium noise in leading order to obtain a simple expression for the power spectrum of the strongly driven atoms at steady-state MS (2):
| (4) |
where . We can find a relatively simple formula for by choosing and :
| (5) |
in Eq. 4 shows a delta peak at , whose strength in Eq. 5 grows rapidly with increasing before saturating at large .
We first demonstrate the signal-strength enhancement with the Raman driving than the intrinsic SN signal (i.e., ) in thermal atomic vapor. A vapor cell containing 87Rb atoms and neon buffer gas is placed in a uniform magnetic field (along ) produced by a Helmholtz coil. We select here , and . We align the Raman fields with a small angle to the -axis to avoid them falling on the photo-detector.
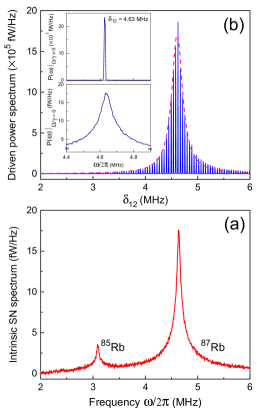
The probe laser field is detuned by 111The pressure broadened line-width, 1.79(0.02) GHz, measured by absorption spectroscopy from (D2) transition of 87Rb. The measured is presented in Fig. 2(a), which shows the Lorentzian FWHM of 150 kHz for 87Rb atoms in thermal equilibrium at T = 388 K. The details of the instrumentation used can be found in Swar et al. (2018); Mugundhan et al. (2021).
In presence of the Raman fields (), we observe an enhancement of , as shown in Fig. 2(b) 222Experimentally we observed a small but finite width ( 2 kHz) of the individual spectrum instead of the delta function as predicted in Eq. 4. This width is due to the relative frequency jitter of the two Raman fields derived from two independent AOMs. The peak height is maximum when (i.e., ), and it decreases with increasing . The envelope of the narrow peaks with varying , as shown in Fig. 2(b), has a Lorentzian form when . But it switches to a Gaussian shape for larger .
In the insets of Fig. 2(b), we show a comparison between the spectrum observed in the Raman-resonance condition for (top) and that at (bottom). An enhancement by 105 in the signal strength () has been observed for the driven system. In the subsequent experiments, we vary while keeping , and record a series of spectra shown in Fig. 2(b). These series of spectra span an envelope that is fitted by Eq. 5 (pink dashed line), which gives a peak position at and an envelope width of kHz.

The dependence of on can be understood by taking the Raman resonant limit () in Eq. 5, and we get
| (6) |
which shows that the coherence between the ground levels grows with increasing before saturating for higher . In order to measure , we vary the intensities of the Raman fields keeping . The polarization of the Raman fields are for the measurements presented in Fig. 2 (b) and Fig. 3, where the subscript 1(2) refers to R1 (R2), and -axis is the propagation direction of the Raman fields MS (2). The measured on-resonance peak strength as a function of is plotted in Fig. 3(a). The black triangles (blue circles) are the data corresponds to T = 373 K (393 K) of the cell. We fit these data by Eq. 6 (solid lines) keeping only as a free parameter. We extract the value of to be 2(957) kHz and 2(13615) kHz for 373 K and 393 K, respectively. We have separately measured the FWHM of the intrinsic SN spectrum to be 2(1263) kHz and 2(153.70.4) kHz for these temperatures, respectively. We attribute these small but finite (within 25 ) differences to two competing effects of different physical origins - the perturbation induced by the Raman driving to bring the atoms beyond thermal equilibrium and linear response, and the suppression of spin projection noise due to coherent coupling.
For a fixed , we vary and record the envelope of . We repeat these experiments for various values of and fit each spectrum with a Lorentzian function. The extracted FWHMs of the envelope for various are shown in Fig. 3(b). Black triangles (blue circles), shown in inset, are the extracted value of 2 after fitting the envelope with given in Eq. 5 for T = 373 K (393 K), respectively. The average value of , extracted from these measurements are 2(956) kHz and 2(13110) kHz for those two temperatures, respectively. In the measurements reported in Fig. 3(b) (inset), we notice consistently lower values of extracted 2 than the intrinsic measurements (), which indicates the spin projection noise suppression is more significant for these thermal vapors than the perturbation effects bringing the system beyond equilibrium.
We have further experimentally verified that the envelope FWHM can be smaller than the intrinsic width of SN spectrum (indicated by arrow at the bottom-left side of Fig. 3(b)). While this occurs only for when , it can also occur for when . We have detected as much as 15 reduction in the width of driven envelope than the intrinsic SN spectrum.
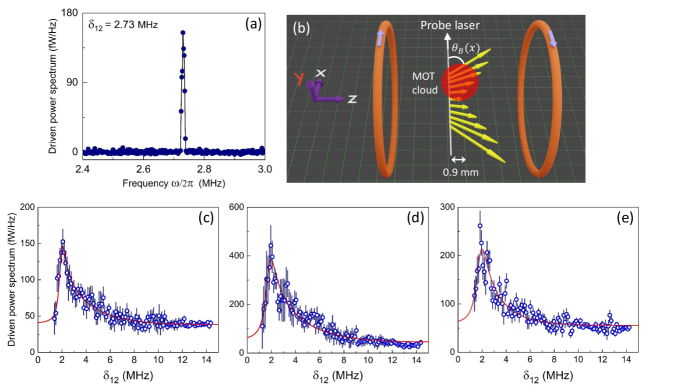
We next implement the coherent Raman drive technique in a magneto-optically trapped (MOT) cold 85Rb atomic cloud to extract the spin relaxation rate . To the best of our knowledge, this is the first detection of spin fluctuations in cold atoms using minimally invasive Faraday rotation fluctuation measurement. Our experimental system typically traps more than 107 atoms at a temperature of 15010 K in a standard vapor loaded MOT with a typical Gaussian width of 4 mm. We take sufficient care to ensure that the center of the atomic cloud is overlapped with the zero of the quadrupole trapping field within 30 m. More details about the experimental system are provided in MS (2). Additionally, we align a pair of Raman fields with waist diameter of 6 mm, blue detuned by 2 (6.1 MHz) from (D2) transition. A collimated probe laser field along with a waist diameter 70 m and blue detuned by 20 is sent through the cold atomic cloud (see Fig. 1). The probe beam position from the cloud center is independently measured using high precision absorption spectroscopy and absorption imaging within a precision of 10 m. The quadrupole magnetic field profile creating the MOT is separately characterized using a Hall magnetometer probe, and it is shown schematically in Fig. 4(b).
To measure at a finite Larmor frequency in the presence of the Raman fields, we have shifted the probe laser by 900 m in -direction on x-z plane from the trap center. Also, due to the Raman beams, the cloud center shifts in -direction depending on the Raman beam intensity and the detuning (see Fig. 4(b)). In Fig. 4(a), we show a representative spectrum detected in this condition at MHz for . In the absence of Raman fields - unlike in the vapor case - we do not observe any detectable intrinsic SN signal due to the fact that the total number of atoms within the probe field is 104 times less than that of thermal vapor around 373 K.
We record a series of by varying . For a fixed value of and probe beam position, we obtain a composite spectra (see Fig. 4(c)) by repeating the above procedure and recording the peak height of each individual . We analyze our experimental results using the earlier modeling for thermal vapors after including corrections due to magnetic field variations, atom density distributions, and multilevel contributions MS (2). We fit the data in Fig. 4(c) (solid red line) with a free parameter . We get an estimate for the value of 2 from this fitting as 2 = 2(1.0 0.7) kHz.
We have repeated the above measurements for various -position of the probe laser. Another representative data is shown in Fig. 4(d) for = 700 m, which gives 2 = 2(2.3 0.9) kHz. We have also performed the experiment in the presence of balanced Raman fields, which minimize the shift of the cloud center as shown in Fig. 4(e). The extracted value of 2 is 2(1.3 0.6) kHz. Our present experiment is limited by several factors, e.g., magnetic field inhomogeneity, off-resonant scattering, the effect of strong driving fields, and relative frequency stability of the Raman fields, which can significantly change the measured spin relaxation rate. At this low temperature (150 K), the above perturbation effects are typically far more important than the suppression of spin projection noise discussed earlier. Nevertheless, the observed reduction in extracted spin relaxation rate by two orders of magnitude than the thermal atoms is in expected lines, which can be attributed to the six-order lowering of the temperature that substantially reduces thermal coupling, collisions, and transit times.
In conclusion, we report relatively non-invasive detection of spin coherence in cold atoms driven coherently by Raman fields. Such detection method can have significant potential applications for precision magnetometry, high-resolution imaging, non-perturbative probing of quantum phase transitions in cold atoms and other similar systems, e.g., cold ions, cold molecules, etc.
This work was partially supported by the Ministry of Electronics and Information Technology (MeitY), Government of India, through the Center for Excellence in Quantum Technology, under Grant4(7)/2020-ITEA. S. R acknowledges funding from the Department of Science and Technology, India, via the WOS-A project grant no. SR/WOS-A/PM-59/2019. We acknowledge Hema Ramachandran, Fabien Bretenaker, Priyanka G.L., Meena M.S., Sagar Sutradhar, Snehal Dalvi and RRI workshop for instruments, discussions and technical assistance.
References
- Pezzè et al. (2018) L. Pezzè, A. Smerzi, M. K. Oberthaler, R. Schmied, and P. Treutlein, Rev. Mod. Phys. 90, 035005 (2018).
- Hammerer et al. (2010) K. Hammerer, A. S. Sørensen, and E. S. Polzik, Rev. Mod. Phys. 82, 1041 (2010).
- Suter and Álvarez (2016) D. Suter and G. A. Álvarez, Rev. Mod. Phys. 88, 041001 (2016).
- Degen et al. (2017) C. L. Degen, F. Reinhard, and P. Cappellaro, Rev. Mod. Phys. 89, 035002 (2017).
- Mitchell and Palacios Alvarez (2020) M. W. Mitchell and S. Palacios Alvarez, Rev. Mod. Phys. 92, 021001 (2020).
- Bányai and Koch (1993) L. Bányai and S. W. Koch, Semiconductor Quantum Dots (World Scientific, 1993).
- Atatüre et al. (2007) M. Atatüre, J. Dreiser, A. Badolato, and A. Imamoglu, Nat. Phys. 3, 101 (2007).
- Mikkelsen et al. (2007) M. H. Mikkelsen, J. Berezovsky, N. G. Stoltz, L. A. Coldren, and D. D. Awschalom, Nat. Phys. 3, 770 (2007).
- Yamamoto et al. (2017) R. Yamamoto, J. Kobayashi, K. Kato, T. Kuno, Y. Sakura, and Y. Takahashi, Phys. Rev. A 96, 033610 (2017).
- Kristensen et al. (2017) M. A. Kristensen, M. Gajdacz, P. L. Pedersen, C. Klempt, J. F. Sherson, J. J. Arlt, and A. J. Hilliard, J. Phys. B 50, 034004 (2017).
- Gajdacz et al. (2013) M. Gajdacz, P. L. Pedersen, T. Mørch, A. J. Hilliard, J. Arlt, and J. F. Sherson, Rev. Sci. Instrum. 84, 083105 (2013).
- Yang et al. (2018) D. Yang, C. Laflamme, D. V. Vasilyev, M. A. Baranov, and P. Zoller, Phys. Rev. Lett. 120, 133601 (2018).
- Meineke et al. (2012) J. Meineke, J.-P. Brantut, D. Stadler, T. Müller, H. Moritz, and T. Esslinger, Nat. Phys. 8, 454 (2012).
- Zapasskii (2013) V. S. Zapasskii, Adv. Opt. Photon. 5, 131 (2013).
- Kozlov et al. (2021) G. G. Kozlov, A. A. Fomin, M. Y. Petrov, I. I. Ryzhov, and V. S. Zapasskii, Opt. Express 29, 4770 (2021).
- Sinitsyn and Pershin (2016) N. A. Sinitsyn and Y. V. Pershin, Rep. Prog. Phys. 79, 106501 (2016).
- Crooker et al. (2004) S. A. Crooker, D. G. Rickel, A. V. Balatsky, and D. L. Smith, Nature 431, 49 (2004).
- Swar et al. (2018) M. Swar, D. Roy, D. D, S. Chaudhuri, S. Roy, and H. Ramachandran, Opt. Express 26, 32168 (2018).
- Lucivero et al. (2016) V. G. Lucivero, R. Jiménez-Martínez, J. Kong, and M. W. Mitchell, Phys. Rev. A 93, 053802 (2016).
- Tang et al. (2020) Y. Tang, Y. Wen, L. Cai, and K. Zhao, Phys. Rev. A 101, 013821 (2020).
- Oestreich et al. (2005) M. Oestreich, M. Römer, R. J. Haug, and D. Hägele, Phys. Rev. Lett. 95, 216603 (2005).
- Roy et al. (2013) D. Roy, Y. Li, A. Greilich, Y. V. Pershin, A. Saxena, and N. A. Sinitsyn, Phys. Rev. B 88, 045320 (2013).
- Glazov (2013) M. M. Glazov, J. Appl. Phys. 113, 136503 (2013).
- Roy et al. (2015a) D. Roy, L. Yang, S. A. Crooker, and N. A. Sinitsyn, Sci. Rep. 5, 9573 (2015a).
- Katz et al. (2015) O. Katz, O. Peleg, and O. Firstenberg, Phys. Rev. Lett. 115, 113003 (2015).
- Glazov et al. (2013) M. M. Glazov, M. A. Semina, E. Y. Sherman, and A. V. Kavokin, Phys. Rev. B 88, 041309 (2013).
- Ryzhov et al. (2020) I. I. Ryzhov, V. O. Kozlov, N. S. Kuznetsov, I. Y. Chestnov, A. V. Kavokin, A. Tzimis, Z. Hatzopoulos, P. G. Savvidis, G. G. Kozlov, and V. S. Zapasskii, Phys. Rev. Res. 2, 022064 (2020).
- Ryzhov et al. (2016) I. I. Ryzhov, G. G. Kozlov, D. S. Smirnov, M. M. Glazov, Y. P. Efimov, S. A. Eliseev, V. A. Lovtcius, V. V. Petrov, K. V. Kavokin, A. V. Kavokin, and V. S. Zapasskii, Sci. Rep. 6, 21062 (2016).
- Recati and Stringari (2011) A. Recati and S. Stringari, Phys. Rev. Lett. 106, 080402 (2011).
- Altman et al. (2004) E. Altman, E. Demler, and M. D. Lukin, Phys. Rev. A 70, 013603 (2004).
- Roy et al. (2015b) D. Roy, R. Singh, and R. Moessner, Phys. Rev. B 92, 180205 (2015b).
- Jepsen et al. (2020) P. N. Jepsen, J. Amato-Grill, I. Dimitrova, W. W. Ho, E. Demler, and W. Ketterle, Nature 588, 403 (2020).
- Cohen et al. (2019) Y. Cohen, K. Jadeja, S. Sula, M. Venturelli, C. Deans, L. Marmugi, and F. Renzoni, Appl. Phys. Lett. 114, 073505 (2019).
- Gosar et al. (2021) K. Gosar, T. Arh, T. Mežnaršič, I. Kvasič, D. Ponikvar, T. Apih, R. Kaltenbaek, R. Žitko, E. Zupanič, S. Beguš, and P. Jeglič, Phys. Rev. A 103, 022611 (2021).
- Bloch et al. (2008) I. Bloch, J. Dalibard, and W. Zwerger, Rev. Mod. Phys. 80, 885 (2008).
- Scully and Zubairy (1997) M. Scully and M. Zubairy, Quantum Optics (Cambridge University Press, 1997).
- MS (2) “See the supplemental material for a description of the experimental set-up, details of the theoretical modeling, simulation and data analysis, dependence of driven power spectrum strength on raman fields’ polarization and the raman coherence in local quantization field orientation.” .
- Note (1) The pressure broadened line-width, 1.79(0.02) GHz, measured by absorption spectroscopy.
- Mugundhan et al. (2021) V. Mugundhan, M. Swar, S. Bhar, and S. Chaudhuri, IEEE Transactions on Instrumentation and Measurement 70, 1 (2021).
- Note (2) Experimentally we observed a small but finite width ( 2 kHz) of the individual spectrum instead of the delta function as predicted in Eq. 4. This width is due to the relative frequency jitter of the two Raman fields derived from two independent AOMs.