On User Interfaces for Large-Scale Document-Level
Human Evaluation of Machine Translation Outputs
Abstract
Recent studies emphasize the need of document context in human evaluation of machine translations, but little research has been done on the impact of user interfaces on annotator productivity and the reliability of assessments. In this work, we compare human assessment data from the last two WMT evaluation campaigns collected via two different methods for document-level evaluation. Our analysis shows that a document-centric approach to evaluation where the annotator is presented with the entire document context on a screen leads to higher quality segment and document level assessments. It improves the correlation between segment and document scores and increases inter-annotator agreement for document scores but is considerably more time consuming for annotators.
1 Introduction
Recently, several studies have suggested that document context is required for the reliable human evaluation of machine-translated documents Castilho et al. (2020); Laubli et al. (2020). With the improved performance of neural machine translation systems (NMT) over the past years, this is particularly important when assessing the potential for human parity or super-human performance of MT systems Läubli et al. (2018); Toral et al. (2018). Following these recommendations, the WMT Conference on Machine Translation111http://www.statmt.org/wmt20/ has moved towards adopting and presenting document context in their human evaluation campaigns of 2019 and 2020 Barrault et al. (2019, 2020). The WMT campaigns are the largest academic efforts on human evaluation of machine-translated news articles in the field, running yearly since 2007.
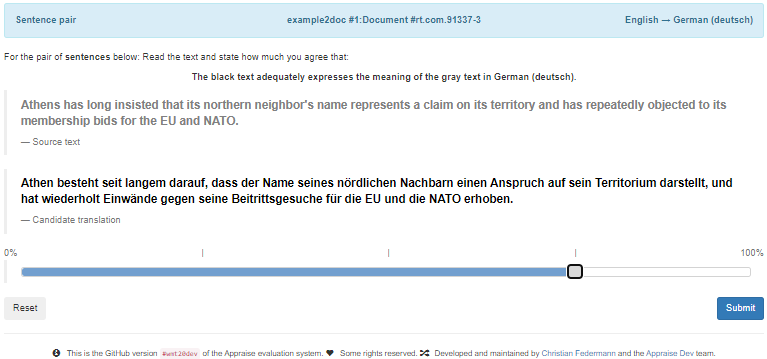
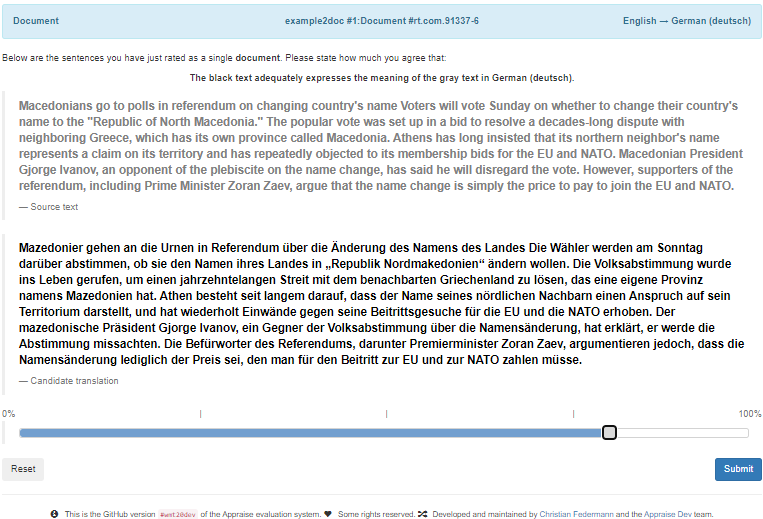
At WMT19, the previous segment-level direct assessment evaluation Bojar et al. (2017, 2018) — where translated segments were presented to evaluators222In this work, we use the terms evaluator and annotator interchangeably. in random order — was extended by introducing “segment ratings with document context” Barrault et al. (2019), and assessments of both, individual segments and entire documents, were collected. In this approach, segments from a single document translated by the same MT system were provided sequentially to evaluators in the order as they appear in the document, only one segment shown at a time (Fig. 1(a)), followed by the entire document comprised of already scored segments (Fig. 1(b)). WMT 2020 Barrault et al. (2020) implemented a more document-centric approach, displaying the full translated document on a single screen (Fig. 1(c)) for most of the out-of-English language pairs.
While the change was primarily about the user interface (UI), we believe it can impact the quality of document-level evaluation to a large extent. Toral (2020) has noticed potential issues arising from the limited inter-sentential context in the WMT19 method, in which the evaluator does not have continuous access to all segments from the document. Unable to revisit previous sentences and never seeing subsequent sentences, the evaluator might forget or lack access to important details necessary to rate the current segment. On the other hand, displaying a long document on a screen can notably increase cognitive load, potentially lowering reliability of assessments over time Gonzalez et al. (2011), and increase annotation time and costs, especially at the scale of the WMT evaluation campaigns.
In this work, we compare human assessment scores collected during the last two WMT evaluation campaigns and analyze the impacts of the user interface changes between these campaigns. We also attempt to determine whether switching to the document-centric UI was an improvement to the human evaluation procedure and should be adopted in future editions of WMT for all language pairs. We examine if and to what extent human raters make use of the document context, estimate the reliability of document ratings collected through both interfaces, and study potential additional costs resulting from the document-centric evaluation at a large scale.
2 Document context in human evaluation of MT outputs
Recent research emphasized the importance of document context in human evaluation of machine translation, especially in terms of accessing potential human parity or super-human performance Läubli et al. (2018); Toral et al. (2018); Graham et al. (2020); Toral (2020).
Several works have compiled sets of recommendations for document-level evaluation. For example, Laubli et al. (2020) recommend evaluation of documents instead of independent sentences as translators tend to judge machine translation more favourably if they cannot identify errors related to textual coherence and cohesion due to lack of context. Castilho et al. (2020) have examined the necessary context span needed for evaluation across different domains, and for relatively short documents like news articles, the authors recommend presenting the whole document during the assessment of individual segments. Using document context has also been recommended by Toral (2020) who reported that this information was needed for evaluators to rank systems in a contrastive evaluation setting. Having the text available during the assessment of fluency or adequacy might be essential for some evaluators who spend more time reading than assessing Castilho (2020).
Although the literature is consistent about the need of document context in human evaluation of MT, little research has been done on the impact of experimental design and user interfaces on annotator productivity and the reliability of assessments in this context. The existing research on experimental designs for machine translation evaluation focuses on contrasting direct assessments with pairwise rankings Novikova et al. (2018); Sakaguchi and Van Durme (2018) and not on the optimal presentation of the document-level information. However, even the simple UI design decision of aligning document translations on the sentence level impacts efficiency of some evaluators Popović (2020). With this work, we want to promote that direction of research.
3 Document-level human evaluation campaigns at WMT
During the WMT evaluation campaigns of 2019 and 2020, segment and document-level assessments of document translations were collected, but using different methods and thus user interfaces. Both were implemented in the Appraise evaluation framework Federmann (2018) as a source-based direct assessment task Graham et al. (2013); Cettolo et al. (2017), i.e. all segments and entire documents were judged on a continuous scale between 0 and 100 by bilingual annotators.
3.1 The WMT19 interface
At WMT19, the evaluation of a translated document consisted of two parts: first, an evaluator would rate all individual segments in a document translated by one MT system, one by one, in the order they appear in the document, followed by assigning a single score to the whole document. Evaluators would be presented with the translation of a single segment (a source sentence and its translation) per screen, or the translation of the entire document. Figures 1(a) and 1(b) depict segment-level and document-level portions of the interface, respectively.
This method was a simple document-level extension of the purely segment-level evaluations hosted during the previous editions of the WMT evaluation campaigns and did not require significant changes to the UI. A consequence of this approach was limited inter-sentential context as discussed by Toral (2020), since evaluators could not revisit the previously rated segments nor see subsequent ones. A rating decision could not be corrected in the light of the later-revealed context.
3.2 The WMT20 interface
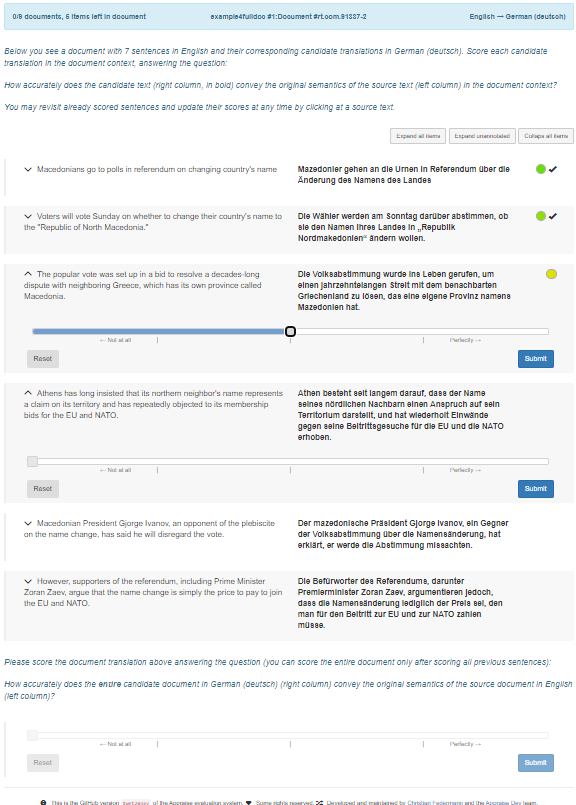
At WMT20, both segment-level and document-level evaluations were performed on one screen. An evaluator would be presented with a translation of the entire document produced by one MT system. The document and its translation would be placed on a single vertically scrollable screen in two columns with source sentences on the left and their machine-translated counterparts on the right, aligned at segment-level. Figure 1(c) depicts a screenshot of this interface.
In the default scenario, the evaluator would be rating individual segments sequentially and, after rating all segments, on the same screen, the evaluator would rate the translation of the entire document at the bottom of the screen. Evaluators could, however, re-visit and update scores of previously rated segments at any time while still assessing the given document. They could also expand all sliders individually or in full, allowing them to take in all previously assigned scores.
4 Human assessment data
| Statistic | WMT19 | WMT20 | |
|---|---|---|---|
| All | Languages | cs, de, fi, gu | cs, de, iu, jp |
| kk, lt, ru, zh | pl, ru, ta, zh | ||
| Annotators | 1,271 | 1,213 | |
| Seg. judgements | 207,916 | 186,813 | |
| Doc. judgements | 12,907 | 13,790 | |
| L4 | Languages | cs, de, ru, zh | cs, de, ru, zh |
| Annotators | 779 | 746 | |
| Seg. judgements | 127,178 | 115,571 | |
| Doc. judgements | 7,894 | 10,019 |
| WMT19 | WMT20 | ||||
| Avg. | Std. | Avg. | Std. | (%) | |
| Annotation time for a task (200 seg.) | 1:06:08 | 21:47 | 1:51:09 | 51:12 | +68.1 |
| Total time for documents 10 seg. | 02:02 | 01:00 | 02:48 | 01:44 | +37.1 |
| Total time for documents 20 seg. | 06:54 | 02:48 | 12:01 | 07:53 | +74.0 |
| Time for 1st half of documents | 02:06 | 01:09 | 02:44 | 02:05 | +30.5 |
| Time for 2nd half of documents | 01:50 | 00:58 | 01:53 | 01:22 | +2.4 |
| Time for first 3 seg. in documents | 00:52 | 00:24 | 01:26 | 01:02 | +66.3 |
| Time for last 3 seg. in documents | 00:42 | 00:18 | 00:51 | 00:30 | +20.4 |
| Time for single segment score | 00:16 | 00:06 | 00:24 | 00:13 | +47.4 |
| Time for single document score | 00:12 | 00:09 | 00:06 | 00:04 | -42.7 |
In our experiments, we utilize the human assessment data collected at the WMT19 and WMT20 evaluation campaigns. We limit the data to out-of-English language pairs as the into-English evaluation at WMT20 was done using the WMT19 method of reference-based DA and assessed by crowd workers instead of translators and researchers. Each annotator account provided 200 segment-level scores, and a number of document-level scores depending on the length of documents in the annotator’s sample. From our analysis, we exclude all documents that contain one or more quality control segments, which constitute about 12% of all segments.333Please refer to Barrault et al. (2020) for more details on the quality control methods used at WMT.
We use similar amounts of assessments from both campaigns, as seen in Table 1: WMT19 provided 208K segment and 13K document ratings, while 187K and 14K were collected for WMT20, respectively. We either compare data collected for all eight languages in each campaign or only subsets from four languages that were present in both years, i.e. Czech, German, Russian, and Chinese, minimizing differentiation factors between the data. Note that the WMT19 and WMT20 assessment data concern disjoint sets of segments as different test sets and MT systems were evaluated in both campaigns. We are interested in general patterns in the data at a larger scale, so we do not perceive this as an issue, but are aware of the fact in our conclusions. In a more ideal situation, we would have been able to perform A/B testing of different interfaces at the same campaign, but this was not an available option during the actual campaigns.
5 Experiments on WMT data
We aim at comparing the WMT19 and WMT20 interfaces for segment and document-level human assessments of MT outputs by analyzing the data that has been collected using both methods. We analyze annotation times, compare correlations of document and averaged segment ratings, and examine the inter-annotator agreement.
5.1 Annotation times
We analyze annotation times to examine if and to what extent document context is used by annotators if it is available to them during assessment of individual segments.
In both interfaces, two timestamps were collected for each segment or document. In WMT19, timestamps were recorded when a new page opened and when an annotator submitted a score. In the WMT20 document-level interface timestamps were recorded when a segment was (automatically or manually) expanded and when a score was submitted. Note that in the WMT20 campaign, annotators see all segments during the assessment of the document and can read ahead even before the first timestamp is collected. This could make the collected annotation times for WMT20 slightly less reliable.
We report annotation time statistics only for evaluators who completed their task consisting of 200 segments (74% of evaluators at WMT19 and 84% at WMT20). Very quickly annotated items indicate users who potentially gamed the task and assigned random scores. Items that took an excessive amount of time were likely interrupted with unrelated activity or otherwise idle. In order to account for these situations, we remove data points with values smaller than the 10th percentile or larger than the 90th percentile. The results are shown in Table 2.
Our observations are as follows:
-
•
Providing the full document context increases the total annotation time per task by 68% on average. This suggests that annotators do read the context and use it during assessments. Significantly increased annotation time raises the question about cost efficiency of the document-centric evaluations.
-
•
The more context is available, the more time annotators spend on studying it: during WMT20, annotators spent 74% more time on documents with 20 or more segments than on documents of similar length during WMT19, whereas the per-document annotation time for shorter documents with 10 or fewer segments increased by only 37%.
-
•
Comparing the average annotation times for segments from the beginning of the document with those farther into the documents, we can see that with the WMT20 interface annotators significantly increase the pace of annotation throughout the assessment of segments in a document. this is much less prominent for WMT19, which suggests that annotators do read the context ahead before making assessments Castilho (2020) and that they can memorize and make better use of the preceding context if it is available to them at all time.
As described in Section 3, the new interface allowed annotators to revise any segment score in a document before submitting the document score. We found that annotators did not use this feature often, and only 1.9% segment-level scores were revised, which resulted in 9.0% documents with one or more revised scores.
These observations suggest that annotators do make use of the available context and spend additional time studying it. Whether using that context results in more reliable quality assessments at segment and document level remains however unanswered.
5.2 Correlation of document and segment-level judgements
| Aggregation | WMT19 | WMT20 | |
|---|---|---|---|
| Avg. seg. score | 0.907 | 0.923 | 0.016 |
| Min. seg. score | 0.723 | 0.736 | 0.013 |
| Max. seg. score | 0.584 | 0.628 | 0.044 |
| Avg. of first 5 seg. | 0.845 | 0.861 | 0.015 |
| Avg. of last 5 seg. | 0.883 | 0.899 | 0.016 |
| Avg. short doc. 1st half | 0.827 | 0.841 | – |
| Avg. short doc. 2nd half | 0.887 | 0.901 | – |
| Avg. long doc. 1st half | 0.868 | 0.893 | – |
| Avg. long doc. 2nd half | 0.894 | 0.909 | – |
| Aggregation | WMT19 | WMT20 | |
|---|---|---|---|
| Avg. seg. score | 0.862 | 0.919 | 0.057 |
| Min. seg. score | 0.658 | 0.761 | 0.103 |
| Max. seg. score | 0.520 | 0.648 | 0.128 |
| Avg. of first 5 seg. | 0.786 | 0.865 | 0.078 |
| Avg. of last 5 seg. | 0.830 | 0.903 | 0.073 |
We measure the similarity between document-level scores and aggregated segment-level scores using different statistics, for example an average, from the same documents. We use the Pearson coefficient as the correlation measure Freedman et al. (2007). We hypothesize that an increased correlation may be contributed to an improved capability of the user interface for reliable assessment of document translations by annotators.
Our main results are presented in Table 3 and Figure 2. We excluded all documents that contained one or more segments used for quality control (26% and 22% for WMT19 and WMT20, respectively) before computing the correlation statistics. We did not exclude scores from users who did not pass the quality control as this is not practiced by the WMT organizers when computing human rankings of MT systems for out-of-English languages. These users contributed only a small fraction of the data and excluding their scores does not meaningfully change the results. The scores were not standardized prior to computation.
We observe the following effects of the WMT20 interface compared to the WMT19 interface:
-
•
We can see consistently higher correlations between document-level scores and all tested aggregations of segment-level scores for WMT20. This effect is even more prominent on the four common language pairs used in both campaigns.
-
•
Document-level scores show the highest correlation with the averaged segment-level scores. The very high correlation of 0.92 indicates that the average of segment ratings from a document might be used as a reasonable approximation of the final document ratings in the document-centric evaluation. This might justify dropping the final document score from the assessment.
-
•
The lowest segment score in documents correlates better with the overall document score than the highest segment score (Min. seg. vs Max. seg.). Intuitively, badly translated segments may impact the overall perception of the document quality more than higher-quality segment translations, or this could be attributed to the fact that shorter sentences are more likely to be translated correctly, but annotators may not see them as contributive to the overall document translation quality as longer sentences.
-
•
Regardless of the user interface, segments from the end of a document influence assessment of the entire document more than segments from the beginning of the document (Avg. of first 5 vs Avg. of last 5). From this, we do not observe that showing segments sequentially penalizes the very first segments in the document in contributing to the overall document score. However, the comparison of correlations for short and long documents (up to 10 segments, or more than 20 segments; bottom part of Table 3(a)) reveals that WMT20 seems to improve the contribution of early segments to the document score for long documents.
-
•
In Figure 2, we computed correlations for averaged segment-level scores in relation to the number of segments in documents. Interestingly, for WMT20, the correlation increases for the longest documents (more than 25 segments).
The same trends are observed if Spearman’s or Kendall’s rank correlation coefficients are used instead of Pearson’s correlation coefficient.
5.3 Inter-annotator agreement
| Doc. scores | Avg. seg. scores | |||||
| WMT19 | WMT20 | WMT19 | WMT20 | |||
| 5 | 0.110 | 0.118 | 0.007 | 0.148 | 0.132 | -0.016 |
| 10 | 0.195 | 0.215 | 0.020 | 0.290 | 0.254 | -0.036 |
| 15 | 0.280 | 0.333 | 0.053 | 0.433 | 0.390 | -0.044 |
| 20 | 0.378 | 0.443 | 0.065 | 0.560 | 0.514 | -0.046 |
| 25 | 0.481 | 0.554 | 0.073 | 0.669 | 0.634 | -0.035 |
| 30 | 0.559 | 0.639 | 0.080 | 0.760 | 0.737 | -0.023 |
| Documents | 12,907 | 13,790 | ||||
| Distinct documents | 10,132 | 7,020 | ||||
| With multiple judgements | 26.2% | 66.1% | ||||
| Doc. scores | Avg. seg. scores | |||||
| WMT19 | WMT20 | WMT19 | WMT20 | |||
| 5 | 0.115 | 0.124 | 0.009 | 0.182 | 0.144 | -0.039 |
| 10 | 0.202 | 0.226 | 0.024 | 0.329 | 0.272 | -0.057 |
| 15 | 0.302 | 0.343 | 0.040 | 0.481 | 0.406 | -0.075 |
| 20 | 0.403 | 0.456 | 0.053 | 0.637 | 0.536 | -0.101 |
| 25 | 0.509 | 0.569 | 0.059 | 0.756 | 0.657 | -0.100 |
| 30 | 0.580 | 0.648 | 0.068 | 0.851 | 0.753 | -0.098 |
| Documents | 7,894 | 10,019 | ||||
| Distinct documents | 6,376 | 4,798 | ||||
| With multiple judgements | 23.0% | 74.3% | ||||
We compute annotator agreement as a measure of reliability between annotators with Cohen’s kappa coefficient Cohen (1960)
where is the observed proportion of times that two annotators agree, and is the expected mean proportion of agreement due to chance. Values of close to 0 are interpreted as no agreement and is equal to 1 if there is perfect agreement.
is computed from pairwise comparisons of all documents that have been annotated by two or more annotators by counting the proportion of times that two annotators agree on the score.444If a document is annotated by more than two annotators, pairwise comparisons between all annotators are counted. It is assumed that two annotators agree if their assigned scores and differ no more than a predefined tolerance , i.e. .
| 5 | 10 | 15 | 20 | 25 | 30 | |
|---|---|---|---|---|---|---|
| 0.107 | 0.199 | 0.286 | 0.368 | 0.445 | 0.517 |
is constant for a given and computed as the sum of probabilities of randomly assigning a score within the tolerance (inclusive) over all possible scores from 1 to 100, i.e.:
Examples of for different are presented in Table 5.
We compute inter-annotator agreement (IAA) for , and compare agreement for document-level and averaged segment-level scores, presenting the results in Table 4. Since there are very few annotators who have annotated the same documents more than once, we do not compute document-level intra-annotator agreement.
Here, our main observations are as follows:
-
•
Obviously, the larger the tolerance , the higher the agreement. Because the average difference of document-level and segment-level scores for documents assessed multiple times is between 15.0 and 19.6 (not shown in the table), we can assume that a value of 15 or 20 is the most reasonable. In this case, the inter-annotator agreement is fair or sometimes moderate according to the recommended interpretation scale proposed by Landis and Koch (1977).
-
•
For both methods, agreement for document-level scores is lower than for segment-level scores. This confirms the finding of Castilho (2020) that document-level evaluation efforts where annotators assign one score per document leads to lower levels of inter-annotator agreement for adequacy when compared to segment-level evaluation. In contrary to that work, our analysis is done at a much larger scale and for multiple language pairs.
-
•
Inter-annotator agreement of document-level scores is higher for WMT20 than for WMT19 (4th column). Interestingly, the opposite is true for averaged segment-level scores (7th column), and it is even more prominent for the subset of four common languages. We will discuss this some more in Section 6.
-
•
As shown in Figure 3, inter-annotator agreement decreases with increasing document length for WMT20, but it flattens for the longest documents in the case of WMT19.
6 Discussion
In the presented experiments, we have observed interesting differences in correlation and inter-annotator agreement for long documents. In WMT19, for long documents, the correlation between segment-level scores and document-level scores significantly decreases, while IAA flattens out and eventually ends up being higher than for WMT20. We think this might be an effect of cognitive overload when annotators are presented with long document translation text pairs without visual help in the form of sentence alignment and similar hints.555See the example on Figure 1(b) consisting only of 6 segments. A thoughtful evaluation of an article with 20 or more segments would appear even more challenging. A large wall of text might discourage annotators and they might fall back to assigning default or less diverse “safe” scores. Analyzing annotation times in relation to the document length, presented in Figure 4 supports this explanation. The average time of document ratings flattens for documents longer than 20 segments for WMT19, while it increases for WMT20.
Another non-intuitive observation we have made is that the inter-annotator agreement for averaged segment scores is higher in WMT19 than in WMT20. The agreement for document scores is, as expected, consistently higher for WMT20. If this is not solely attributed to the different data sets used in both campaigns, we would explain it by a tendency of annotators to assign higher scores if they cannot identify errors due to insufficient context Laubli et al. (2020), which may occur for WMT19 because of its limited inter-sentential context. Another explanation would be that the WMT20 interface presenting all sentences from the document at once, encourages annotators to assign more diversified scores across segments; this may then lower the agreement at segment level. However, we were not able to confirm this based on an analysis of histograms of segment scores and their standard deviations.
Our study is conducted post-hoc, i.e. we cannot test for scenarios that were not anticipated during the actual evaluation campaigns. A more conclusive interpretation would require A/B testing with the same sets of documents, translations and annotators used for both evaluation methods. Nevertheless, we think that the presented comparison of two WMT evaluation campaigns supports the assumption that the document-centric evaluation conducted during WMT20 produced more reliable document ratings. We believe this to be an important finding because higher quality of collected document assessments should help to avoid statistical issues arising from low statistical power as observed by Graham et al. (2020).
7 Summary
In this work, we have compared two methods for document-level human evaluation of MT outputs through an analysis of the large-scale human assessment data from WMT evaluation campaigns, consisting of 8 different out-of-English language pairs. Our main findings are:
-
•
Showing the entire document can extend the annotation time of individual segments by as much as 68% — presumably because annotators make use of the available context during evaluation.
-
•
Annotators rarely change their segment-level ratings even if this option is available to them. Nevertheless, in some instances they do.
-
•
Annotators tend to rate documents more consistently with their segment ratings if the entire document context is available at all time.
-
•
In the document-centric evaluation, document ratings can be approximated reasonably well by averaged segment level scores.
-
•
Inter-annotator agreement for document ratings increases if segment level evaluation is made in the global context.
Our analysis suggests that not only the entire document context is needed for reliable human evaluation of news translations, as recent studies have shown, but that the method in which the context is presented to evaluators is also important for collecting good-quality segment and document-level assessments. We conclude that the WMT20 method produces more reliable ratings, and thus can be adopted for future editions of the WMT document-level human evaluation campaigns for all languages.
In future work, we plan to strengthen our findings by comparing the WMT19 and WMT20 methods in A/B testing with common sets of documents, translations and annotators for both settings.
References
- Barrault et al. (2020) Loïc Barrault, Magdalena Biesialska, Ondřej Bojar, Marta R. Costa-jussà, Christian Federmann, Yvette Graham, Roman Grundkiewicz, Barry Haddow, Matthias Huck, Eric Joanis, Tom Kocmi, Philipp Koehn, Chi-kiu Lo, Nikola Ljubešić, Christof Monz, Makoto Morishita, Masaaki Nagata, Toshiaki Nakazawa, Santanu Pal, Matt Post, and Marcos Zampieri. 2020. Findings of the 2020 conference on machine translation (WMT20). In Proceedings of the Fifth Conference on Machine Translation, pages 1–55, Online. Association for Computational Linguistics.
- Barrault et al. (2019) Loïc Barrault, Ondřej Bojar, Marta R. Costa-jussà, Christian Federmann, Mark Fishel, Yvette Graham, Barry Haddow, Matthias Huck, Philipp Koehn, Shervin Malmasi, Christof Monz, Mathias Müller, Santanu Pal, Matt Post, and Marcos Zampieri. 2019. Findings of the 2019 conference on machine translation (WMT19). In Proceedings of the Fourth Conference on Machine Translation (Volume 2: Shared Task Papers, Day 1), pages 1–61, Florence, Italy. Association for Computational Linguistics.
- Bojar et al. (2017) Ondřej Bojar, Rajen Chatterjee, Christian Federmann, Yvette Graham, Barry Haddow, Shujian Huang, Matthias Huck, Philipp Koehn, Qun Liu, Varvara Logacheva, Christof Monz, Matteo Negri, Matt Post, Raphael Rubino, Lucia Specia, and Marco Turchi. 2017. Findings of the 2017 conference on machine translation (WMT17). In Proceedings of the Second Conference on Machine Translation, pages 169–214, Copenhagen, Denmark. Association for Computational Linguistics.
- Bojar et al. (2018) Ondřej Bojar, Christian Federmann, Mark Fishel, Yvette Graham, Barry Haddow, Philipp Koehn, and Christof Monz. 2018. Findings of the 2018 conference on machine translation (WMT18). In Proceedings of the Third Conference on Machine Translation: Shared Task Papers, pages 272–303, Belgium, Brussels. Association for Computational Linguistics.
- Castilho (2020) Sheila Castilho. 2020. On the same page? Comparing inter-annotator agreement in sentence and document level human machine translation evaluation. In Proceedings of the Fifth Conference on Machine Translation, pages 1150–1159, Online. Association for Computational Linguistics.
- Castilho et al. (2020) Sheila Castilho, Maja Popović, and Andy Way. 2020. On context span needed for machine translation evaluation. In Proceedings of the 12th Language Resources and Evaluation Conference, pages 3735–3742, Marseille, France. European Language Resources Association.
- Cettolo et al. (2017) Mauro Cettolo, Marcello Federico, Luisa Bentivogli, Niehues Jan, Stüker Sebastian, Sudoh Katsuitho, Yoshino Koichiro, and Federmann Christian. 2017. Overview of the IWSLT 2017 evaluation campaign. In International Workshop on Spoken Language Translation, pages 2–14.
- Cohen (1960) J. Cohen. 1960. A coefficient of agreement for nominal scales. Educational and Psychological Measurement, 20(1):37.
- Federmann (2018) Christian Federmann. 2018. Appraise evaluation framework for machine translation. In Proceedings of the 27th International Conference on Computational Linguistics: System Demonstrations, pages 86–88, Santa Fe, New Mexico. Association for Computational Linguistics.
- Freedman et al. (2007) David Freedman, Robert Pisani, and Roger Purves. 2007. Statistics (international student edition). Pisani, R. Purves, 4th edn. WW Norton & Company, New York.
- Gonzalez et al. (2011) Cleotilde Gonzalez, Brad Best, Alice F Healy, James A Kole, and Lyle E Bourne Jr. 2011. A cognitive modeling account of simultaneous learning and fatigue effects. Cognitive Systems Research, 12(1):19–32.
- Graham et al. (2013) Yvette Graham, Timothy Baldwin, Alistair Moffat, and Justin Zobel. 2013. Continuous measurement scales in human evaluation of machine translation. In Proceedings of the 7th Linguistic Annotation Workshop and Interoperability with Discourse, pages 33–41, Sofia, Bulgaria. Association for Computational Linguistics.
- Graham et al. (2020) Yvette Graham, Barry Haddow, and Philipp Koehn. 2020. Statistical power and translationese in machine translation evaluation. In Proceedings of the 2020 Conference on Empirical Methods in Natural Language Processing (EMNLP), pages 72–81, Online. Association for Computational Linguistics.
- Hayes and Krippendorff (2007) Andrew F. Hayes and Klaus Krippendorff. 2007. Answering the call for a standard reliability measure for coding data. Communication Methods and Measures, 1(1):77–89.
- Landis and Koch (1977) J. Richard Landis and Gary G. Koch. 1977. The measurement of observer agreement for categorical data. Biometrics, 33(1).
- Laubli et al. (2020) Samuel Laubli, Sheila Castilho, Graham Neubig, Rico Sennrich, Qinlan Shen, and Antonio Toral. 2020. A set of recommendations for assessing human–machine parity in language translation. Journal of Artificial Intelligence Research (JAIR), 67.
- Läubli et al. (2018) Samuel Läubli, Rico Sennrich, and Martin Volk. 2018. Has machine translation achieved human parity? a case for document-level evaluation. In Proceedings of the 2018 Conference on Empirical Methods in Natural Language Processing, pages 4791–4796, Brussels, Belgium. Association for Computational Linguistics.
- Novikova et al. (2018) Jekaterina Novikova, Ondřej Dušek, and Verena Rieser. 2018. RankME: Reliable human ratings for natural language generation. In Proceedings of the 2018 Conference of the North American Chapter of the Association for Computational Linguistics: Human Language Technologies, Volume 2 (Short Papers), pages 72–78, New Orleans, Louisiana. Association for Computational Linguistics.
- Popović (2020) Maja Popović. 2020. Informative manual evaluation of machine translation output. In Proceedings of the 28th International Conference on Computational Linguistics, pages 5059–5069, Barcelona, Spain (Online). International Committee on Computational Linguistics.
- Sakaguchi and Van Durme (2018) Keisuke Sakaguchi and Benjamin Van Durme. 2018. Efficient online scalar annotation with bounded support. In Proceedings of the 56th Annual Meeting of the Association for Computational Linguistics (Volume 1: Long Papers), pages 208–218, Melbourne, Australia. Association for Computational Linguistics.
- Toral (2020) Antonio Toral. 2020. Reassessing claims of human parity and super-human performance in machine translation at WMT 2019. In Proceedings of the 22nd Annual Conference of the European Association for Machine Translation, pages 185–194, Lisboa, Portugal. European Association for Machine Translation.
- Toral et al. (2018) Antonio Toral, Sheila Castilho, Ke Hu, and Andy Way. 2018. Attaining the unattainable? reassessing claims of human parity in neural machine translation. In Proceedings of the Third Conference on Machine Translation: Research Papers, pages 113–123, Belgium, Brussels. Association for Computational Linguistics.
Appendix A Appendix
Table 6 and Figure 5 provide inter-annotator agreement for document-level and averaged segment-level scores in the form of Krippendorff’s alpha coefficient Hayes and Krippendorff (2007) for 4 common languages from WMT19 and WMT20. We present coefficients computed with interval and ratio metrics, and for a direct comparison with the results presented in Section 5.3, with the nominal metric with different tolerances , i.e. two scores are assumed equal if they differ no more than .
Krippendorff’s alpha coefficients computed using the interval or ratio metrics do not show the higher agreement on document ratings for WMT20 compared to WMT19 that has been observed with Cohen’s Kappa, but the difference is again smaller than for averaged segment ratings. Coefficients computed using the nominal metric with tolerance thresholds align with the inter-annotator agreement results obtained with the other statistic measure.
| Doc. scores | Avg. seg. scores | |||||
|---|---|---|---|---|---|---|
| WMT19 | WMT20 | WMT19 | WMT20 | |||
| Inter. | 0.340 | 0.282 | -0.058 | 0.465 | 0.297 | -0.168 |
| Ratio | 0.294 | 0.246 | -0.048 | 0.461 | 0.277 | -0.184 |
| 5 | 0.030 | 0.046 | 0.016 | 0.060 | 0.053 | -0.007 |
| 10 | 0.061 | 0.077 | 0.016 | 0.103 | 0.085 | -0.018 |
| 15 | 0.100 | 0.130 | 0.030 | 0.194 | 0.138 | -0.056 |
| 20 | 0.153 | 0.188 | 0.035 | 0.329 | 0.202 | -0.127 |
| 25 | 0.237 | 0.258 | 0.021 | 0.462 | 0.290 | -0.172 |
| 30 | 0.286 | 0.311 | 0.025 | 0.612 | 0.370 | -0.242 |