LiNiO2 as a high-entropy charge- and bond-disproportionated glass
Abstract
Understanding microscopic properties of LiNiO2, a Li-ion battery cathode material with extraordinarily high reversible capacity, has remained a challenge for decades. Based on extensive electronic structure calculations, which reveal a large number of nearly degenerate phases involving local Jahn-Teller effect as well as bond and oxygen-based charge disproportionation, we propose that LiNiO2 exists in a high-entropy charge-glass like state at and below ambient temperatures. Recognizing the glassy nature of LiNiO2 does not only explain its key experimental features, but also opens a new path in designing entropy-stabilized battery cathodes with superb capacities.
pacs:
61.43.Fs,64.70.P-,65.40.Gr,71.20.-b,75.47.Lx,71.20.-b,71.30.+h,71.45.LrI Introduction
LiNiO2 is well known as a promising cathode material for rechargeable Li-ion batteriesGoodenough (1955, 1958). One of the most fascinating but also puzzling properties of this oxide is its record-breaking stability upon repeated charge and discharge cycles. It is indeed quite surprising that the LiNiO2 system can be cycled more than a few times changing the Li concentration by up to 80% on each cycleLiu et al. (2015); Arai et al. (1995). This indicates that there must be something very special about the crystal structure of LiNiO2 that keeps the original structure in place, and indeed LiNiO2 has demonstrated a range of structural features that are hard to understand in a conventional way.
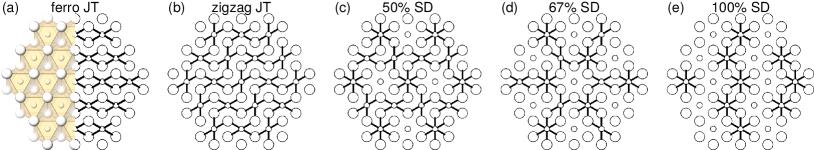
LiNiO2 consists of layers of edge-sharing NiO6 octahedra on a triangular lattice alternating with Li layers. The formally trivalent Ni ions are in a low-spin configuration which makes them Jahn-Teller (JT) activeGoodenough (1958); Hirakawa et al. (1985); Hirota et al. (1991); Yamaura et al. (1996). Despite this, however, the NiO6 octahedra do not undergo a cooperative JT distortion even at the lowest temperatures, as follows from the numerous Rietveld refinements of the LiNiO2 powder diffraction dataGoodenough (1958); Arai et al. (1995); Chung et al. (2005). This is in a surprising contrast with the behavior of its sister compound NaNiO2 that shows a ferro-orbital ordering of occupied orbitals and an associated cooperative elongation of the NiO6 octahedra below 460 K as illustrated in Fig. 1(a)Borgers and Enz (1966); Holzapfel et al. (2004). On the other hand, structural analyses based on the neutron pair distribution function (nPDF)Chung et al. (2005), extended x-ray absorption fine structureRougier et al. (1995), and electron spin resonanceBarra et al. (1999); Reynaud et al. (2001) measurements, strongly suggest local, but apparently disordered, Ni-O bond disproportionation in LiNiO2. Disorder effects in this system, which also include a spin-glass-like behavior at low temperaturesHirota et al. (1991), are often linked to its unavoidable deviation from stoichiometryArai et al. (1995); Petit et al. (2006). Yet, the exact nature of the disordered state in LiNiO2 has so far remained unclear.
Apart from the above, LiNiO2 also possesses a rather peculiar electronic property, which, although being often dismissed in literature, might be the key to understanding its structural properties. As was first pointed out by Kuiper et al.Kuiper et al. (1989), this system is in the negative charge-transfer regime which brings the NiO6 octahedra closer to the (rather than the formal ) average configuration, where denotes a ligand hole residing on a molecular orbital formed by the six oxygen- orbitals in an octahedron. In this regime, the Jahn-Teller effect might be in competition with another degeneracy lifting mechanism, observed in rare-earth nickel perovskitesJohnston et al. (2014); Green et al. (2016); Foyevtsova et al. (2015), which involves formation of two types of size-disproportionated NiO6 octahedra with configurations and with symmetries and spins corresponding to those of Ni2+ and Ni4+. Not surprisingly, therefore, a strongly competing bond-disproportionated phase of LiNiO2, with ordered stripes of collapsed and expanded NiO6 octahedra [Fig. 1(e)], was indeed recently predicted within density functional theory (DFT)Chen et al. (2011).
Our present theoretical study offers a unifying explanation of the puzzling structural and electronic properties of LiNiO2 outlined above as well as its superior performance in Li-ion batteries by recognizing the fundamental role of entropy in this system. Based on extensive electronic structure calculations, we demonstrate that LiNiO2 has a large number of nearly degenerate states involving NiO6 octahedra with , and configurations, leading to basically a large number of combinations of these into glassy-like structures which increases the entropy resulting in a high-entropy material. It is shown that, as a result of the charge-transfer energy being negative in LiNiO2, this state involves charge disproportionation on oxygen rather than on nickel atoms. Although entropy is known to play important roles in polymer science and protein folding as well as glasses, multi-component oxides, and metal alloysRost et al. (2015); Yao et al. (2018), these are mostly structurally driven while our proposal involves an electronic-structure driven mechanism for the pure material.
II Methods
We performed density functional theory (DFT) calculations with the pseudo-potential code VASPKresse and Furthmüller (1996); Paier et al. (2005) and the all-electron code WIEN2kBlaha et al. (2001). All of our structural relaxations were done in VASP, using a high energy cut-off of 550 Ry and fine -grids with densities close to that of a -grid in a unit cell. A combination of the local density approximation (LDA)Perdew and Wang (1992) and the LDA+U method as designed by Anisimov et al. Anisimov et al. (1991, 1993); Liechtenstein et al. (1995), with the Ni- electrons’ on-site interactions eV and eV, was used to treat exchange and correlation effects.
The neutron pair distribution functions (nPDF), , of the relaxed LiNiO2 phases were simulated with the PDFfit2 programFarrow et al. (2007) using the following expressionChung et al. (2005):
where is distance, and are the scattering length of the th atom and the distance between the th and th atom, respectively, is the number of atoms, and is the average atomic density. Thermal broadening was accounted for through introducing the Debye-Waller factors. We used theoretical structural parameters, scaled with an empirical factor of 1.024, and theoretical thermal displacement parameters. In the PDFfit2 program, we chose 0.08 for the parameter and 0.5 for the linear atomic correlation factor for all the considered model LiNiO2 phases except the rhombohedral one where we used . The neutron time-of-flight (TOF) powder diffraction patterns were simulated using the GSAS packageLarson and Dreele (2000); Toby (2001). For both the nPDF and the TOF powder diffraction simulations, we used the following theoretically calculated atomic isotropic displacement parameters , obtained for the temperature of 10 K employing VASP and the Phonopy packageTogo and Tanaka (2015): (Li) = 0.008 , (Ni) = 0.0011 , (O) = 0.0025 . The thermodynamic properties were calculated using the phonon spectra obtained with VASP and Phonopy via the dynamical matrix method.
III Results
Our following discussion will be based on a comparison of a number of different bond-disproportionated phases of LiNiO2 shown in Fig. 1, which all turn out to be easily achievable in a DFT structural relaxation. They include two JT phases [(a) and (b)], the stripy phase with size-disproportionated NiO6 octahedra from Ref. Chen et al., 2011 (e), and two mixed phases where JT-distorted and size-disproportionated octahedra are simultaneously present [(c) and (d)]. The high-symmetry rhombohedral phase of LiNiO2, which has been traditionally assigned to LiNiO2 based on powder diffraction refinement and has no Ni-O bond disproportionation, will also be considered for completeness. For each phase, we use DFT and the local density approximation (LDA+U) method to perform full lattice relaxation and to calculate the ground state electronic structure. Ferromagnetic alignment of Ni spins is adopted throughout all the calculations, as it was established that the total energy differences between different spin configurations are much smaller than those between the different structural phases of LiNiO2, as detailed in the Appendix. This finding of ours agrees with the conclusions of Mostovoy and KhomskiiMostovoy and Khomskii (2002) who demonstrated decoupling of spin and orbital degrees of freedom in LiNiO2.
| Phase | (meV/f. u.) | Gap (eV) | (Å) | |
|---|---|---|---|---|
| Rhomb. | 141.3 (147.5) | 0 | - | 1.98 |
| ferro JT | 18.1 (0) | 0.43 | 2 | 1.90 2.12 |
| zigzag JT | 0 (19.1) | 0.56 | 2 | 1.90 2.11 |
| 50% SD | 49.6 (60.1) | 0.35 | 1.4 | 1.90 2.06 |
| 67% SD | 32.1 (43.5) | 0.51 | 1.25 | 1.90 2.05 |
| 100% SD | 26.3 (63.3) | 0.58 | 1 | 1.89 2.06 |
We note first that for NaNiO2 (the sister compound) DFT correctly predicts the JT phase with a ferro-orbital ordering of occupied orbitals [Fig. 1(a)] to be the lowest energy stateMeskine and Satpathy (2005); Chen et al. (2011). For LiNiO2, on the other hand, we find that the lowest energy state is the JT phase with a zigzag ordering of occupied orbitals [Fig. 1(b)]Chen et al. (2011). Its energy is by 18.1 meV per formula unit (f. u.) lower than that of the ferro-orbitally ordered phase and by 141.3 meV/f. u. lower than that of the rhombohedral phase (see Table 1). The fully and partially size-disproportionated (SD) phases shown in Figs. 1(c)-(e) have energies that are not too far from the energy of the ferro-orbital JT phase. For example, the three-fold rotationally symmetric phase shown in (d), with two thirds (or 67%) of Ni sites being SD, is higher in energy by only 14 meV/f. u. As one can also see in Table 1, all the considered bond-disproportionated phases have a small charge gap in LDA+U, which qualitatively agrees with experimentHirota et al. (1991). Interestingly, the same SD phases can be obtained for NaNiO2, but, as also shown in Table 1, they are energetically more strongly removed from the lowest energy state than in the case of LiNiO2.
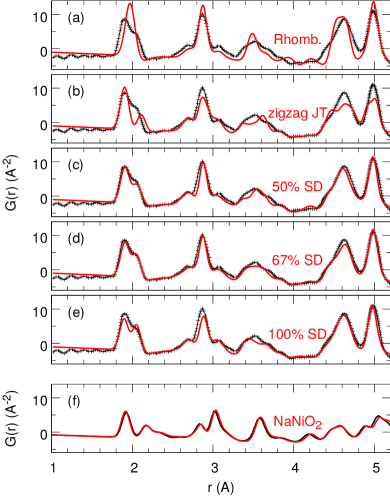
Before discussing the important implications following from these total energy calculations, let us point out that LiNiO2 being in a mixed phase, such as the 67% SD one, could explain amazingly well the findings from both, the pair distribution function and the powder diffraction analyses, which previously have been regarded as mutually contradicting. In Figs. 2(a)-(e), the experimental nPDF of LiNiO2Chung et al. (2005) is compared with simulated nPDFs of the five model phases from Fig. 1. Both the experiment and the simulations are performed at the temperature of 10 K. In order to correct for the underestimation of interatomic distances in LDA+U, an empirical scaling factor of 1.024 was applied to in the simulated nPDF . This procedure gives very good agreement between theory and experiment for NaNiO2, whose experimental crystal structure is unambiguously known [Fig. 2(f)]Holzapfel et al. (2004). For LiNiO2, it is the 67% SD phase’s nPDF that has equally good agreement with experiment [Fig. 2(d)], while the zigzag JT (lowest energy state) phase’s nPDF shows considerable deviations [Fig. 2(b)]. In the bond-disproportionated phases [Figs. 2(b)-(e)], the two nPDF peaks around 2 Å are particularly sensitive to the presence of SD NiO6 sites and their evolution from (b) to (e) is easy to understand. Indeed, the relative heights of these peaks reflect the ratio between the numbers of short and long nearest-neighbor Ni-O bonds, . As the fraction of SD sites grows, gradually decreases from 2 in the fully JT phases to 1 in the fully SD phase (Table 1) and so does the intensity of the first nPDF peak relative to that of the second. Furthermore, only by having SD sites in the system can one accurately reproduce the measured position of the second peak or, equivalently, the average length of the long Ni-O bonds (Table 1). We would like to emphasize that these results have been obtained with keeping the nPDF simulations as ab initio as possible, which is a step forward compared with the original analysis of Chung et al. in Ref. Chung et al., 2005. We also note that, in general, the fraction of SD octahedra may probably vary from one sample to another depending on their thermal histories and growth conditions, which should be a subject of further investigations.
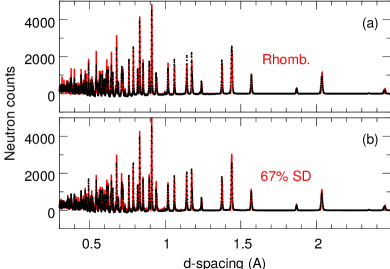
As for the powder diffraction experiments, we find that the 67% SD phase gives a diffraction pattern that is strikingly similar to that of the rhombohedral phase (Fig. 3). Moreover, our general observation is that all bond-disproportionated phases with a preserved symmetry of the lattice tend to have very similar diffraction patternspow . In other words, the powder diffraction pattern of LiNiO2 appears to be barely sensitive to Ni-O bond disproportionation as long as the symmetry is preserved, which in fact can explain the long-standing confusion around the LiNiO2 crystal structure.
IV Discussion
IV.1 Role of entropy
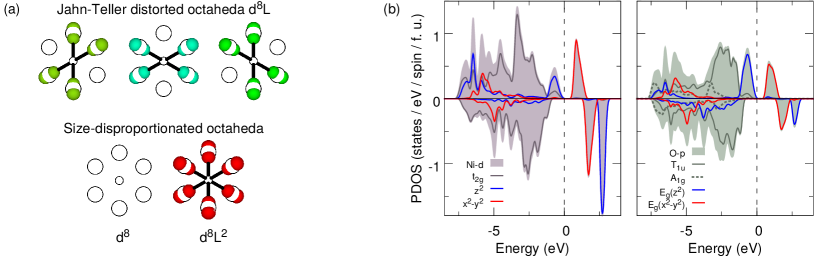
At this point, the question arises as to why LiNiO2 would adopt a metastable phase like the 67% SD one rather than the lowest energy JT zigzag phase, which is what the above comparison with experiment strongly suggests, and this is where the entropy factor comes into play. In fact, given the accuracy limitations of the LDA+U method, the only robust conclusion that comes from our total energy calculations is that there exist phases with varying amounts of JT distorted and SD NiO6 octahedra whose energies lie within only 20 to 30 meV/f. u. above the ground-state energy. While the ferro JT, 67% SD, 50% SD, and 100% SD phases are just some examples of such phases, further examples can be easily come up with and tested in a calculation by exploring various ways of positioning the five building block configurations of a NiO6 octahedron on a triangular lattice: the three JT distorted and the two SD configurations [Fig. 4(a)]. With so many metastable phases being so close in energy, a state where the system is able to fluctuate between them can have a high enough entropy to be stabilized at ambient temperatures by the entropy term in the free energy. In this fluctuating state, each NiO6 site can assume any of the building block configurations, and in an extreme limit would do it in a random way. In reality, of course, there will be constraints due to local correlations between different types of sites mostly determined by Pauling’s principle of electroneutralityPauling (1948). Thus, an expanded NiO6 octahedral site with electronic configuration would “attract” collapsed sites (each having less charge due to the 2 ligand holes than the reference site) in its immediate vicinity, but due to the triangular geometry those will be somehow diluted by and/or sites. One can envision this mechanism driving a propagation of local , , and configurations from a nucleation center ensured by the entropy to be as random as possible at a given temperature. We believe that the final entropy-stabilized state will involve local distributions of , , and sites corresponding to all and any of those depicted in Fig. 1. We can in fact make the discussion more quantitative by computing and comparing the configurational entropy of this entropy-stabilized state and that of the lowest-energy zigzag Jahn-Teller phase. As detailed in the Appendix, the impact of the vibrational (or phonon) free energy on the stability of various LiNiO2 phases is small compared to that of the configurational entropy and therefore will not be considered here. The configurational entropy of the zigzag Jahn-Teller phase is due to spin fluctuations between the states of the Ni ions’ spins: , where is the number of formula units in the crystal. For the entropy-stabilized state, let us assume for simplicity that the , , and sites have equal concentrations of , and that they are randomly distributed. In addition, the JT sites have degeneracy of corresponding to three possible orientations of the long Ni-O bond [see Fig. 4(a)] and two components of spin , while the large octahedron sites have degeneracy of corresponding to three components of spin . Neglecting local correlations between the different types of sites, which otherwise would somewhat reduce our estimate of , we get that . This upper bound is in fact very large and exceeds the value of in five-component mixtures at equal concentrations, which are conventionally considered “high-entropy” materialsMurty et al. (2014). We note that, aside from the chemical composition aspects used in the design of high-entropy alloysRost et al. (2015); Sarkar et al. (2018), our analysis puts a new twist on the determination of the entropy to include Jahn-Teller as well as electronic and local disproportionation.
It would be very interesting to look for experimental signatures of the glass transition in LiNiO2, at which the electronic and orbital fluctuations discussed above should freeze. For example, it was found that the heat capacity of LiNiO2 is anomalously enhanced below 300 KKawaji et al. (2002). Clearly, further heat capacity measurements exploring much higher temperatures are strongly desired in order to observe the full glass transition. Another experimental observation which is strongly supportive of the glassy state in LiNiO2 is the spin-glass like transition observed at around 20 K. Indeed, having the Ni sites electronically in a random mixture of , , and configurations means having a random mixture of , , and spin magnetic moments, respectively, with similarly randomized exchange interactions between them, which is an important prerequisite for the formation of a spin glass.
From the application point of view, the high configurational entropy of the glassy state in LiNiO2 is very beneficial in terms of battery operation as the system has many ways to adjust itself locally to a missing Li ion, which is apparently what makes LiNiO2 such a good cathode. In this regard, further increase of entropy upon chemical substitution of Ni with Co and Mn may be the main reason for the increased stability of LiNi1-x-yCoxMnyO2 cathodes. Another example of this concept can be found in a recent study on multi-component monoxides which demonstrates that five-component systems perform much better in batteries compared with four- or less component systems and attributes this effect to entropy stabilizationSarkar et al. (2018).
IV.2 Oxygen holes
Finally, in order to better understand the microscopic nature of the disordered glassy state in LiNiO2, let us examine its electronic structure. We first note that LDA+U correctly describes LiNiO2 as a negative charge-transfer systemKuiper et al. (1989), as far as the Ni oxidation state is concerned. Figure 4(b) compares the Ni- and O- orbitally projected densities of states (DOS) in the zigzag JT phase. One can see a considerable amount of the O- character in the states above the Fermi level, indicating that the true Ni oxidation state is far less than 3+. We find close to 8 electrons in the Ni- shell inside the muffin-tin sphere. What obscures the picture, though, is the strong hybridization between the Ni- orbitals and the oxygen- orbitals of a respective symmetry. As one can see in the right panel of Fig. 4(b), it results in holes occupying -symmetric molecular-like orbitals formed by the oxygen- orbitals in an octahedral cage. Although LDA+U is a mean-field method not capable of properly describing a many-body wave-function, we still can associate the states observed in our calculations on the expanded, JT distorted, and collapsed octahedra with, respectively, the , , and configurations. Hole density iso-surfaces for each configuration are schematically shown in Fig. 4(a). Note that a single hole occupying the -symmetric molecular orbital results in a shortening of only four Ni-O bonds, while two holes occupying both the - and the -symmetric orbitals result in a collapse of all Ni-O bonds. We further find 1.68, 0.90, and 0.08 for the magnetic moments of the Ni ions inside the expanded, JT distorted, and collapsed octahedra, respectively. Again, this is a result of LDA+U being a mean-field method; in a true many-body calculation, one would find for , for example, that the moment on the nickel forms a singlet state with the moment on the oxygen molecular orbital and the total moment on the octahedron is zero.
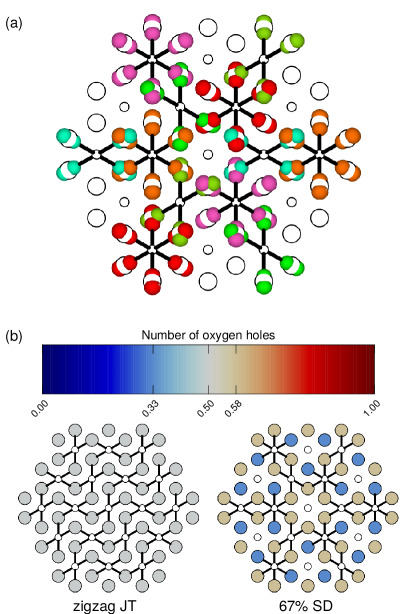
Yet another peculiar property of the SD phases in LiNiO2 is that there occur both bond disproportionation and oxygen charge disproportionation. This is in contrast with the rare-earth nickel perovskites, where only bond disproportionation occurs, which is a result of a different lattice geometry and a different average number of holes per oxygen octahedron (three in LiNiO2 versus two in the rare-earth nickel perovskites). In Fig. 5(a), we schematically show density iso-surfaces of holes occupying individual molecular orbitals in the 67% SD phase of LiNiO2. One can clearly distinguish oxygen sites where neighboring molecular orbitals overlap from those where they do not. As a result, the two types of oxygen sites have different hole concentrations, which is further illustrated in Fig. 5(b).
The extended nature of the oxygen molecular orbitals and the fact that they can overlap result in a strong nearest-neighbor interaction between holes, which is generally known to facilitate charge ordering effects. Although formation of a glassy state may in general depend on various factors, we can speculate that in such an environment localized charge impurities can serve as nucleation centers for charge disproportionation. In LiNiO2, charge impurities are readily available in a form of doped electrons entering the Ni layers as a result of the unavoidable deviation from stoichiometryArai et al. (1995). The doped electrons would attract holes according to Pauling’s principlePauling (1948) and thus locally modify the energetics in favor of charge- (and size-) disproportionated phases. Further investigations are, however, required in order to validate this scenario.
We believe that spectroscopic probes, such as x-ray absorption spectroscopy (XAS), could be crucial in verifying the mixed size-disproportionated state in LiNiO2. Especially interesting would be to compare spectroscopic data from LiNiO2 and its sister compound NaNiO2 where the ground state is contrastingly uniform. Unfortunately, unambiguous interpretation of the existing Ni XAS dataAbbate et al. (1991); van Veenendaal and Sawatzky (1994); Montoro et al. (1999) is not easy due to questionable sample quality and also the fact that their proper theoretical description requires to go beyond the standard single cluster calculationsGreen et al. (2016). We hope therefore that our theoretical proposal of the glass-like electronic ground state of LiNiO2 will stimulate experimental efforts in preparing and systematically measuring high-quality LiNiO2 and NaNiO2 samples complemented with a proper theoretical analysis of spectroscopic data in the spirit of Ref. Green et al., 2016. We also note that in the case of the negative charge-transfer gap rare-earth nickelates the detailed analysis of their XAS data identifying the origin of the two-peak structure was only made after the single crystalline epitaxial thin film studies with resonant inelastic x-ray scattering by Bisogni et al.Bisogni et al. (2016). This kind of study on epitaxial thin films of LiNiO2 and NaNiO2 would be extremely helpful.
V Conclusion
In summary, we have used electronic structure methods to demonstrate that the Li-ion battery material LiNiO2 is in a high-entropy charge-glass like state characterized by a disordered mixture of JT distorted and SD NiO6 octaherda. This state is associated with charge disproportionation on the oxygen rather than on the nickel atoms due to LiNiO2 being in the negative charge-transfer regime. Supported by rigorous calculations, our proposal explains the previously highly debated nPDF and powder diffraction measurements on LiNiO2 as well as its enhanced heat capacity and the spin-glass like behavior. Most importantly, however, we can conclude that it is the glassy nature that renders LiNiO2 its extraordinarily high reversible capacity. We believe that recognizing the role of entropy in stabilizing cathodes during the charge and discharge cycles can greatly advance battery research.
Appendix
V.1 Dependence of energy on a spin configuration
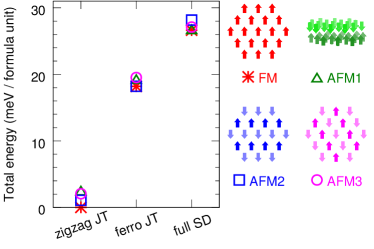
Figure 6 demonstrates that the energy differences between different structural phases of LiNiO2 are very weakly dependent on the Ni spin configuration. In this plot, we have considered the zigzag JT, ferro-orbital JT, and fully size-disproportionated structural phases as well as one ferromagnetic and three anti-ferromagnetic Ni spin configurations labeled as FM, AFM1, AFM2, and AFM3.
V.2 Calculation of thermodynamic properties
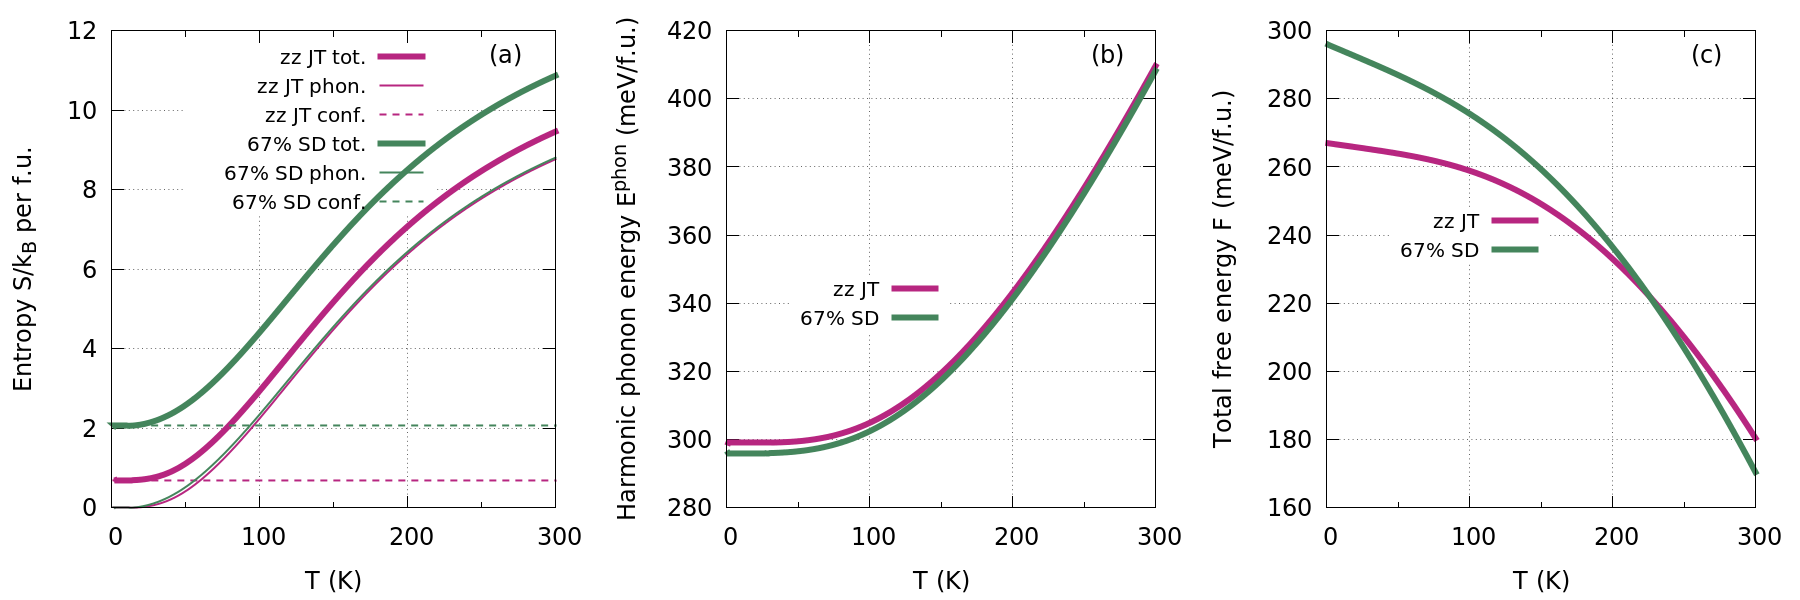
In order to estimate how important is the impact of the vibrational free energy on the stability of various LiNiO2 phases, we have computed the vibrational free energies of the zigzag JT and the 67% SD phases of LiNiO2 using the phonon spectra obtained with VASP and Phonopy via the dynamical matrix method. The computed vibrational entropies , the harmonic phonon energies , as well as the total entropies and total free energies are shown in Fig. 7 as a function of temperature . is the energy, which is 0 and +32.1 meV/f.u. in the zigzag JT and the 67% SD phases, respectively. It is assumed that the configurational entropy of the 67% SD phase is that of the entropy-stabilized state with equal concentrations of , , and sites in order to illustrate its significant contribution compared with the phonon contribution.
Acknowledgments
The authors are grateful to Daniel Khomskii for insightful discussions. K. F. thanks Jae-Ho Chung and Thomas E. Proffen for sharing their neutron data and Leopoldo Suescun for helping with GSAS simulations.
References
- Goodenough (1955) J. B. Goodenough, Phys. Rev. 100, 564 (1955).
- Goodenough (1958) J. B. Goodenough, J. Phys. Chem. Solids 6, 287 (1958).
- Liu et al. (2015) W. Liu, P. Oh, X. Liu, M.-J. Lee, W. Cho, S. Chae, Y. Kim, and J. Cho, Angewandte Chemie International Edition 54, 4440 (2015), ISSN 1521-3773, URL http://dx.doi.org/10.1002/anie.201409262.
- Arai et al. (1995) H. Arai, S. Okada, H. Ohtsuka, M. Ichimura, and J. Yamaki, Solid State Ionics 80, 261 (1995), ISSN 0167-2738.
- Hirakawa et al. (1985) K. Hirakawa, H. Kadowaki, and K. Ubukoshi, Journal of the Physical Society of Japan 54, 3526 (1985), eprint http://dx.doi.org/10.1143/JPSJ.54.3526, URL http://dx.doi.org/10.1143/JPSJ.54.3526.
- Hirota et al. (1991) K. Hirota, Y. Nakazawa, and M. Ishikawa, Journal of Physics: Condensed Matter 3, 4721 (1991), URL http://stacks.iop.org/0953-8984/3/i=25/a=017.
- Yamaura et al. (1996) K. Yamaura, M. Takano, A. Hirano, and R. Kanno, Journal of Solid State Chemistry 127, 109 (1996), ISSN 0022-4596, URL http://www.sciencedirect.com/science/article/pii/S0022459696903631.
- Chung et al. (2005) J.-H. Chung, T. Proffen, S. Shamoto, A. M. Ghorayeb, L. Croguennec, W. Tian, B. C. Sales, R. Jin, D. Mandrus, and T. Egami, Phys. Rev. B 71, 064410 (2005), URL http://link.aps.org/doi/10.1103/PhysRevB.71.064410.
- Borgers and Enz (1966) P. Borgers and U. Enz, Solid State Communications 4, 153 (1966), ISSN 0038-1098, URL http://www.sciencedirect.com/science/article/pii/0038109866900019.
- Holzapfel et al. (2004) M. Holzapfel, S. de Brion, C. Darie, P. Bordet, E. Chappel, G. Chouteau, P. Strobel, A. Sulpice, and M. D. Núñez Regueiro, Phys. Rev. B 70, 132410 (2004), URL http://link.aps.org/doi/10.1103/PhysRevB.70.132410.
- Rougier et al. (1995) A. Rougier, C. Delmas, and A. Chadwick, Solid State Communications 94, 123 (1995), ISSN 0038-1098, URL http://www.sciencedirect.com/science/article/pii/0038109895000208.
- Barra et al. (1999) A.-L. Barra, G. Chouteau, A. Stepanov, A. Rougier, and C. Delmas, The European Physical Journal B - Condensed Matter and Complex Systems 7, 551 (1999), ISSN 1434-6036, URL https://doi.org/10.1007/s100510050648.
- Reynaud et al. (2001) F. Reynaud, D. Mertz, F. Celestini, J.-M. Debierre, A. M. Ghorayeb, P. Simon, A. Stepanov, J. Voiron, and C. Delmas, Phys. Rev. Lett. 86, 3638 (2001), URL https://link.aps.org/doi/10.1103/PhysRevLett.86.3638.
- Petit et al. (2006) L. Petit, G. M. Stocks, T. Egami, Z. Szotek, and W. M. Temmerman, Phys. Rev. Lett. 97, 146405 (2006), URL https://link.aps.org/doi/10.1103/PhysRevLett.97.146405.
- Kuiper et al. (1989) P. Kuiper, G. Kruizinga, J. Ghijsen, G. A. Sawatzky, and H. Verweij, Phys. Rev. Lett. 62, 221 (1989), URL http://link.aps.org/doi/10.1103/PhysRevLett.62.221.
- Johnston et al. (2014) S. Johnston, A. Mukherjee, I. Elfimov, M. Berciu, and G. A. Sawatzky, Phys. Rev. Lett. 112, 106404 (2014), URL http://link.aps.org/doi/10.1103/PhysRevLett.112.106404.
- Green et al. (2016) R. J. Green, M. W. Haverkort, and G. A. Sawatzky, Phys. Rev. B 94, 195127 (2016), URL https://link.aps.org/doi/10.1103/PhysRevB.94.195127.
- Foyevtsova et al. (2015) K. Foyevtsova, A. Khazraie, I. Elfimov, and G. A. Sawatzky, Phys. Rev. B 91, 121114 (2015), URL http://link.aps.org/doi/10.1103/PhysRevB.91.121114.
- Chen et al. (2011) H. Chen, C. L. Freeman, and J. H. Harding, Phys. Rev. B 84, 085108 (2011), URL http://link.aps.org/doi/10.1103/PhysRevB.84.085108.
- Rost et al. (2015) C. M. Rost, E. Sachet, T. Borman, A. Moballegh, E. C. Dickey, D. Hou, J. L. Jones, S. Curtarolo, and J.-P. Maria, Nature Communications 6, 8485 (2015).
- Yao et al. (2018) Y. Yao, Z. Huang, P. Xie, S. D. Lacey, R. J. Jacob, H. Xie, F. Chen, A. Nie, T. Pu, M. Rehwoldt, et al., Science 359, 1489 (2018), ISSN 0036-8075, eprint http://science.sciencemag.org/content/359/6383/1489.full.pdf, URL http://science.sciencemag.org/content/359/6383/1489.
- Kresse and Furthmüller (1996) G. Kresse and J. Furthmüller, Computational Materials Science 6, 15 (1996), ISSN 0927-0256, URL http://www.sciencedirect.com/science/article/pii/0927025696000080.
- Paier et al. (2005) J. Paier, R. Hirschl, M. Marsman, and G. Kresse, The Journal of Chemical Physics 122, 234102 (2005), URL http://scitation.aip.org/content/aip/journal/jcp/122/23/10.1063/1.1926272.
- Blaha et al. (2001) P. Blaha, K. Schwarz, G. K. H. Madsen, D. Kvasnicka, and J. Luitz, WIEN2K, An Augmented Plane Wave + Local Orbitals Program for Calculating Crystal Properties (Karlheinz Schwarz, Techn. Universität Wien, Austria, 2001).
- Perdew and Wang (1992) J. P. Perdew and Y. Wang, Phys. Rev. B 45, 13244 (1992), URL http://link.aps.org/doi/10.1103/PhysRevB.45.13244.
- Anisimov et al. (1991) V. I. Anisimov, J. Zaanen, and O. K. Andersen, Phys. Rev. B 44, 943 (1991), URL http://link.aps.org/doi/10.1103/PhysRevB.44.943.
- Anisimov et al. (1993) V. I. Anisimov, I. V. Solovyev, M. A. Korotin, M. T. Czyżyk, and G. A. Sawatzky, Phys. Rev. B 48, 16929 (1993), URL http://link.aps.org/doi/10.1103/PhysRevB.48.16929.
- Liechtenstein et al. (1995) A. I. Liechtenstein, V. I. Anisimov, and J. Zaanen, Phys. Rev. B 52, R5467 (1995), URL http://link.aps.org/doi/10.1103/PhysRevB.52.R5467.
- Farrow et al. (2007) C. L. Farrow, P. Juhas, J. W. Liu, D. Bryndin, E. S. Božin, J. Bloch, T. Proffen, and S. J. L. Billinge, Journal of Physics: Condensed Matter 19, 335219 (2007), URL http://stacks.iop.org/0953-8984/19/i=33/a=335219.
- Larson and Dreele (2000) A. Larson and R. V. Dreele, Los Alamos National Laboratory Report LAUR 86, 748 (2000).
- Toby (2001) B. H. Toby, J. Appl. Cryst. 34, 210 (2001).
- Togo and Tanaka (2015) A. Togo and I. Tanaka, Scr. Mater. 108, 1 (2015).
- Mostovoy and Khomskii (2002) M. V. Mostovoy and D. I. Khomskii, Phys. Rev. Lett. 89, 227203 (2002), URL http://link.aps.org/doi/10.1103/PhysRevLett.89.227203.
- Meskine and Satpathy (2005) H. Meskine and S. Satpathy, Journal of Applied Physics 97, 10A314 (2005), eprint https://doi.org/10.1063/1.1854414, URL https://doi.org/10.1063/1.1854414.
- (35) For instance, such is a JT phase where the direction of the long Ni-O bond in an octahedron alternates between successive layers.
- Pauling (1948) L. Pauling, J. Chem. Soc. pp. 1461–1467 (1948), URL http://dx.doi.org/10.1039/JR9480001461.
- Murty et al. (2014) B. S. Murty, J.-W. Yeh, and S. Ranganathan, High-entropy alloys (Butterworth-Heinemann, 2014).
- Sarkar et al. (2018) A. Sarkar, L. Velasco, D. Wang, Q. Wang, G. Talasila, L. de Biasi, C. Kübel, T. Brezesinski, S. S. H. Bhattacharya, H. H. Hahn, et al., Nature Communications 9, 3400 (2018).
- Kawaji et al. (2002) H. Kawaji, T. Oka, T. Tojo, T. Atake, A. Hirano, and R. Kanno, Solid State Ionics 152-153, 195 (2002), ISSN 0167-2738, URL http://www.sciencedirect.com/science/article/pii/S0167273802003004.
- Abbate et al. (1991) M. Abbate, F. M. F. de Groot, J. C. Fuggle, A. Fujimori, Y. Tokura, Y. Fujishima, O. Strebel, M. Domke, G. Kaindl, J. van Elp, et al., Phys. Rev. B 44, 5419 (1991), URL https://link.aps.org/doi/10.1103/PhysRevB.44.5419.
- van Veenendaal and Sawatzky (1994) M. A. van Veenendaal and G. A. Sawatzky, Phys. Rev. B 50, 11326 (1994), URL https://link.aps.org/doi/10.1103/PhysRevB.50.11326.
- Montoro et al. (1999) L. Montoro, M. Abbate, E. Almeida, and J. Rosolen, Chemical Physics Letters 309, 14 (1999), ISSN 0009-2614, URL http://www.sciencedirect.com/science/article/pii/S0009261499006508.
- Bisogni et al. (2016) V. Bisogni, S. Catalano, R. J. Green, M. Gibert, S. Raoul, Y. Huang, V. N. Strocov, P. Zubko, S. Balandeh, J.-M. Triscone, et al., Nature Communications 7, 13017 (2016).