Flow in an hourglass: particle friction and stiffness matter
Abstract
Granular flow out of a silo is studied experimentally and numerically. The time evolution of the discharge rate as well as the normal force (apparent weight) at the bottom of the container is monitored. We show, that particle stiffness has a strong effect on the qualitative features of silo discharge. For deformable grains with a Young’s modulus of about kPa in a silo with basal pressure of the order of 4 kPa lowering the friction coefficient leads to a gradual change in the discharge curve: the flow rate becomes filling height dependent, it decreases during the discharge process. For hard grains with a Young’s modulus of about MPa the flow rate is much less sensitive to the value of the friction coefficient. Using DEM data combined with a coarse-graining methodology allows us to compute all the relevant macroscopic fields, namely, linear momentum, density and stress tensors. The observed difference in the discharge in the low friction limit is connected to a strong difference in the pressure field: while for hard grains Janssen-screening is effective, leading to high vertical stress near the silo wall and small pressure above the orifice region, for deformable grains the pressure above the orifice is larger and gradually decreases during the discharge process. We have analyzed the momentum balance in the region of the orifice (near the location of the outlet) for the case of soft particles with low friction coefficient, and proposed a phenomenological formulation that predicts the linear decrease of the flow rate with decreasing filling height.
pacs:
47.57.Gc, 83.80.FgPublished in:
New J. Phys. 23 023001 (2021)
https://doi.org/10.1088/1367-2630/abddf5 (open access)
1 Introduction
Gravity driven discharge of a granular material from a silo or hopper is a frequent operation in various industrial procedures [1, 2, 3, 4, 5, 6, 8, 7]. Materials involving deformable and/or viscoelastic grains with low surface friction pose new challenges for controlling the flow of such samples. Several experimental and numerical studies have shown that for frictional hard grains the discharge rate of a silo is constant and independent of the filling height [1, 14, 12, 13, 10, 11, 9], if the orifice diameter is larger than about 5 particle diameters [15]. This feature is very useful in engineering applications and lead to the emergence of simple devices such as the hourglass. More precisely, the flow rate was found to be constant until near the end of the discharge when the shape of the bed surface (often having a form of a funnel) starts perturbing the outflow. These results hold for such particles as spherical beads of various materials (glass, steel, lead, plastic) [14, 12, 13, 18, 16, 17], nearly spherical particles (e.g. peas) [11], grains with irregular shape (e.g. sand) [8], or slightly anisometric grains (wheat, corn, soybeans, poppy seeds, oat) [10, 9]. The fact that the flow rate was found to be constant for a wide range of materials facilitated the characterization of the outflow as a function of the orifice diameter . The flow rate in a three-dimensional (3D) silo was found to vary approximately as , where the best fit was obtained either using an effective orifice diameter in place of , taking into account the grain size [8, 19, 1], or taking into account the slight density decrease near the orifice with decreasing orifice size [14]. This so-called Beverloo scaling was experimentally tested in various systems and was shown to work even at increased or decreased gravitational acceleration [20].
It is also known that the weight of the material in the silo is partly supported by the frictional contacts with the walls. As a consequence, the basal pressure (i.e. the normal stress measured at the bottom of the silo) saturates with increasing fill height . This phenomenon was first systematically investigated by Janssen [22, 23], who confirmed the earlier measurements of Huber-Burnand [24], Hagen [25, 8], and Roberts [26]. The so-called Janssen effect is also present when the contacts are mobilized (experiments with moving walls) [27, 28] and the curve is best described by a combination of a linear section (hydrostatic behaviour) at the bottom of the silo and an exponential saturation in the upper section [27, 29], where the saturation length is comparable to the silo diameter .
The height-independent constant basal pressure would serve as a good argument for the constant flow rate as several authors mentioned [2, 3, 5, 7, 14, 30]. For comparison, in a cylinder filled with a liquid the discharge rate is clearly determined by the pressure (compare, for example, the clepsydra), which is linearly increasing with the height of the liquid column. In the low viscosity limit, the conservation of energy leads to a flow rate proportional to (Torricelli’s law). For large viscosities, dissipation dominates near the outlet, leading to . Investigations on granular flows showed, however, that the discharge rate is independent not only on , but also on the silo diameter in case and [31, 32]. Thus, a simple relation between and has to be dropped, since according to the above described Janssen effect, clearly increases with . Pacheco-Martinez et al. also showed [12] that slightly vibrating the hopper wall one can get hydrostatic conditions in the pressure profile (i.e. Janssen screening disappears), but when the orifice is opened, Janssen screening reappears, and the silo still discharges the same way as without vibration. Other recent experiments showed that different filling protocols might lead to different pressure profiles, but the flow rate was found to be independent of the basal pressure [18, 21].
The mechanism leading to a constant discharge rate of a granular material is still the subject of active research. Detailed experimental and numerical investigations are carried out to analyze the flow near the orifice, where the nature of dissipation clearly changes. There is a region with paraboloid or hemispherical shape below which dissipation strongly drops. This was first identified by Hagen [25]. Based on this, Brown and Richards introduced the concept of a free-falling arch signifying the region where energy dissipation decreases to a minimum [31]. At this surface, the stress in flow direction vanishes and from here the grains are freely falling [33]. Similar reasoning lead to the development of an alternative approach called the hourglass theory, which predicts the discharge rate quantitatively [34, 35]. Recent works tested and refined these ideas [1, 30, 9, 14, 36, 37]. Among these, Darias et al. derived differential equations based on energy balance and the so called rheology [37]. Their results are compatible with the Beverloo law, and the authors found an increase in the flow rate when the interparticle friction is reduced. They also validated their theory numerically by 3D Discrete Element Model (DEM) simulations.
Other recent investigations tested the limitations, i.e. identified conditions where the flow rate is not constant anymore. Introducing an interstitial fluid clearly changes the dynamics, resulting in an increased flow rate near the end of the discharge process [38, 17]. Recently, this effect was shown to be present – although with a much smaller amplitude – in dry granular flows of glass beads in case the particles were sufficiently small ( mm) [16]. For mm glass beads, the flow rate was again found to be constant [17]. Another investigation pointed out that applying a large stationary external force leads to an increased flow rate during the discharge of a dry granular material [39].
Some of the earlier numerical investigations mentioned that decreasing the frictional damping leads to height dependent (i.e. not constant) flow rates [40, 41]. Another numerical work reported strongly changing pressure conditions, but only slightly increasing flow rates with decreasing wall friction [42]. Using discrete element simulations, Balevicius indicated decreasing flow rates with increasing interparticle friction in a quasi-2D system with limited size, and a time dependent flow rate [43]. In the above-mentioned recent work by Darias et al. [37] on a 3D system, a time dependent (slightly decreasing) flow rate is noticeable for their lowest value () of the friction coefficient. Langston et al. [44] investigated the case of frictional grains () and found that the discharge rate was rather insensitive to the stiffness of the interparticle interactions. In a different numerical approach, Staron et al. implemented a plastic rheology in a 2D Navier-Stokes solver (following the so called rheology or constant friction) [45], which showed a transition from granular-like (constant flow rate) to liquid-like (decreasing flow rate) behaviour with decreasing friction below about .
In the present work, we show that the discharge behaviour of low friction soft hydrogel beads strongly differs from the case of hard frictional grains described by a constant flow rate. We quantify the difference in laboratory experiments by measuring the flow rate and the normal force exerted on the bottom of the silo during the discharge process for both low friction soft and frictional hard grains. We perform numerical (Discrete Element Method) simulations to explore the effect of grain softness and surface friction on the flow rate as well as on the stress conditions inside the silo. Our work was motivated by recent investigations on clogging statistics of soft particles in two-dimensional hoppers [46, 47, 48] and X-ray tomographic measurements on the flow field of soft particles in a three-dimensional hopper [49, 50], all of which noticed a fill height dependence of the clogging probability or the flow properties.
2 Experimental system
An acrylic cylindrical silo with inner diameter mm and height mm was used. The bottom plate was physically disconnected from the silo with a gap of approximately 1 mm, and it was held by a load cell enabling a continuous monitoring of the force exerted on the bottom (see Fig. 1). Two types of filling protocols were used: pouring the grains into the silo with faster () and slower () speed. Lower pouring rates resulted in slightly (a few percent) denser packing of the granular bed (see Fig. 1 for the data). The silo was discharged through a circular orifice of diameter in the middle of the bottom plate. The typical discharge time was in between 50-100 s. During discharge, both the force exerted on the bottom of the silo and the discharged mass were continuously measured by the load cells at a sampling rate of 1 kHz. The data series were then smoothed by a convolution with a Bartlett (triangle) window of a width of 1 s to reduce noise. The data for the discharged mass were differentiated and smoothed again with the same smoothing procedure to obtain the flow rate . The value of is presented in grains/s. For this purpose, the average unit mass of the individual grains was determined by measuring the mass of 200 grains. The evolution of the fill height during discharge of hard grains was calculated from the discharged mass data assuming a linear relation between the height and the mass in the silo. For soft grains, pressure induces compression of the material, so the discharged mass–fill height relation was approximated by a third order polynomial which was previously calibrated.
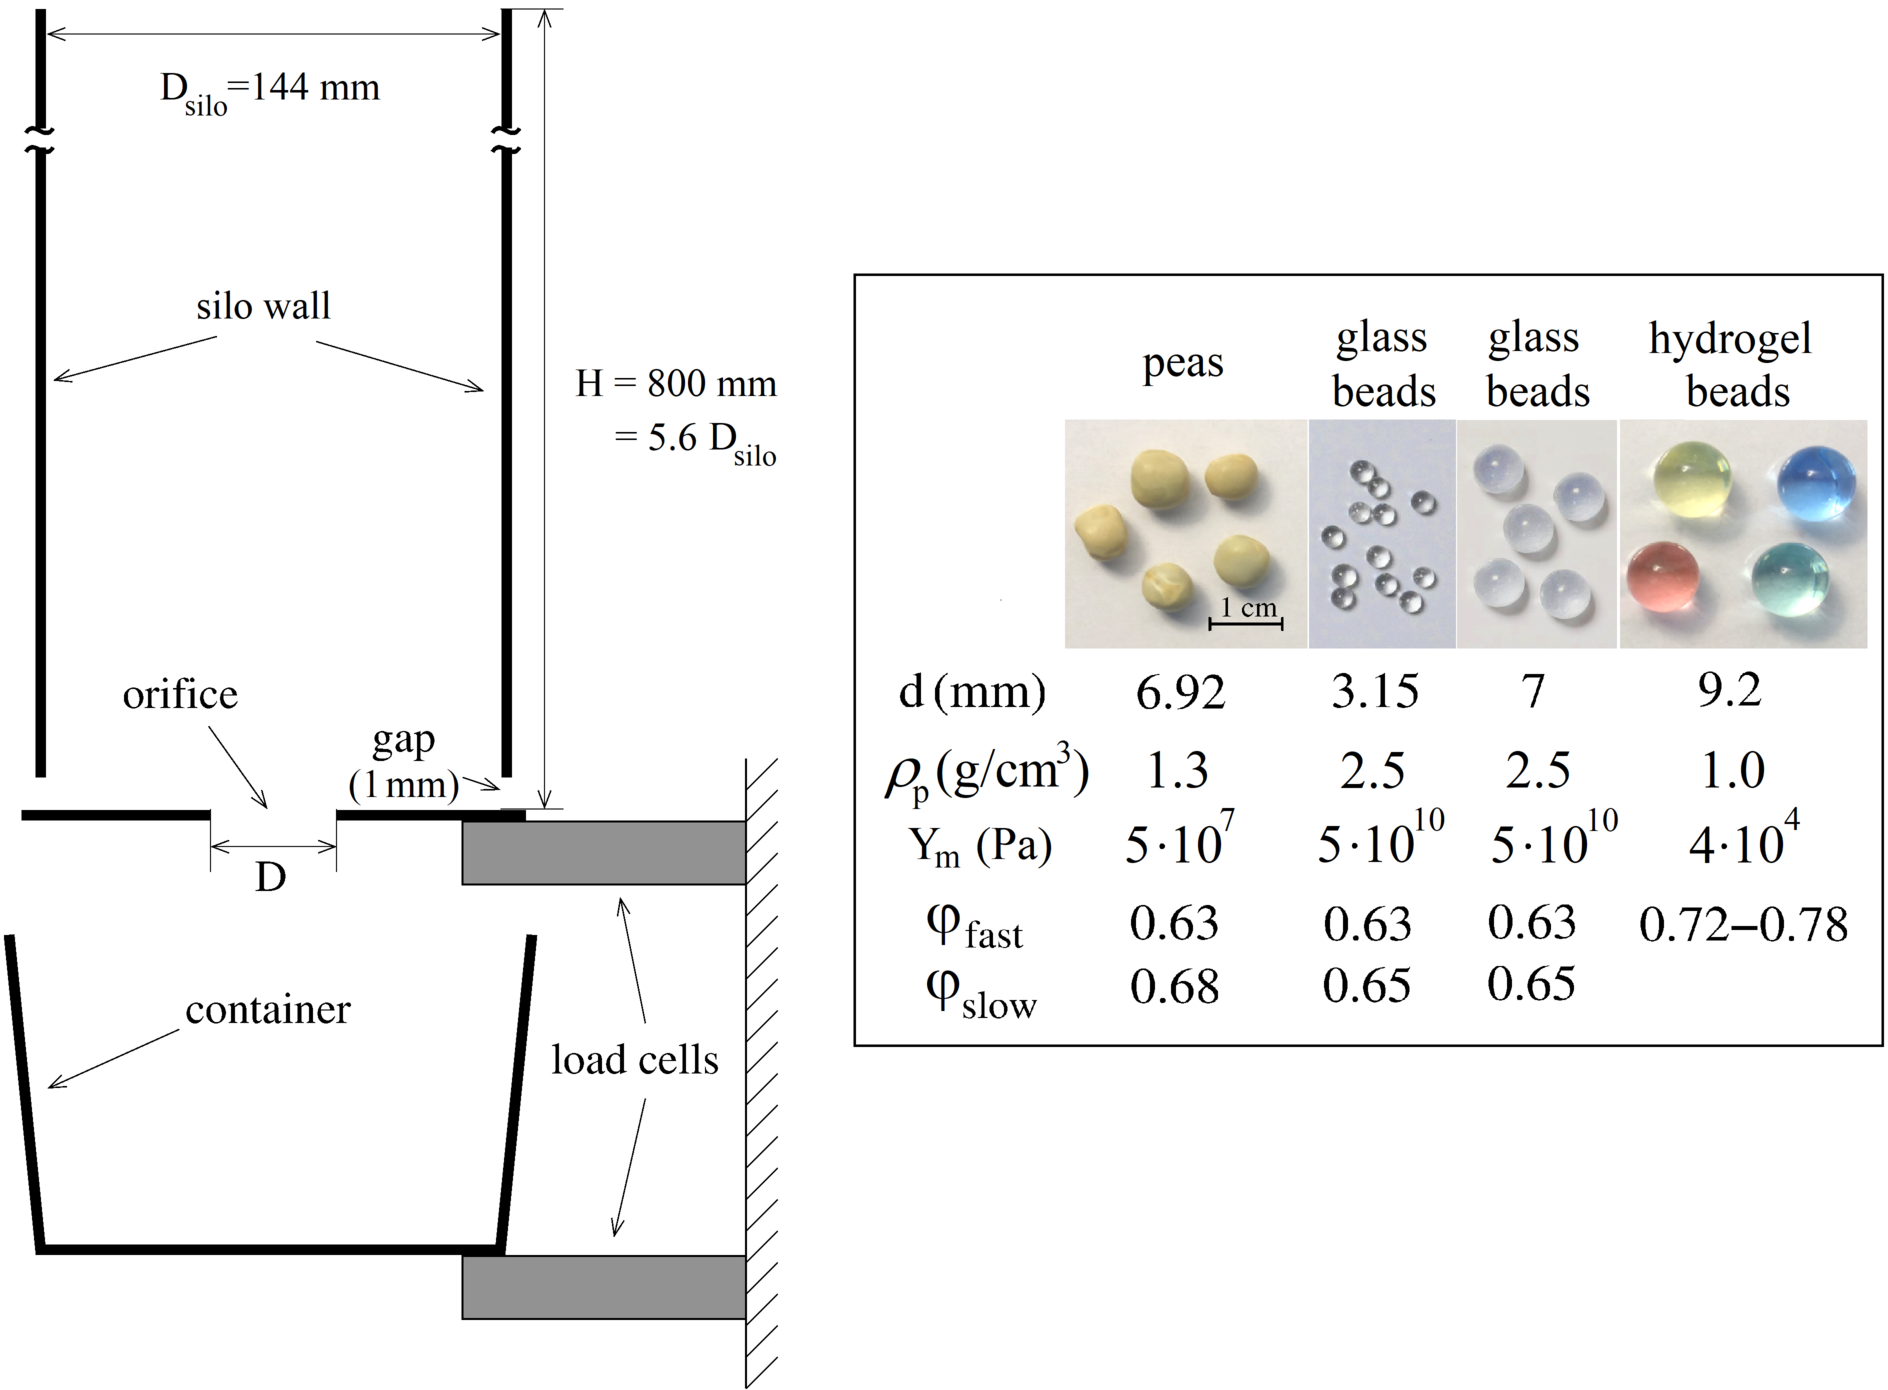
Four granular samples have been used in the experiments: nearly spherical pea seeds (supplier: Gyari-Mag BT, Hungary), two samples of spherical glass beads (with diameters in the range of mm mm and mm mm, both from Sigmund-Lindner GMBH, Germany), and spherical hydrogel beads (Happy Store, Nanjing, China) (see Fig. 1). For the glass bead samples, we used two versions: clean and lubricated. Lubrication was achieved by spraying the glass beads ( 20 kg) before pouring them into the silo as well as the inner surface of the silo with about 500 ml of silicone oil (Motip). The table also indicates the packing fractions resulting after fast or slow filling of the silo. For the hydrogel beads, the packing fraction depends on the magnitude of the contact forces, thus it changes with height [49].
Three samples (peas, clean glass beads with mm and mm) are considered frictional hard grains with a friction coefficient of about 0.3-0.5, while the hydrogel balls are soft and have very small interparticle friction coefficient. By measuring the Hertzian contact diameters, the Young’s modulus of our hydrogel spheres was found to be between 30 and 50 kPa [46], with a slightly softer outer part than the core. This is similar to the results of other measurements with hydrogel beads, which yielded a Young’s modulus of kPa [59]). In earlier studies, the interparticle friction coefficient of hydrogel beads was found to be [51]. We will show below that the discharge of the low friction soft hydrogel particles is very different from the frictional hard grains. This motivated us to reduce the surface friction of our glass bead samples by spraying silicone oil on the surface of the beads as well as on the silo wall.
The friction coefficient for hard surfaces with a lubricating layer depends on the normal force and the sliding velocity [52], so we carried out experiments on inclined planes to measure this friction coefficient. In the first set of experiments, a wooden block of a mass of 188 g was used with three glass beads glued on it serving as three legs. The inclination angle was determined at which the block was sliding without acceleration on an acrylic flat surface (similar to the silo wall). The friction coefficient was determined as the tangent of the inclination angle. For clean glass beads and a clean surface, the friction coefficient was , while for lubricated glass beads and a lubricated surface, we got a considerably reduced value . The surface of the hydrogel beads is naturally wet, so for these grains the same measurement was repeated without any lubricant, and resulted a friction coefficient of . We note that the typical normal force in these tests was much larger (a few hundred times) than the weight of a single grain. In the second set of experiments, a thin plastic foil was used instead of the wooden block, thus the sliding object essentially had the weight of the three beads. In this case the measured sliding friction coefficient of the clean glass beads was for the smaller ( mm), and for the larger ( mm) beads. For lubricated glass beads, stationary sliding was observed for a wide range of the plane inclinations for mm, and for mm, corresponding to friction coefficients of and for small and large beads, respectively. The stationary sliding speed was typically a few cm/s, it increased with . Thus, for the case of glass beads for typical sliding velocities observed in our silo during discharge the friction coefficient at lubricated contacts changes considerably with the normal force. For certain contacts it can be similarly small to the case of soft hydrogel beads, for other contacts its value is much larger, it is similar to that of dry glass bead contacts.
3 Numerical system
Discrete Element Method (DEM) simulations were performed using LIGGGHTS [53], a general granular simulation software. The DEM algorithm resolves the particle–particle interactions, and integrates both the translational and rotational motion of each particle. The interaction force between two contacting particles and was computed using the Hertz-Mindlin model with no-slip condition, the default nonlinear implementation of LIGGGHTS [54]. This numerical scheme allows the estimation of the elastic and damping interaction parameters given the Young modulus , Poisson’s ratio of the material, the normal restitution coefficient and friction coefficient of the particles. Moreover, the magnitude of the elastic tangential force is constrained by the normal one, , satisfying the Coulomb constraint . The effect of rolling resistance and resistance to torsion were not taken into account.
We use a cylindrical silo with similar dimensions as the experimental system, spherical beads with a polydispersity of the grain diameter of for hard beads and monodisperse for the case of soft particles. Test runs indicated that for the case of hard grains, polydispersity was necessary, as for a monodisperse system increased velocity fluctuations were observed (most probably due to local spatial ordering). No such differences were observed for the case of soft grains. The discharge process was simulated for various values of the material parameters by systematically changing the Young modulus, the normal restitution coefficient and friction coefficient , while a constant particle density and Poisson’s ratio of was used in all cases. For the case of hard grains we used Pa which results in a negligible Hertzian normal deformation for a basal pressure of kPa. For soft grains, we used Pa yielding . The particle-wall interaction was modeled using the same contact parameters used for particle-particle interaction. The time steps were estimated to be less than , where is the contact time.
For the preparation of the initial state of the simulations, the positions of the particles were generated using the random sequential deposition model in order to avoid overlaps between particles. For each configuration (interparticle friction and material stiffness), the procedure was realized using two protocols: one with an interparticle friction coefficient of and one with zero interparticle friction. This was done to mimic the fast and slow filling procedures in the experiment, respectively. Here, filling the silo with zero interparticle friction resulted in a slightly higher initial packing. After filling, the orifice is opened and the material starts to flow out of the container.
Similarly to the experiments, we monitored two macroscopic quantities during the outflow process. First, the flow rate was calculated using the number of particles exiting the silo in fixed time intervals of s. Second, the vertical component of the total force acting on the bottom surface was calculated. The mean height of the column was estimated averaging the highest particle locations within 8 equally spaced intervals in the radial direction.
3.1 Coarse-grained continuum description
In order to extract the averaged macroscopic fields from the DEM data, a coarse-graining (CG) micro-macro formulation can be derived from the classical laws of conservation [55, 56, 57, 58]. Thus, this procedure leads to expressions for macroscopic density, velocity and stresses, in terms of particle properties and the contact interactions.
Starting with the DEM data for the positions and velocities of the particles, the microscopic mass density of a granular flow can be defined [55, 56, 57, 58] at time as
| (1) |
where the sum runs over all the particles within the system and is an integrable coarse-graining function, which was chosen to be a 3D Gaussian function with standard deviation equal to the mean particle radius . In the same way, the coarse-grained momentum density function is defined by
| (2) |
where represents the velocity of particle . The macroscopic velocity field is then defined as the ratio of momentum and density fields,
| (3) |
In order to define the mean stress field, we have used a very elegant and mathematically consistent definition of mean stress introduced by Goldhirsch [55]. Following this approach, the total stress field is composed by the kinetic stress field and the contact stress field . They are defined as follows. The mean contact stress tensor reads as
| (4) |
where the sum runs over all the contacting particles , whose centers of mass are at and , respectively. Moreover, accounts for the force exerted by particle on particle and .
The kinetic stress field reads as
| (5) |
where is the fluctuation of the velocity of particle , with respect to the mean velocity field.
| (6) |
Once the total stress tensor is found, the pressure at any location can be calculated.
Based on the previous theoretical framework, we implemented a post-processing tool which allowed us to examine all the micro-mechanical properties of the particulate flow. Taking benefit of the cylindrical symmetry of the system, one can average quantities within the azimuthal direction. As a result, the obtained macroscopic fields are in cylindrical coordinates and . We will denote averaged quantities as
| (7) |
4 Results
4.1 Filling the silo
As discussed in the introduction, it is long known that for a frictional granular material the force at the bottom of a silo deviates from the hydrostatic behaviour, as part of the weight is supported by frictional contacts with the silo walls [22, 23]. This effect is clearly seen for the frictional samples in Fig. 2, where we normalize the basal force by the weight of the material corresponding to a full silo. For peas, two curves are presented, corresponding to the preparation protocols with filling speeds of 500 (continuous lines) and 50 (dashed lines). The slower filling procedure (leading to denser packing) resulted in slightly higher pressure at the bottom of the silo, i.e. in this case contact forces with the silo wall are weaker. In these measurements the silo was filled in 16 steps, and the filling height was measured visually in each step taking benefit of the transparent silo wall.
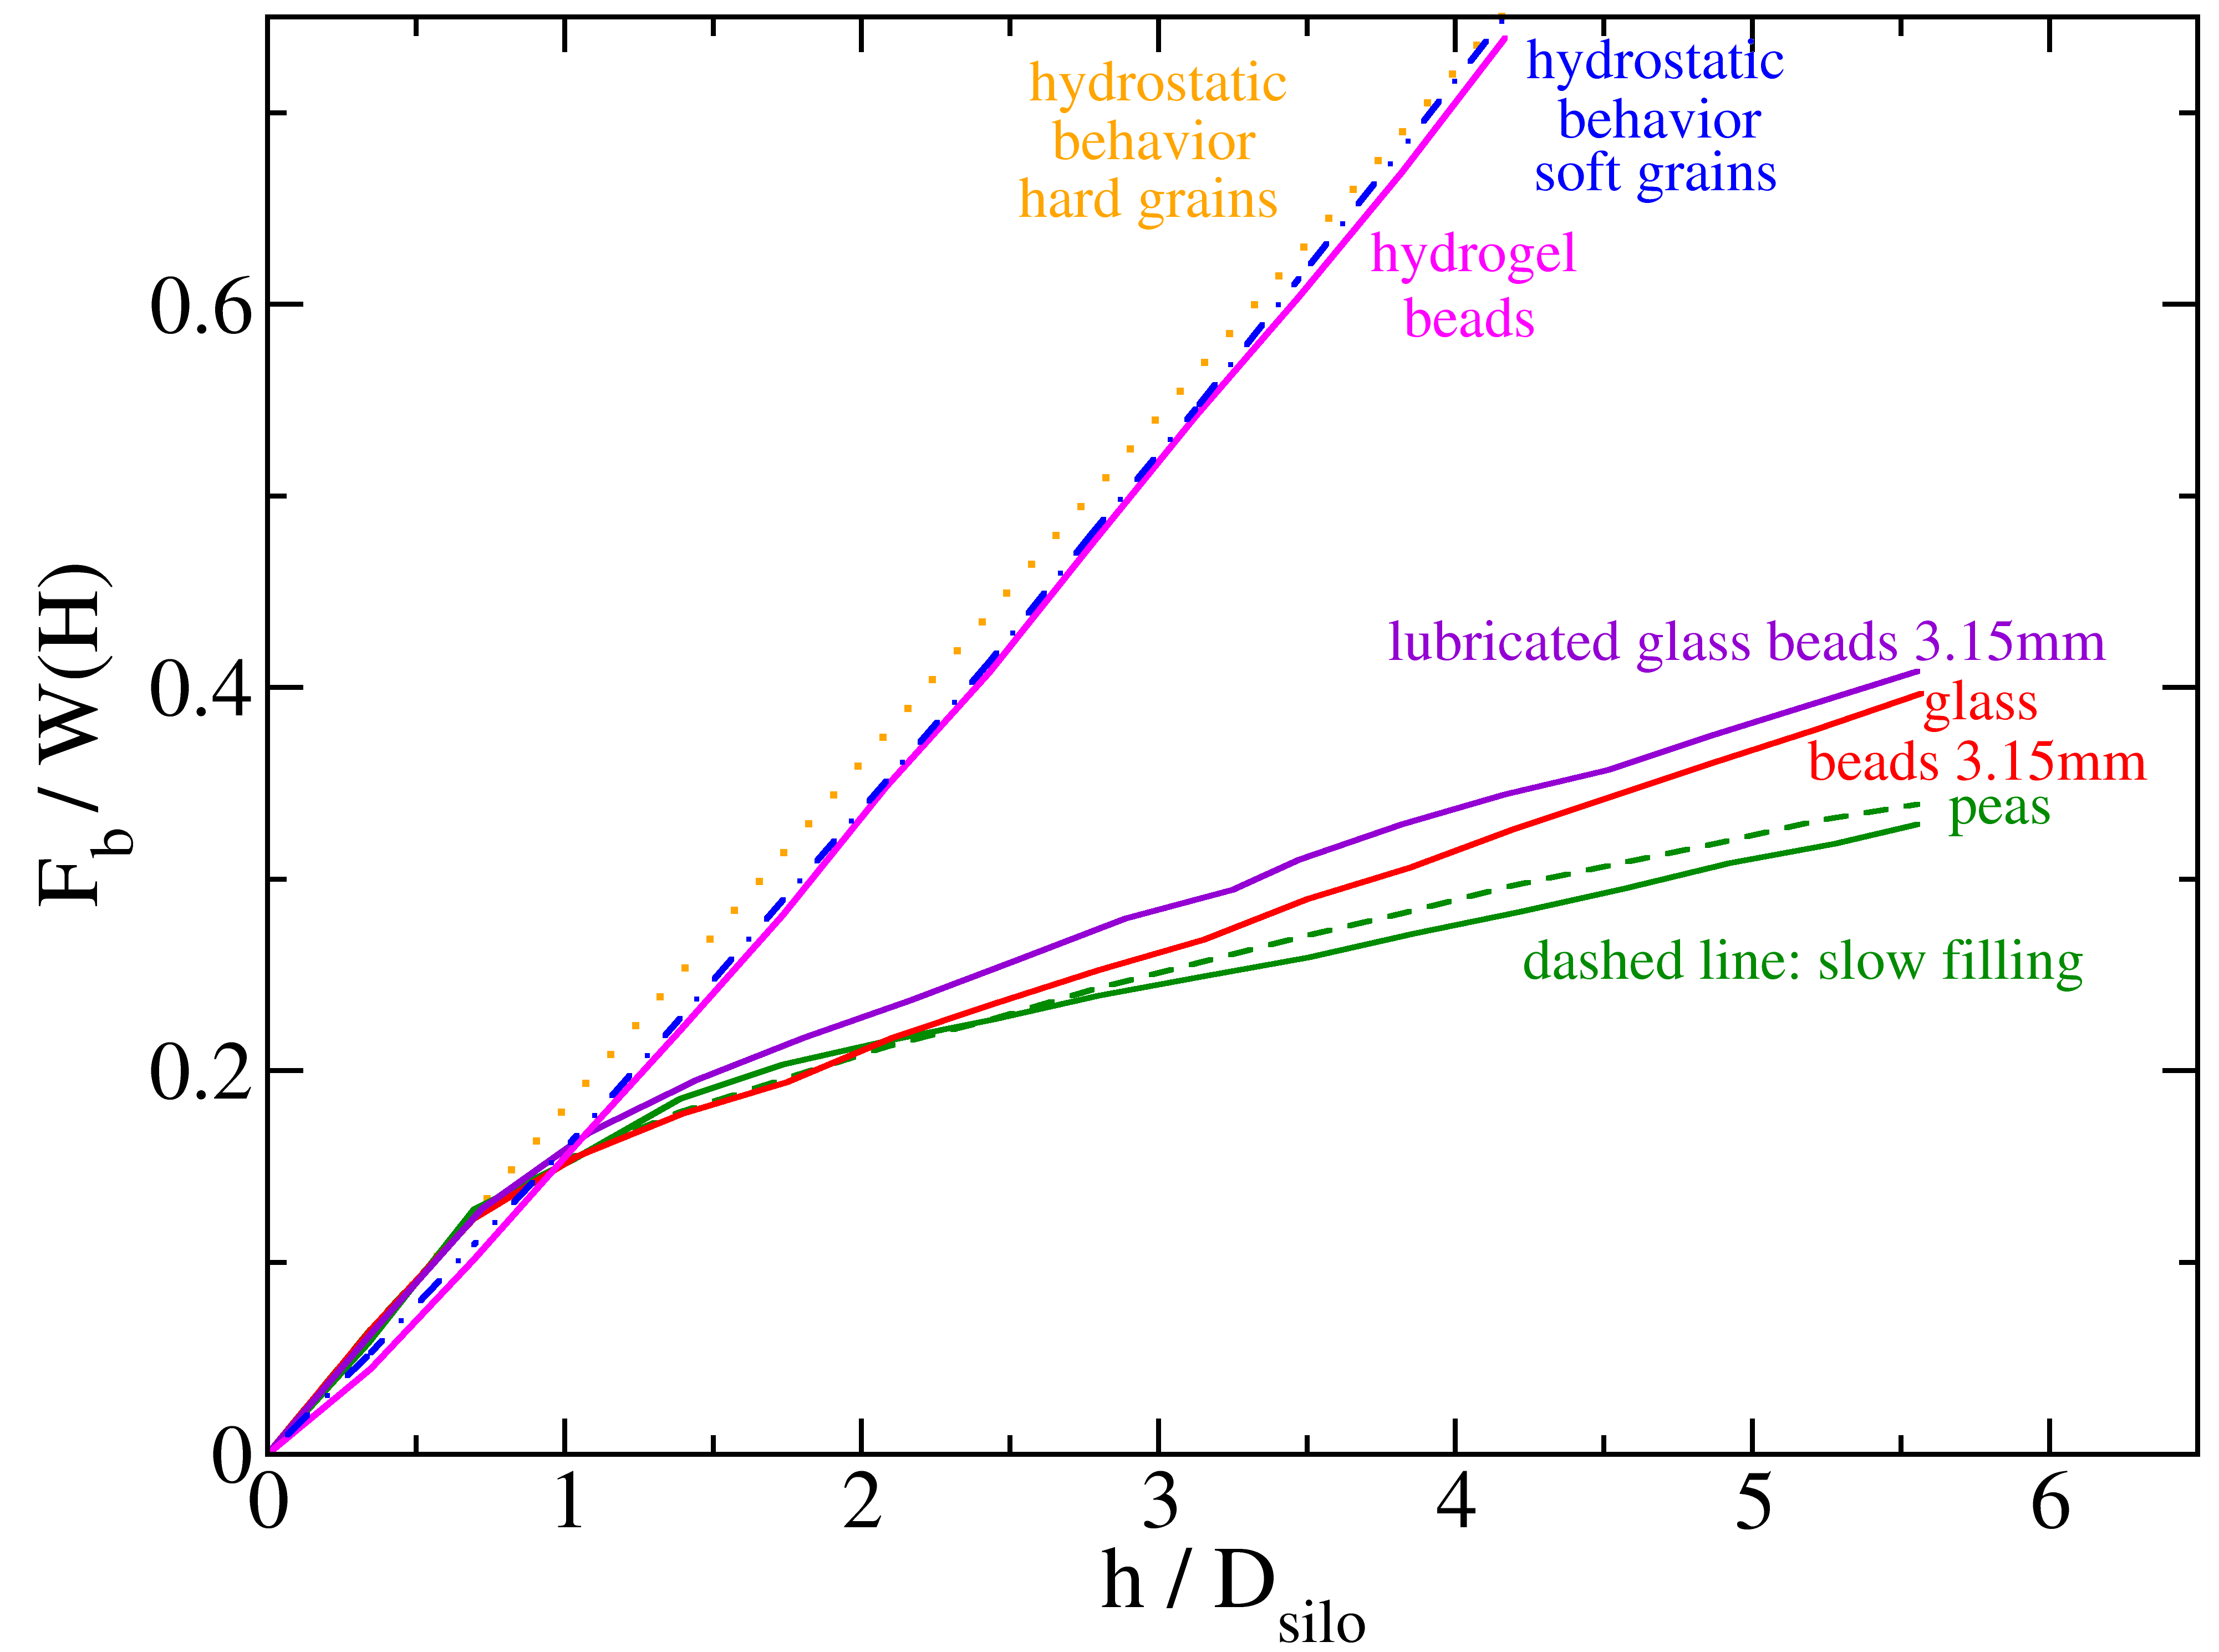
For hydrogel beads, the curve is very close to the hydrostatic behaviour, which is coherent with the very low friction coefficient () of these particles. Note that for this material the packing fraction increases with pressure, especially at low pressures. This leads to the fact that for such a compressible material the hydrostatic curve is not a straight line but its slope increases with , especially at filling heights . For this material, we filled the container only up to a height of cm (), since at complete filling ( cm) the pressure at the bottom of the silo occasionally caused breaking of some beads, pushing fragments into the gap between silo and bottom plate.
The curve for the lubricated glass beads is not similar to that of the hydrogel beads, but almost the same as that of the dry glass beads. This is due to the complex nature of lubrication, which is characterized by a contact force dependent friction coefficient as demonstrated in section 2. Moreover the thin layer of silicone oil also results in a cohesive interaction at the grain-grain or grain-wall contacts. The magnitude of the cohesive force can reach the weight of a grain. We have observed, that after discharge a few grains remain on the wall, and slide down only very slowly.
4.2 Silo discharge: comparison of experiments and simulations
The discharge curves, i. e. the time evolution of the flow rate and the force exerted at the bottom of the silo during discharge are presented for peas in Fig. 3(a-d) for both types of initial preparation (slow and fast filling). As is seen, both the flow rate and the basal force had a very similar time evolution for the two types of preparation. Looking at the top panels, we see that the flow rate was basically constant during discharge, even when the pressure conditions at the bottom of the silo changed during the process. The flow rate curves are the same for the two types of initial conditions, i.e. changing the initial density did not affect the discharge rate.
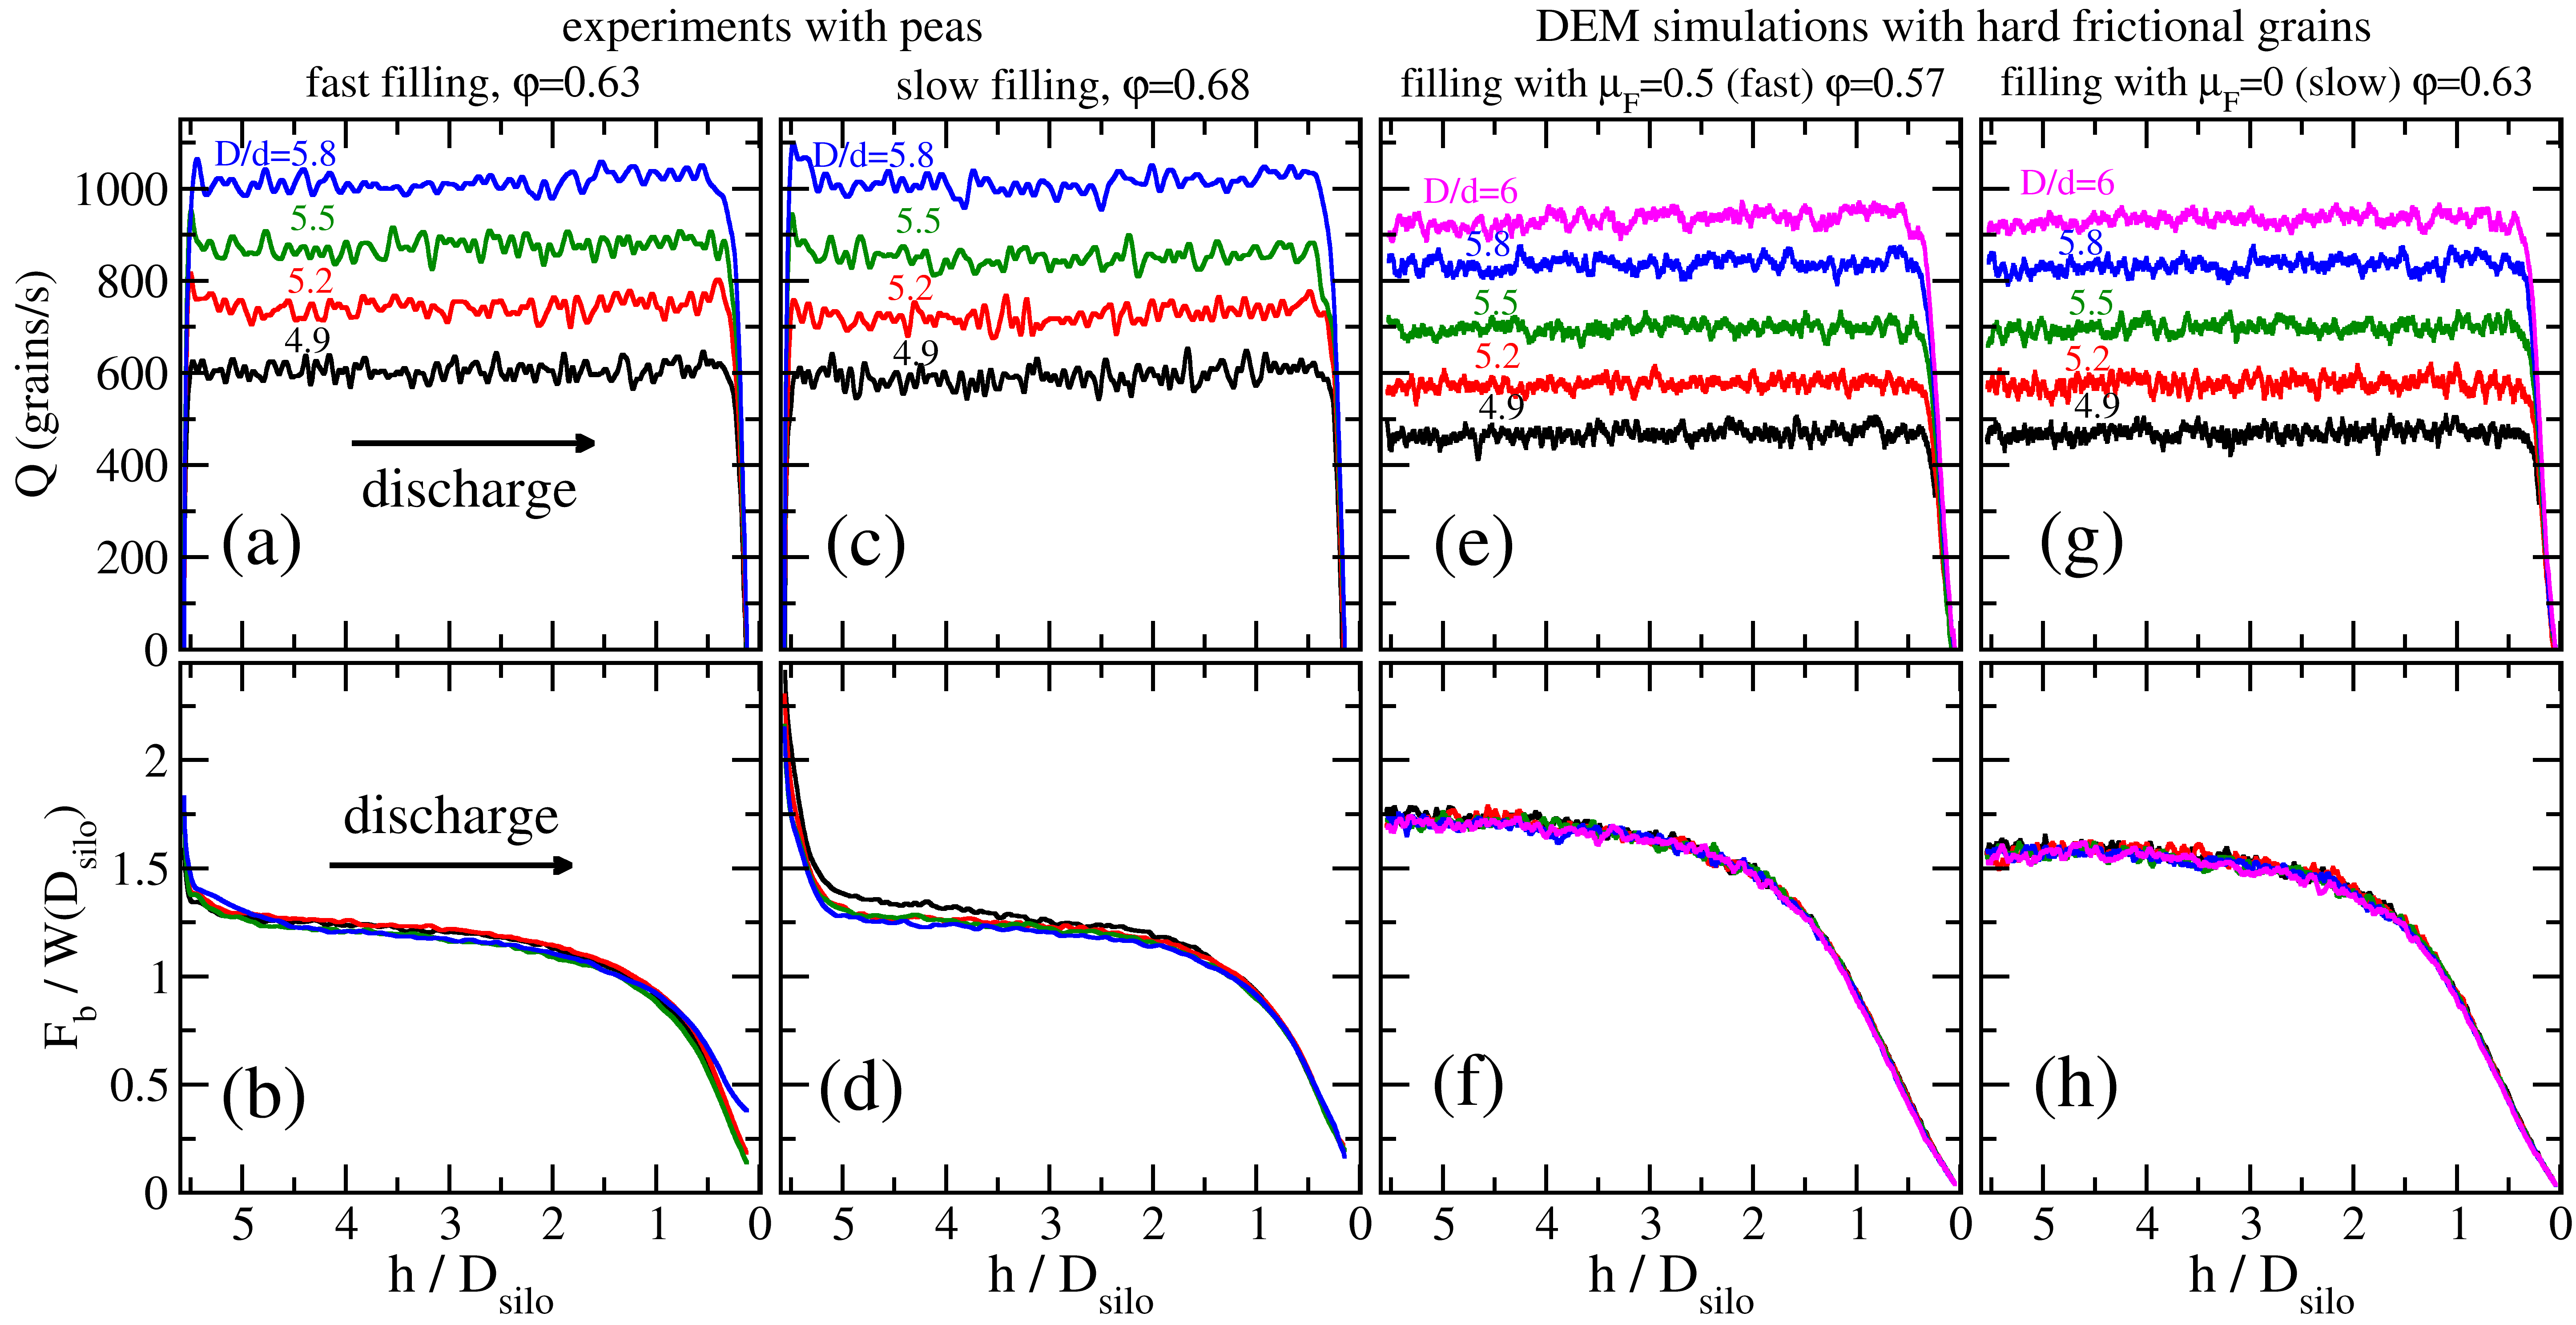
The bottom panels show that the basal force first decreased relatively quickly to the same level for both initial conditions. This drop is partly attributed to the activation of the force network transferring weight to the container walls. After this initial transient – which was finished when about 5 of the total mass was discharged – the basal force decreased only slightly until was approximately 2, and then a faster decrease rate set in. We note that the curves measured for different orifice diameters in Figs. 3(b) and (d) overlap, thus the basal force does not depend on the discharge rate.
We now compare the above experimental observations with the results of DEM simulations for hard beads with Young’s modulus of Pa and a restitution coefficient of . Similarly to the experiments, these results have been obtained with frictional grains (friction coefficient: ) for both cases: filling with and , corresponding to fast and slow filling, respectively. As we see in Fig. 3(e-h), the numerical data reproduce all the features observed in the experiments: constant flow rate despite the changes in the basal force, same basal force curves for different orifice sizes (i.e. for different discharge rates), and very similar values of the measured parameters for the two initial conditions. There is only a slight quantitative difference between experiment and simulation: the flow rate is a bit lower and the basal force is a bit higher in the simulations.
The discharge of low friction, soft hydrogel beads is remarkably different from the traditional granular discharge demonstrated above with peas and numerical simulations for hard frictional grains. As seen in Figs. 4(a-b), the basal force decreases nearly linearly (close to the hydrostatic conditions), and more importantly, the flow rate also decreases gradually during discharge. Another important thing to note is that for hydrogel beads clogging is only observed at much smaller orifice sizes, i.e. the silo discharge is continuous for the relatively small orifice sizes given in Figs. 4(a-b), which is in accordance with earlier experimental observations [50].
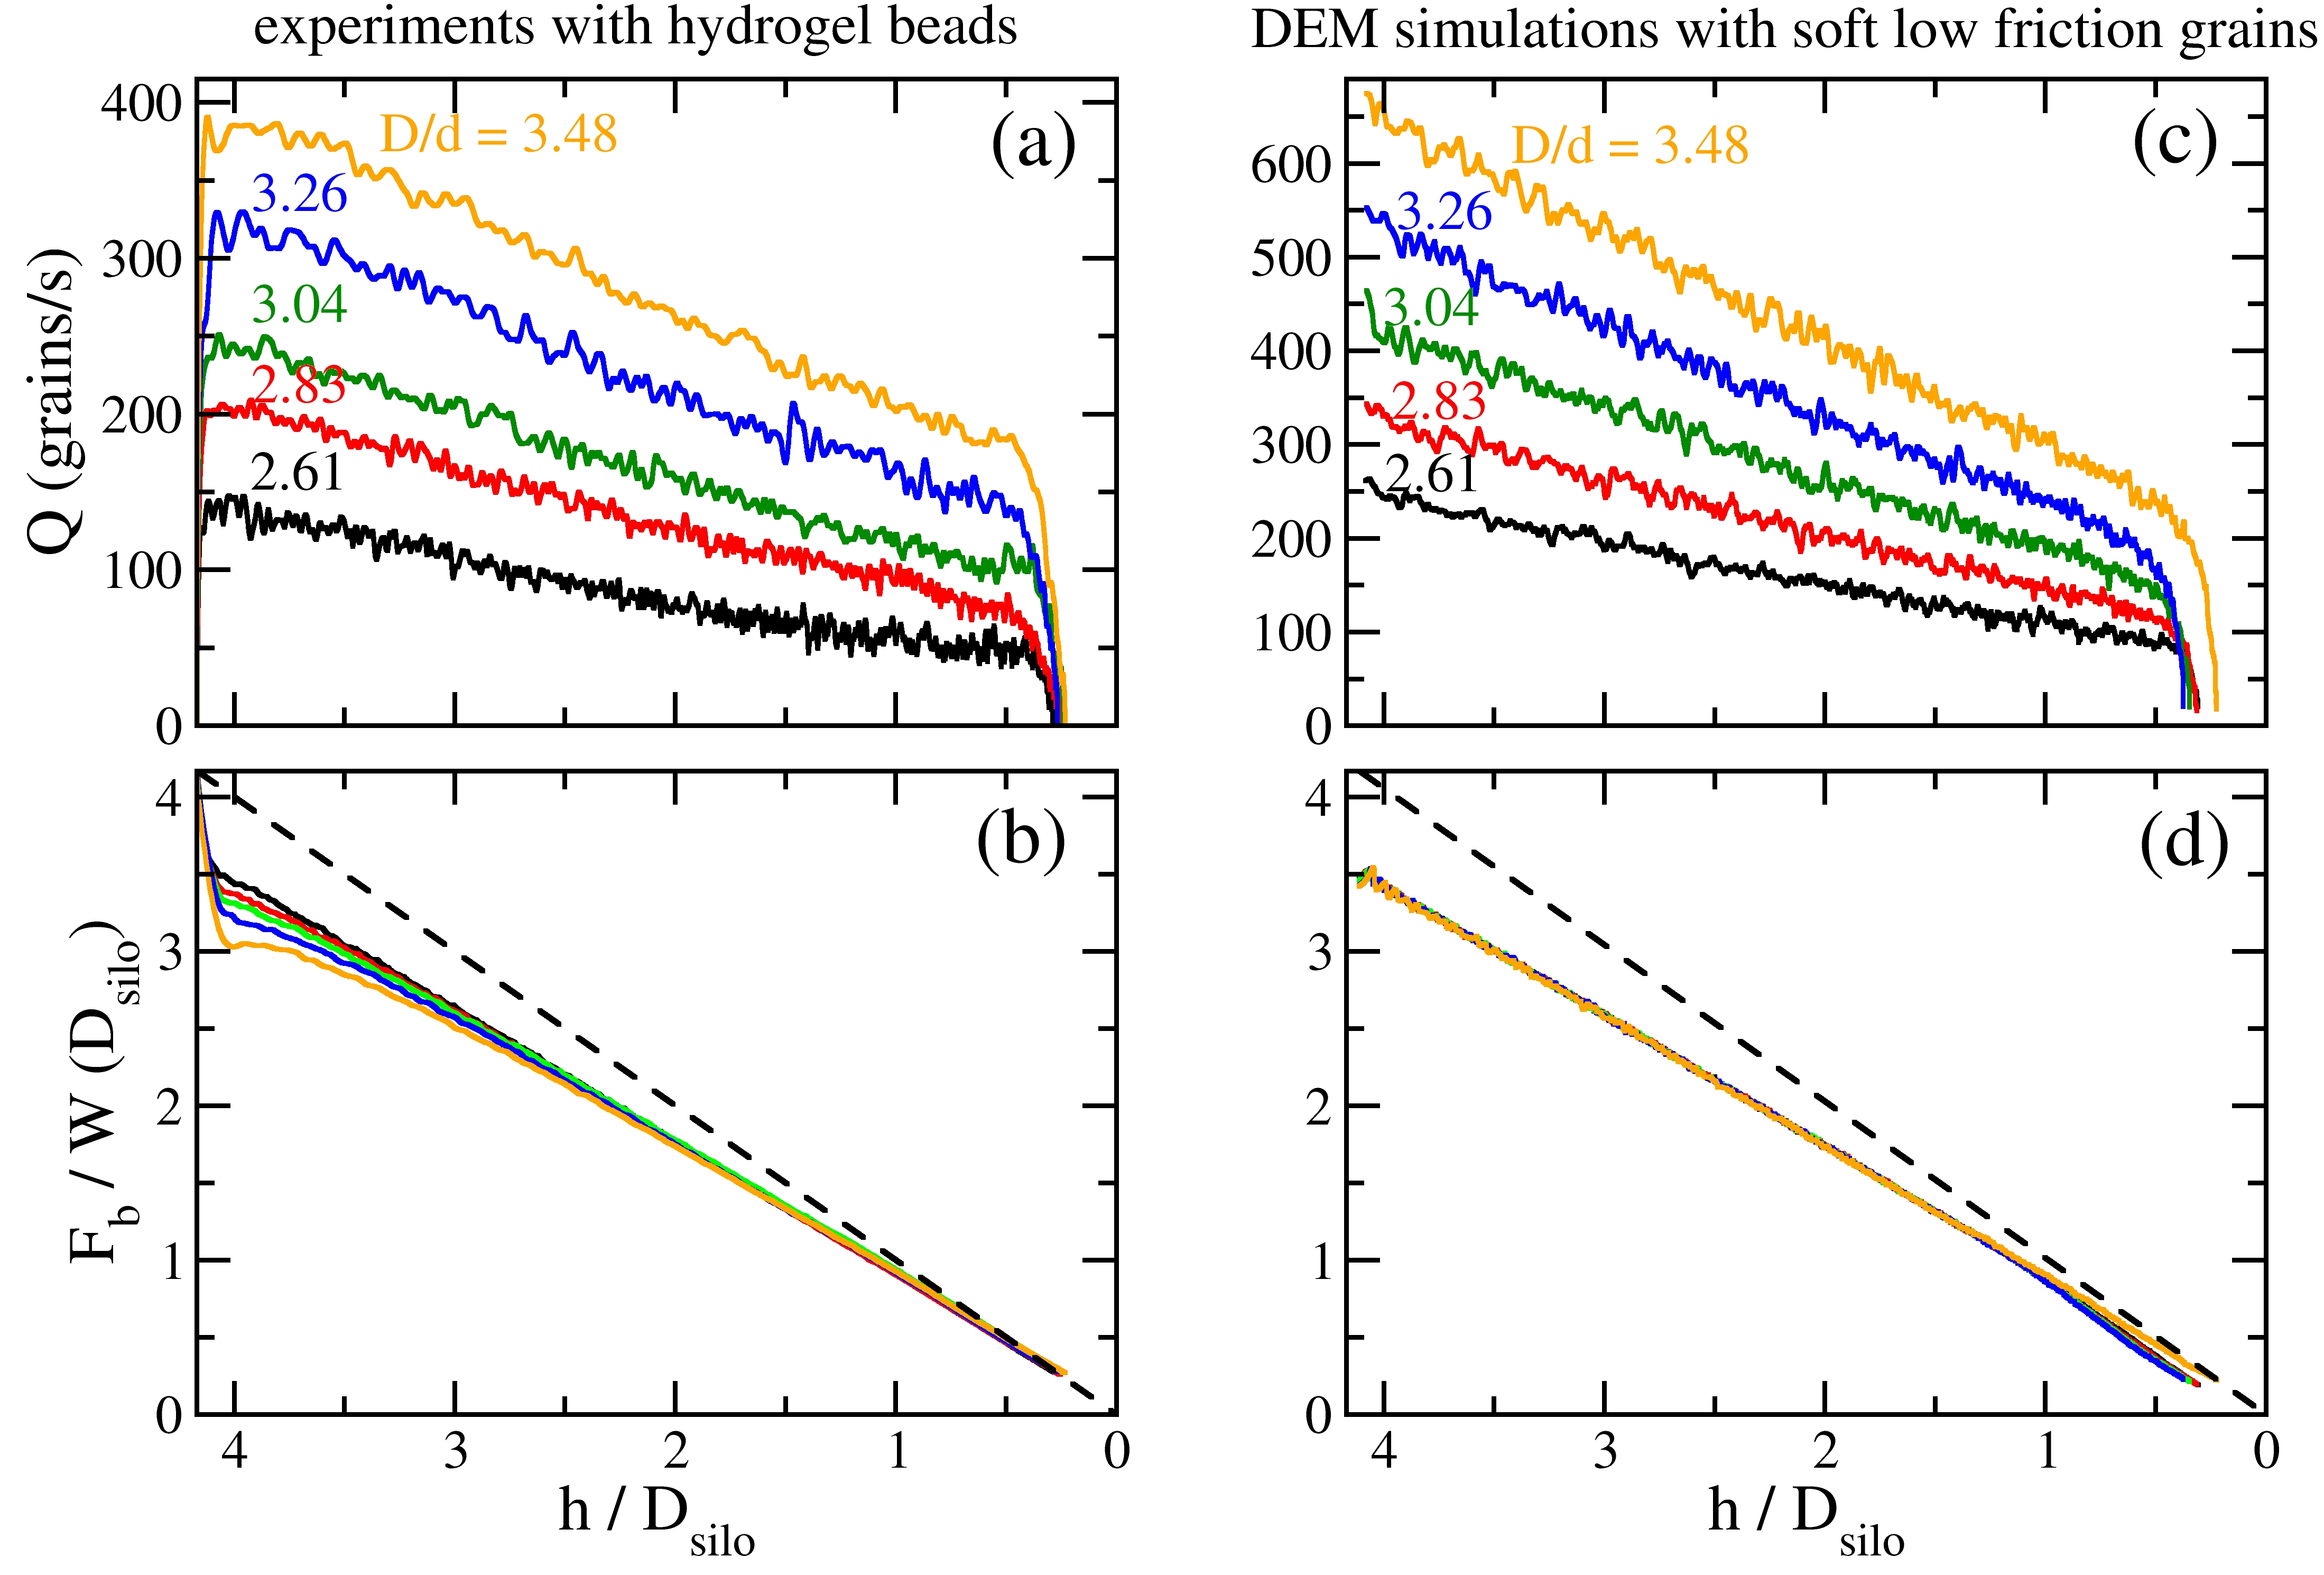
In order to model the experimentally observed behaviour of soft low friction grains, we performed a systematic numerical (DEM) study by changing the interparticle friction, the Young’s modulus , and the coefficient of restitution of the particles. By adjusting these parameters, the experimental data for hydrogel beads were best reproduced with , Pa and (see Fig. 4c-d). First, choosing ensures a quantitative match between the experimental and numerical values of the basal force during discharge (compare Figs. 4b and d). Second, the numerical flow rate data (Fig. 4c) nicely reproduce the experimentally observed linearly decreasing trend qualitatively, but are about higher than the experimental values (Fig. 4a). Increasing the Young’s modulus and decreasing the restitution coefficient both decrease the flow rate, with the Young’s modulus having a stronger effect. For this we use Pa, which is about 3 times larger than the average nominal value. This is in accordance with recent results by Brodu et al. who showed, that when such soft grains have multiple contacts, the resistance of the material against pressure becomes stronger, as deformation of the grain due to the force at a given contact increases the contact force on the other side of the grain [60]. Better match between the flow rates of experiment and simulation could not be obtained, since further increase of (say by a factor of 2) lead to clogging. The value of Pa results in a typical Hertzian normal deformation of for a silo with a basal pressure kPa. As said above, changing the value of the restitution coefficient has a smaller effect on the flow rate, the value of was estimated from drop and bouncing experiments.
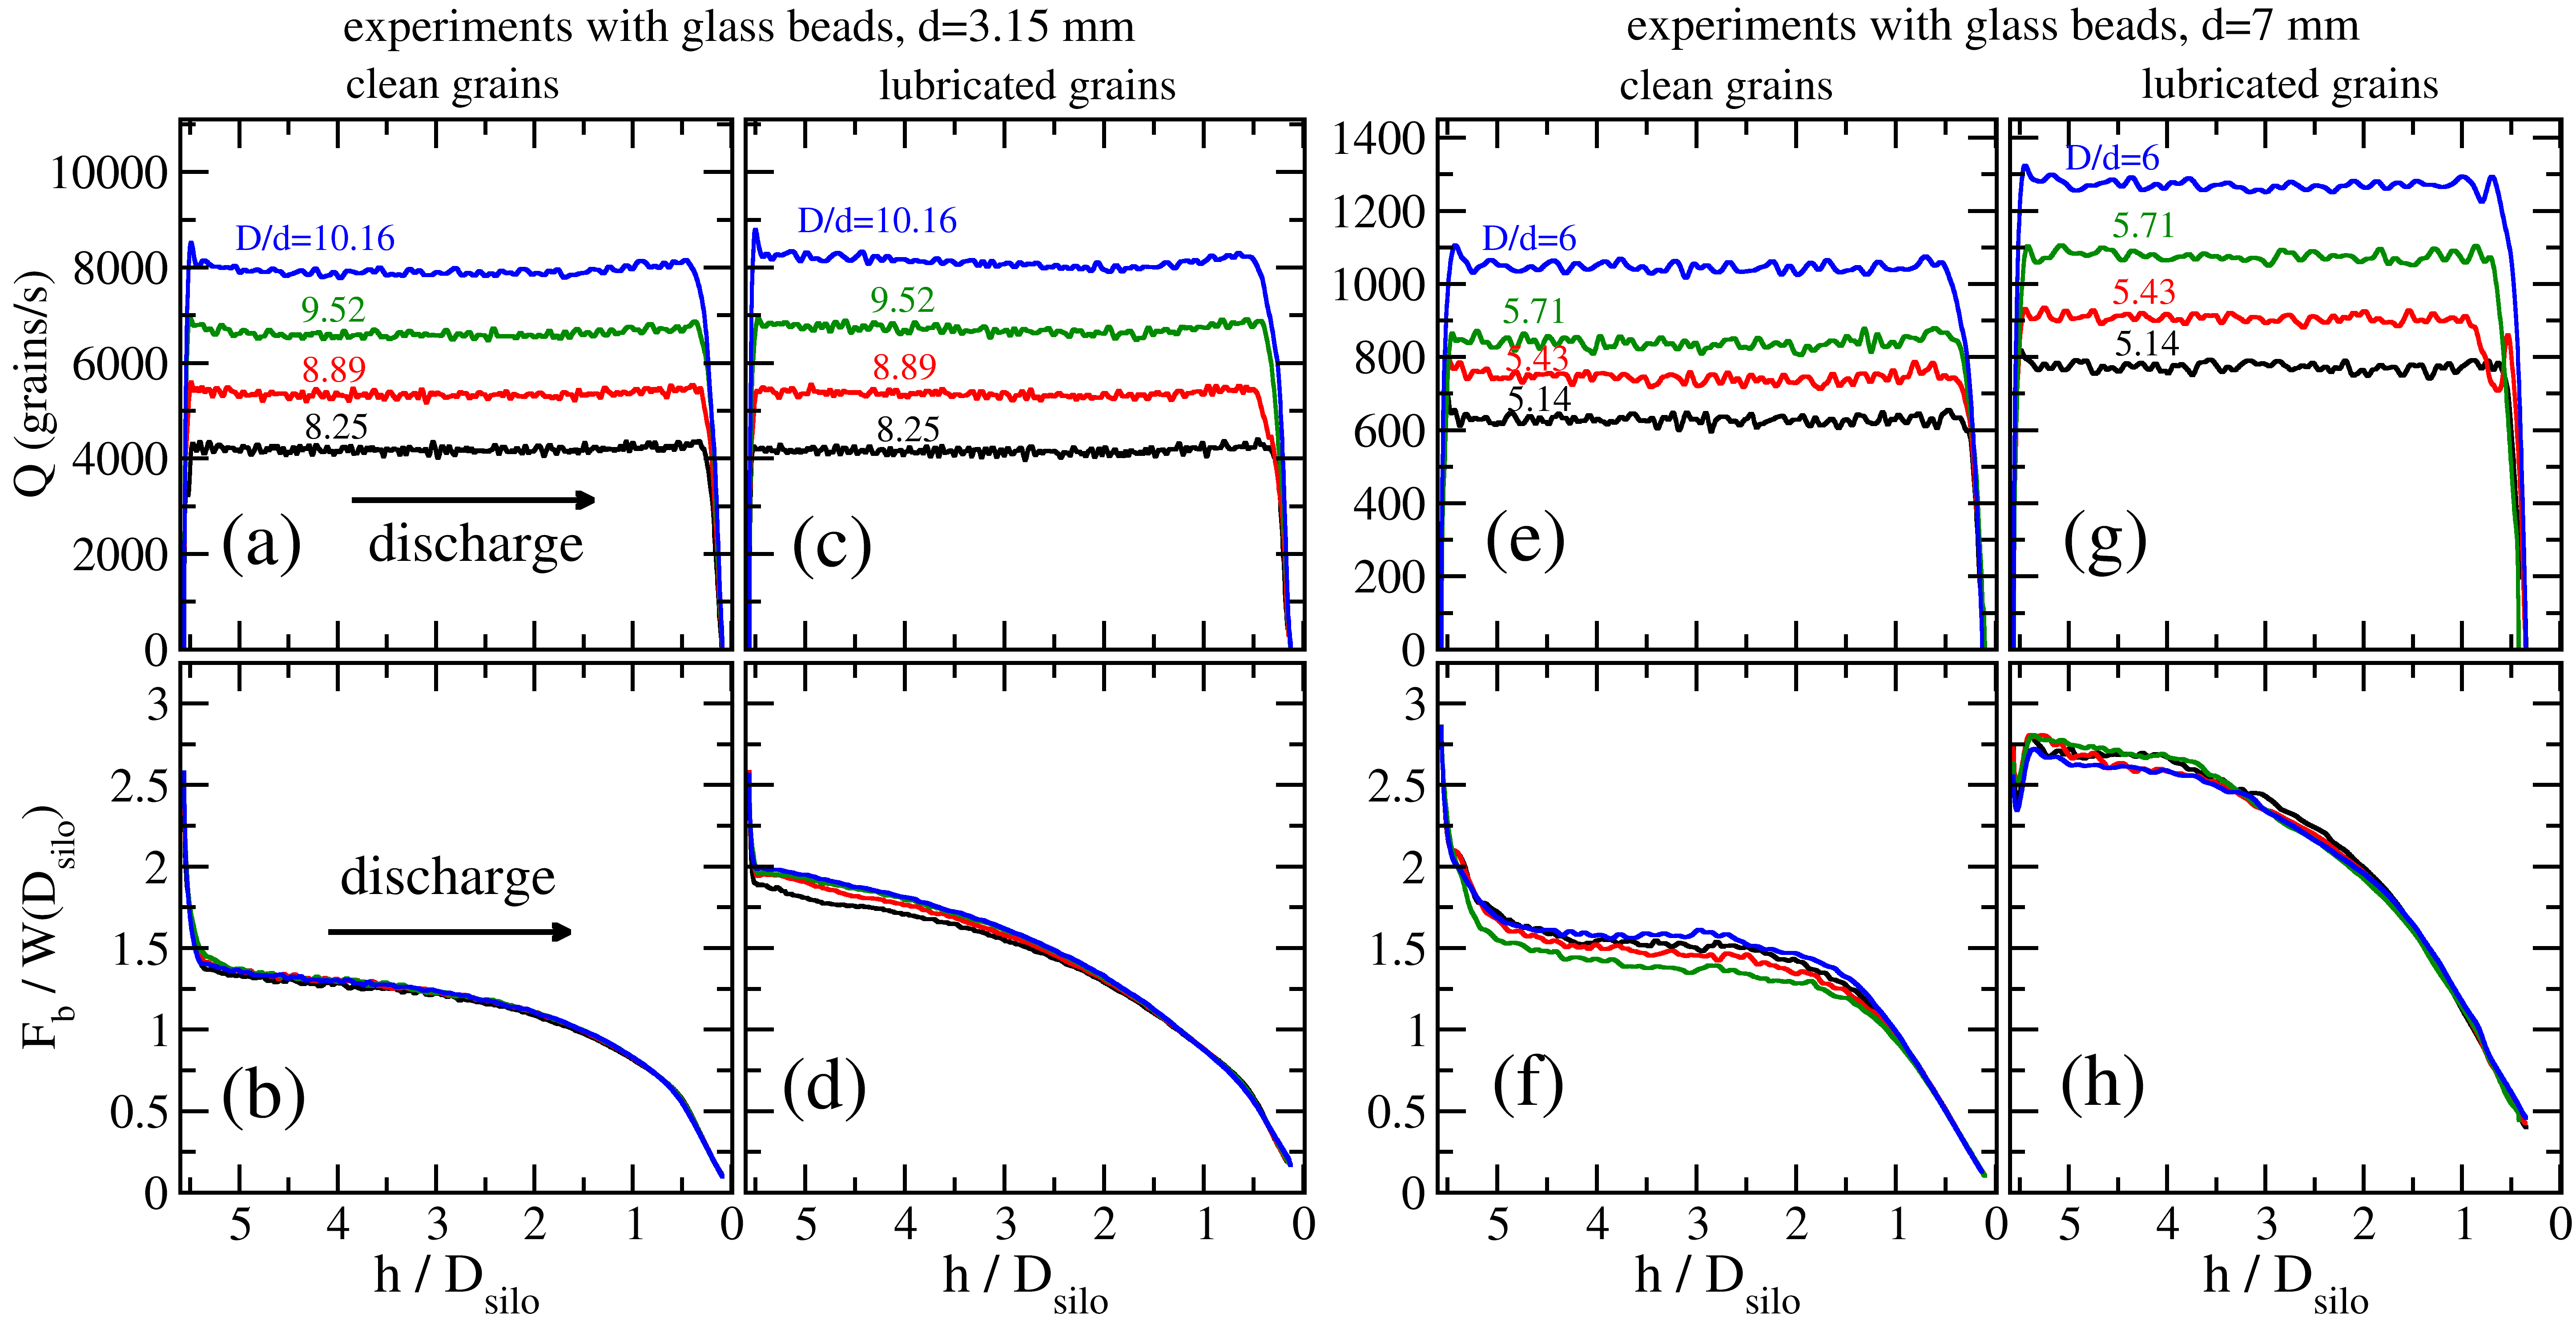
In an attempt to test the effect of friction on hard grains’ discharge rates, we performed experiments with two more pairs of samples: clean (dry) and lubricated glass beads (using silicone oil) with diameters of mm and mm. As described in the experimental section, lubrication reduces the surface friction for certain contacts, and at the same time introduces new effects resulting from cohesive forces. As expected, clean glass beads show very similar discharge characteristics (see Figs. 5 (a-b) and (e-f)) to the above described peas. For the lubricated systems, the results are slightly different for the smaller ( mm) and larger ( mm) grains. For the small grains, we observed the same flow rates for clean and lubricated systems (compare Figs. 5 (a) and (c)), only the basal force was a bit larger for the lubricated system. For the large beads, the discharge rate at a given orifice size is clearly larger for the lubricated system (Fig. 5(g)) than for the dry system (Fig. 5(e)), but it is still constant in time, like for the small glass beads. Note that for the mm beads, lubrication lead to a much stronger increase of the basal force than for the smaller ones.
4.3 Effect of friction coefficient for hard and soft grains: DEM results and coarse-graining analysis
Fig. 6 demonstrates how the discharge behaviour changes when the interparticle friction is varied systematically. Two types of particles are examined: hard ( Pa, ) and soft ( Pa, ), while all other simulation parameters are kept constant. We see that decreasing friction coefficient leads to a gradual change from the granular-like behaviour with constant flow rate towards a behaviour characterized by a linearly decreasing flow rate. The most important finding is, that this change is much stronger for soft grains (Fig. 6b) than for hard grains (Fig. 6a), even though the curves for do not differ that much for hard and soft grains (compare Figs. 6d and e). Thus, for soft grains decreasing interparticle friction leads to noticeable deviation from the granular-like behaviour, while for hard particles such deviation is expected only for frictionless grains. The height dependence of during discharge is similar for hard and soft grains, meaning that the vertical force transmitted to the wall does not depend significantly on the stiffness of the grains. The two experimental scenarios for the lubricated (low friction) glass beads with mm and mm correspond to the hard grain simulation results with about and , respectively. For frictional beads (e.g. ) the behaviour of hard and soft grains is very similar with a slightly (1.17 times) larger flow rate for soft grains. The effect of the interparticle friction coefficient on the flow rate is summarized in Figs. 6(c,f). Panel (c) shows the average value of the flow rate (for those cases when it is constant during discharge), while panel (f) shows the net gradient of the flow rate (obtained by a linear fit in the range of ) as a function of for both hard and soft grains.
We can extract further data from the DEM simulations, e.g. more information about the stresses inside the silo. For this purpose, we use the coarse-graining methodology, which allows us to build the macroscopic fields of the packing fraction (particle density ), velocity and stress tensor , with all quantities averaged in the azimuthal direction. Since there is one-to-one correspondence between time and column height, similarly to previous figures we will use the latter instead of the time parameter: . In the following, we base our analysis on the average of four simulation runs.
It is interesting to calculate the vertical stress above the orifice, averaged in a cylindrical region (marked with red in Fig. 6i). We normalize by the hydrostatic pressure corresponding to the weight of a column of grains with a height of , similarly to the normalization of the basal force . The evolution of this normalized vertical stress is shown in Figs. 6g-h. We find a stronger difference in between the case of hard and soft grains compared to the difference observed for the basal force. In fact, the curves change much less with for hard grains than for soft grains, just like the flow rate curves. Thus, it is natural to look for correlation between the flow rate and . Figures 6j-k present the flow rate as a function of . While the data show a rather weak dependence for hard grains, the increasing trend in is clearly stronger for soft grains. The net gradient of the flow rate (obtained by a linear fit of the curves in Figs. 6j-k) is shown in Fig. 6l. Thus, for the case of soft grains, (i) the local vertical stress above the orifice changes more during the discharge process and (ii) the value of has a stronger impact on the outflow rate than for hard grains. Both facts (i) and (ii) contribute to the stronger dependence observed for soft grains.
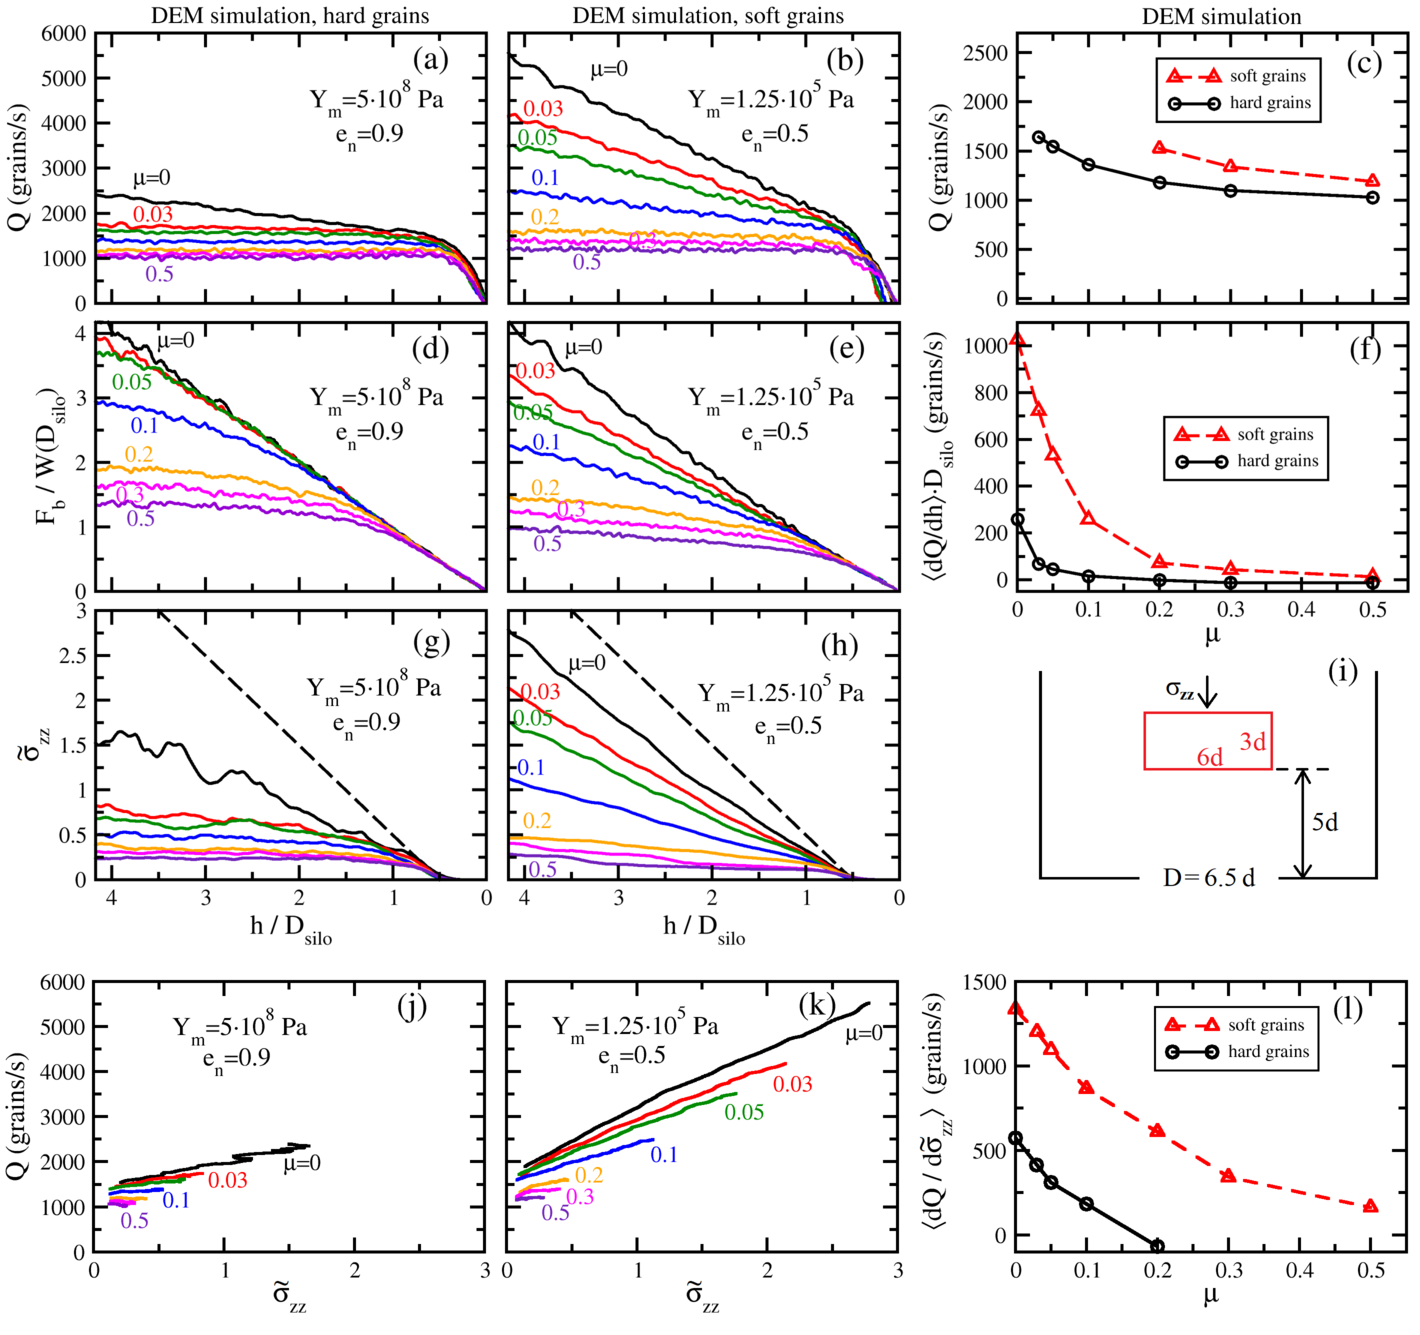
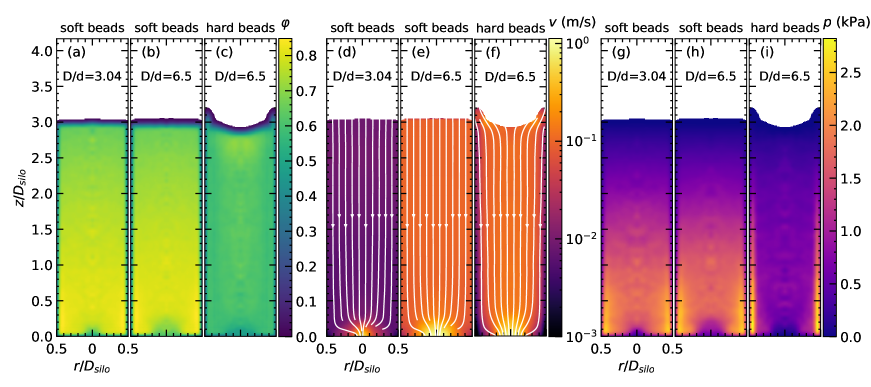
Figure 7 demonstrates the strong differences in the distributions of the volume fraction, velocity and pressure for soft and hard beads with a friction coefficient of . For soft beads we present data for two orifice diameters and corresponding to the data presented in Fig. 4 and Fig. 6, while for hard beads the data correspond to . Figures 7(a-b) show color-maps exemplifying the volume fraction field obtained in the simulations, for low friction soft particles (, Pa and ). Note, these parameters reproduce the experimental flow rate data for hydrogel beads qualitatively (see Figs. 4 (c-d)). The color-maps indicate that the volume fraction field is non-uniform, and in the top region the value of resembles the random close packing limit . Examining lower regions, the system is more compressed and increases until it reaches a maximum. Further down, it decreases again upon approaching the orifice. On the other hand, Fig. 7(c) hows that the volume fraction field is much more homogeneous for the case of hard grains ( Pa and ). Investigating the color-maps of the velocity field , for soft grains (Fig. 7(d-e)) we find that the velocity inside the silo is very uniform, with parallel streamlines. For hard grains (Fig. 7(f)) stronger inhomogeneities are observed in the velocity field with lower velocity near the walls and higher velocity in the central part of the silo, leading to a surface distortion (dip) at the top of the granular column. We emphasize again, that the simulations for soft and hard beads were performed with the same friction coefficient . Finally, Figures 7(g-i) display color-maps representing the spatial pressure profile , obtained using the coarse-grained stress tensor, . The cases for soft and hard grains are very different. The case of soft grains (Fig. 7(g-h)) is characterized by a gradual increase of the pressure with depth and relatively small variation in the radial direction. For hard grains (Fig. 7(i)) horizontal variations are very strong and the change of pressure in the vertical direction is small in the central part of the silo. Thus, a large fraction of the weight of the granular column is supported by a few layers of grains near the wall. This is the reason for the small variation of the vertical stress right above the orifice during the discharge process (Fig. 6(g)). We also note, that the three diagonal components (vertical, radial and tangential) of the stress tensor (not presented here) show larger differences for hard grains, than for low friction soft particles and that our coarse-graining methodology has a limitation in accurately resolving the micro-macro transition near the walls. Thus, for hard grains with a low friction coefficient (), Janssen screening is still effective, resulting in only a very slight change of the vertical stress above the orifice during the discharge process. This explains why the flow rate correlates with but not with for the case of hard grains.
The above described observations are in accordance with previous experimental investigations which also revealed strong differences in the flow field between the case of plastic and hydrogel beads using X-ray Computed Tomography [49, 50]. There the vertical velocity inside the 3D silo was found to be more homogeneous for low-friction soft hydrogel beads than for hard frictional plastic beads, and a decrease of the flow velocity was also observed with decreasing filling height using Ultrafast X-ray Computed Tomography [50]. Altogether, our current numerical data for the pressure distribution for the case of soft grains with weak pressure change in the radial direction and a smooth pressure change along the symmetry axis of the silo allows us to perform some further analysis. Namely, gradually increases from the top of the bed along the symmetry axis, it has a maximum close to the orifice, and further down it decreases rapidly (see the color map at Figs. 7(g-h)), forming a measurable vertical pressure gradient right above the orifice. In the following, we will look for a correlation between the flow rate and this pressure gradient.
4.4 Connection between the flow rate and pressure gradient near the outlet for soft, low-friction particles
Aiming to explain the system’s macroscopic response, in terms of its micro-mechanical properties, Fig. 8 focuses the attention on the profiles of and along the vertical direction, for soft grains with at the center of the silo with an orifice of . The data illustrated in Fig. 8 result from a spatial average within a cylindrical region of one particle diameter in size, and they were obtained at different instants in time, corresponding to subsequent stages of the discharge process. Figure 8(a) shows the profiles of the volume fraction . In the top region, the volume fraction always reproduces the random close packing value. These linear sections are simply shifted with respect to each other, which shows that the density increases linearly with the depth, denoting the compression of the system. However, density gradient remains practically invariant during the whole discharge process. In all cases, the mass density shows a maximum close to the orifice, but its value drops as time passes and the column gets shorter. Moreover, further down the dilatancy of the flow becomes evident, the volume fraction is reduced, and at the orifice, depends on the column height . A very similar trend appears for the mean pressure profiles computed at different instants in time (see Fig. 8(b)). Starting from the column surface the pressure increases hydrostatically with depth, and reaches a maximum value at a certain vertical distance from the orifice. Note that the pressure in the center of the orifice is nonzero, since the particles are still compressed at that point.
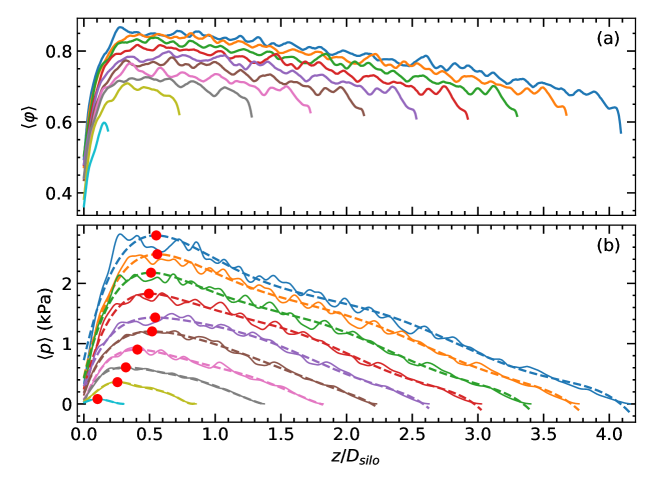
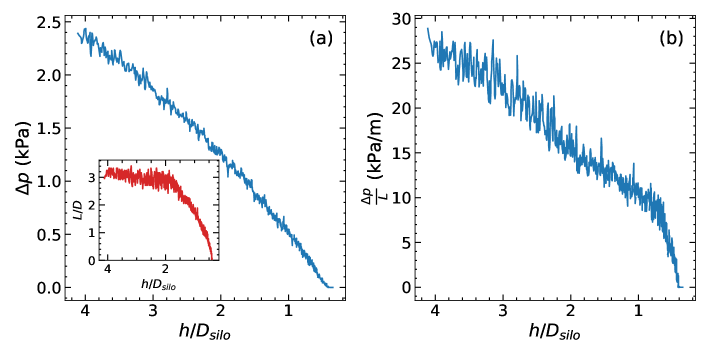
In order to address the forces acting on a representative volume element at the orifice, we fitted 6th order polynomials to the pressure profiles along the vertical direction (Fig. 8(b)). Then, we located the distance of the maximum from the orifice position, as well as the maximum pressure (red dots) on these smoother curves, as a function of the column height (shown in Fig. 9(a)). The pressure gradient at the orifice was estimated, using a linear approximation, by . Two interesting things deserve to be commented here. First, during a large part of the discharge process, the position of the maximum pressure does not depend on the column height (see inset of Fig. 9(a)). Accordingly, the pressure gradient at the orifice (see Fig. 9(b)) decreases linearly. Later on, however, finite size effects become more significant.
The coarse-grained continuous fields allow us to perform a theoretical analysis, to predict the linearly decreasing flow rate that was obtained numerically for low friction soft particles and experimentally for hydrogel beads (see Fig. 4). Our arguments rest on the momentum balance that is established in steady state conditions at the orifice, where the sum of the pressure gradient and the density of body gravitational force are balanced by the beads’ resistance to motion. Thus, assuming that the system acts like a viscous fluid in having a linear response to forcing, the mean vertical velocity at the orifice can be predicted as
| (8) |
where is a hydraulic coefficient that increases with decreasing effective viscosity of the system and increasing permeability of the orifice region. Thus, the mass flow rate at a circular orifice of size reads
| (9) |
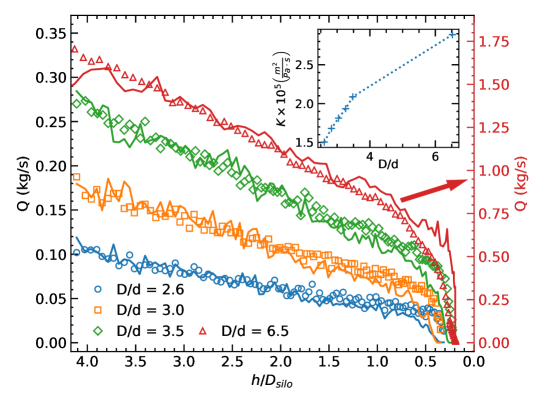
Figure 10 compares the linearly decreasing trend of the flow rate with height, obtained numerically for low-friction soft particles, with the theoretical prediction of Eq. (9). Moreover, the inset of Fig. 10 shows the estimate of the hydraulic parameter , which is the only fitting parameter used in the analysis. The agreement of the comparison is remarkable, especially during the first part of the discharge process, where the position of the maximum pressure does not depend on the column height (see inset of Fig. 9(a)) and the pressure gradient depends linearly on the column height. Besides, we found that increases with increasing orifice size. Note, the value of should be proportional to the permeability of the orifice and inversely proportional to the effective viscosity of the material. The appearance of a linear response – when the friction is low – could be a natural consequence of the local interactions between the particles. Namely, for deformable particles with low friction viscous normal damping has a more important role in energy dissipation than tangential frictional displacement, and the macroscopic shear stress is proportional to the relative velocity of the neighboring particles, and so indirectly to the shear rate. Our analysis notably sheds light on the nature of the flow of a granular material consisting of soft low-friction particles. Indeed, its behavior is remarkably different from the ’traditional’ granular discharge, where, at the orifice, the pressure gradient is practically constant during the discharge process and, as a result, the volumetric flow rate does not depend on the column height [36].
5 Summary
Our experimental and numerical investigations clearly show that changing particle stiffness has a strong effect on gravity driven granular flow out of a container with a small outlet in the flat bottom. Namely, decreasing the interparticle friction has much stronger effect for soft grains than for hard grains. For soft grains, with Young’s modulus of the order of 10 times the basal pressure, numerical simulations predict that the character of the discharge process gradually changes with decreasing interparticle friction: Grains with high friction coefficient flow with a constant flow rate (granulate-like behaviour), while for grains with low surface friction, the flow rate systematically decreases with the height of the granular bed. This is noticeably different for hard grains, with Young’s modulus of the order of times the basal pressure, where basically a constant flow rate is observed except for the special limit case of frictionless grains. This is nicely demonstrated by the effect of lubricating the glass beads, where reducing the friction coefficient already resulted in a gradual decrease of the basal force during discharge, but the constant flow rate still persisted (traditional granulate-like behaviour). For frictional grains, the difference between the discharge of hard and soft particles is smaller. Both cases are characterized with a constant flow rate, which is only slightly larger for soft grains. This is in accordance with earlier findings [44], where for frictional grains (), a moderate change in the stiffness (typically 1 order of magnitude) lead to no significant change in the flow rate. The evolution of the total normal force exerted at the bottom of the container during discharge shows much smaller differences between hard and soft grains.
Using DEM data combined with a coarse-graining methodology allowed us to compute all the relevant macroscopic fields, namely, linear momentum, densities and stress tensors. Such analysis reveals a considerably different pressure field for hard and soft grains with low friction coefficient. For low friction hard grains, Janssen screening is still observed with increased vertical stress near the walls, while for low friction soft grains this effect is much weaker. For low friction soft particles the local vertical stress above the orifice changes more during discharge, and it has a stronger effect on the flow rate, than for low friction hard grains. Thus, dynamic arch formation which is a key element in setting a constant flow rate for hard grains is much less effective for low friction soft grains. The fact that the critical orifice size below which clogging is observed was found to be much smaller for low friction soft grains [46, 47, 48] is in accordance with the above described observations. For low friction soft grains, instead of the Janssen screening, the pressure inside the silo is linearly increasing with distance from the top surface and has a maximum right above the orifice. The value of this pressure maximum gradually decreases during the discharge process, and can be related to the decreasing discharge rate. Based on the momentum balance in the region of the orifice, we propose a phenomenological formulation for soft particles with low friction coefficient. This suggests that for such materials, dissipation is dominated by viscous friction near the orifice. This model predicts a very similar decrease of the flow rate with decreasing fill height as found in our experiments with hydrogel beads. We note, that incorporating a multiple-contact approach (such as in Ref. [60]) to the DEM simulations is expected to further improve the quantitative match between experiment and simulation data, which might be the subject of future work.
Acknowledgements
The authors acknowledge discussions with A. Ashour and V. Kenderesi.
Financial support by the European Union’s Horizon 2020 Marie
Skłodowska-Curie grant ”CALIPER” (No. 812638), by the NKFIH (Grant Nos.
OTKA K 116036 and 134199), by the DAAD/TKA researcher exchange program (Grant No.
274464), and by the BME IE-VIZ TKP2020 program is acknowledged.
R.C. Hidalgo acknowledges the Ministerio de Economía y Competitividad (Spanish Government)
Projects No. FIS2017-84631-P, MINECO/AEI/FEDER, UE.
References
- [1] R.M. Nedderman, U. Tüzün, S.B. Savage and G.T. Houlsby, The flow of granular materials - I, Chem. Eng. Sci. 37, 1597 (1982).
- [2] H.M. Jaeger and S.R. Nagel, Physics of the granular state, Science 255, 1523 (1992).
- [3] H.M. Jaeger, S.R. Nagel and R.P. Behringer, Granular Solids, Liquids, and Gases, Rev. Mod. Phys. 68, 1259 (1996).
- [4] H.M. Jaeger, S.R. Nagel and R.P. Behringer, The Physics of Granular Materials, Physics Today 49, 32 (1996).
- [5] J. Kakalios, Resource Letter GP-1: Granular physics or nonlinear dynamics in a sandbox, Am. J. Phys. 73, 8 (2005).
- [6] A. Janda, I. Zuriguel, and D. Maza, Flow Rate of Particles through Apertures Obtained from Self-Similar Density and Velocity Profiles, Phys. Rev. Lett. 180, 248001, (2012).
- [7] C.S. Campbell, Granular material flows An overview, Powd. Tech. 162, 208 (2006).
- [8] B. Tighe and M. Sperl, Pressure and motion of dry sand: translation of Hagen’s paper from 1852, Gran. Matt. 9, 141 (2007).
- [9] I. Oldal, I. Keppler, B. Csizmadia, L. Fenyvesi, Outflow properties of silos: The effect of arching, Advanced Powder Technology 23, 290 (2012).
- [10] B. Jin, H. Tao, and W. Zhong, Flow Behaviors of Non-spherical Granules in Rectangular Hopper, Chinese Journal of Chemical Engineering, 18, 931 (2010).
- [11] R. Balevičius, I. Sielamowicz, Z. Mrióz, R. Kačianauskas, Investigation of wall stress and outflow rate in a flat-bottomed bin: A comparison of the DEM model results with the experimental measurements, Powder Tech. 214, 322 (2011).
- [12] H. Pacheco-Martinez, H. Jan van Gerner, and J.C. Ruiz-Suárez, Storage and discharge of a granular fluid, Phys. Rev. E 77, 021303 (2008).
- [13] H. Ahn, Z. Başranoǧlu, M. Yilmaz, A. Buǧutekin, M.Z. Gül, Experimental investigation of granular flow through an orifice, Powder Tech. 186, 65 (2008).
- [14] C. Mankoc, A. Janda, R. Arévalo, J. M. Pastor, I. Zuriguel, A. Garcimartín, D. Maza, The flow rate of granular materials through an orifice, Gran. Matt. 9, 407 (2007).
- [15] I. Zuriguel, A. Garcimartín, D. Maza, L. A. Pugnaloni, and J. M. Pastor, Jamming During the Discharge of Granular Matter from a Silo, Phys. Rev. E 71, 051303 (2005).
- [16] J. Koivisto and D.J. Durian, The sands of time run faster near the end, Nature Communications 8, 15551 (2017).
- [17] J. Koivisto, M. Korhonen, M. Alava, C.P. Ortiz, D.J. Durian, and A. Puisto, Friction controls even submerged granular flows, Soft Matt. 13, 7657 (2017).
- [18] C. Perge, M.A. Aguirre, P.A. Gago, L.A. Pugnaloni, D. Le Tourneau, and J.-C. Géminard, Evolution of pressure profiles during the discharge of a silo, Phys. Rev. E 85, 021303 (2012).
- [19] W. A. Beverloo, H. A. Leninger, and J. Van De Velde, The Flow of Granular Solids Through Orifices, Chem. Eng. Sci. 15, 260 (1961).
- [20] S. Dorbolo, L. Maquet, M. Brandenbourger, F. Ludewig, G. Lumay, H. Caps, N. Vandewalle, S. Rondia, M. Mélard, J. van Loon, A. Dowson, and S. Vincent-Bonnieu Influence of the gravity on the discharge of a silo, Gran. Matt. 15, 263 (2013).
- [21] J.P. Peralta, M.A. Aguirre, J.-C. Géminard, and L.A. Pugnaloni, Apparent mass during silo discharge: Nonlinear effects related to filling protocols, Powd. Tech. 311, 265 (2017).
- [22] H. A. Janssen, Versuche über Getreidedruck in Silozellen, Zeitschr. d. Vereines Deutscher Ingenieure, 39, 1045 (1895).
- [23] M. Sperl, Experiments on corn pressure in silo cells - translation and comment of Janssen’s paper from 1895, Gran. Matt. 8, 49 (2006).
- [24] F. Huber-Burnand, Sur l’écoulement et la pression du sable, Ann. Chim. Phys., 50, 159 (1829).
- [25] G.H.L. Hagen, Bericht über die zur Bekanntmachung geeigneten Verhandlungen der Königlich Preussischen Akademie der Wissenschaften zu Berlin, pp. 35–42 (1852).
- [26] I. Roberts, Determination of pressure of granular substances, Proc. R. Soc. 36, 225 (1884)
- [27] L. Vanel and E. Clément, Pressure screening and fluctuations at the bottom of a granular column, Eur. Phys. J. B 11, 525 (1999).
- [28] Y. Bertho, F. Giorgiutti-Dauphine, and J.-P. Hulin, Dynamical Janssen Effect on Granular Packing with Moving Walls Phys. Rev. Lett. 90, 144301 (2003).
- [29] L. Vanel, Ph. Claudin, J.-Ph. Bouchaud, M. E. Cates, E. Clément, and J. P. Wittmer, Stresses in Silos: Comparison Between Theoretical Models and New Experiments, Phys. Rev. Lett. 84, 1439 (2000).
- [30] J.E. Hilton and P. Cleary, Granular flow during hopper discharge, Phys. Rev. E 84, 011307 (2011).
- [31] R.L. Brown and J.C. Richards, Profile of flow of granules through apertures, Trans. Inst. Chem. Eng. 38, 243 (1960).
- [32] F.C. Franklin and L.N. Johanson, Flow of granular material through a circular orifice, Chem. Eng. Sci. 4, 119 (1955).
- [33] R.M. Nedderman, Statistics and Kinematics of Granular Materials (Cambridge University Press, Cambridge, England, 1992).
- [34] S.B. Savage, Gravity flow of a cohesionless bulk solid in a converging conical channel, Int. J. Mech. Sci. 9, 651 (1967).
- [35] J.F. Davidson and R.M. Nedderman, The Hour-Glass Theory of Hopper Flow, Trans. Inst. Chem. Eng. 51, 29 (1973).
- [36] S.M. Rubio-Largo, A. Janda, D. Maza, I. Zuriguel, and R. C. Hidalgo, Disentangling the Free-Fall Arch Paradox in Silo Discharge, Phys. Rev. Lett. 114, 238002 (2015).
- [37] J.R. Darias, M.A. Madrid, and L.A. Pugnaloni, Differential equation for the flow rate of discharging silos based on energy balance, Phys. Rev. E 101, 052905 (2020).
- [38] T.J. Wilson, C.R. Pfeifer, N. Meysingier, and D.J. Durian, Granular discharge rate for submerged hoppers, Papers in Physics 6, 060009 (2014).
- [39] M.A. Madrid, J.R. Darias, and L.A. Pugnaloni Forced flow of granular media: Breakdown of the Beverloo scaling, EPL 123, 14004 (2018).
- [40] D. Hirshfeld, Y. Radzyner and D.C. Rapaport, Molecular dynamics studies of granular flow through an aperture, Phys. Rev. E 56, 4404 (1997).
- [41] D. Hirshfeld and D.C. Rapaport, Granular flow from a silo: Discrete-particle simulations in three dimensions, Eur. Phys. J. E. 4, 193 (2001).
- [42] J. C. Jofriet, S. C. Negi, and Z. Lu, A Numerical Model for Flow of Granular Materials in Silos. Part 3: Parametric Study, J. Agric. Engng Res. 68, 237 (1997).
- [43] R. Balevičius, R. Kačianauskas, Z. Mróz, and I. Sielamowicz, Microscopic and macroscopic analysis of granular material behaviour in 3d flat-bottomed hopper by the discrete element method, Arch. Mech., 59, 231 (2007).
- [44] P.A. Langston, U. Tüzün, and D.M. Heyes, Discrete element simulation of granular flow in 2D and 3D hoppers: dependence of discharge rate and wall stress on particle interactions, Chem. Eng. Sci. 50, 967 (1995).
- [45] L. Staron, P.-Y. Lagrée and S. Popinet, The granular silo as a continuum plastic flow: The hour-glass vs the clepsydra, Phys. of Fluids 24, 103301 (2012).
- [46] A. Ashour, T. Trittel, T. Börzsönyi, and R. Stannarius, Silo outflow of soft frictionless spheres, Phys. Rev. Fluids 2, 123302 (2017).
- [47] X. Hong, M. Kohne, M. Morrell, H. Wang and E.C. Weeks, Clogging of soft particles in two-dimensional hoppers, Phys. Rev. E 96, 062605 (2017).
- [48] K. Harth, J. Wang, T. Börzsönyi, and R. Stannarius, Intermittent flow and transient congestions of soft spheres passing narrow orifices, Soft Matt. 16, 8013 (2020).
- [49] R. Stannarius, D.S. Martinez, T. Finger, E. Somfai and T. Börzsönyi, Packing and flow profiles of soft grains in 3D silos reconstructed with X-ray computed tomography, Gran. Matt. 21, 56 (2019).
- [50] R. Stannarius, D.S. Martinez, T. Börzsönyi, M. Bieberle, F. Barthel and U. Hampel, High-speed x-ray tomography of silo discharge, New J. Phys. 21, 113054 (2019).
- [51] N. Brodu, J. A. Dijksman, and R. P. Behringer, Spanning the scales of granular materials through microscopic force imaging, Nat. Commun. 6, 6361 (2015).
- [52] B.N.J. Persson, Sliding friction, Physical principles and applications (Springer-Verlag, Berlin, Heildelberg, 1998).
- [53] C. Kloss, C. Goniva, A. Hager, S. Amberger, S. Pirker, Models, algorithms and validation for opensource DEM and CFD-DEM, Progr. in Comp. Fluid Dyn., An Int. J. 12, No.2/3 pp. 140 - 152 (2012)
- [54] A. Di Renzo and F. P. Di Maio, Comparison of contact-force models for the simulation of collisions in DEM-based granular flow codes, Chemical engineering science 59, No. 3 pp. 525–541 (2004). Chemical engineering science. Elsevier, (2004).
- [55] Isaac Goldhirsch. Stress, stress asymmetry and couple stress: from discrete particles to continuous fields, Granular Matter, 12, 239 (2010).
- [56] T. Weinhart, R. Hartkamp, A. R. Thornton, and S. Luding. Coarse-grained local and objective continuum description of three-dimensional granular flows down an inclined surface, Physics of Fluids, 25, 7 (2013).
- [57] R. Artoni and P. Richard, Average balance equations, scale dependence, and energy cascade for granular materials, Phys. Rev. E, 91, 032202 (2015).
- [58] R. Artoni and P. Richard, Coarse graining for granular materials: micro-polar balances, Acta Mechanica, 100, 012906 (2019).
- [59] J. A. Dijksman, N. Brodu, and R. P. Behringer, Refractive index matched scanning and detection of soft particles, Rev. Sci. Instrum. 88, 051807 (2017).
- [60] N. Brodu, R. Behringer and J. Dijksman, Multiple-contact discrete-element model for simulating dense granular media, Phys. Rev. E 91, 032201 (2016).