Using DFTB to Model Photocatalytic Anatase-Rutile TiO2 Nanocrystalline Interfaces and their Band Alignment
Abstract
Band alignment effects of anatase and rutile nanocrystals in TiO2 powders lead to an electron hole separation, increasing the photo catalytic efficiency of these powders. While size effects and types of possible alignments have been extensively studied, the effect of interface geometries of bonded nanocrystal structures on the alignment is poorly understood. In order to allow conclusive studies of a vast variety of bonded systems in different orientations, we have developed a new density functional tight binding parameter set to properly describe quantum confinement in nanocrystals. Applying this set we found a quantitative influence of the interface structure on the band alignment.
keywords:
DFTB, TiO2, nanocrystals, Interface, Band alignmentllnl]Physical and Life Sciences Directorate, Lawrence Livermore National Laboratory, Livermore, California 94550, United States llnl]Physical and Life Sciences Directorate, Lawrence Livermore National Laboratory, Livermore, California 94550, United States llnl]Physical and Life Sciences Directorate, Lawrence Livermore National Laboratory, Livermore, California 94550, United States \alsoaffiliationDepartment of Chemical Engineering, University of California, Davis, California 95616, United States \alsoaffiliationBremen Center for Computational Materials Science, University of Bremen, P.O. Box 330440, D-28334 Bremen, Germany \abbreviationsDFT,DFTB
1 Introduction
TiO2 powders commonly used for photo catalytic applications such as the Degussa P25 (DP25) consist of anatase and rutile nanocrystals in different compositions (commonly % anatase and % rutile). This composition of the two different TiO2 phases is shown to have a great impact on the photo catalytic efficiency due to band alignment effects that lead to an effective electron-hole pair separation. There have been several theoretical attempts to predict the type of band alignment and thus which crystal acts as a hole or electron trap1, 2, 3, 4. Experiments indicate that for the case of DP25 anatase acts as an electron trap, while rutile as a hole trap5. Theoretical works have so far been focused on isolated bulk1, slab 2 or nanocrystal3, 4 systems. While bulk studies predict a trapping of electrons on anatase and a trapping of the holes on rutile in accordance with the experiment, nanocrystal studies predict a significant size dependence for the alignment until bulk-like behavior is reached. However, neither of those approaches consider the potential impact of different types of additional degrees of freedom in materials such as geometrical interface arrangements. The role of such interface arrangements were investigated in Ref. 2 using slab models. However, such models can only give limited insights in the interface effects as the slabs of the two phases must be commensurate, allowing only for a few possible orientations and surface geometries. This makes it impossible to explore the degrees of freedom in the interface formation, which are present under experimental conditions at the microscale.
The vast phase space of possible nanocrystal orientations and sizes thus makes computational studies of anatase-rutile nanocrystal interfaces very challenging, even for very small nanocrystal models where a conclusive study on the role of the interfaces would be unfeasible using DFT based calculations alone. Consequently, we have developed a density functional tight binding (DFTB) parameter set to efficiently simulate TiO2 nanocrystals and anatase-rutile interfaces. DFTB, being 2-3 orders of magnitude faster than comparable DFT calculations, provides the possibility of studying a vast number of systems and system sizes. Additionally, with the right choice of parameters, DFTB retains most of the accuracy of DFT and thus yields the possibility of making a closer to one-to-one comparison to experiments. Another benefit of the DFTB approach is its localized basis set which simplifies the computation of non-periodic structures such as nanocrystals.
In the present work we identify several issues in describing nanocrystals with the previously published DFTB parameter sets for titanium dioxide 6, 7, e.g. problems in describing the quantum confinement effects correctly and yielding wrong relaxations when under-coordinated species are involved. The latter problem has been also reported in Reference 8. To remedy those issues, we have developed a new parameter set, named tio2nano 9, that focuses on the correct description of TiO2 nanocrystals and interfaces. It is based on the 3ob-parameter set 10. The electronic parameters of the new Ti species were tailored to ensure the proper description of the quantum confinement effects in TiO2 nanocrystals. Instead of the traditional two-center potentials, we have used a many-body force field 11, 12 to represent the repulsive contributions to the total energy, following the same approach as in Ref. 13. The three-center contributions of the force field allowed us to obtain improved agreement with DFT optimized geometries, compared to results from two-center repulsive potentials only.
For the band alignment studies, we considered explicit anatase-rutile interface structures. We are not aware of any previous attempts to determine the electronic structure using such models, but similar CeO2 nanoparticle models were addressed in Ref. 14. By applying the newly developed DFTB parameter set on the generated interface structures, we were able to demonstrate the impact of the geometric alignment of the crystals on the band alignment.
2 Methods
DFTB calculations were performed with the DFTB+ code 15. As described below in detail, the 3ob parameter set 10 has been extended with the element Ti by using a density compression radius of 8.5 Bohr and wave compression radii of 5.609, 3.958 and 7.0 Bohr for the s-, p- and d- orbitals of the Ti-atom, respectively. The energy and the chemical hardness (a.k.a. the Hubbard-U value) of the virtual 4p orbital of the Ti-atom have been set to 0.206 Ha and -0.08 Ha, respectively.
The energies were created using the Chebyshev Interaction Model for Efficient Simulation (ChIMES)11, 12, a reactive many-body molecular dynamics (MD) force field. ChIMES creates many-body interactions by projecting DFT computed data (e.g., forces, stress tensors, energies) onto linear combinations of many-body Chebyshev polynomials16. Briefly, this begins with an N-body expansion of the total energy for a system:
| (1) |
Here, is the single atom energy for a given element, and represent the 2–body and 3–body interaction energy, respectively, is the total number of atoms in the system, and corresponds to higher order terms.
Specifically, the 2–body interactions are expressed as a linear combination of Chebyshev polynomials of the first kind:
| (2) |
In this case, is the Chebyshev polynomial of the first kind of order, and are the element types of atoms and , and is a transformation of the inter-atomic distance over the Chebyshev interval of [-1,1] using a Morse-like function. In addition, corresponds to the two-body polynomial order, is the cut-off function that ensures the potential and its derivative vary smoothly to zero beyond a specified distance, and is a penalty function 13, 17 that helps to prevent sampling of inter-atomic distances below those seen in the training set (see Ref. 18 for further details). The are the set of permutationally invariant coefficients of linear combination for a given atom pair-type that are determined via a linear least-squares method.
Similarly, 3–body interaction energies are expressed as a product of Chebyshev polynomials for the constituent atom pairs of a given triplet, yielding an orthogonal 3–body polynomial with total interactions for a given triplet:
| (3) |
In this case, is used to label the three-body polynomial order with a single permutationally invariant coefficient for each set of triplet atom types. To guarantee that only 3-body interactions between are counted towards the sum, only terms for which at least two of the three indices are greater than zero are included in the sum (indicated by the prime in Eq. 3). In this way, many-body interactions can be included in the repulsive energy () by solving a linear least-squares optimization problem where optimal coefficients of the linear combination are determined directly. This avoids reliance on iterative approaches that are required for non-linear optimization problems (e.g., Levenberg-Marquardt) that are usually more computationally time consuming and not guaranteed to result in the global minimum. ChIMES models have been extended to include 4–body interactions in a similar fashion in reactive MD simulations16, 19, though truncation of the ChIMES total energy with the 3–body term has proven sufficient for determination of the DFTB repulsive energy.
Our training set for the ChIMES force field was determined from DFT-MD simulations of amorphous TiO2 run at temperatures of 2250 and 300 K using the VASP code 20. For these calculations, we used the PBEsol functional21 with an energy cutoff of 550 eV and -point sampling of the Brillouin zone. PBEsol was chosen due to its improved description of solids and their surfaces. The amorphous phase allowed for improved sampling of a wide-range of interatomic distances over the short-time scales of the simulations, which was enhanced by including data from elevated temperature. Each MD simulation was run on a system of 216 atoms for a total of 5 ps, with configurations taken for training every 100 fs (in order to allow for decoupling between training data), resulting in 50 training configurations taken from each temperature. We also included additional 10 configurations from an MD simulation run at 40 GPa in order to improve sampling of close interatomic distances. This yielded a total of 110 training configurations.
The training set to determine was then computed by subtracting the gradient of the DFTB electronic energy from our DFT reference property, i.e., . In this work, a spline fit of Ti-Ti dimer repulsive interactions was included in the DFTB electronic calculations order to ensure that excessively small inter-atomic distances were not approached during calculations. In addition, O-O distances were poorly sampled in our training set and these repulsive parameters were thus taken from the 3ob-0-1 parameter set and were not a part of our fit. ChIMES parameters were determined through linear least-squares fitting to the resulting ionic forces and the diagonal components of the stress tensor for each of these MD snapshots. We set the ChIMES 2–body polynomial order to 12 and the 3–body order to 8, similar to previous work22, and solve for optimal coefficients using the Least-Angle Regression (LARS)23, 24 algorithm with a Least Absolute Shrinkage and Selection Operator (LASSO)25 regularization value of .
For the DFTB calculations, charges were converged with a tolerance of a.u. and forces with a.u. Bulk calculations were performed with an 888 Monkhorst-Pack 26 grid for the primitive unit-cell. The rutile (110) surface was constructed as a 42 surface unit cell with 6 layers, the (100) surface as a 42 unit cell with 6 layers and the (001) surface as with 8 layers. The (001) anatase surface had a 22 unit cell with 8 layers, the (101) surface had a 84 unit cell with 5 layers. All rutile structures were computed with a 221 k-point mesh, the anatase (001) surface with a 441 mesh and the (101) surface with -only calculations. Branching point energy calculations (discussed below) were performed with the primitive unit cell of the anatase and rutile crystals using an 888 k-point grid. For nanocrystals we performed -only calculations.
The nanocrystal interfaces were constructed using the JANUS code , which is based on a quick hull algorithm for convex hulls 27. This algorithm allows to rapidly identify convex hulls from a set of points, in this case the coordinates of atoms from the nanocrystals in xyz format. The code then combines simplices of the computed convex hull for all normals that form an of or larger. The largest facets of each individual nanocrystal are then aligned to each other so that their surface normals are parallel to each other and to the x-axis with a user specified distance between them. The procedure is repeated with the nanocrystals being rotated with respect to each other around the x-axis for angles between 0 and 180 degrees in steps of 15 degrees. Additionally, the nanocrystal gets displaced in the yz-plane along the perimeter of a circle with a user specified radius. This displacement occurs with angles between 0 and 360 degrees in steps of 30 degrees. This results in 156 interface geometries which are stored in an ASE 28 trajectory format. To create the interfaces we used the two smallest relaxed nanocrystals of anatase and rutile. The nanocrystals were aligned with a distance along x of 2 Å and a radius of 2 Å was used for the displacement in the yz-plane.
Interface energies were computed as
| (4) |
where is the energy of the interface structure, the energy of the isolated rutile nanocrystal contained in the interface structure and accordingly the energy of the anatase nanocrystal.
For comparative DFT calculations we used the Vienna Ab initio Simulation Package 20 (VASP 5.4.4) with the PAW method to describe the cores. For titanium the 3p electrons were treated as valence electrons. The plane wave cut-off was chosen to be 420 eV, the augmentation cut-off was chosen as 840 eV. Geometry relaxations were performed until energy differences were converged below an error of eV. The k-point meshes were chosen in accordance with the DFTB calculations.
As nanocrystal models we chose Wulff-type crystal structures for anatase nanocrystals which expose (101) facets and quasi Wulff-type crystals for rutile exposing (110), (100) and (101) facets. These nanocrystal structures were chosen in accordance with Ref. 3 to allow for direct comparison. Additionally, for reasons described below, we also considered another set of quasi Wulff-type rutile nanocrystals by cutting particles along the (110) and (101) planes with an even number of (110) layers across the waist of the particle.
3 Results and discussion
3.1 Parameterization and validation of the new DFTB parameter set
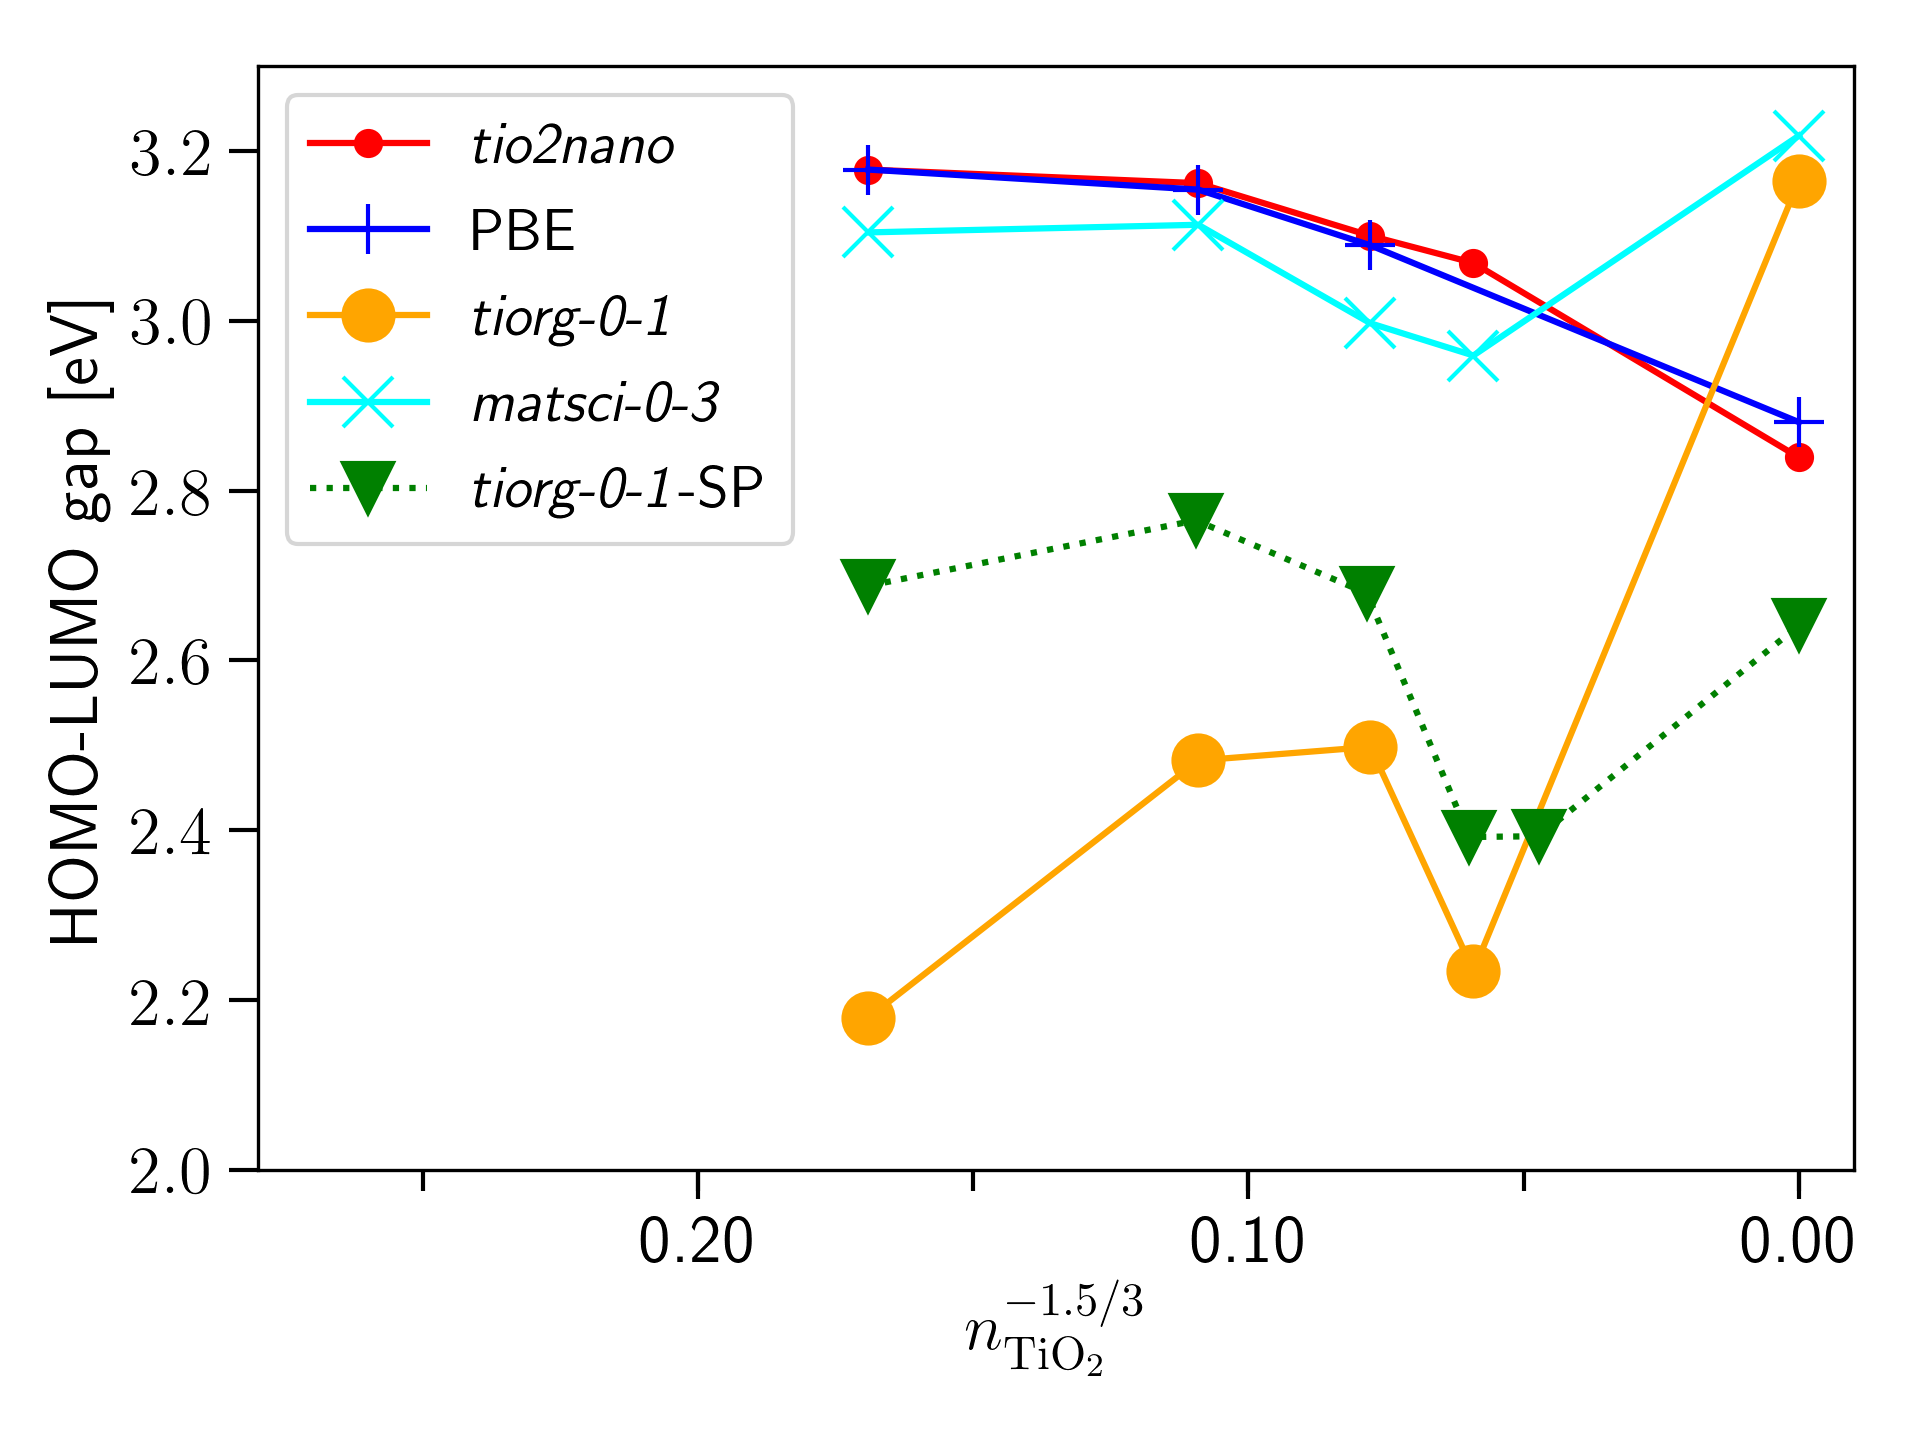
The existing parameter sets for Ti-O interactions, the tiorg-0-1 7 and the matsci-0-3 6 sets, were evaluated only for bulk structures and common surfaces so far. By applying them to describe anatase Wulff-type nanocrystals, we faced the issue that the HOMO-LUMO gap did not change with the particle size as predicted by the theory of quantum confinement3 and as observed in analogous PBE calculations. Instead of the expected linear function of (with being the number of TiO2 units) we observed surface states, which fall into the band gap and give rise to HOMO-LUMO gap sizes lower than the bulk value as shown in Fig. 1. In order to rule out geometrical effects, we also performed single point calculations for those nanocrystals using their PBE geometries, but found a similar wrong behavior with both sets. Efforts to resolve the issue by changing the compression radii of the Ti-atom turned out to be unsuccessful.
As a next attempt, we tried to describe the Ti-O interaction by extending the 3ob-parameter set 10 with Ti. The electronic parameters of the Ti atom were optimized by fitting on the theoretically expected linear behaviour of the band gap with respect to . For this fit, anatase nanocrystals with sizes of , and and the bulk phase of anatase had been used resulting in the compression radii reported in the Methods section.
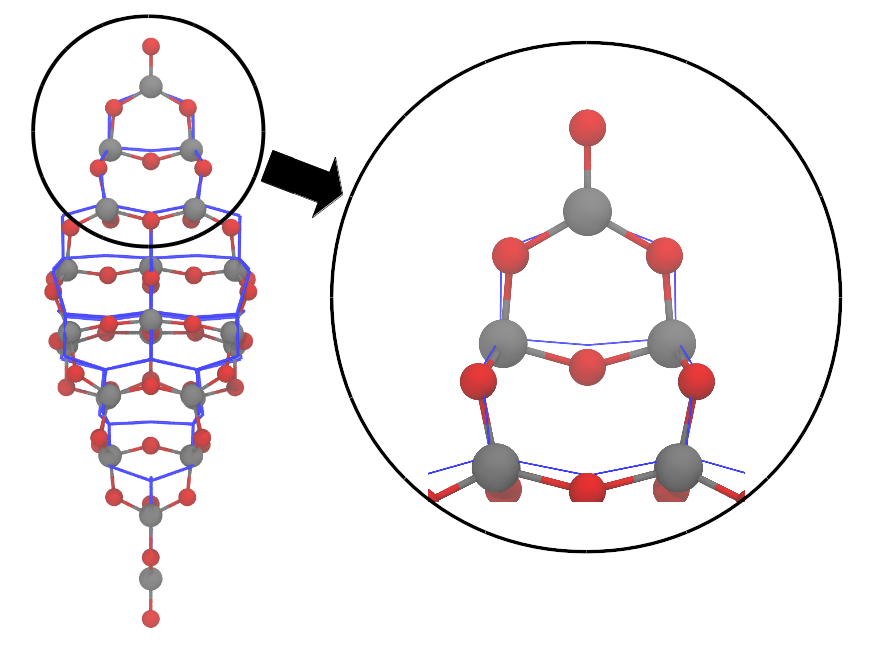
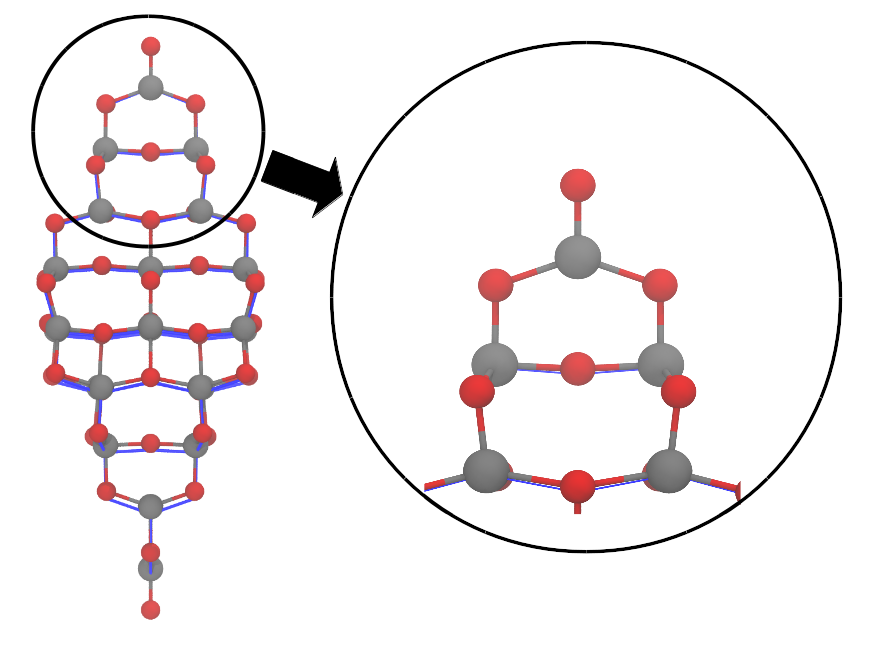
After fixing the electronic parameters, the two-center repulsive potentials of the Ti-Ti and the Ti-O interactions had been derived using a symmetrized titanum hcp crystal and a symmetrized rutile bulk crystal as reference, respectively. The symmetrization ensures that the first neighbour Ti-Ti (in hcp Ti) and Ti-O bonds (in rutile) have identical lengths, allowing for a simple manual fitting procedure. When relaxing the nanocrystals with the obtained repulsive potentials, the resulting geometries exhibited significant deviations in the strongly undercoordinated tip regions as compared to PBE-geometries (see Fig. 2 for an example). Unfortunately, those geometrical changes lead to the appearance of spurious surface states in the gap. Our attempts to enforce the correct geometry by tuning the two-center repulsive functions were not successful. This is not surprising as the incorrect Ti-O-Ti angle seems to be the main driving force behind the differences in the relaxed geometries. To enforce correct nanocrystal geometries (and with that also the correct electronic structure), we decided to represent the Ti-O and Ti-Ti repulsive functions with the ChIMES force field, which allows the inclusion of three center terms. The interface to the ChIMES software had been implemented in a development version of the DFTB+ package. For the Ti-Ti repulsive potential we kept the two-center one derived from the symmetrized titanium hcp crystal, with ChIMES corrective terms. It is important to note, that the performance of the Ti-Ti repulsive potential in describing Ti bulk phases was not evaluated in this work.
The resulting parameterization performs well for anatase and rutile bulk as well as for their surfaces and is able to describe systems for which the previous parameter sets have failed. The bulk lattice parameters given in Table 1 show a very good agreement with ab initio counterparts for rutile. For anatase we observe a slight overestimation of the value, while is underestimated.
| DFTBa | PBEa | PBEsola | BLYPb | Exp.c | |
|---|---|---|---|---|---|
| rutile | |||||
| 4.629 | 4.621 | 4.600 | 4.679 | 4.594 | |
| 2.980 | 2.954 | 2.940 | 2.985 | 2.959 | |
| anatase | |||||
| 3.887 | 3.792 | 3.780 | 3.828 | 3.784 | |
| 9.293 | 9.640 | 9.580 | 9.781 | 9.515 |
The calculated surface energies are listed in Table 2. The current parameterization slightly overestimates the surface energies for anatase (001) and rutile (110) compared to PBE and PBEsol results. The anatase (101) and the rutile (001) and (100) surfaces are underestimated compared to PBEsol results and overestimated compared to PBE. The energetic ordering of the surfaces with respect to each other is reproduced nicely within the tio2nano set. Overall the current set shows a good agreement to ab initio methods.
| DFTBa | PBEa | PBEsola | PBE0b | |
|---|---|---|---|---|
| anatase | ||||
| (001) | 1.36 | 0.95 | 1.23 | 1.25* |
| (101) | 0.49 | 0.45 | 0.80 | 0.58 |
| rutile | ||||
| (100) | 1.07 | 0.62 | 1.11 | 0.83 |
| (110) | 0.97 | 0.37 | 0.88 | 0.46 |
| (001) | 1.47 | 1.33 | 1.79 | 1.59 |
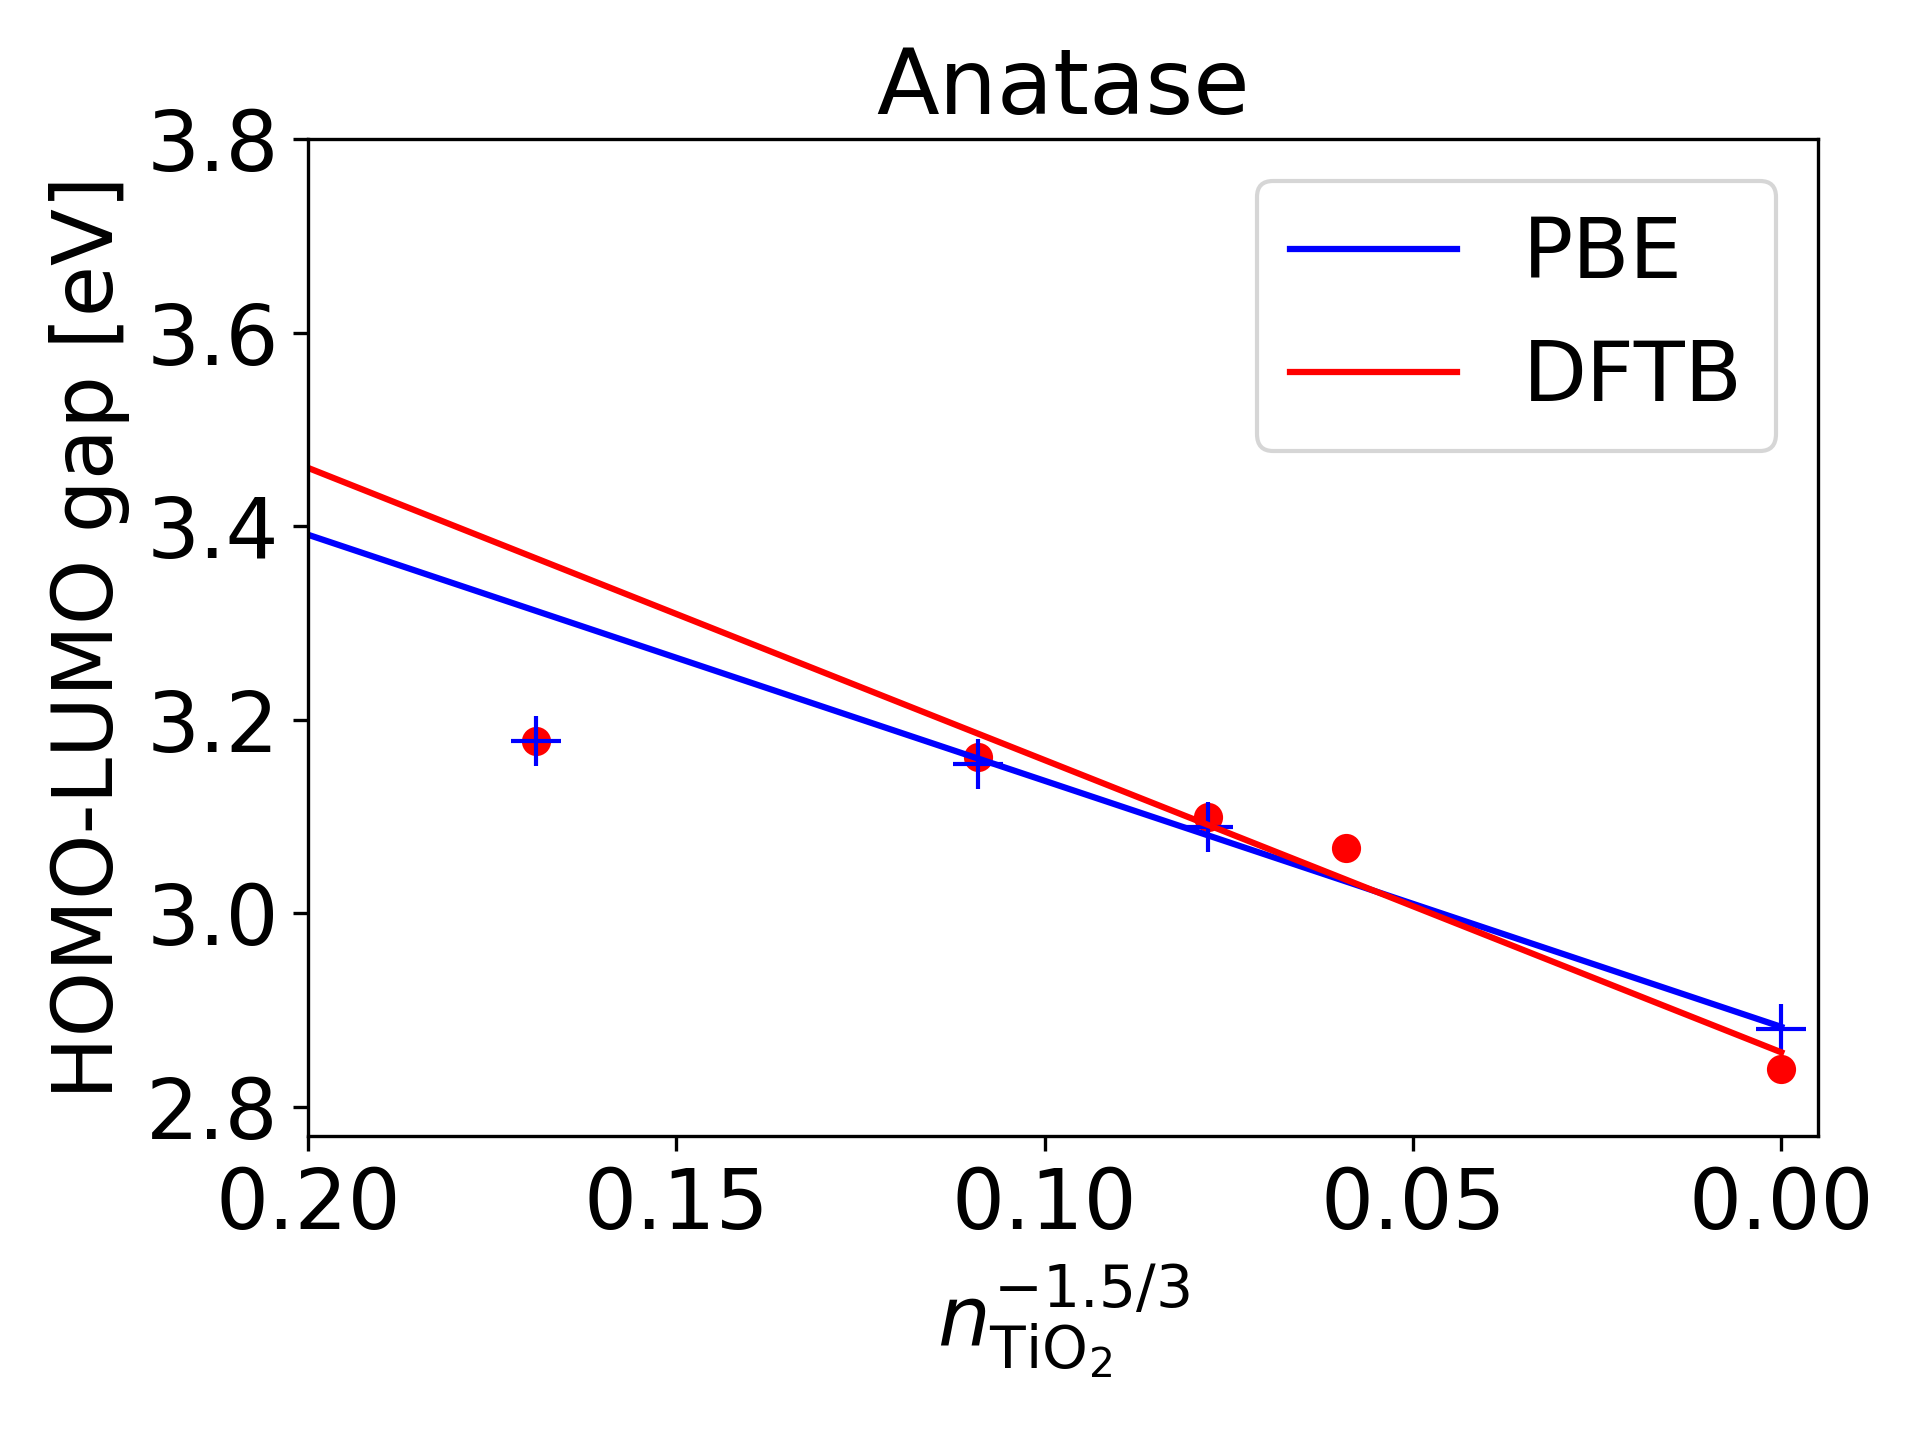
Figure 3 shows the PBE gap values of anatase and rutile in comparison to the ones obtained with the newly developed parameter set. The behavior of both sets is now comparable to Ref. 3. The smallest anatase nanocrystal considered shows with the ChIMES based repulsive function a relaxation which is very close to the one obtained with the PBE calculation (see Fig. 4). Overall, the new parameters reasonably describe the various forms and phases of titania. The band alignments between the phases are described in the following section.
3.2 Band alignment
The primary aim of the current paper is to establish a computationally feasible approach that allows us to study band alignment across a TiO2 anatase-rutile nano-particle interface and to determine the role of the interface in this alignment. The approach is based on the customized DFTB parametrization described above. The quality of the new method is assessed by comparison to calculations at the DFT-PBE level of theory.
First we present the bulk band alignment between anatase and rutile using the branching point energy approach as it was done for TiO2 in Ref. 1 previously and compare the PBE and the DFTB values. Afterwards, following Ref. 3, the level alignment deduced from non-bonded nano-particle structures will be discussed. We compare previous results to our DFT-PBE calculations as well as to results obtained with DFTB. Finally, we investigate the influence of the interface on the band alignments by DFTB-calculations on bonded nano-particles.
3.2.1 Bulk band alignment
First we consider the band alignment between the bulk phases using the branching point technique. The branching point energy , or charge neutrality level, can be computed from the average of the mid-level states using the relation
| (5) |
The index runs over the k-points being considered. In every k-point valence band and conduction band states with respective eigenvalues and are averaged. We chose and independently of possible degeneracies of the bands, as the alignment is known to depend only weakly on the degeneracy and on the number of included bands 1. Figure 5 compares our results for EBP to those in Ref. 1. The results obtained with the tio2nano set compare well to the calculated PBE values as well as to the HSE06 values in Ref. 1. All levels of theory predict that rutile and anatase act as a hole and as an electron trap, respectively.
3.2.2 Band alignment in non-bonded nanocrystal systems
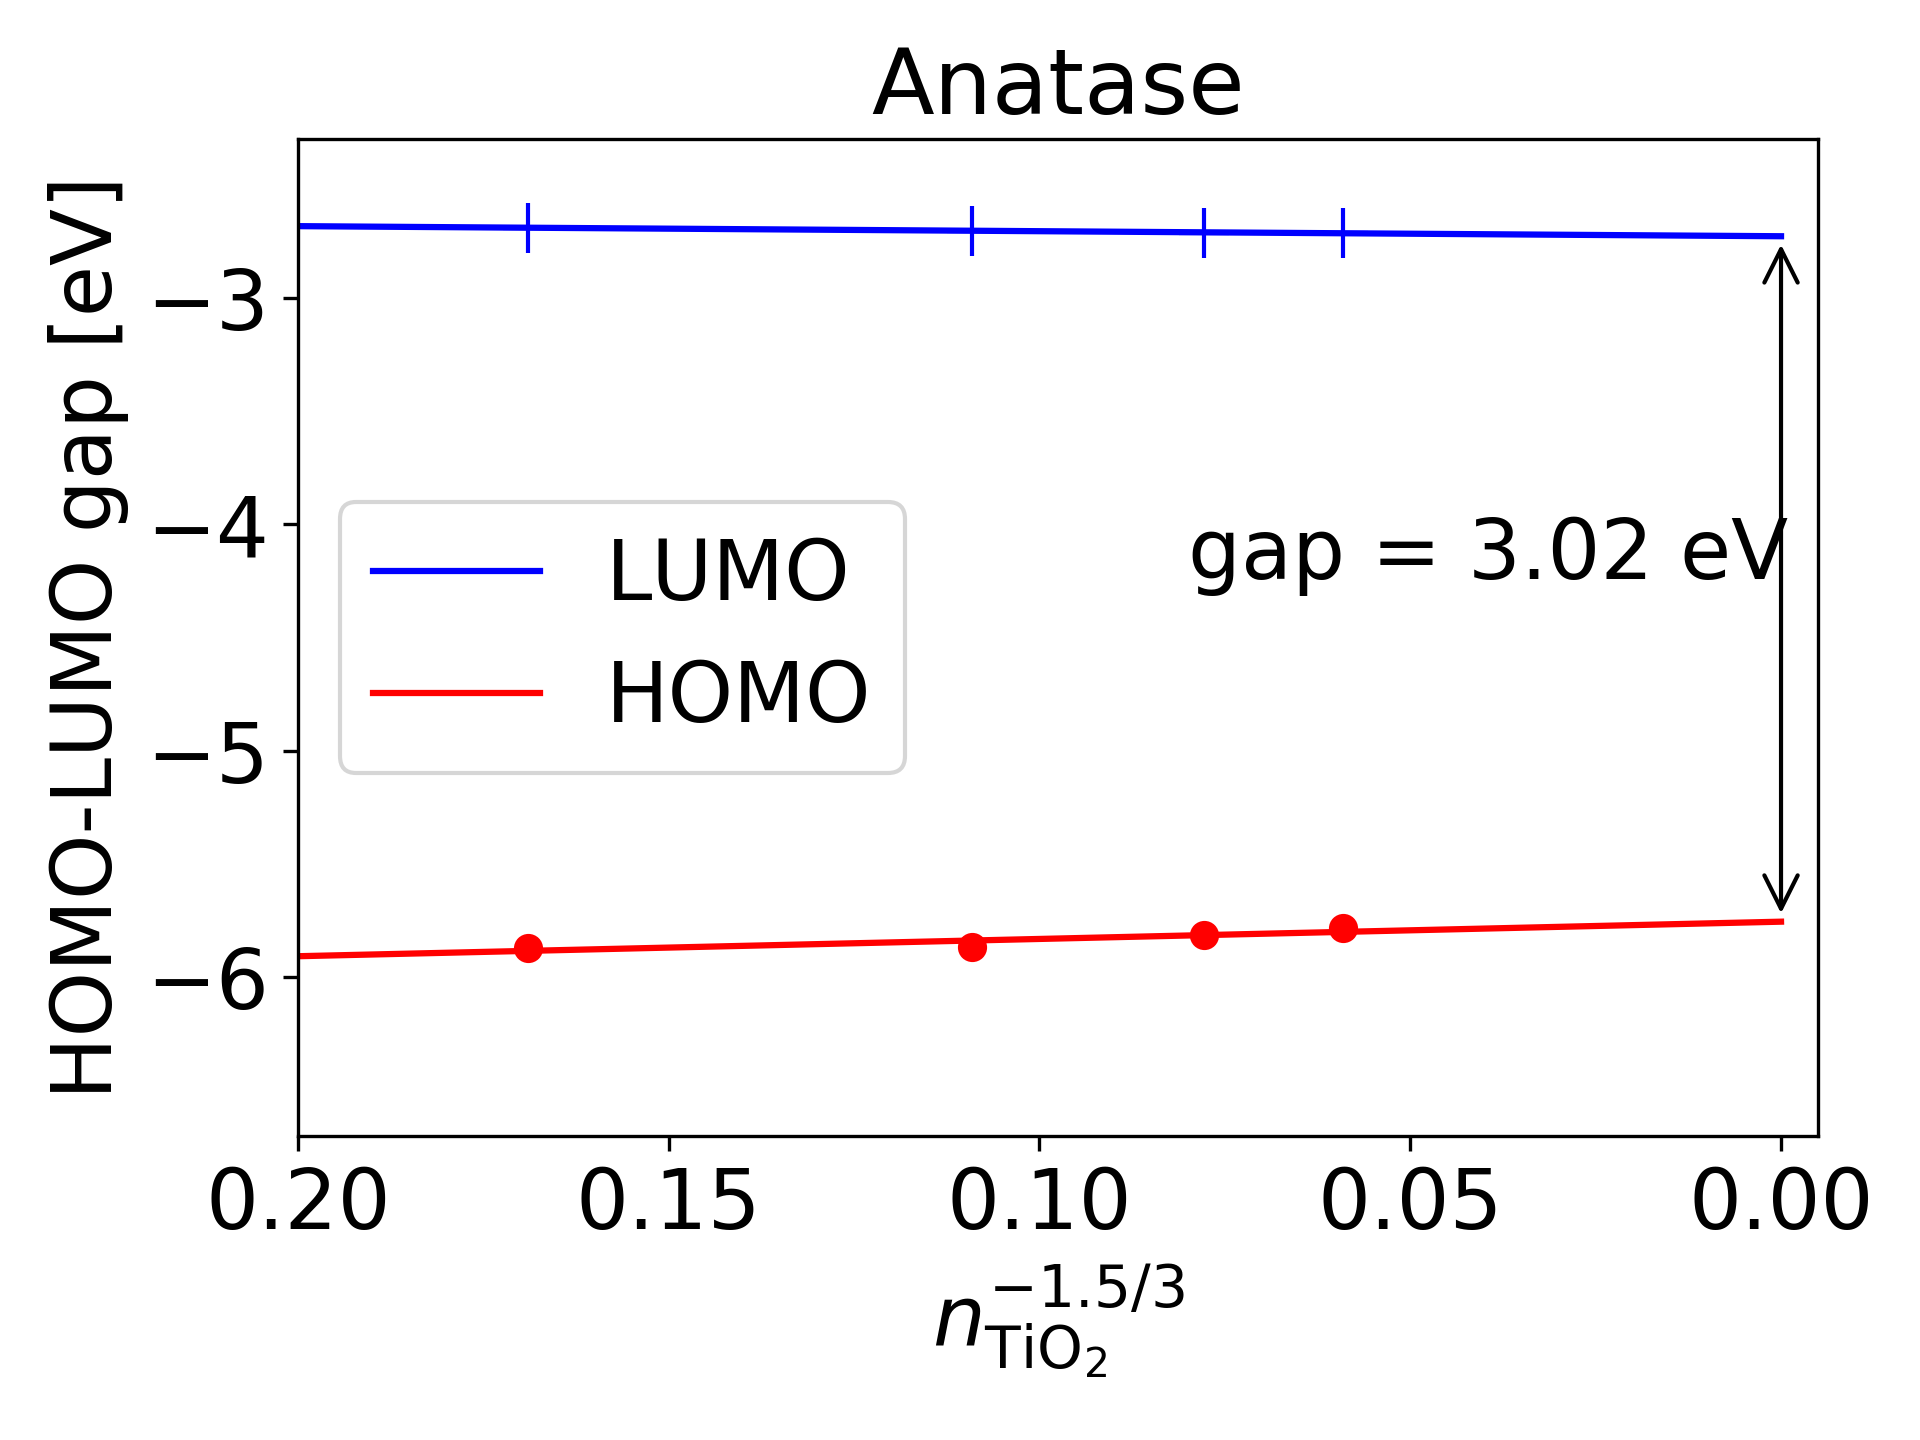
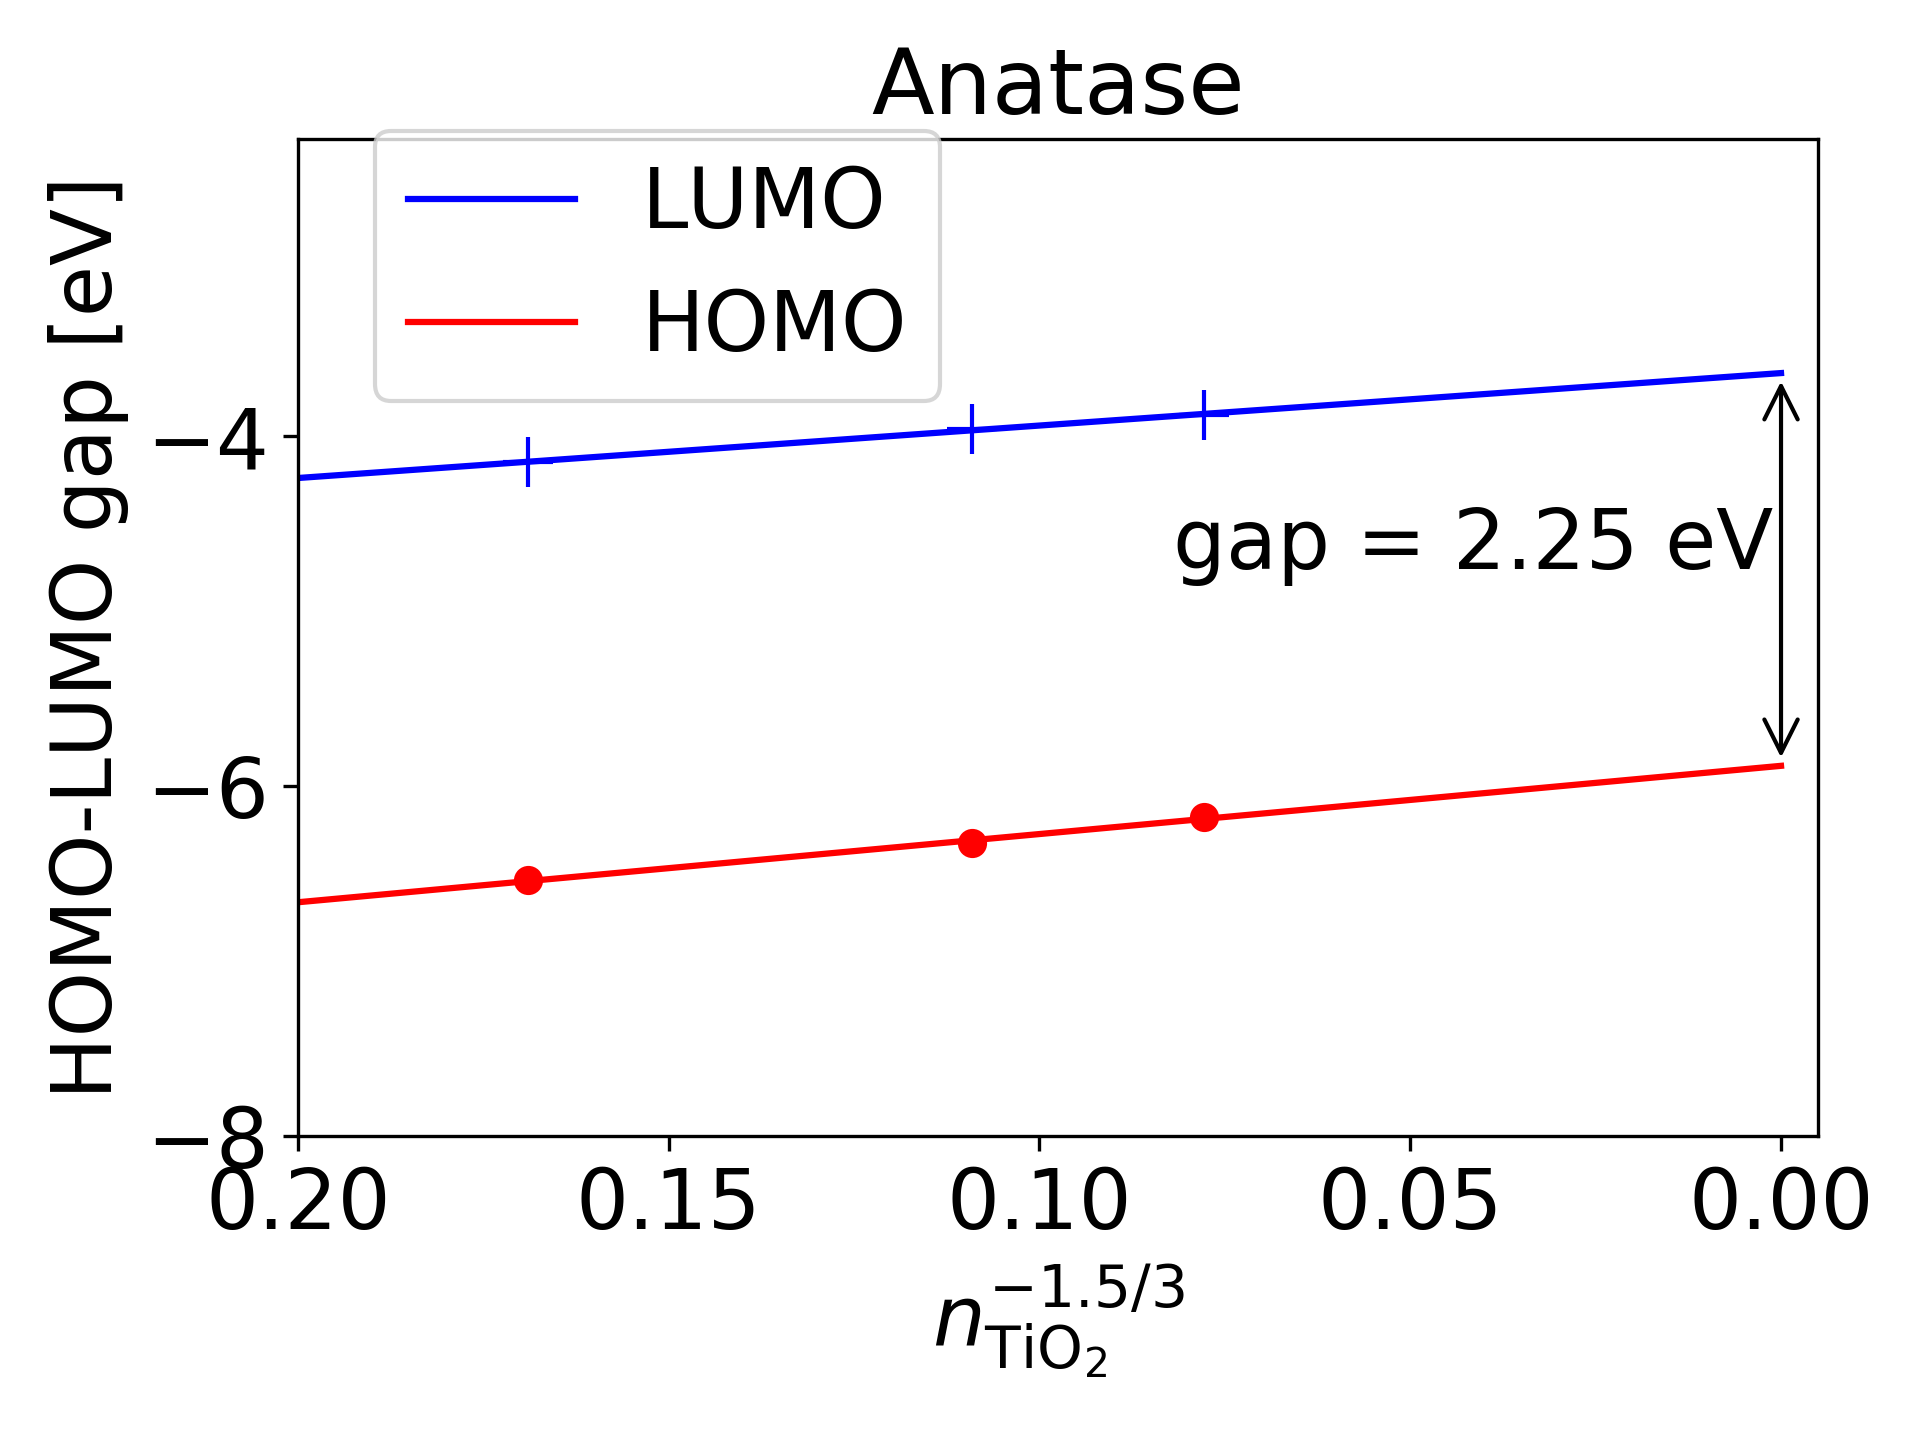
Following Ref. 3 we performed DFT-PBE and DFTB calculations for anatase and rutile nanocrystals of different sizes. We have plotted the HOMO and LUMO levels as well as their gap values as function of the number of TiO2 formula units in the structure raised to the factor . The parameter had been set to 1.5 as this yielded a better fit to our data than the value of 1.35 used in Ref. 3. Note, that we did not include the smallest anatase crystal in the linear fit, as we found it to not follow the particle in the box model (neither for PBE nor for DFTB). The PBE and DFTB results for anatase are in good agreement with the PBEx data of Ref. 3. By extrapolating the DFTB nanocrystal results to infinite particle sizes using a linear fit with respect to , we obtained a band gap of eV as compared to the bulk value of eV. A similar overestimation can be seen in the extrapolation of the PBE data, which yields a gap of eV as compared to the PBE bulk value of eV.
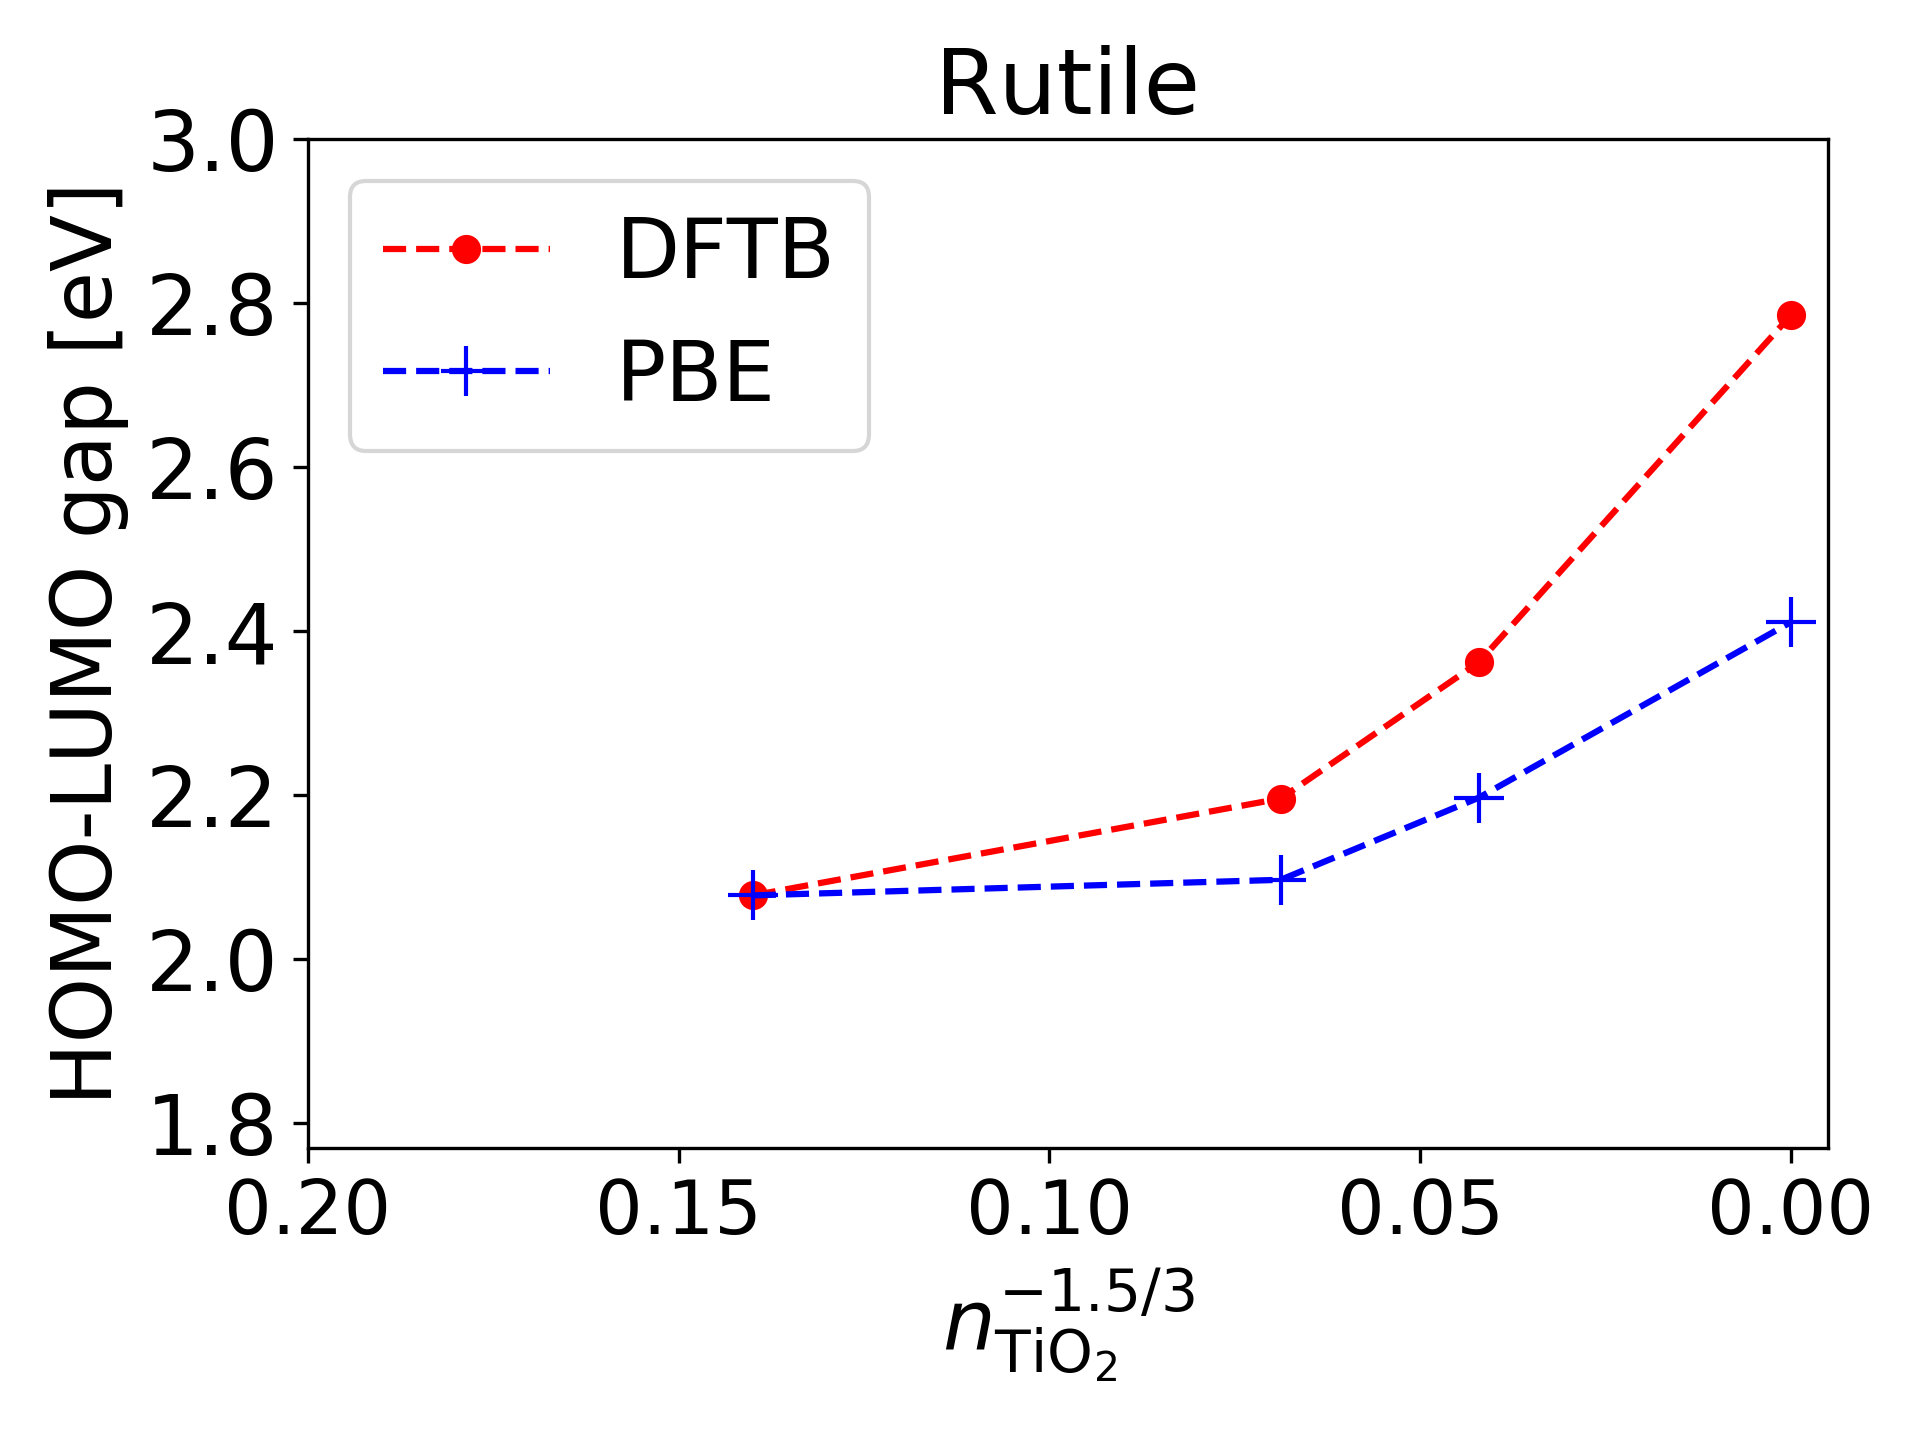
In the case of rutile nanocrystals, extrapolation of the band gap is complicated by the presence of surface states. This leads to a non-linearity of the band gap caused by a non-linear behavior of the VB-edge. As shown in Fig. 6, although the highest lying occupied core-states clearly follow the confinement linearly, an occupied surface state with non-linear behavior appears in the gap. This leads to an initial narrowing of the gap with the particle size before reaching the point where the surface and core states cross and after which the gap follows a linear behaviour again. A similar behavior can be found in the PBE-results as shown in Fig. 7. The observed behavior of the surface states indicates that the simple text-book particle in a box model can be applied only to core-states but not to surface states.
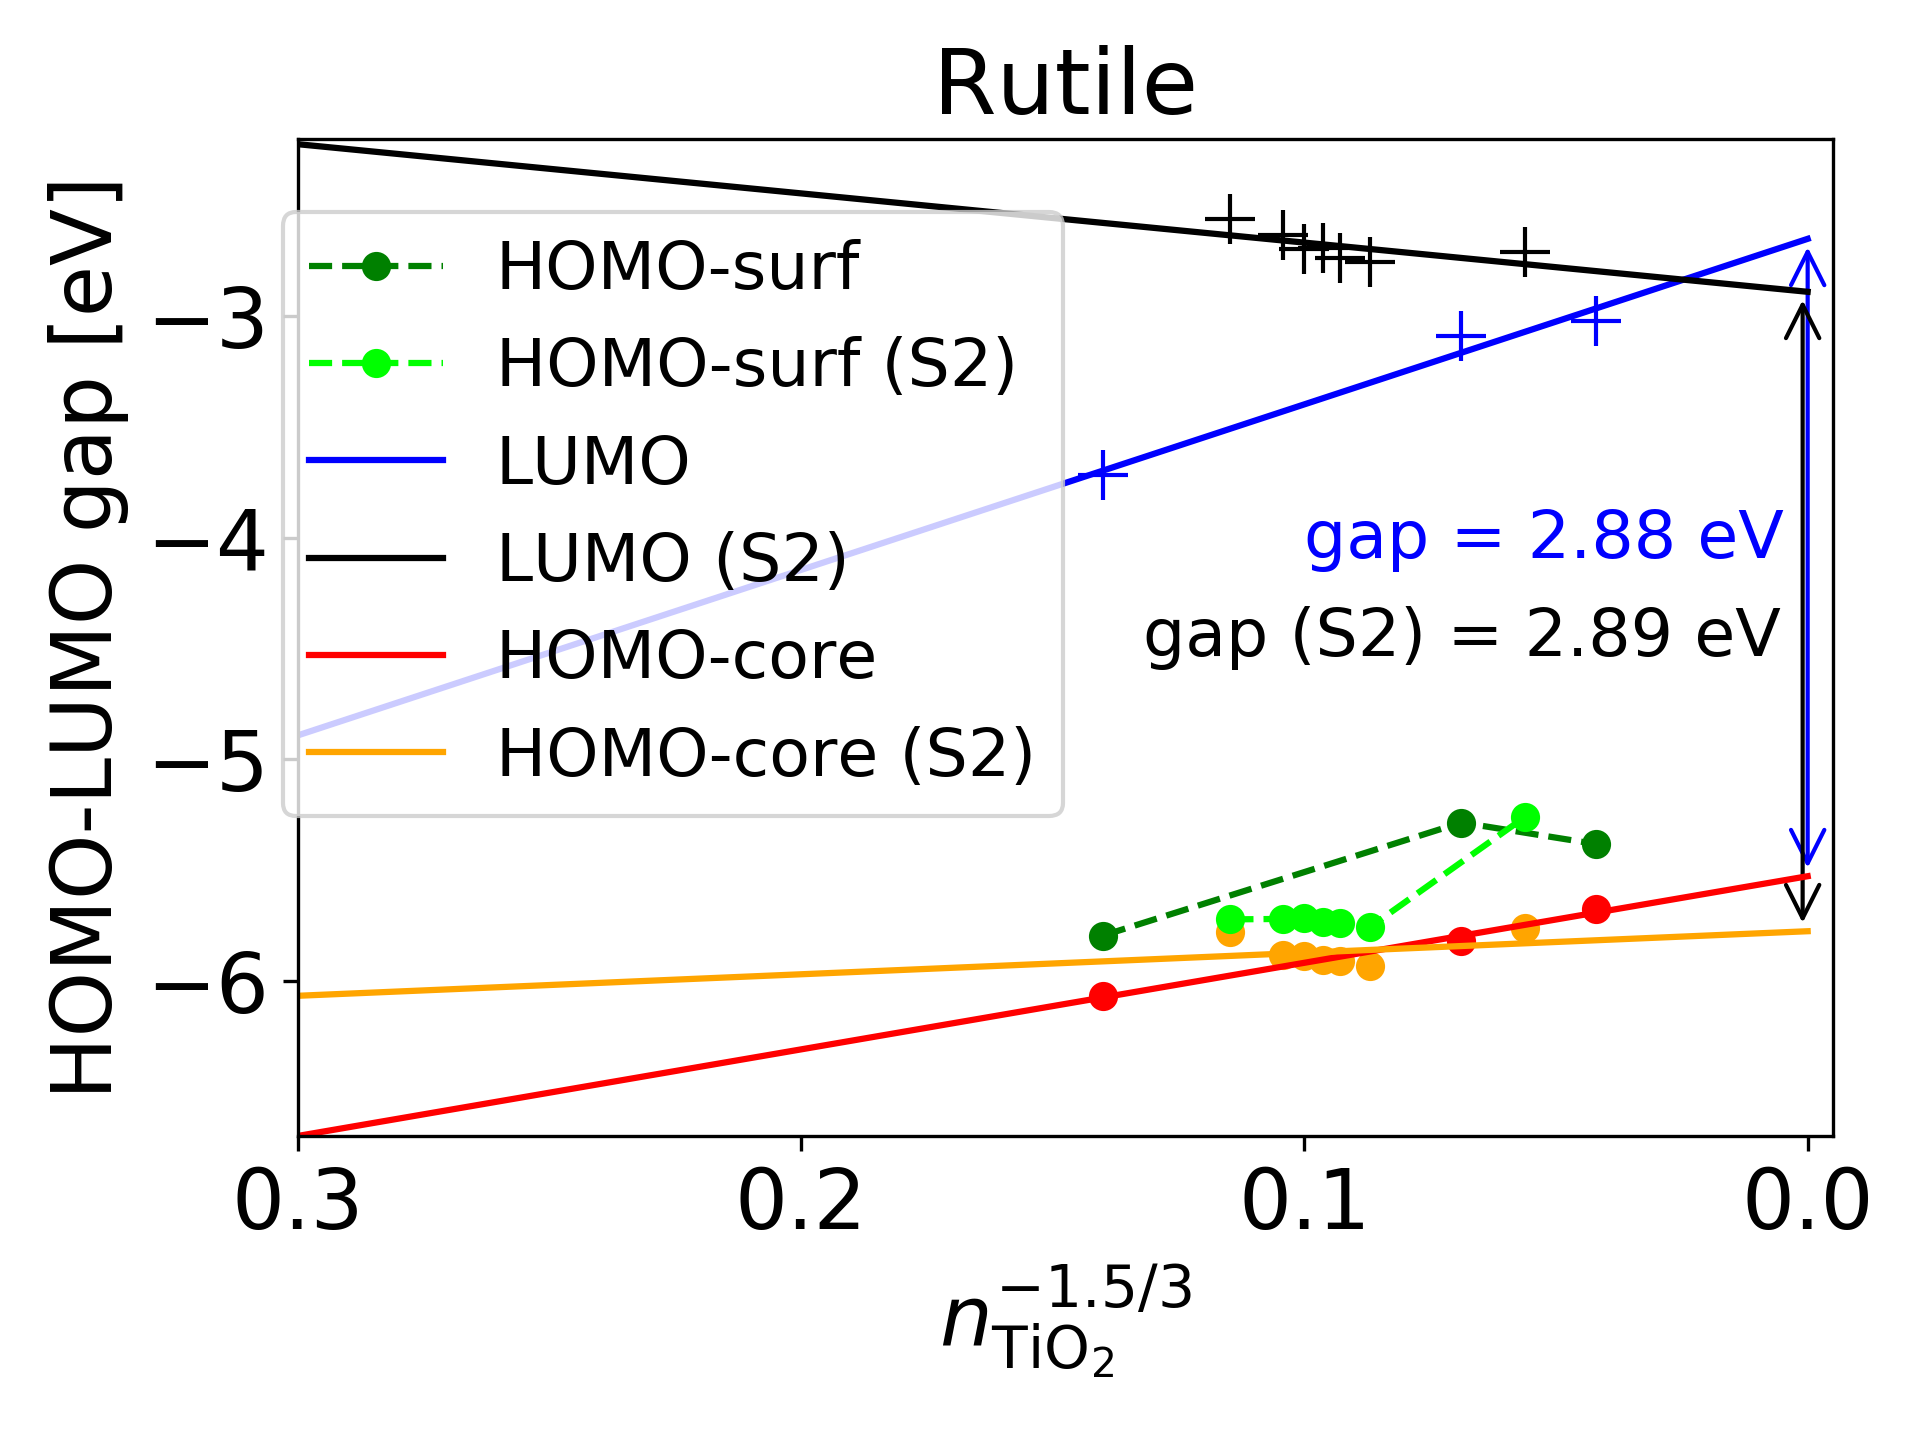
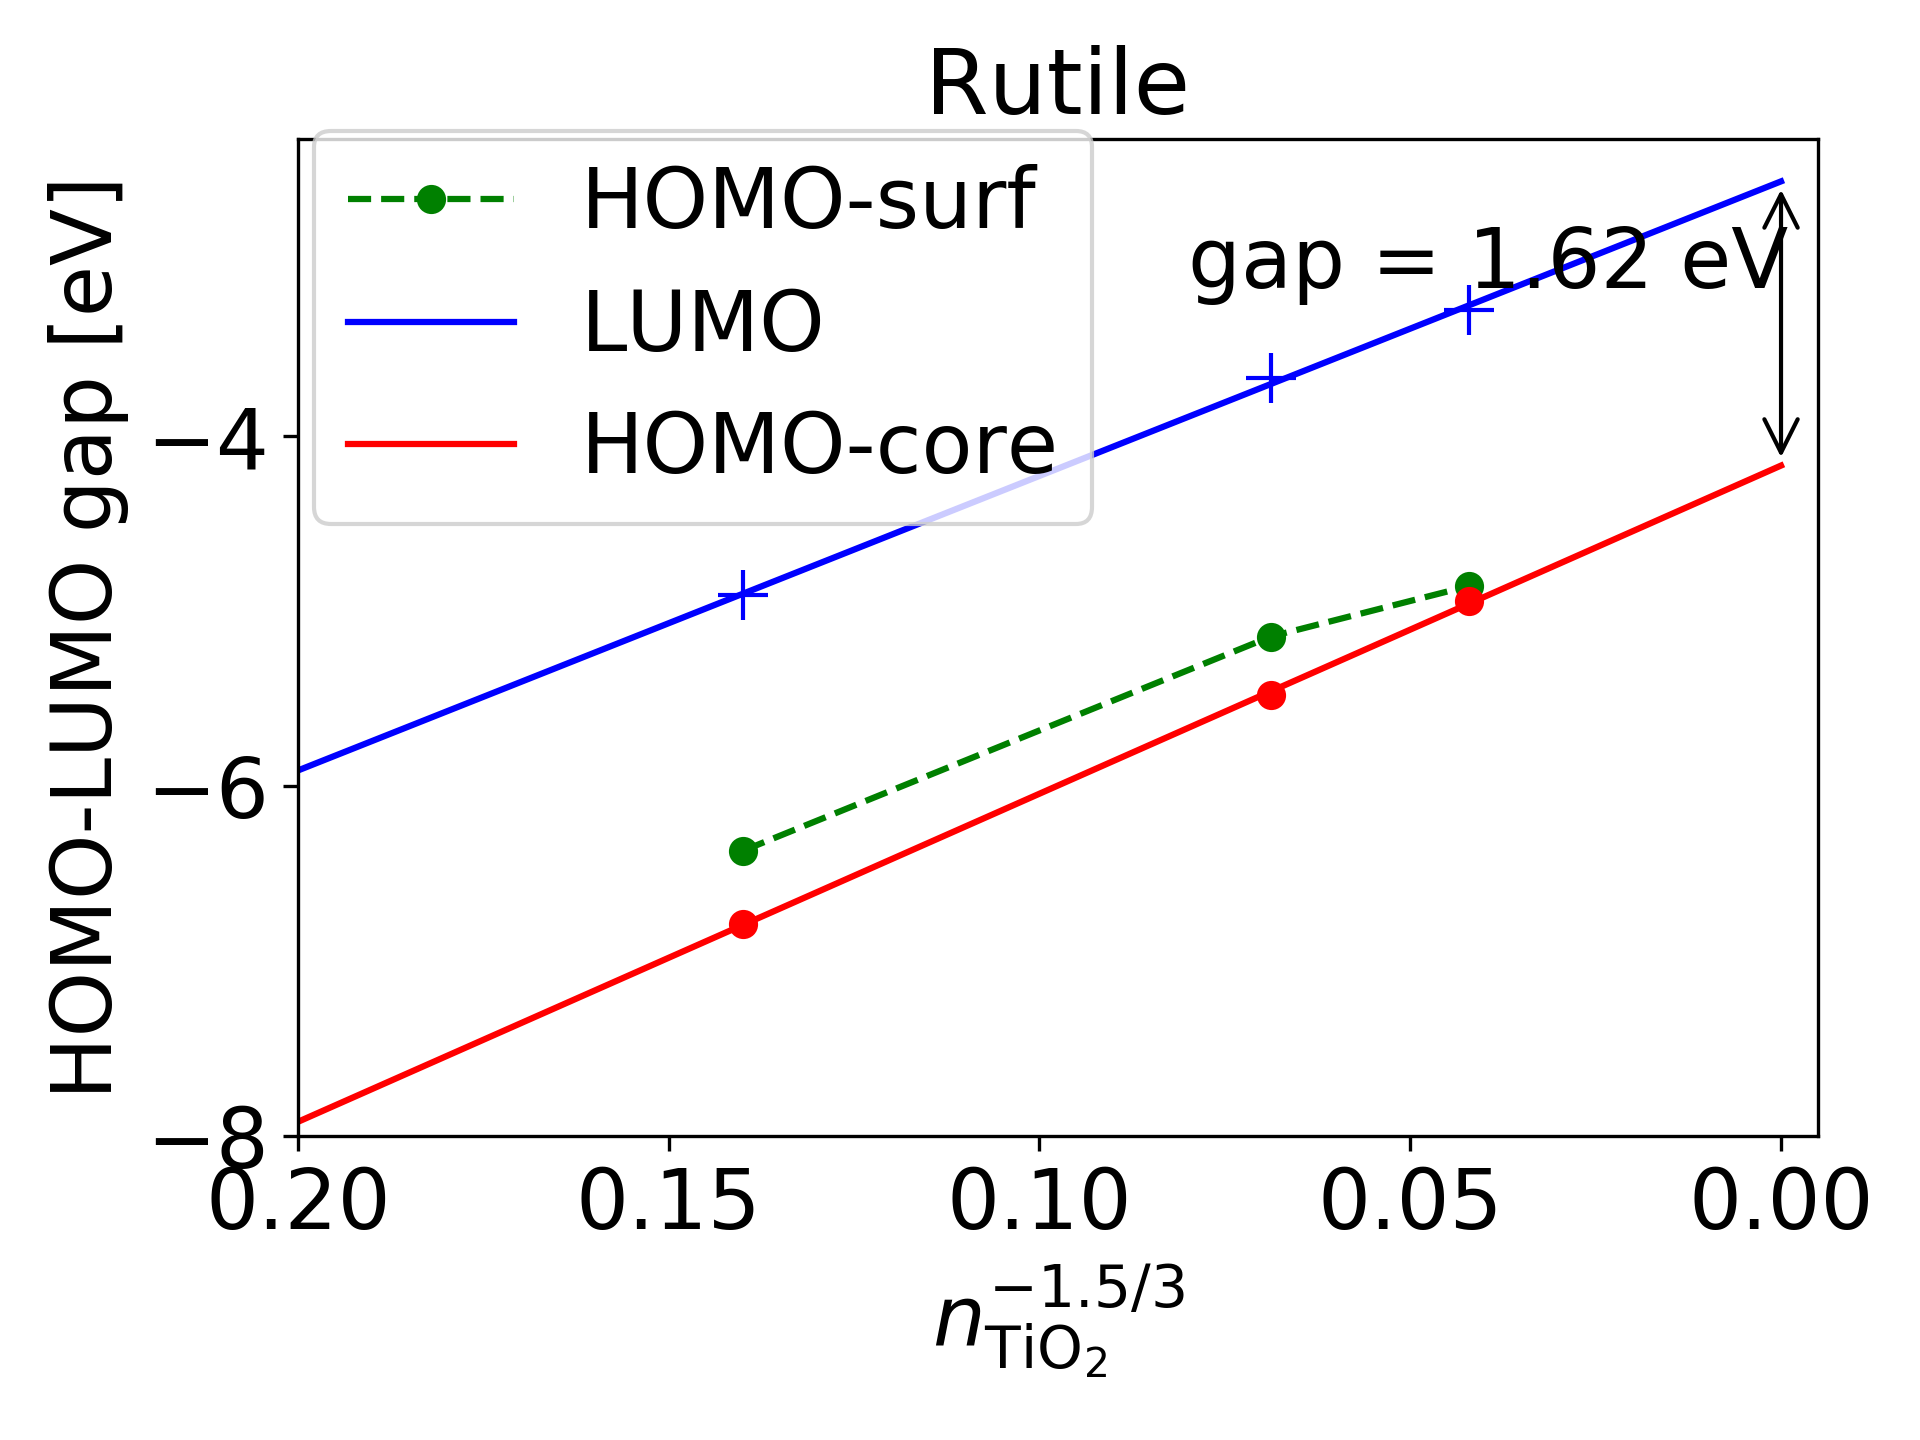
Comparing the extrapolated value of the band gap for rutile, excluding the surface states, from the nanocrystals with the calculated band gap of the bulk, we find that the extrapolated value slightly overestimates the bulk one with DFTB (2.88 eV vs. 2.76 eV) and underestimates it with PBE (1.62 eV vs 1.79 eV). We also note that the rutile data indicate an inverse quantum confinement trend even when excluding the surface states, in disagreement with the PBEx data presented in Ref. 3. We are not entirely sure what the origin of the discrepancy is. We note however, that both rutile slabs 33 as well as nanowires 34 exclusively exposing (110) surfaces show an even-odd behaviour in the valence and conduction band edges with number of layers. For odd numbers, both display an inverse quantum confinement behaviour, while for even numbers they display regular quantum confinement behaviour. The effect was found to be more pronounced for the conduction band states.
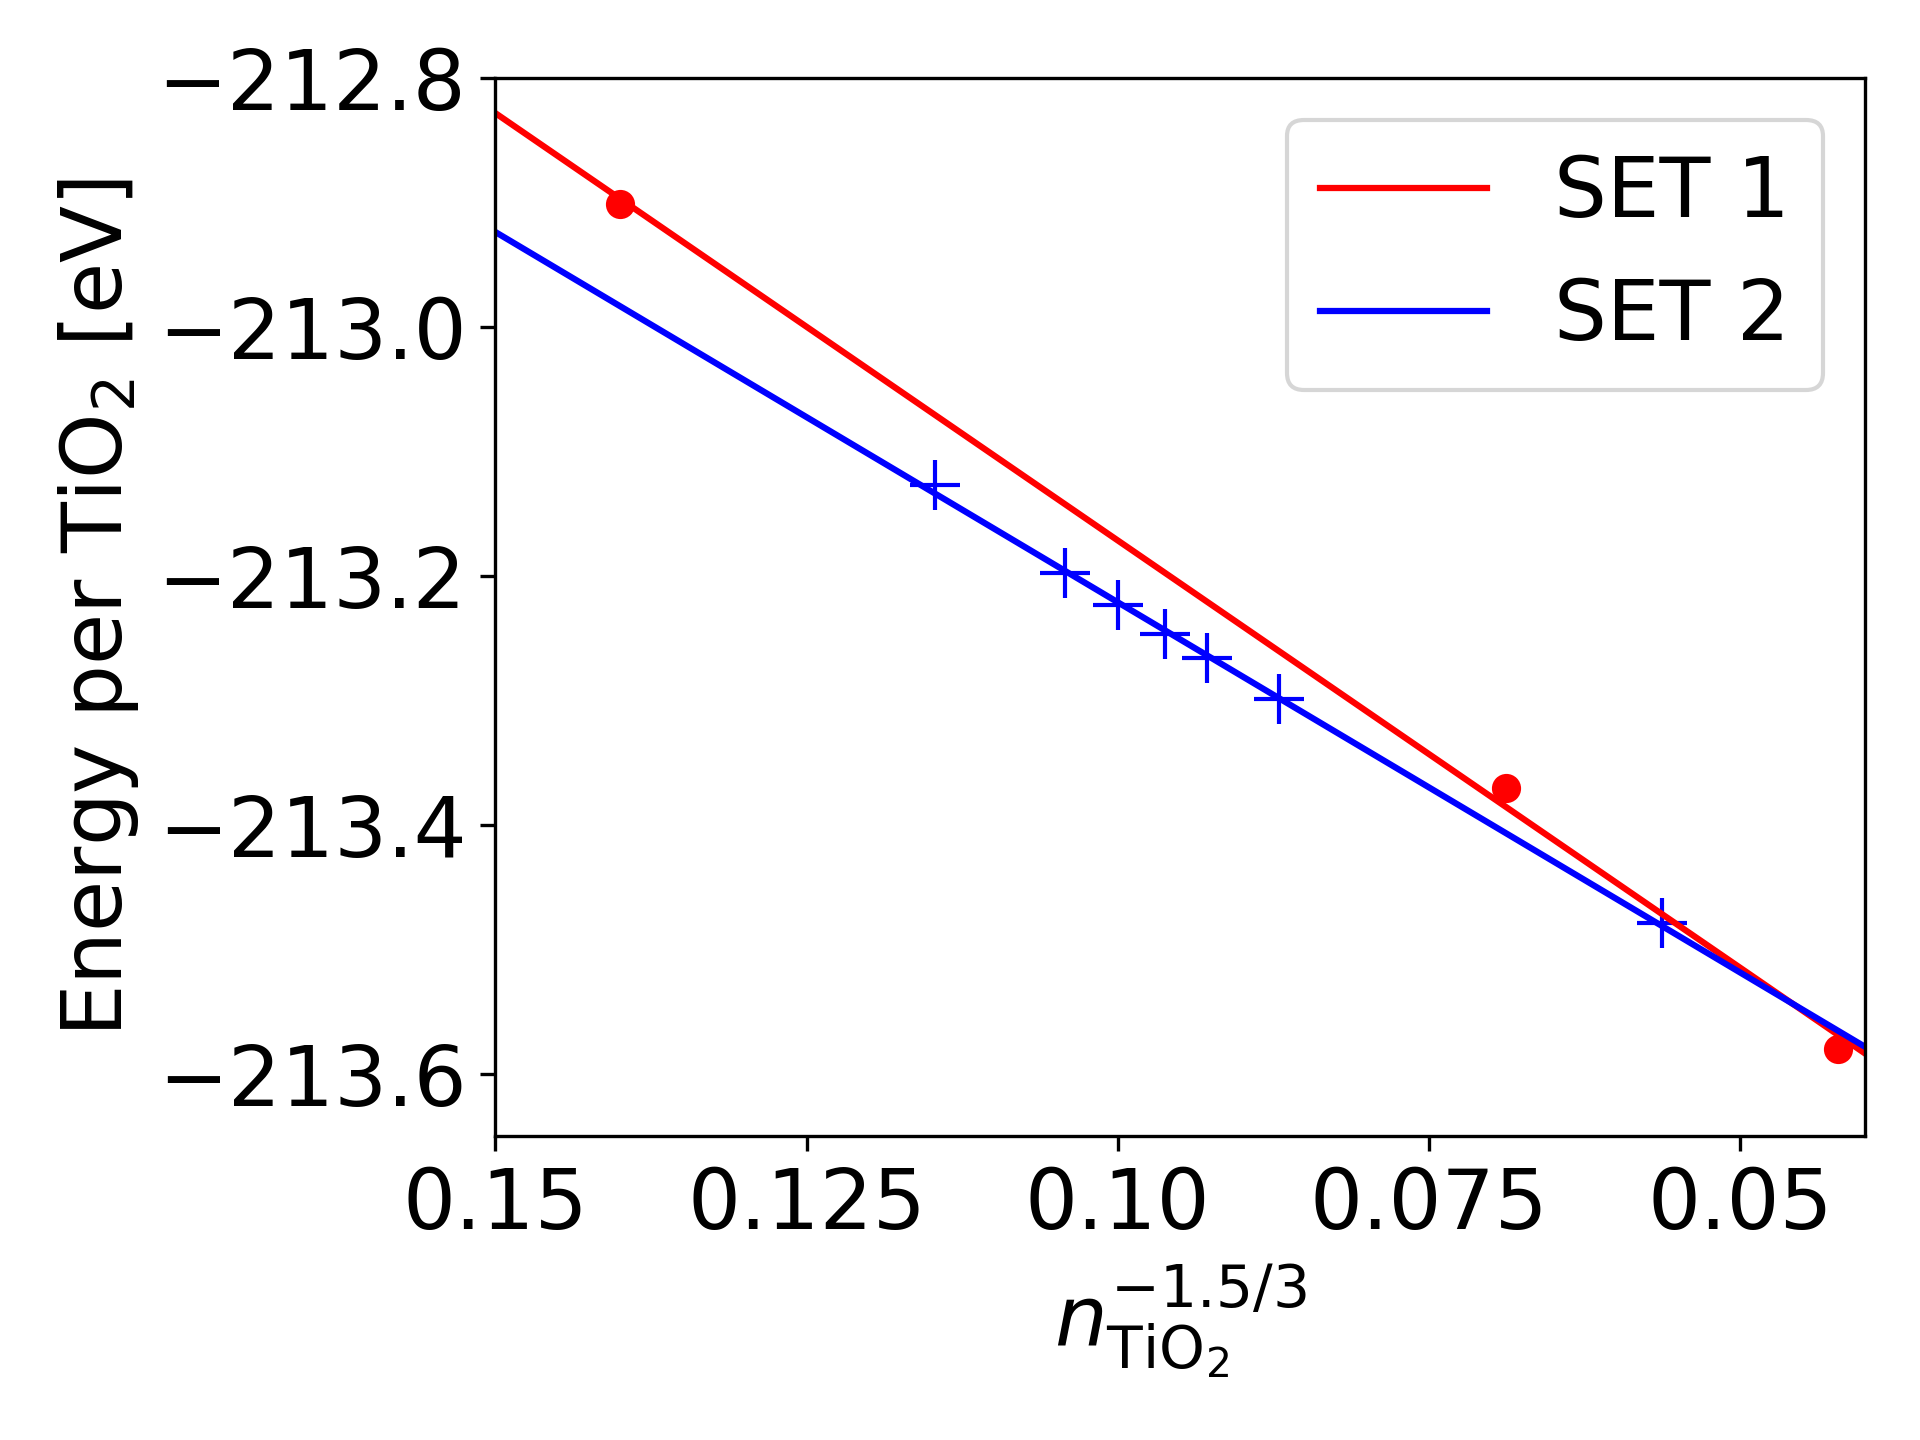
Therefore, in addition, we also considered another set of quasi Wulff-type rutile nanocrystals by cutting particles along the (110) and (101) planes with an even number of (110) layers across the waist of the particle. In the following we will refer to this new set as SET 2. These nanocrystals contain 76, 92, 100, 108, 116, 132 and 316 TiO2 formula units. In order to make the crystals stoichiometric, we removed a number of Ti atoms at the (101) facets as opposed to adding dangling oxygen ions as was done in Ref. 3. The particles of this set are found to be more stable compared to those presented in Ref. 3, see Fig. 8. We also tried building larger particles with even numbers of (110) layers, but these particles became metallic and also became significantly less stable. Using the stable and non-metallic particles of the new set we obtain an extrapolated value (excluding surface states) for the band gap of 2.89 eV, see Fig. 6. We note that the new set displays a regular quantum confinement trend with a decreasing HOMO-core to LUMO gap with increasing crystal size. While the HOMO-core states of the rutile nanocrystals of the new set are located in the same energy region as those of the original set, the LUMO states are located at higher energies. This behaviour is therefore consistent with the even-odd behaviour with respect to the number of (110) layers for the VB and CB positions for slabs and nanowires in Refs. 33 and 34, respectively.
Given that particles of comparable stability may show contrasting behaviour in terms of their HOMO and LUMO positions suggests that we need to be careful in establishing scaling relations – explicit simulations are clearly required for small rutile nanocrystals.
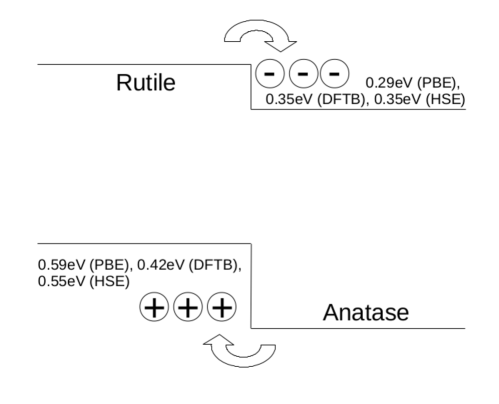
Using the HOMO and LUMO level positions obtained above, band level alignments in combined nanocrystals, consisting of a rutile and an anatase nanocrystal, can be predicted. Note, however, that such predictions would not take the effect of the actual anatase-rutile interfaces into account which can have a significant impact as will become clear from the presentation in the section on Band alignment in bonded nanocrystals. We also note that much of such size dependence in the alignment will be driven by the large variation in the HOMO and LUMO position in the rutile nanocrystals. The results will also depend on the type of rutile nanocrystals we use. Nevertheless, combining an anatase nanocrystal with rutile nanocrystals of type presented in Ref. 3, one obtains a so-called type II rutile alignment (using the nomenclature of Ref. 3) for small rutile nanocrystals, where rutile acts as an electron trap and anatase as a hole trap. Increasing the size of the rutile nanocrystal results in a transition to a so-called type I alignment, where both the HOMO and the LUMO states are located within the rutile nanocrystal. Finally, for even larger rutile crystal sizes one obtains a so-called type II anatase alignment (as also predicted by the branching point calculation with the bulk structures), where rutile acts as a hole and anatase as an electron trap. The same quantitative behaviour was derived for PBEx in Ref. 3.
On the other hand, combining an anatase nanocrystal with a rutile nanocrystal from the new set (S2) one can obtain a number of different alignments. Most notably, using the smallest rutile nanocrystal of the new set leads to an alignment where both the HOMO and the LUMO states are located within the anatase nanocrystal.
With the aforementioned difficulties in establishing robust trends in the HOMO and LUMO levels in rutile nanocrystals, we conclude that we are unable to make robust prediction in HOMO-LUMO level alignment between anatase and rutile nanocrystals, at least for size range covered by our simulations, 1-4.5 nm, without resorting to explicit simulations.
3.2.3 Band alignment in bonded nanocrystals
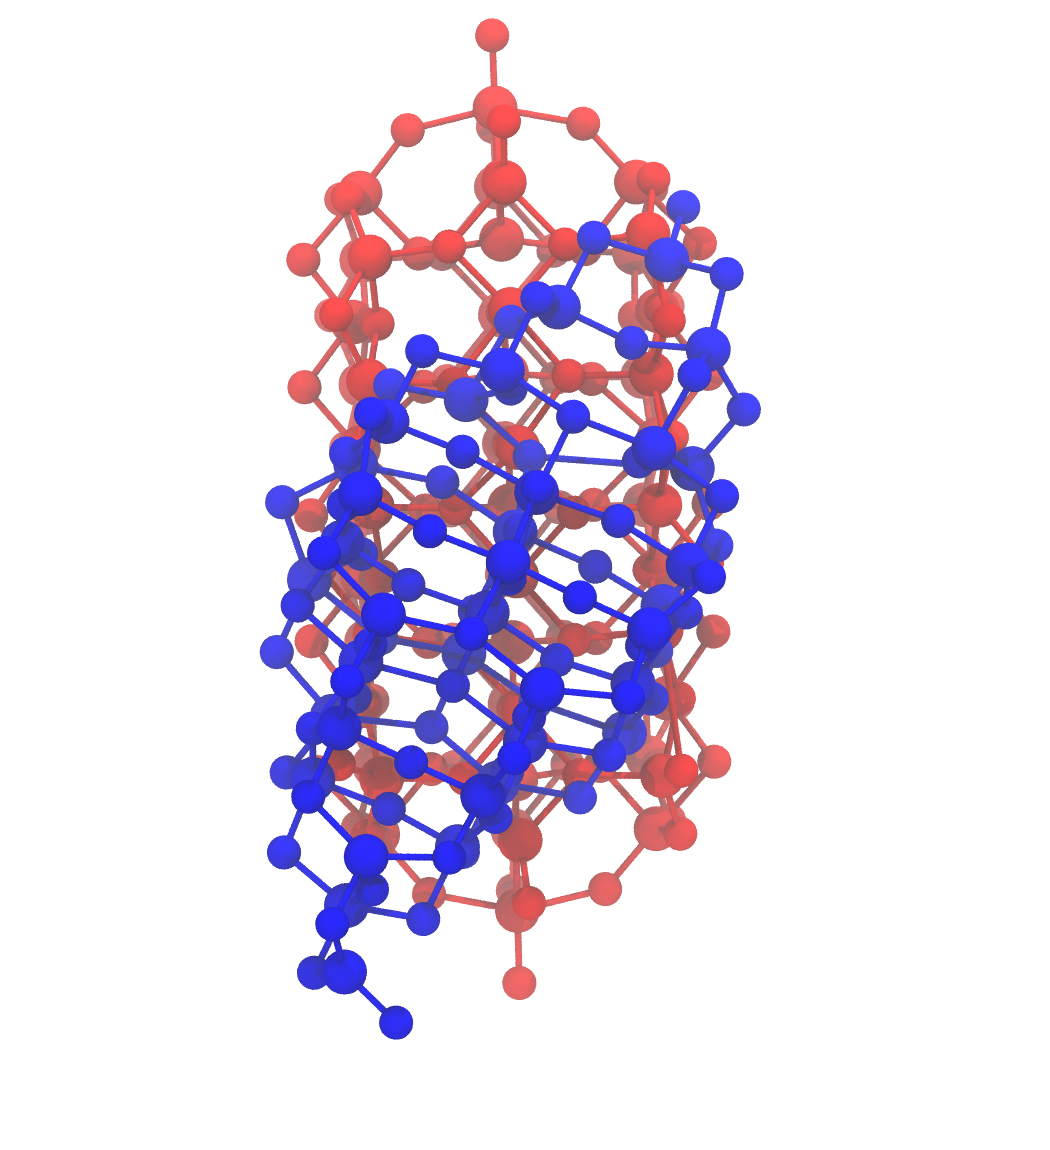
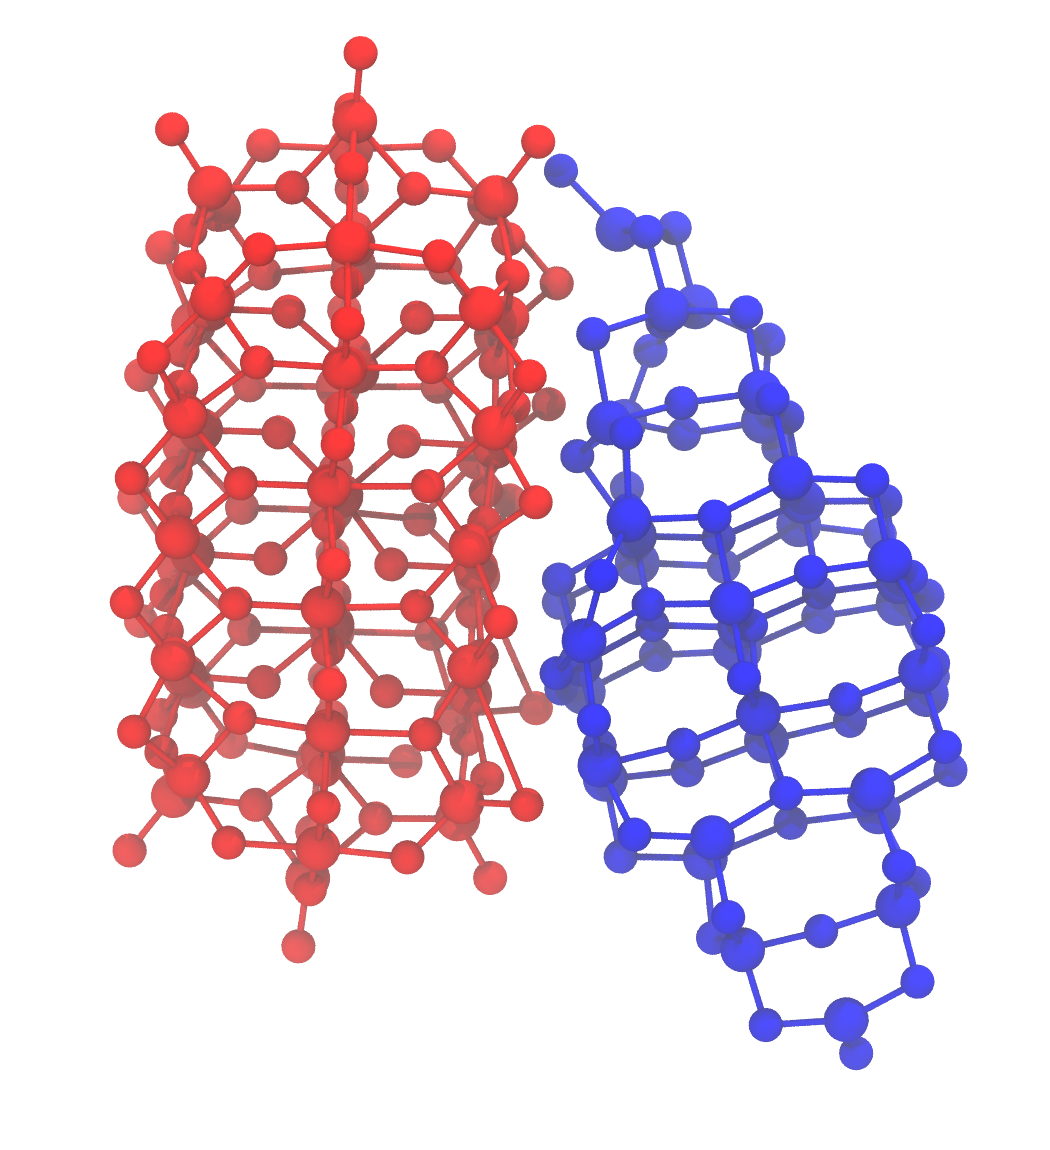
Exploiting the efficiency of the DFTB method, we have investigated the influence of the interface on the gap alignment by simulating explicit interface structures between different orientations of the smallest anatase and rutile nanocrystals. In the most stable structures we have obtained for nanocrystals with a rutile (110) and anatase (101) interface, the nanocrystals tend to align with an angle of around 30 degrees with respect to each other along the rutile [001] and anatase [010] directions. This alignment, as shown in Figure 9, maximizes the interaction area and the bond formation between the two structures, minimizing also the interface energy which was computed according to Equation 4.
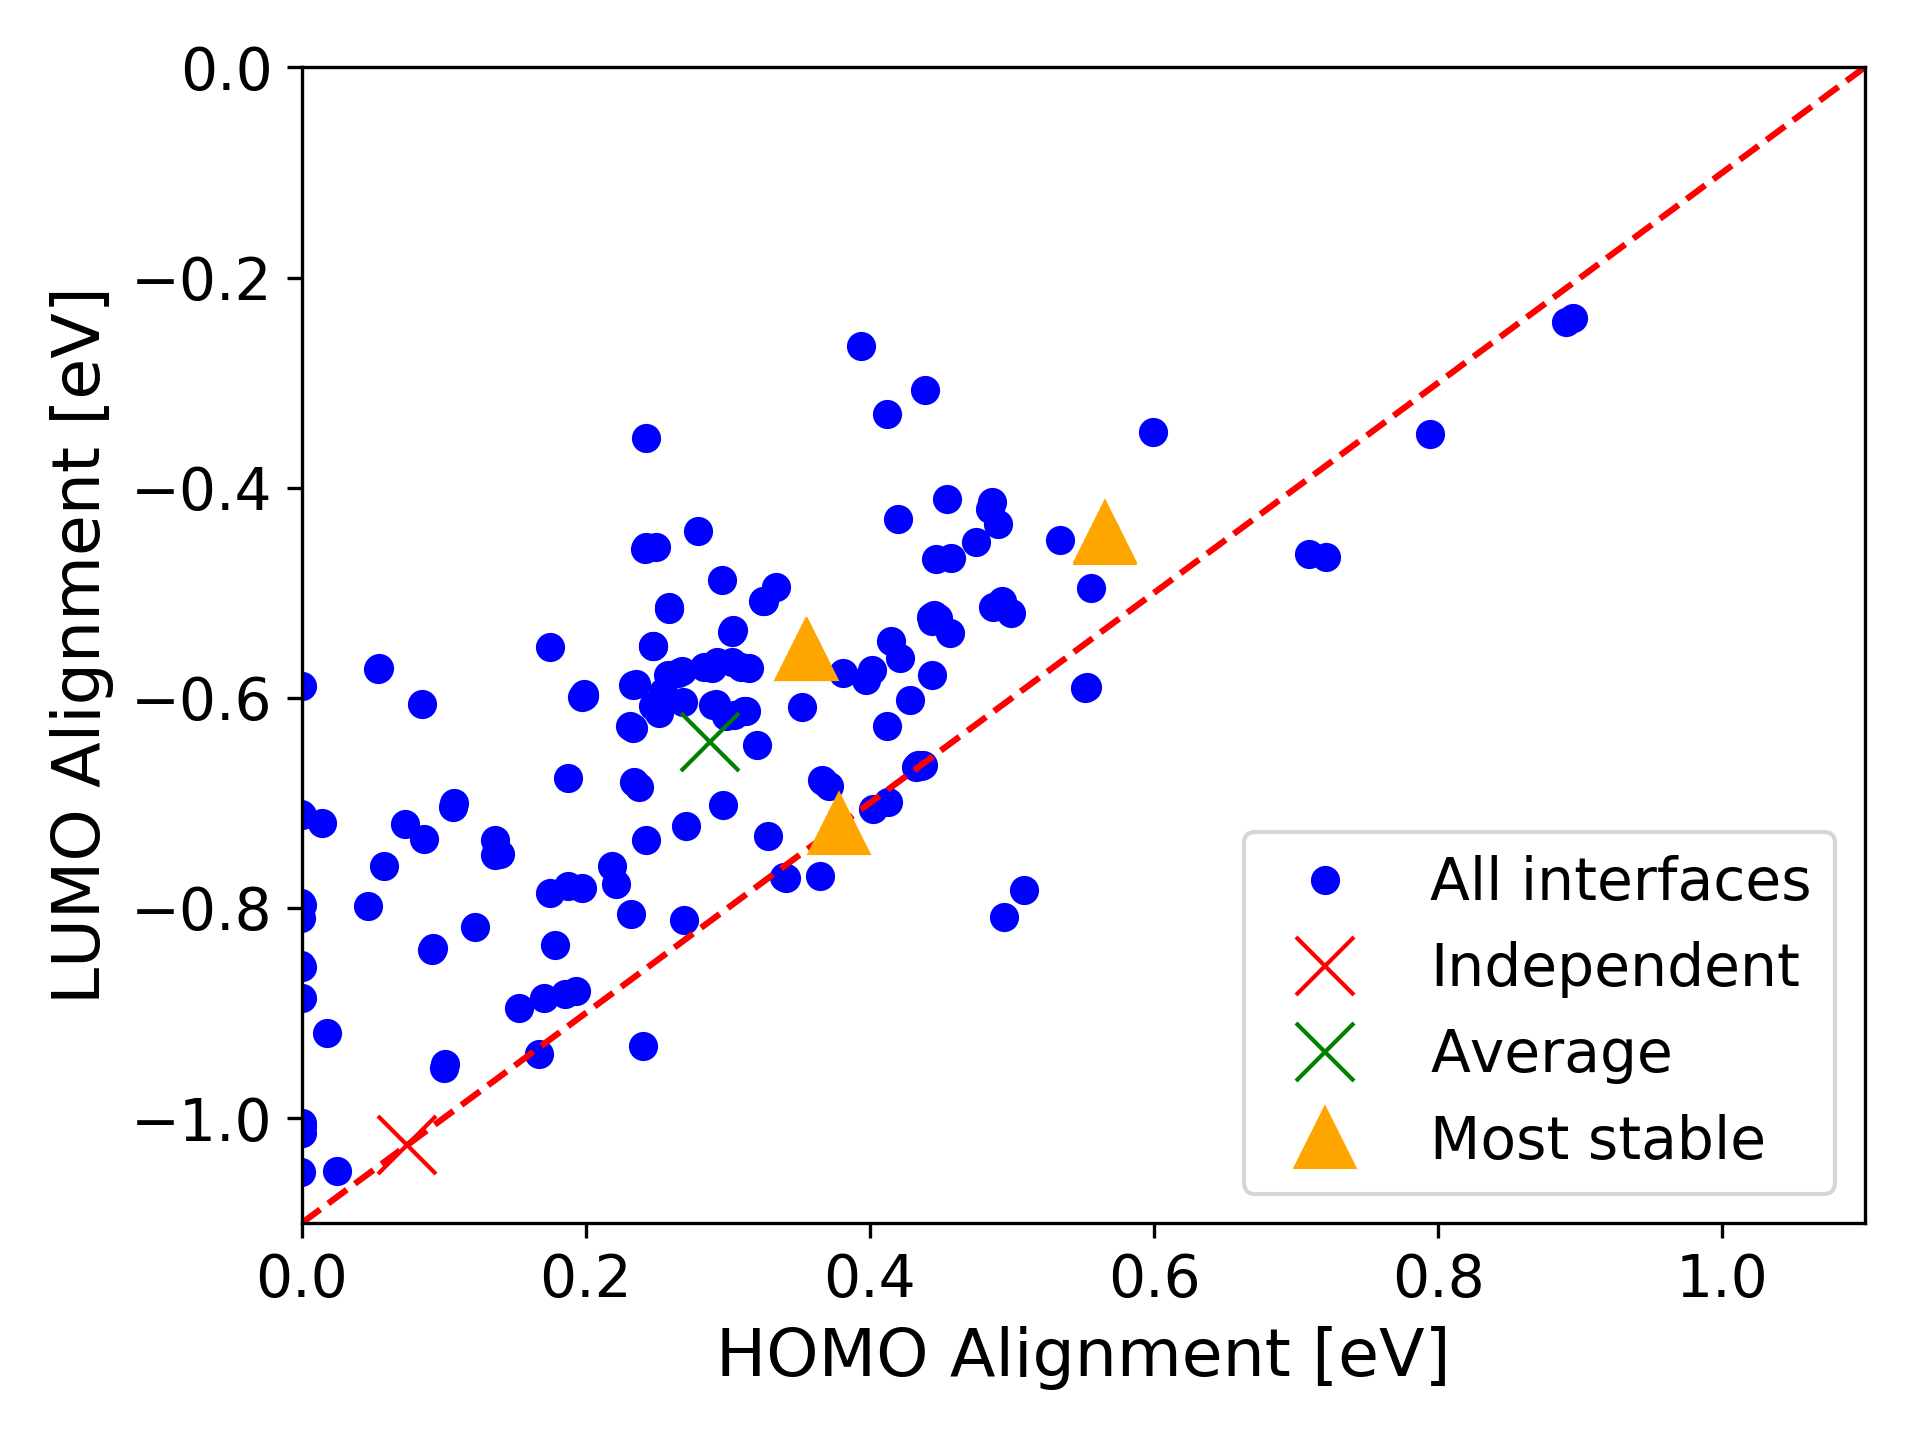
The prediction using independent nanocrystals (neglecting the interface effects) suggests a type I alignment with a mismatch of 0.07 eV for the HOMO and 1.03 eV for the LUMO. This suggests a complete domination of the gap by rutile states, due to the narrowing of its gap by surface states. The gap alignments for all 156 investigated bonded arrangements, their average and the value obtained from the non-interacting nanocrystals are displayed in Figure 10. The 5 configurations with the lowest energy has been also marked in the figure. It is obvious that although the prediction using non-interacting nanocrystals delivers the correct alignment type, the magnitude in the offset are far off from both the average interface offset and the one obtained from the most stable interface structures. This suggests, that interface effects have a significant influence on the level alignment and must be accounted for explicitly. One observes a slight correlation of the LUMO/HOMO alignments along with the indicated diagonal line which would correspond to rigid shifts of the bands edges without any change in band gap. This therefore represents situations, where bands in both phases are shifted due to an interface dipole that varies in magnitude depending on the relative orientation of the nanocrystals, but where no new interface states are being created.
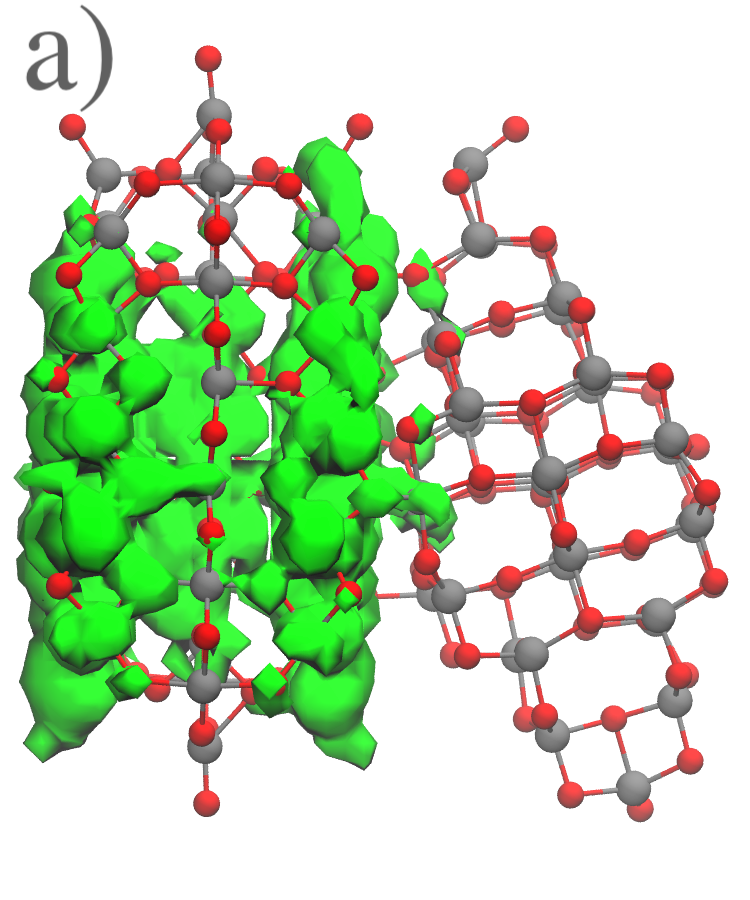
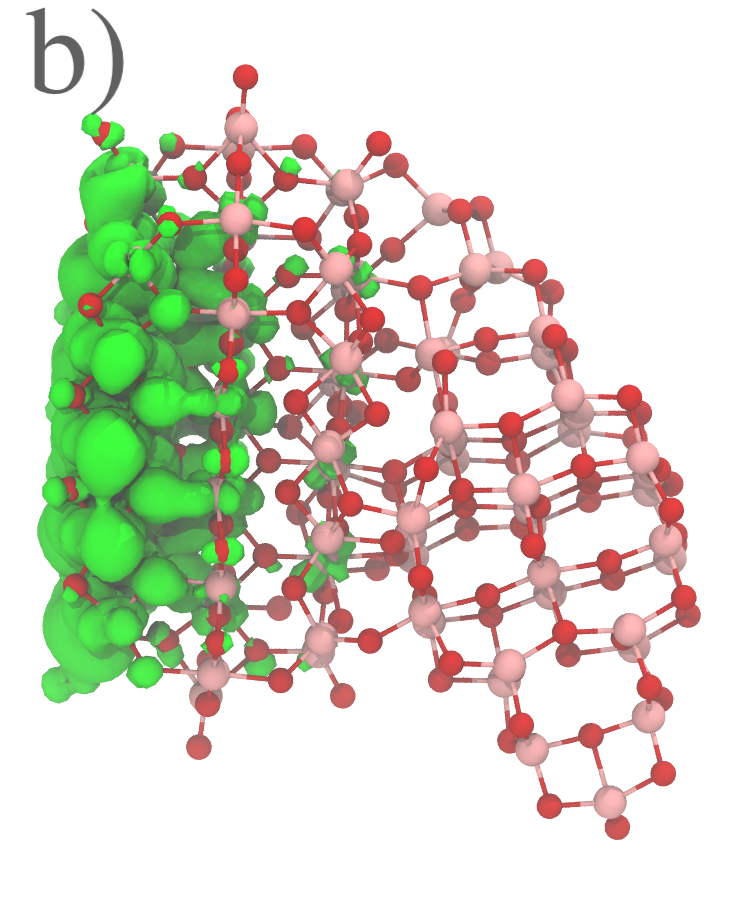
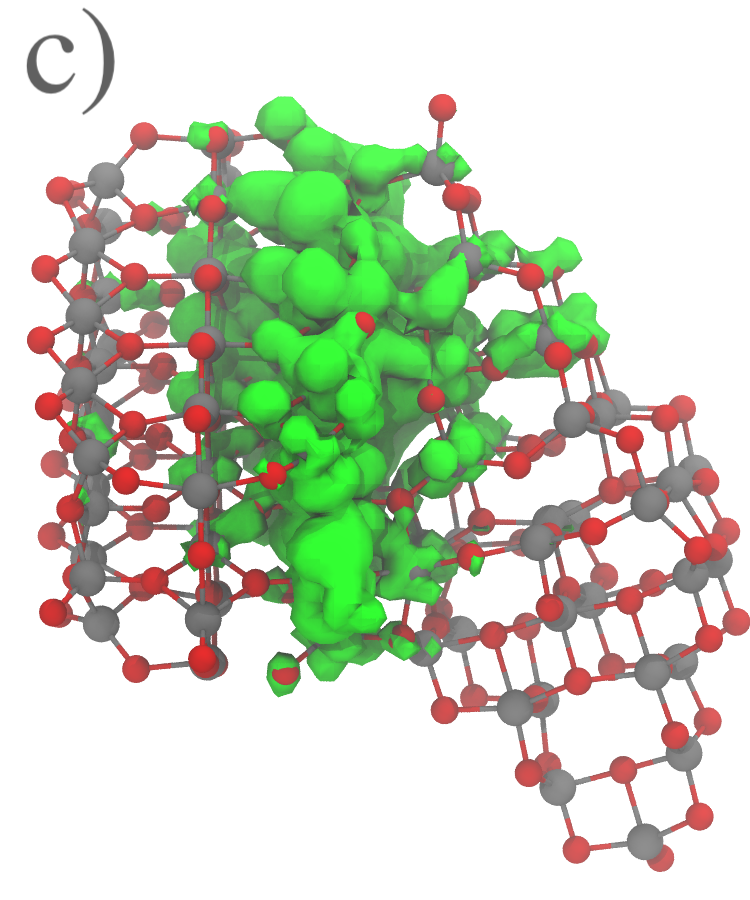
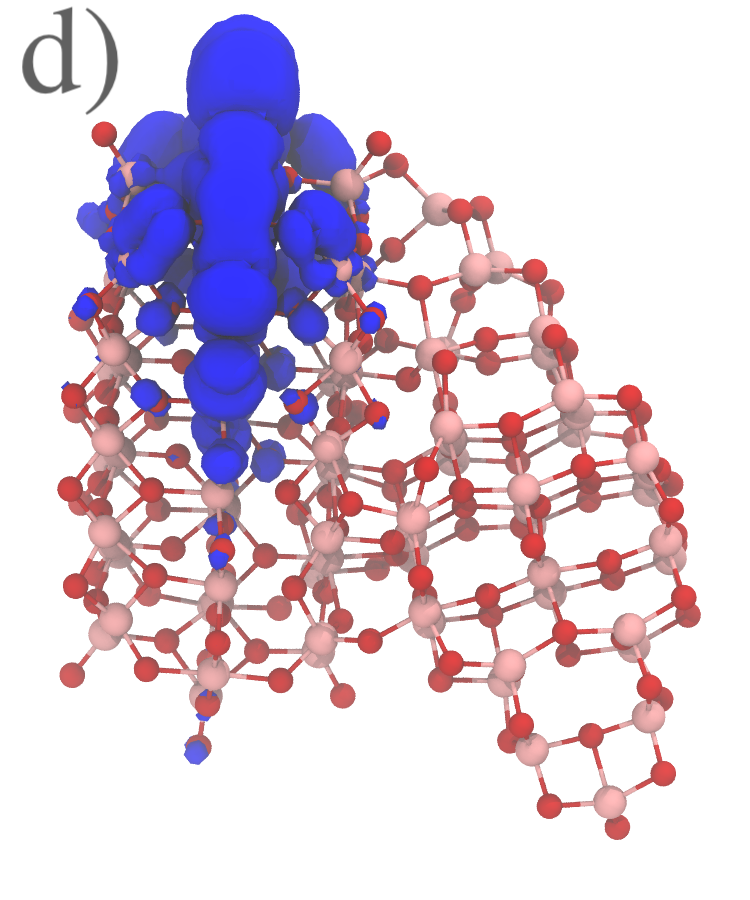
Some typical LUMO and HOMO wave functions of the interfaces are displayed in Fig. 11. We found three different types of LUMO wave functions and one HOMO wave function. The HOMO wave function is identical to the rutile HOMO-surface state. The most common LUMO wave function is located exclusively in the rutile nanoparticle, but differs considerably from the LUMO wave function of the isolated rutile nanocrystal. The second most common is located directly at the interface, while the least common one, which only occurs in four of the investigated cases, resembles the original rutile LUMO wave function. The interface in each of the five most stable structures is of the first type, which is also the most common among all investigated nanoparticles. This underlines the necessity to model nanocrystal interfaces explicitely, as the LUMO edge states might differ considerably from the those obtained from the independent particle model. This aspect would be important to consider not least, when modeling catalytic reactions at the surface of nanocrystals.
4 Conclusions
We have developed a DFTB parameter set using the ChIMES force field with three-body terms as repulsive potentials especially designed for rutile and anatase nanocrystals. We found that the three-body term was crucial in order to predict the correct relaxation around the low coordinated atoms at the apex of anatase nanocrystals.
We used the new DFTB parametrization, the tio2nano set, to investigate different anatase-rutile band alignment models in order to predict effective charge carrier separation in mixed anatase-rutile systems. While the bulk band alignment model predicts a type II anatase alignment where anatase acts as an electron and rutile as a hole trap in accordance with the literature 1, 2, 5, the nanocrystal model indicates a strong dependence of the band alignment type on the crystal size in accordance to the predictions in Reference 3. The detailed shape of small rutile nanocrystals also plays a crucial role. We showed that two types of rutile nanocrystal which both predominantly expose the (110) facets and which both have similar stability give rise to rather different behaviours in terms of band alignment. This fact also makes it difficult to establish robust rules of thumb when it comes to predicting band alignment in a rutile/anatase nanocrystal mixture and underlines the necessity for explicit simulations of those systems.
Using the efficiency of the DFTB method, we also investigated the effect of the anatase/rutile nanocrystal interface in the band alignment. We optimized the geometry of 156 anatase/rutile nanocrystal pairs where the mutual orientations were systematically varied. While, all interface models show the same type I alignment, the magnitude of the band-offset vary almost one electronvolt with different orientations. This observation suggests that it is important to consider interface effects in the band alignment and underpins the importance of being able to extend the reach of electronic structure simulations beyond the realms spanned by regular DFT.
The DFG grant RTG 2247 is acknowledged. JK would like to acknowledge the Swedish National Strategic e-Science programme (eSSENCE). We would also like to acknowledge Pavlin D. Mitev for his insightful comments. Prepared by LLNL under Contract DE-AC52-07NA27344. Project 20-SI-004 with Brandon Wood as PI was funded by the Laboratory Directed Research and Development Program at LLNL.
References
- Deák et al. 2011 Deák, P.; Aradi, B.; Frauenheim, T. Band Lineup and Charge Carrier Separation in Mixed Rutile-Anatase Systems. J. Phys. Chem. C 2011, 115, 3443––3446
- Kullgren et al. 2014 Kullgren, J.; Huy, H. A.; Aradi, B.; Frauenheim, T.; Deák, P. Theoretical study of charge separation at the rutile–anatase interface. Phys. Status Solidi Rapid Res. Lett. 2014, 8, 566–570
- Ko et al. 2017 Ko, K. C.; Bromley, S. T.; Lee, J. Y.; Illas, F. Size-Dependent Level Alignment between Rutile and Anatase TiO2 Nanoparticles: Implications for Photocatalysis. J. Phys. Chem. Lett. 2017, 8, 5593–5598
- Lamiel-Garcia et al. 2017 Lamiel-Garcia, O.; Ko, K. C.; Lee, J. Y.; Bromley, S. T.; Illas, F. When Anatase Nanoparticles Become Bulklike: Properties of Realistic TiO2 Nanoparticles in the 1–6 nm Size Range from All Electron Relativistic Density Functional Theory Based Calculations. J. Chem. Theory. Comput. 2017, 13, 1785–1793
- Hurum et al. 2003 Hurum, D. C.; Agrios, A. G.; Gray, K. A.; Rajh, T.; Thurnauer, M. C. Explaining the Enhanced Photocatalytic Activity of Degussa P25 Mixed-Phase TiO2 Using EPR. J. Phys. Chem. B 2003, 107, 4545––4549
- Luschtinetz et al. 2009 Luschtinetz, R.; Frenzel, J.; Milek, T.; Seifert, G. Adsorption of Phosphonic Acid at the TiO2 Anatase (101) and Rutile (110) Surfaces. J. Phys. Chem. C 2009, 113, 5730–5740
- Dolgonos et al. 2010 Dolgonos, G.; Aradi, B.; Moreira, N. H.; Frauenheim, T. An Improved Self-Consistent-Charge Density-Functional Tight-Binding (SCC-DFTB) Set of Parameters for Simulation of Bulk and Molecular Systems Involving Titanium. J. Chem. Theory. Comput. 2010, 6, 266–278
- Balzaretti et al. 2021 Balzaretti, F.; Gupta, V.; Ciacchi, L. C.; Aradi, B.; Frauenheim, T.; öppen, S. Water reactions on reconstructed rutile TiO2: a DFT / DFTB approach. in preparation 2021,
- 9 The parameter set can be downloaded from http://dftb.org
- Gaus et al. 2013 Gaus, M.; Goez, A.; Elstner, M. Parametrization and Benchmark of DFTB3 for Organic Molecules. J. Chem. Theory. Comput. 2013, 9, 338–354
- Koziol et al. 2017 Koziol, L.; Fried, L. E.; Goldman, N. Using Force Matching To Determine Reactive Force Fields for Water under Extreme Thermodynamic Conditions. J. Chem. Theory Comput. 2017, 13, 135–146
- Lindsey et al. 2017 Lindsey, R. K.; Fried, L. E.; Goldman, N. ChIMES: A Force Matched Potential with Explicit Three-Body Interactions for Molten Carbon. J. Chem. Theory Comput. 2017, 13, 6222–6229
- Goldman et al. 2018 Goldman, N.; Aradi, B.; Lindsey, R. K.; Fried, L. E. Development of a Multicenter Density Functional Tight Binding Model for Plutonium Surface Hydriding. J. Chem. Theory. Comput. 2018, 14, 2652–2660
- Kim et al. 2019 Kim, B.-H.; Kullgren, J.; Wolf, M. J.; Hermansson, K.; Broqvist, P. Multiscale Modeling of Agglomerated Ceria Nanoparticles: Interface Stability and Oxygen Vacancy Formation. Frontiers in Chemistry 2019, 7, 203
- Hourahine et al. 2020 Hourahine, B. et al. DFTB+, a software package for efficient approximate density functional theory based atomistic simulations. J. Chem. Phys. 2020, 152, 124101
- Pham et al. 2021 Pham, C. H.; Lindsey, R. K.; Fried, L. E.; Goldman, N. Calculation of the detonation state of HN3 with quantum accuracy. J. Chem. Phys. 2021, 153, 224102
- Armstrong et al. 2020 Armstrong, M. R.; Lindsey, R. K.; Goldman, N.; Nielsen, M. H.; Stavrou, E.; Fried, L. E.; Zaug, J. M.; Bastea, S. Ultrafast shock synthesis of nanocarbon from a liquid precursor. Nature Communications 2020, 11, 353
- Lindsey et al. 2020 Lindsey, R. K.; Goldman, N.; Fried, L. E.; Bastea, S. Many-body reactive force field development for carbon condensation in C/O systems under extreme conditions. J. Chem. Phys. 2020, 153, 054103
- Lindsey et al. 2020 Lindsey, R. K.; Fried, L. E.; Goldman, N.; Bastea, S. Active learning for robust, high-complexityreactive atomistic simulations. J. Chem. Phys. 2020, 153, 134117
- Kresse and Furthmüller 1996 Kresse, G.; Furthmüller, J. Efficient iterative schemes for ab initio total-energy calculations using a plane-wave basis set. Phys. Rev. B 1996, 54
- Perdew et al. 2008 Perdew, J. P.; Ruzsinszky, A.; Csonka, G. I.; Vydrov, O. A.; Scuseria, G. E.; Constantin, L. A.; Zhou, X.; Burke, K. Restoring the Density-Gradient Expansion for Exchange in Solids and Surfaces. Phys. Rev. Lett. 2008, 100, 136406
- Dantanarayana et al. 2020 Dantanarayana, V.; Nematiaram, T.; Vong, D.; Anthony, J. E.; Troisi, A.; Cong, K. N.; Goldman, N.; Faller, R.; Moulé, A. J. Predictive Model of Charge Mobilities in Organic Semiconductor Small Molecules with Force-Matched Potentials. J. Chem. Theory Comput. 2020, 16, 3494–3503
- Efron et al. 2004 Efron, B.; Hastie, T.; Johnstone, I.; Tibshirani, R. Least angle regression. Ann. Stat. 2004, 32, 407–499
- Friedman et al. 2010 Friedman, J.; Hastie, T.; Tibshirani, R. Regularization paths for generalized linear models via coordinate descent. J. Stat. Softw. 2010, 33, 1
- Tibshirani 1996 Tibshirani, R. Regression shrinkage and selection via the lasso. J. R. Statist. Soc. B 1996, 58, 267–288
- Monkhorst and Pack 1976 Monkhorst, H. J.; Pack, J. D. Special points for Brillouin-zone integrations. Phys. Rev. B 1976, 13, 5188
- Barber et al. 1996 Barber, C. B.; Dobkin, D. P.; Huhdanpaa, H. The quickhull algorithm for convex hulls. ACM Transactions on Mathematical Software 1996, 22, 469
- Larsen et al. 2017 Larsen, A. H. et al. The Atomic Simulation Environment—A Python library for working with atoms. J. Phys.: Condens. Matter. 2017, 29, 273002
- Lazzeri et al. 2001 Lazzeri, M.; Vittadini, A.; Selloni, A. Structure and energetics of stoichiometric TiO2 anatase surfaces. Phys. Rev. B 2001, 63, 155409
- Abrahams and Bernstein 1971 Abrahams, S. C.; Bernstein, J. L. Rutile: Normal Probability Plot Analysis and Accurate Measurement of Crystal Structure. J. Chem. Phys. 1971, 55, 3206
- Labat et al. 2008 Labat, F.; Baranek, P.; Adamo, C. Structural and Electronic Properties of Selected Rutile and Anatase TiO2 Surfaces: An ab Initio Investigation. J. Chem. Theory. Comput. 2008, 4, 341–352
- Araujo-Lopez et al. 2016 Araujo-Lopez, E.; Varilla, L. A.; Seriani, N.; Montoya, J. A. TiO 2 anatase’s bulk and (001) surface, structural and electronic properties: A DFT study on the importance of Hubbard and van der Waals contributions. Surface Science 2016, 653, 187–196
- Bredow et al. 2004 Bredow, T.; Giordano, L.; Cinquini, F.; Pacchioni, G. Electronic properties of rutile ultrathin films: Odd-even oscillations with the number of layers. Phys. Rev. B 2004, 70, 035419
- Hmiel and Xue 2012 Hmiel, A.; Xue, Y. Quantum confinement and surface relaxation effects in rutile TiO2 nanowires. Phys. Rev. B 2012, 85, 235461