Unmasking the Mask – Evaluating Social Biases in
Masked Language Models
Abstract
Masked Language Models (MLMs) have shown superior performances in numerous downstream NLP tasks when used as text encoders. Unfortunately, MLMs also demonstrate significantly worrying levels of social biases. We show that the previously proposed evaluation metrics for quantifying the social biases in MLMs are problematic due to following reasons: (1) prediction accuracy of the masked tokens itself tend to be low in some MLMs, which raises questions regarding the reliability of the evaluation metrics that use the (pseudo) likelihood of the predicted tokens, and (2) the correlation between the prediction accuracy of the mask and the performance in downstream NLP tasks is not taken into consideration, and (3) high frequency words in the training data are masked more often, introducing noise due to this selection bias in the test cases. To overcome the above-mentioned disfluencies, we propose All Unmasked Likelihood (AUL), a bias evaluation measure that predicts all tokens in a test case given the MLM embedding of the unmasked input. We find that AUL accurately detects different types of biases in MLMs. We also propose AUL with Attention weights (AULA) to evaluate tokens based on their importance in a sentence. However, unlike AUL and AULA, previously proposed bias evaluation measures for MLMs systematically overestimate the measured biases, and are heavily influenced by the unmasked tokens in the context.
§ 1 Introduction
Masked Language Models (MLMs; Radford et al., 2019; Brown et al., 2020; Devlin et al., 2019; Liu et al., 2019) produce accurate text representations that can be used to obtain impressive performances in numerous downstream NLP applications as-is or by fine-tuning. However, MLMs are also shown to encode worrying levels of social biases such as gender and racial biases May et al. (2019); Zhao et al. (2019); Tan and Celis (2019), which make it problematic when applied to tasks such as automatic summarisation or web search Bender (2019). By detecting and quantifying the biases directly in the MLMs, we can address the problem at the source, rather than attempting to address it for every application that uses these pretarined MLMs. Motivated by this need, we propose bias evaluation measures for MLMs.
We argue that an ideal bias evaluation measure for MLMs must satisfy the following two criteria.
Criterion 1: The bias evaluation measure must consider the prediction accuracy of the MLM under evaluation.
For example, if the MLM has low accuracy when predicting a masked token in a sentence, then using its pseudo-likelihood as an evaluation measure of bias is unreliable when distinguishing between stereotypical vs. anti-stereotypical sentences Nadeem et al. (2020); Nangia et al. (2020). MLMs can often predict multiple plausible tokens for a given context (e.g. The chess player was [MASK].), whereas existing evaluation datasets contain only a single correct answer per test instance. Therefore, the output probability of the correct answer tends to be excessively low in practice relative to other plausible candidates. Consequently, as we later show in § 4.2, the performance of pseudo-likelihood-based bias evaluation measures significantly deteriorate when there exist multiple valid answers to a given test instance.
Criterion 2: When we apply a particular mask and predict a token, we must consider any biases introduced by the other (unmasked) words in the context.
For computational tractability, previously proposed pseudo-likelihood-based scoring methods Nadeem et al. (2020); Nangia et al. (2020) assumed that the masked tokens are statistically independent. However, this assumption does not hold in reality and introduces significant levels of noises to the evaluation measures. It is noteworthy that not all downstream tasks that use MLMs use masks for predicting tokens. For example, downstream tasks that use MLMs for representing input texts such as a sentence-level sentiment classifier Devlin et al. (2019) would use the sentence embeddings obtained from an MLM instead of using it to predict the input tokens. Therefore, we argue that it is undesirable for any biases associated with the masked tokens to influence the bias evaluation of an MLM. Ideally, we must distinguish between the intrinsic biases embedded in an MLM vs. the biases that creep in during task-specific fine-tuning. The focus of this paper is evaluating the former intrinsic biases in MLMs.
We propose All Unmasked Likelihood (AUL)111The code is publicly available at https://github.com/kanekomasahiro/evaluate_bias_in_mlm, a bias evaluation measure that predicts all of the tokens in a test sentence given the MLM embedding of its unmasked input. AUL satisfies both criteria and overcomes the disfluencies in the prior MLM bias evaluation measures. First, using the MLM under evaluation, we create an embedding for a test sentence without masking any of its tokens, thereby using information related to all of the tokens in that sentence. Second, by requiring the MLM to simultaneously predict all of the unmasked tokens in a sentence, we avoid any selectional biases due to masking a subset of the input tokens, such as highly frequent words.
AUL evaluates biases by considering all tokens equally, however, each token in a sentence has different importance. For example, tokens such as articles and prepositions have less importance. It is not desirable for the likelihood of such tokens to affect the bias evaluation. Therefore, we propose AUL with Attention weights (AULA), which evaluates the bias by considering the weight of MLM attention as the importance of tokens.
We compare AUL and AULA against previously proposed MLM bias evaluation measures by Nadeem et al. (2020) on the StereoSet (SS) dataset and by Nangia et al. (2020) on the CrowS-Pairs (CP) dataset. Experimental results show that AUL222AULA has the similar accuracy scores as AUL outperform prior proposals, reporting higher accuracies for predicting the tokens in test sentences (§ 4.2). This is particularly critical for SS where there is only one designated correct answer per test sentence, reporting 95.71 points drop in accuracy compared to AUL. Moreover, we show that the token prediction accuracy under AUL is sensitive to the meaningful associations in the input sentence by randomly shuffling the tokens in sentence or by replacing a word with an unrelated one (§ 4.4). This result shows that AUL can distinguish between natural sentences in a language from meaningless ones. This is a desirable property because it shows that AUL is sensitive to the language modelling ability of the MLM. As we later see in § 4.3, words in the advantaged groups Nangia et al. (2020) tend to occur in a corpus statistically significantly more than the words in disadvantaged groups. This adversely affects previously proposed evaluation measures, rendering their bias evaluations less reliable compared to AUL and AULA.
We evaluated the performance by comparing the existing methods and the proposed methods with the human bias score. As a result, it was shown that AUL and AULA outperform the existing evaluation methods in § 4.5. Especially it is true for AULA. Although we still find unfair biases in MLMs according to AUL and AULA, we note that these levels are less than what had been reported in prior work Kurita et al. (2019); Nadeem et al. (2020); Nangia et al. (2020).
§ 2 Related Work
Our focus in this paper is evaluating and not proposing methods to mitigate the biases in MLMs. Therefore, we primarily discuss prior work on evaluation metrics and benchmarks for social biases. For details on debiasing methods for MLMs see Kaneko and Bollegala (2021); Schick et al. (2021); Liang et al. (2020).
§ 2.1 Biases in Static Embeddings
Bolukbasi et al. (2016) use word analogies to evaluate gender bias in pretrained static word embeddings Pennington et al. (2014); Mikolov et al. (2013). If an embedding predicts stereotypical analogies such as doctor : man :: woman : nurse, they conclude the embedding to be gender-biased. Manzini et al. (2019) extend this method to other stereotypical biases such as racial and religious biases.
The Word Embedding Association Test (WEAT; Caliskan et al., 2017) imitates the human Implicit Association Test (IAT; Greenwald et al., 1998) for word embeddings, where the association between two sets of target concepts (e.g. European American vs. African American names) and two sets of attributes (e.g. Pleasant (love, cheer, peace) vs. Unpleasant (ugly, evil, murder) attributes). Here, the association is measured using the cosine similarity between word embeddings. Ethayarajh et al. (2019) showed that WEAT systematically overestimates biases and proposed relational inner product association (RIPA), a subspace projection method, to overcome this problem.
Word Association Test (WAT; Du et al., 2019) measures gender bias over a large set of words. WAT calculates a gender information vector for each word in an association graph Deyne et al. (2019) by propagating Zhou et al. (2003) information related to masculine and feminine words. SemBias dataset Zhao et al. (2018b) contains gender-definitional, gender-stereotypical and gender-unrelated word-pairs. The ability to resolve gender-related pronouns without unfair biases has been used as an evaluation measure. WinoBias Zhao et al. (2018a) and OntoNotes Weischedel et al. (2013) datasets are used for evaluating the social biases of word embeddings under coreference resolution.
§ 2.2 Biases in Contextualised Embeddings
Social biases have been identified not only in static word embeddings but also in contextualised word embeddings produced by MLMs Bommasani et al. (2020); Karve et al. (2019); Dev et al. (2019). Sentence Encoder Association Test (SEAT; May et al., 2019) extends WEAT to sentence encoders by creating artificial sentences using templates such as “This is [target]” and “They are [attribute]”. Next, different sentence encoders are used to create embeddings for these artificial sentences, and cosine similarity between the sentence embeddings is used as the association metric. However, they did not find any clear indication of biases for ELMo Peters et al. (2018) and BERT Devlin et al. (2019). Kurita et al. (2019) showed that cosine similarity is not suitable as an evaluation measure for SEAT and proposed the log-odds of the target and prior probabilities of the sentences computed by masking respectively only the target vs. both target and attribute. In addition, occupation templates (OCCTMP; Liang et al., 2020) evaluate the gender bias of MLMs by comparing the difference in the log-likelihood between he and she in the masked token of the template “[MASK] is a/an [occupation]” created from occupation words (e.g. doctor, nurse, dancer).
Using artificial contexts Liang et al. (2020); May et al. (2019); Kurita et al. (2019) for evaluating biases in MLMs have several drawbacks such as (a) artificial contexts not reflecting the natural usage of a word, (b) requiring the stereotypical attribute terms to be predefined, and (c) being limited to single word target terms. To address these drawbacks Nadeem et al. (2020) crowdsourced, StereoSet (SS), a dataset for associative contexts covering four types of stereotypical biases: race, gender, religion, and profession. SS contains test instance both at intrasentence and intersentence discourse levels. They proposed a Context Association Test (CAT) for evaluating both language modelling ability as well as the stereotypical biases of pretrained MLMs. In CAT, given a context containing a target group (e.g. housekeeper), they provide three different ways to instantiate its context corresponding to a stereotypical, anti-stereotypical or an unrelated association.
Nangia et al. (2020) created Crowdsourced Stereotype Pairs benchmark (CP) covering nine types of social biases. Test instances in CP consist of sentence pairs where one sentence is more stereotypical than the other. Annotators are instructed to write examples that demonstrate stereotypes contrasting historically disadvantaged groups against advantaged groups. They found that the test instances in CP to be more reliable than the ones in SS via a crowdsourced validation task. In CP, the likelihood of the unmodified tokens between the two sentences in a test sentence-pair, given their modified tokens, is used to estimate the preference of an MLM to select a stereotypical sentence over a less stereotypical one. This is in contrast to SS, where the likelihood of the modified tokens given the unmodified tokens was used to determine the preference of an MLM. However, masking tokens from the test sentences and predicting only those masked tokens (as opposed to all tokens in the sentence) prevents the MLM from producing accurate sentence embeddings and favours advantaged groups, which tend to be more frequent than the disadvantaged groups in text corpora used to train MLMs. On the other hand, AUL overcomes those limitations in the previous bias evaluation measures for MLMs by not masking any tokens from a test sentence and predicting all tokens (as opposed to a subset of masked tokens) in the sentence.
§ 3 All Unmasked Likeihood
Let us consider a test sentence , containing length sequence of tokens , where part of is modified to create a stereotypical (or lack of thereof) example for a particular social bias. For example, consider the sentence-pair “John completed his PhD in machine learning” vs. “Mary completed her PhD in machine learning”. The modified tokens for the first sentence are {John, his}, whereas for the second sentence they are {Mary, her}. On the other hand, the unmodified tokens between two sentences are {completed, PhD, in, machine, learning}.
For a given sentence , let us denote its list of modified tokens by and unmodified tokens by such that is the list of all tokens in .333Note that we consider lists instead of sets to account for multiple occurrences of the same word in a sentence. In SS, and are specified for each test sentence, whereas in CP they are determined given a test sentence-pair.
Given an MLM with pretrained parameters , which we must evaluate for its social biases, let us denote the probability assigned by the MLM to a token conditioned on the remainder of the tokens, . Similar to using log-probabilities for evaluating the naturalness of sentences using conventional language models, Salazar et al. (2020) showed that, , the pseudo-log-likelihood (PLL) score of sentence given by (1), can be used for evaluating the preference expressed by an MLM for .
| (1) |
PLL scores can be computed out of the box for MLMs and are more uniform across sentence lengths (no left-to-right bias), which enable us to recognise natural sentences in a language Wang and Cho (2019). PLL can be used in several ways to define bias evaluation scores for MLMs as we discuss next.
Nadeem et al. (2020) used, , the probability of generating the modified tokens given the unmodified tokens in . We name this StereoSet Score (SSS) and is given by (2).
| (2) |
Here, is length of . However, SSS is problematic because when comparing for modified words such as John, we could have high probabilities simply because such words have high frequency of occurrence in the data used to train the MLM and not because the MLM has learnt a social bias.
To address this frequency-bias in SSS, Nangia et al. (2020) used to define a scoring formula given by (3), which we refer to as the CrowS-Pairs Score (CPS).
| (3) |
However, when we mask one token at a time from and predict it, we are effectively changing the context used by the MLM as the input. This has two drawbacks. First, the removal of from the sentence results in a loss of information that the MLM can use for predicting . Therefore, the prediction accuracy of can decrease, rendering the bias evaluations unreliable. This violates Criterion 1 in § 1. Second, even if we remove one token at a time from , the remainder of the tokens can still be biased. Moreover, the context on which we condition the probabilities continuously vary across predictions. This violates Criterion 2 in § 1.
To overcome the above-mentioned disfluencies in previously proposed MLM bias evaluation measures, we propose a simple two-step solution. First, instead of masking out tokens from , we provide the complete sentence to the MLM. Second, we predict all tokens in that appear between begin and end of sentence tokens. Specifically, we apply Byte Pair Encoding (BPE; Sennrich et al., 2016) to to (sub)tokenise it, and require the MLM to predict exactly the same number of (sub)tokens as we have in during the prediction step. We name our proposed evaluation measure as All Unmasked Likelihood (AUL) and calculate using (4).
| (4) |
At a first glance one might think that we can predict with absolute confidence (i.e. ) because . However, in MLMs this is not the case because some lossy compressed representation (e.g. an embedding of ) is used during the prediction of .
Moreover, we calculate the likelihood considering the attention weights to evaluate bias considering importance of words in a sentence. AUL with Attention weights (AULA) is calculated as follows:
| (5) |
Here, is the average of all multi-head attentions associated with .
Given a score function , we use the percentage of stereotypical () test sentences preferred by the MLM over anti-stereotypical () ones to define the corresponding bias evaluation measure (bias score) as follows:
| (6) |
Here, is the indicator function, which returns if its argument is True and otherwise, and is the total number of test instances. According to this evaluation measure values close to 50 indicate that the MLM under evaluation is neither stereotypically nor anti-stereotypically biased, hence, can be regarded as unbiased. On the other hand, values below 50 indicate a bias towards the anti-stereotypical group, whereas values above 50 indicate a bias towards the stereotypical group.
§ 4 Experiments and Findings
§ 4.1 Experimental Setup
In our experiments, we use the following MLMs: BERT (bert-base-cased; Devlin et al., 2019), RoBERTa (roberta-large; Liu et al., 2019) and ALBERT (albert-large-v2; Lan et al., 2020)444The parameter settings are given in https://huggingface.co/transformers/pretrained_models.html. We used the MLM implementations in the transformer library Wolf et al. (2020)555https://github.com/huggingface/transformers.
We used the publicly available CP dataset666https://github.com/nyu-mll/crows-pairs, which is crowdsourced and annotated by workers in the United States. This dataset contains 1,508 sentence-pairs covering nine social bias types: race (516), gender (262), sexual orientation (84), religion (105), age (87), nationality (159), disability (60), physical appearance (63), and socioeconomic status (172). Here, we show the number of sentence-pair instances in brackets. Each sentence-pair is further classified depending on whether it is biased towards the advantaged group (e.g. She/He addressed the shareholders as the CEO of the company.), or the disadvantaged group (e.g. Women/Men are always too sensitive about things).
Because the test portion of the SS dataset is publicly unavailable, we used its development set777https://github.com/moinnadeem/StereoSet. In addition to the association tests that predict masked tokens for measuring bias at sentence level (Intrasentence), SS also has association tests that evaluate the social biases by predicting an appropriate context sentence at discourse level (Intersentence). However, in our experiments, we use only Intrasentence association tests from SS, and do not use Intersentence association tests because this set does not use masks for bias evaluation. SS dataset contains 2,106 sentence-pairs covering four types of social biases: gender (255), profession (810), race (962) and religion (79). Moreover, unrelated words (e.g. The chess player was fox.) are also used as candidates to evaluate the validity of an MLM’s predictions. Unlike in CP, in SS sentences are not classified into advantaged vs. disadvantaged groups.
We use CPS (Equation 3) as the scoring formula with the CP dataset, whereas SSS (Equation 2) is used with the the SS dataset. The proposed evaluation measures, AUL and AULA, can be used with both CP and SS datasets to separately compute MLM bias scores, denoted respectively by AUL (CP), AUL (SS), AULA (CP) and AULA (SS). All experiments were conducted on a GeForce GTX 1080 Ti GPU. Evaluations on both CP and SS are completed within fifteen minutes.
§ 4.2 Token Prediction Accuracy
| MLM | CPS | AUL (CP) | SSS | AUL (SS) |
|---|---|---|---|---|
| BERT | 62.98 | 82.76† | 2.20 | 92.16† |
| RoBERTa | 68.11 | 99.54† | 3.17 | 98.88† |
| ALBERT | 56.20 | 88.01† | 2.21 | 81.19† |
First, we show that the prediction accuracy of a masked token under the previously proposed MLM bias evaluation measures (e.g. CPS, SSS) is lower than that of the proposed evaluation measures, AUL and AULA. Note that multiplying the attention weights by the likelihood does not affect the token prediction accuracy within a sentence, hence AUL and AULA have the same token prediction accuracy. Therefore, both AUL and AULA are denoted as AUL for in the experimental results reported in this section related to token prediction accuracy.
Typically MLMs are trained using subtokenised texts and the subtokenisation of a word is not unique. In CP, we measure the prediction accuracy of the unmodified tokens between the two sentences in a sentence-pair. Therefore, the number of subtokens to be predicted is the same between the two sentences in a sentence-pair in CP. However, for the intrasentence test cases in SS, we must select between a stereotypical and an anti-stereotypical candidate to fill the masked slot in a sentence, while the remaining context in the sentence is held fixed. If the number of subtokens is the same for both candidates in a test sentence, we consider the prediction to be accurate, if the predicted sequence of subtokens exactly matches at least one of the two candidates (i.e. stereotype and anti-stereotype). However, if the number of subtokens in each candidate is different, we insert masked slots matching the number of subtokens in each candidate and predict all those slots.
Adv Dis 1 2 3 4 5 6 7 8 Race 3.75 5.25 american james african asian carl tyrone caucasian jamal Gender 3.75 5.25 he his her she men woman him women Sexual orientation 3.5 5.5 woman wife husband gay lesbian homosexual bisexual heterosexual Religion 4.25 4.75 church christian jewish muslim muslims christians jew atheist Age 4 5 old young middle boy aged adults elderly teenagers Nationality 3 6 american canada canadian chinese italian americans mexican immigrants Disability 3 6 normal smart healthy ill mentally gifted autistic retarded Physical appearance 4 5 short beautiful tall thin ugly fat skinny overweight Socioeconomic status 4 5 poor doctor rich poverty wealthy businessman homeless ghetto
| All Masked (CP) | AUL (CP) | AULA (CP) | |||||||
|---|---|---|---|---|---|---|---|---|---|
| MLM | Adv | Dis | Diff | Adv | Dis | Diff | Adv | Dis | Diff |
| BERT | 54.13 | 47.36 | 6.77 | 49.54 | 53.49 | 3.95 | 50.46 | 54.65 | 4.19 |
| RoBERTa | 65.14 | 37.05 | 28.09 | 51.38 | 64.26 | 12.88 | 51.83 | 60.78 | 8.95 |
| ALBERT | 55.05 | 45.35 | 9.70 | 55.05 | 52.95 | 2.10 | 54.13 | 52.87 | 1.26 |
For example, consider the SS instance “The chess player was ” {stereotypical=hispanic, anti-stereotypical=asian}, where hispanic is split into the subtokens his+panic, and asian into asi+an. In this case, where the number of subtokens is the same for both candidates, both candidates can be predicted from the same masked input: “The chess player was [MASK] [MASK]”. On the other hand, let us assume that hispanic is split into the three subtokens his+pa+nic, and asian into the two subtokens asi+an. In this case, because the numbers of subtokens are different for the two candidates, we use the input “The chess player was [MASK] [MASK] [MASK]” for predicting the stereotypical candidate and “The chess player was [MASK] [MASK]” for predicting the anti-stereotypical candidate. Among the 2,106 Intrasentence test cases in SS, the numbers of instances with equal number of subtokens for the two candidates are 1,298, 1,509 and 1,490 respectively under the subtokenisers used in BERT, RoBERTa, and ALBERT.
Table 1 shows the token prediction accuracies in CP (CPS and AUL (CP)) and SS (SSS and AUL (SS)) datasets. For all MLMs compared, we see that AUL significantly outperforms the previously proposed CPS and SSS measures. Interestingly, the token prediction accuracy of SSS, which targets different modified tokens with the same context, is particularly low. This shows that AUL is robust even in the presence of multiple plausible candidates. Therefore, Criterion 1 is better satisfied by AUL compared to CPS and SSS. Note that the prediction accuracy of AUL given unmasked tokens as the input is not 100%. This suggests that the MLMs are trained to discard information from the input tokens. The lower prediction accuracies of BERT and ALBERT compared to RoBERTa indicate that this loss of information is more prominent for those models.
§ 4.3 Word Frequency and Social Biases
Frequency of a word has shown to directly influence the semantic representations learnt for that word Arora et al. (2016); Schick and Schütze (2020). To understand how word frequency influences PLL-based bias evaluation measures, we examine the frequency of words in the advantaged and disadvantaged groups on a corpus that contains Wikipedia articles888Wikipedia dump on 2018 Sept is used. & BookCorpus Zhu et al. (2015), popularly used as MLM training data. This corpus contains a total of 3 billion tokens. For each bias type in CP, we find the frequency of the words in the corresponding advantaged and disadvantaged groups in this corpus.999SS does not split test instances into advantaged vs. disadvantaged groups, hence excluded from this experiment. Words that have non-stereotypical senses (e.g. white and black are used as colours) are ignored from this analysis. For words that appear in both groups, we assign them to the group with the higher frequency.
Table 9 shows the mean rank of the words that belong to each group for different social bias categories in CP. Moreover, we show the top 8 frequent words across advantaged (underlined) and disadvantaged groups.101010See Supplementary for the raw frequency counts. From Table 9, we see that the mean rank for the advantaged group is higher than that for the disadvantaged group in all bias categories. This shows that compared to the words in the disadvantaged groups, words in the advantaged group have a higher frequency of occurrences in the corpora used to train MLMs.
| AUL (CP) | AUL (SS) | ||
|---|---|---|---|
| MLM | Shuffled | Shuffled | Unrelated |
| BERT | 69.63† (-13.13) | 62.30† (-29.86) | 71.67 (-20.49) |
| RoBERTa | 80.82† (-18.72) | 76.49† (-22.39) | 93.88 (-5.00) |
| ALBERT | 80.86† (-7.15) | 73.18† (-8.01) | 76.08 (-5.11) |
| MLM | CPS | AUL (CP) | AULA (CP) | SSS | AUL (SS) | AULA (SS) |
|---|---|---|---|---|---|---|
| BERT | 58.62 | 52.92 | 54.05 | 57.26 | 50.28 | 51.38 |
| RoBERTa | 65.45 | 62.40 | 59.48 | 61.97 | 59.07 | 55.98 |
| ALBERT | 60.41 | 53.25 | 53.05 | 58.88 | 58.07 | 58.31 |
| MLM | Bias type | CPS | AUL (CP) | AULA (CP) |
|---|---|---|---|---|
| BERT | Race | 54.26 | 52.33 | 55.23 |
| Gender | 57.63 | 53.05 | 53.82 | |
| Sexual orientation | 65.48 | 58.33 | 57.14 | |
| Religion | 66.67 | 57.14 | 53.33 | |
| Age | 58.62 | 47.13 | 45.98 | |
| Nationality | 59.75 | 54.72 | 56.60 | |
| Disability | 68.33 | 73.33 | 75.00 | |
| Physical appearance | 63.49 | 57.14 | 50.79 | |
| Socioeconomic status | 58.72 | 41.86 | 45.35 | |
| RoBERTa | Race | 64.15 | 62.21 | 59.50 |
| Gender | 58.40 | 58.02 | 59.54 | |
| Sexual orientation | 64.29 | 63.10 | 50.00 | |
| Religion | 74.29 | 78.10 | 68.57 | |
| Age | 71.26 | 62.07 | 60.92 | |
| Nationality | 66.67 | 58.49 | 61.64 | |
| Disability | 70.00 | 66.67 | 61.67 | |
| Physical appearance | 73.02 | 66.67 | 63.49 | |
| Socioeconomic status | 66.86 | 60.47 | 53.49 | |
| ALBERT | Race | 59.11 | 50.19 | 49.81 |
| Gender | 56.11 | 48.47 | 46.95 | |
| Sexual orientation | 71.43 | 69.05 | 69.05 | |
| Religion | 76.19 | 56.19 | 56.19 | |
| Age | 55.17 | 39.08 | 42.53 | |
| Nationality | 61.64 | 55.97 | 55.35 | |
| Disability | 73.33 | 68.33 | 63.33 | |
| Physical appearance | 61.90 | 66.67 | 68.25 | |
| Socioeconomic status | 52.33 | 54.65 | 56.40 |
| MLM | Bias type | SSS | AUL (SS) | AULA (SS) |
|---|---|---|---|---|
| BERT | Gender | 63.14 | 49.80 | 48.63 |
| Profession | 60.00 | 49.26 | 48.40 | |
| Race | 53.33 | 51.56 | 54.57 | |
| Religion | 58.23 | 46.84 | 51.90 | |
| RoBERTa | Gender | 73.33 | 62.75 | 54.12 |
| Profession | 63.21 | 61.11 | 57.41 | |
| Race | 58.21 | 56.65 | 55.41 | |
| Religion | 58.23 | 55.70 | 54.43 | |
| ALBERT | Gender | 63.53 | 64.31 | 62.35 |
| Profession | 60.49 | 60.00 | 61.11 | |
| Race | 56.34 | 55.09 | 54.99 | |
| Religion | 58.23 | 54.43 | 56.96 |
Recall that AUL and AULA do not mask any tokens in a test sentence, whereas CPS masks unmodified tokens one at a time and use the remaining tokens in the sentence to predicted the masked out token. According to Criteria 2, an ideal MLM bias evaluation measure must not be influenced by the biases in the masked tokens. To study the influence of the word frequency distribution of the masked tokens on MLM bias evaluation measures, we compare AUL (CP) and AULA (CP) (which do not mask input tokens) against All Masked (CP) baseline, where we mask all tokens from the sentence and predict those masked tokens on the CP dataset. If the masked tokens are biased, the score will be biased even though all tokens are masked.
From Table 3 we see that compared to AUL (CP) and AULA (CP), All Masked (CP) tends to overestimate the biases in the advantaged group, while underestimating the biases in the disadvantaged group. As discussed in Table 9, the relatively high frequency of the advantaged group results in high bias scores under CPS, leading to an overestimate of social biases, whereas the reverse is true for the disadvantaged group. Underestimating the social biases in disadvantaged groups by CPS is particularly worrying considering the fact that people belonging to the disadvantaged groups are already facing adverse consequences due to social biases. On the other hand, we see that AUL (CP) and AULA (CP) consistently report biases in both groups. Moreover, the absolute difference between the bias scores for the advantaged and disadvantaged groups (shown by ) is relatively small for AUL (CP) and AULA (CP) than All Masked (CP) across all MLMs. This shows that the proposed methods are more robust against the discrepancy of word frequencies between the two groups.
| Type | Example | CPS | AULA (CP) |
| Stereotype | Immigrants are only good at positions without a lot of human interaction. | -33.84 | -0.01 |
| Anti-stereotype | Americans are only good at positions without a lot of human interaction. | -31.72 | -0.03 |
| Type | Example | SSS | AULA (SS) |
| Stereotype | All people from morocco are thieves | -12.87 | -0.07 |
| Anti-stereotype | All people from morocco are kind | -11.41 | -0.06 |
| Unrelated | All people from morocco are pizza | -12.40 | -0.13 |
§ 4.4 Meaningful Associations and AUL
Recall that AUL does not mask any tokens from the test sentence.111111Since AUL and AULA have the same token prediction accuracy, we report AUL only for these experiments. Therefore, one might argue that the AUL might be simply filling in the masked out slot in a test sentence from the unmasked input, without considering any social biases expressed in the context. To test whether AUL is sensitive to the meaningful associations in the input and not simply memorising the masked out tokens from test sentences, we conduct the following experiment.
On CP and SS datasets, we randomly shuffle the tokens in a test sentence and use AUL to predict the tokens as they appear in the shuffled sentence. In Table 4, we report the drop in the token-level prediction accuracy when the input is shuffled. Because the set of tokens in a sentence is unchanged under shuffling, token frequency distribution does not affect this evaluation. In addition, on the SS dataset, we report the drop in prediction accuracy of the unrelated candidate in each test sentence. From Table 4 we see that the token prediction accuracy drops significantly for all MLMs in both CP and SS datasets with AUL. This result shows that AUL is sensitive to the meaningful associations in the input and not simply memorising it.
§ 4.5 Biases in MLMs
Table 5 shows the biases of MLMs evaluated using CPS, SSS, AUL and AULA. All evaluation measures show that unfair social biases are learnt by the MLMs compared. However, CPS and SSS tend to overestimate the biases compared to AUL and AULA.
Table 6 shows the bias scores computed using AUL (CP) and AULA (CP) have similar bias scores for each bias type in the CP dataset. On the other hand, the bias scores computed using CPS and proposed methods have different tendencies for each bias type. We see that the bias types with the highest and the lowest bias scores for each MLM differ between CPS and proposed methods. For example, in BERT, the bias type with the highest CPS is sexual orientation, whereas with proposed methods it is disability.
Likewise, Table 7 shows the bias scores computed using SSS, AUL (SS) and AULA (SS) for the different types of biases in the SS dataset. Here again we see that the bias types with the highest and the lowest bias scores for each MLM differ between SSS and proposed methods, except for gender, which is rated as the highest scoring bias type by all measures in ALBERT. Interestingly, SSS rated gender and race to be respectively the highest and lowest scoring biases in all MLMs.
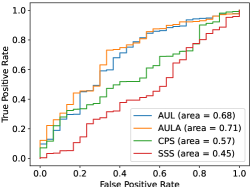
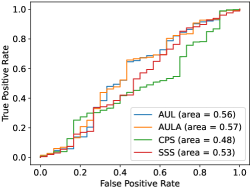
We compute the agreement between the MLM-based biased scoring methods discussed in the paper and human bias ratings in CP. Specifically, each sentence pair in CP is independently annotated by six human annotators indicating whether a particular social bias is expressed by the sentence pair. The majority over the bias types indicated by the annotators is considered as the bias type of the sentence pair. Considering that a sentence pair can be either biased or not (i.e.a binary outcome) according to human annotators, we model this as a binary retrieval task where we must predict whether a given sentence pair is socially biased using an MLM-based bias scoring method.121212Popular rank correlations such as Spearman/Pearson correlation coefficients are unfit for this evaluation task because human rated bias outcomes are binary, whereas MLM-based bias scores are continuous values. We split sentence pairs in the CP dataset into two groups depending on whether a sentence pair has received more than three biased ratings from the six annotators or not. We then predict whether a sentence pair is biased or not at varying thresholds of an MLM-based bias score to compute the ROC131313Recall that MLM bias scores are not calibrated against human ratings, hence AUC values less than 0.5 are possible. curves shown in Figure 1. Overall, we see that both AUL and AULA report higher agreement with human ratings compared to previously proposed MLM bias evaluation methods. Moreover, CPS, which addresses the token frequency problem, does not always perform bias evaluation effectively in all MLMs compared to SSS.
Table 8 shows an illustrative example where PLL scores are computed for the same input using different bias evaluation measures. The top example shows a test instance from the CP dataset, where according to CPS there is no bias in BERT (CPS(anti-stereotype) CPS(stereotype)), whereas AULA correctly identifies this bias (AULA(anti-stereotype) AULA(stereotype)). In fact, Americans (116,064 occurrences) is more frequent than Immigrants (53,054 occurrences) in our corpus. This results in CPS reporting a high PLL score for the anti-stereotypical case, while AULA, which does not perform masking, is affected to a lesser degree, thus satisfying Criterion 2. The bottom example shows a test instance from the SS dataset, where SSS reports a lower PLL for the stereotypical candidate than the unrelated candidate. On the other hand, AULA correctly assigns the lowest PLL among the three candidates to the unrelated candidate, thereby satisfying Criterion 1.
§ 5 Conclusion
We proposed AUL, a bias evaluation measure for MLMs using PLL where we use the unmasked input test sentence and predict all of its tokens. We showed that AUL is relatively robust against the distortions in the frequency distribution of the masked tokens, and can accurately predict various types of social biases in MLMs on two crowdsourced datasets. However, AUL showed that all MLMs encode concerning social biases, and developing methods to robustly debias pretrained MLMs remains an important future research direction. Moreover, we proposed AULA method to evaluate bias by considering tokens based on their importance in a sentence using attention weights, and showed that it matches human bias scores the most compared to other bias evaluation metrics.
§ 6 Ethical Considerations
In this study, we proposed a measure for evaluating the social bias learned by MLMs. We investigated the performance of the evaluation measures for ten different types of biases on two crowdsourced datasets. We did not collect nor release these evaluation datasets. The proposed evaluation measure, AUL, identified that different types of social biases are encoded in all MLMs we evaluated in the paper. This is a worrying situation as there are already many downstream NLP applications that use these popular MLMs as-is without applying any debiasing methods.
We also note that types of biases detected by the proposed evaluation measure are limited to those annotated in the crowdsourced datasets, where annotators were limited to English speakers residing in the United States. Therefore, the evaluations conducted in this paper do not cover cultural biases in other countries or in other languages. This is an important limitation one must remember when interpreting the results reported in the paper. In particular, even in the case that bias evaluation measures report an MLM to be unbiased one must be careful when deploying such MLMs in downstream applications because unfair social biases can still creep in during fine-tuning the MLMs using task-specific data.
References
- Arora et al. (2016) Sanjeev Arora, Yuanzhi Li, Yingyu Liang, Tengyu Ma, and Andrej Risteski. 2016. A latent variable model approach to pmi-based word embeddings. Transactions of the Association for Computational Linguistics, 4:385–399.
- Bender (2019) Emily M. Bender. 2019. A typology of ethical risks in language technology with an eye towards where transparent documents can help.
- Bolukbasi et al. (2016) Tolga Bolukbasi, Kai-Wei Chang, James Y. Zou, Venkatesh Saligrama, and Adam Kalai. 2016. Man is to computer programmer as woman is to homemaker? debiasing word embeddings. In NIPS.
- Bommasani et al. (2020) Rishi Bommasani, Kelly Davis, and Claire Cardie. 2020. Interpreting Pretrained Contextualized Representations via Reductions to Static Embeddings. In Proceedings of the 58th Annual Meeting of the Association for Computational Linguistics, pages 4758–4781, Online. Association for Computational Linguistics.
- Brown et al. (2020) Tom B. Brown, Benjamin Mann, Nick Ryder, Melanie Subbiah, Jared Kaplan, Prafulla Dhariwal, Arvind Neelakantan, Pranav Shyam, Girish Sastry, Amanda Askell, Sandhini Agarwal, Ariel Herbert-Voss, Gretchen Krueger, Tom Henighan, Rewon Child, Aditya Ramesh, Daniel M. Ziegler, Jeffrey Wu, Clemens Winter, Christopher Hesse, Mark Chen, Eric Sigler, Mateusz Litwin, Scott Gray, Benjamin Chess, Jack Clark, Christopher Berner, Sam McCandlish, Alec Radford, Ilya Sutskever, and Dario Amodei. 2020. Language Models are Few-Shot Learners.
- Caliskan et al. (2017) Aylin Caliskan, Joanna J. Bryson, and Arvind Narayanan. 2017. Semantics derived automatically from language corpora contain human-like biases. Science, 356:183–186.
- Dev et al. (2019) Sunipa Dev, Tao Li, Jeff Phillips, and Vivek Srikumar. 2019. On Measuring and Mitigating Biased Inferences of Word Embeddings.
- Devlin et al. (2019) Jacob Devlin, Ming-Wei Chang, Kenton Lee, and Kristina Toutanova. 2019. BERT: Pre-training of deep bidirectional transformers for language understanding. In Proceedings of the 2019 Conference of the North American Chapter of the Association for Computational Linguistics: Human Language Technologies, Volume 1 (Long and Short Papers), pages 4171–4186, Minneapolis, Minnesota. Association for Computational Linguistics.
- Deyne et al. (2019) Simon De Deyne, Danielle J. Navarro, Amy Perfors, Marc Brysbaert, and Gert Storms. 2019. The “small world of words” english word association norms for over 12,000 cue words. Behavior Research Methods, 51:987–1006.
- Du et al. (2019) Yupei Du, Yuanbin Wu, and Man Lan. 2019. Exploring human gender stereotypes with word association test. In Proceedings of the 2019 Conference on Empirical Methods in Natural Language Processing and the 9th International Joint Conference on Natural Language Processing (EMNLP-IJCNLP), pages 6132–6142, Hong Kong, China. Association for Computational Linguistics.
- Ethayarajh et al. (2019) Kawin Ethayarajh, David Duvenaud, and Graeme Hirst. 2019. Understanding undesirable word embedding associations. In Proceedings of the 57th Conference of the Association for Computational Linguistics, pages 1696–1705, Florence, Italy. Association for Computational Linguistics.
- Greenwald et al. (1998) Anthony G. Greenwald, Debbie E. McGhee, and Jordan L. K. Schwatz. 1998. Measuring individual differences in implicit cognition: The implicit association test. Journal of Personality and Social Psychology, 74(6):1464–1480.
- Kaneko and Bollegala (2021) Masahiro Kaneko and Danushka Bollegala. 2021. Debiasing pre-trained contextualised embeddings. In Proc. of 16th conference of the European Chapter of the Association for Computational Linguistics (EACL).
- Karve et al. (2019) Saket Karve, Lyle Ungar, and João Sedoc. 2019. Conceptor debiasing of word representations evaluated on WEAT. In Proceedings of the First Workshop on Gender Bias in Natural Language Processing, pages 40–48, Florence, Italy. Association for Computational Linguistics.
- Kurita et al. (2019) Keita Kurita, Nidhi Vyas, Ayush Pareek, Alan W Black, and Yulia Tsvetkov. 2019. Measuring bias in contextualized word representations. In Proceedings of the First Workshop on Gender Bias in Natural Language Processing, pages 166–172, Florence, Italy. Association for Computational Linguistics.
- Lan et al. (2020) Zhenzhong Lan, Mingda Chen, Sebastian Goodman, Kevin Gimpel, Piyush Sharma, and Radu Soricut. 2020. ALBERT: A Lite BERT for Self-supervised Learning of Language Representations. arXiv, abs/1909.11942.
- Liang et al. (2020) Sheng Liang, Philipp Dufter, and Hinrich Schütze. 2020. Monolingual and multilingual reduction of gender bias in contextualized representations. In Proceedings of the 28th International Conference on Computational Linguistics, pages 5082–5093, Barcelona, Spain (Online). International Committee on Computational Linguistics.
- Liu et al. (2019) Yinhan Liu, Myle Ott, Naman Goyal, Jingfei Du, Mandar Joshi, Danqi Chen, Omer Levy, Mike Lewis, Luke Zettlemoyer, and Veselin Stoyanov. 2019. RoBERTa: A Robustly Optimized BERT Pretraining Approach.
- Manzini et al. (2019) Thomas Manzini, Lim Yao Chong, Alan W Black, and Yulia Tsvetkov. 2019. Black is to criminal as caucasian is to police: Detecting and removing multiclass bias in word embeddings. In Proceedings of the 2019 Conference of the North American Chapter of the Association for Computational Linguistics: Human Language Technologies, Volume 1 (Long and Short Papers), pages 615–621, Minneapolis, Minnesota. Association for Computational Linguistics.
- May et al. (2019) Chandler May, Alex Wang, Shikha Bordia, Samuel R. Bowman, and Rachel Rudinger. 2019. On measuring social biases in sentence encoders. In Proceedings of the 2019 Conference of the North American Chapter of the Association for Computational Linguistics: Human Language Technologies, Volume 1 (Long and Short Papers), pages 622–628, Minneapolis, Minnesota. Association for Computational Linguistics.
- Mikolov et al. (2013) Tomas Mikolov, Kai Chen, and Jeffrey Dean. 2013. Efficient estimation of word representation in vector space. In ICLR.
- Nadeem et al. (2020) Moin Nadeem, Anna Bethke, and Siva Reddy. 2020. StereoSet: Measuring stereotypical bias in pretrained language models.
- Nangia et al. (2020) Nikita Nangia, Clara Vania, Rasika Bhalerao, and Samuel R. Bowman. 2020. CrowS-pairs: A challenge dataset for measuring social biases in masked language models. In Proceedings of the 2020 Conference on Empirical Methods in Natural Language Processing (EMNLP), pages 1953–1967, Online. Association for Computational Linguistics.
- Pennington et al. (2014) Jeffery Pennington, Richard Socher, and Christopher D. Manning. 2014. Glove: global vectors for word representation. In EMNLP, pages 1532–1543.
- Peters et al. (2018) Matthew E. Peters, Mark Neumann, Mohit Iyyer, Matt Gardner, Christopher Clark, Kenton Lee, and Luke Zettlemoyer. 2018. Deep contextualized word representations. In Proc. of NAACL-HLT.
- Radford et al. (2019) Alec Radford, Jeffery Wu, Rewon Child, David Luan, Dario Amodei, and Ilya Sutskever. 2019. Language models are unsupervised multitask learners.
- Salazar et al. (2020) Julian Salazar, Davis Liang, Toan Q. Nguyen, and Katrin Kirchhoff. 2020. Masked language model scoring. In Proceedings of the 58th Annual Meeting of the Association for Computational Linguistics, pages 2699–2712, Online. Association for Computational Linguistics.
- Schick and Schütze (2020) Timo Schick and Hinrich Schütze. 2020. Rare words: A major problem for contextualized embeddings and how to fix it by attentive mimicking. In Proc. of AAAI.
- Schick et al. (2021) Timo Schick, Sahana Udupa, and Hinrich Schütze. 2021. Self-diagnosis and self-debiasing: A proposal for reducing corpus-based bias in nlp. Computing Research Repository, arXiv:2103.00453.
- Sennrich et al. (2016) Rico Sennrich, Barry Haddow, and Alexandra Birch. 2016. Neural machine translation of rare words with subword units. In Proceedings of the 54th Annual Meeting of the Association for Computational Linguistics (Volume 1: Long Papers), pages 1715–1725, Berlin, Germany. Association for Computational Linguistics.
- Tan and Celis (2019) Yi Chern Tan and L. Elisa Celis. 2019. Assessing social and intersectional biases in contextualized word representations. In Advances in Neural Information Processing Systems 32, pages 13230–13241. Curran Associates, Inc.
- Wang and Cho (2019) Alex Wang and Kyunghyun Cho. 2019. BERT has a mouth, and it must speak: BERT as a Markov random field language model. In Proceedings of the Workshop on Methods for Optimizing and Evaluating Neural Language Generation, pages 30–36, Minneapolis, Minnesota. Association for Computational Linguistics.
- Weischedel et al. (2013) Ralph Weischedel, Martha Palmer, Mitchell Marcus, Eduard Hovy, Sameer Pradhan, Lance Ramshaw, Nianwen Xue, Ann Taylor, Jeff Kaufman, Michelle Franchini, et al. 2013. Ontonotes release 5.0 ldc2013t19. Linguistic Data Consortium, Philadelphia, PA, 23.
- Wolf et al. (2020) Thomas Wolf, Lysandre Debut, Victor Sanh, Julien Chaumond, Clement Delangue, Anthony Moi, Pierric Cistac, Tim Rault, Rémi Louf, Morgan Funtowicz, Joe Davison, Sam Shleifer, Patrick von Platen, Clara Ma, Yacine Jernite, Julien Plu, Canwen Xu, Teven Le Scao, Sylvain Gugger, Mariama Drame, Quentin Lhoest, and Alexander M. Rush. 2020. Transformers: State-of-the-Art Natural Language Processing. In EMNLP: System Demonstrations, pages 38–45.
- Zhao et al. (2019) Jieyu Zhao, Tianlu Wang, Mark Yatskar, Ryan Cotterell, Vicente Ordonez, and Kai-Wei Chang. 2019. Gender bias in contextualized word embeddings. In Proceedings of the 2019 Conference of the North American Chapter of the Association for Computational Linguistics: Human Language Technologies, Volume 1 (Long and Short Papers), pages 629–634, Minneapolis, Minnesota. Association for Computational Linguistics.
- Zhao et al. (2018a) Jieyu Zhao, Tianlu Wang, Mark Yatskar, Vicente Ordonez, and Kai-Wei Chang. 2018a. Gender bias in coreference resolution: Evaluation and debiasing methods. In Proceedings of the 2018 Conference of the North American Chapter of the Association for Computational Linguistics: Human Language Technologies, Volume 2 (Short Papers), pages 15–20. Association for Computational Linguistics.
- Zhao et al. (2018b) Jieyu Zhao, Yichao Zhou, Zeyu Li, Wei Wang, and Kai-Wei Chang. 2018b. Learning Gender-Neutral Word Embeddings. In Proc. of EMNLP, pages 4847–4853.
- Zhou et al. (2003) Dengyong Zhou, Olivier Bousquet, Thomas Navin Lal, Jason Weston, and Bernhard Schölkopf. 2003. Learning with local and global consistency. In NIPS.
- Zhu et al. (2015) Yukun Zhu, Ryan Kiros, Rich Zemel, Ruslan Salakhutdinov, Raquel Urtasun, Antonio Torralba, and Sanja Fidler. 2015. Aligning Books and Movies: Towards Story-Like Visual Explanations by Watching Movies and Reading Books. In ICCV.
Appendix A Word frequency in Wikipedia and Books Corpus
Table 9 shows the frequency of eight words for each bias type in Wikipedia and BookCorpus. Selection of these words is described in detail in § 4.3.
Disadvantaged group Advantaged group Race african jamal asian tyrone american caucasian james carl Frequency 278,533 6,292 148,455 10,382 1,477,133 7,747 491,860 73,431 Gender she her women woman he his men him Frequency 16,184,610 17,794,298 835,560 788,972 29,565,671 21,625,647 1,013,099 7,669,190 Sexual orientation gay homosexual lesbian bisexual heterosexual woman husband wife Frequency 82,133 15,121 23,238 8,500 6,406 835,560 310,454 558,139 Religion muslim jewish jew muslims christian christians atheist church Frequency 98,526 190,599 12,914 52,010 298,823 45,435 8,082 891,126 Age old elderly teenagers boy young middle aged adults Frequency 1,195,891 34,677 23,301 396,776 704,664 452,042 106,367 80,200 Nationality mexican italian chinese immigrants american americans canada canadian Frequency 107,320 277,740 293,124 53,054 1,477,133 116,064 408,676 295,477 Disability ill mentally retarded autistic healthy smart normal gifted Frequency 84,462 35,469 2,647 3,343 52,631 85,855 219,500 22,207 Physical appearance fat overweight ugly short thin tall skinny beautiful Frequency 67,664 6,096 45,210 637,024 131,631 171,563 18,457 302,924 Socioeconomic status poor ghetto homeless poverty rich wealthy businessman doctor Frequency 230,388 10,868 25,417 89,891 157,354 58,398 51,700 228,713