Smart City Data Analysis via Visualization of Correlated Attribute Patterns
Abstract.
Urban conditions are monitored by a wide variety of sensors that measure several attributes, such as temperature and traffic volume. The correlations of sensors help to analyze and understand the urban conditions accurately. The correlated attribute pattern (CAP) mining discovers correlations among multiple attributes from the sets of sensors spatially close to each other and temporally correlated in their measurements. In this paper, we develop a visualization system for CAP mining and demonstrate analysis of smart city data. Our visualization system supports an intuitive understanding of mining results via sensor locations on maps and temporal changes of their measurements. In our demonstration scenarios, we provide four smart city datasets collected from China and Santander, Spain. We demonstrate that our system helps interactive analysis of smart city data.
1. introduction
Many cities have started smart city initiatives and installed a wide variety of sensors that measure several attributes, such as traffic volume and temperature. The collected data from smart cities is used for continuously and cooperatively monitoring urban conditions, such as the distribution of air pollution, the transition of traffic volume, and the change of citizen activity. Researchers and municipalities analyze smart city data and make a decision for urban planning. For example, environmental researchers in Shanghai Jiao Tong university analyze the relationships between traffic and air pollution (Wang et al., 2020; Jiang et al., 2017). Santander, Spain monitors the traffic volumes within the city and informs people of the real-time traffic information (Sanchez et al., 2014). They work on obtaining useful patterns in cities by using database and data mining techniques.
Smart city data has spatial and temporal information. For analysing spatio-temporal data, we proposed correlated attribute pattern (CAP) mining (Harada et al., 2019, 2020). CAP mining aims to find correlated attributes of sensors that are spatially close to each other and whose measurements temporally co-evolve. We developed an efficient algorithm for CAP mining, called Miscela and presented that the correlated attribute patterns can discover useful knowledge from smart city data. We show an example that illustrates the effectiveness of CAP mining.
Example 1.1.
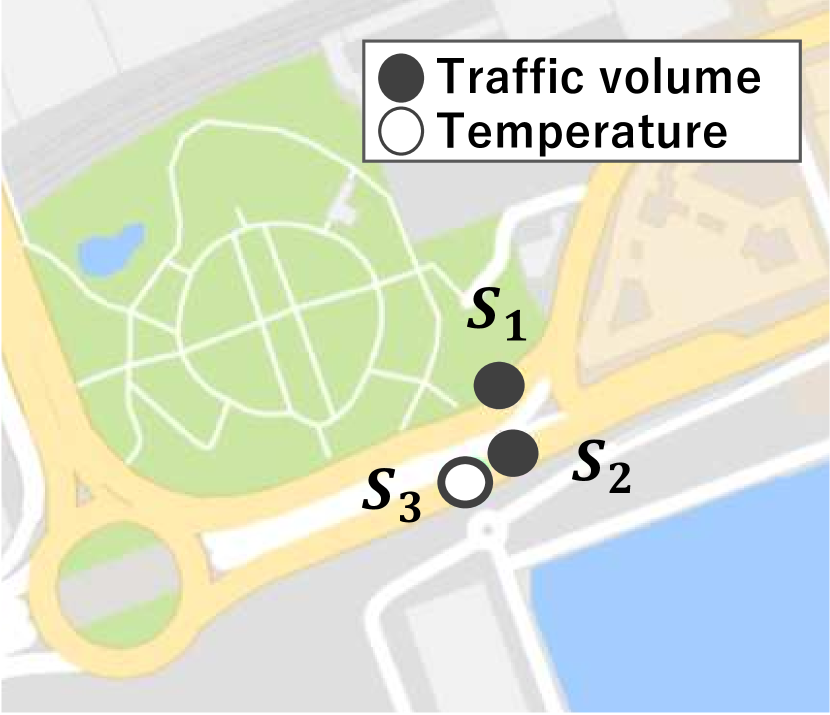
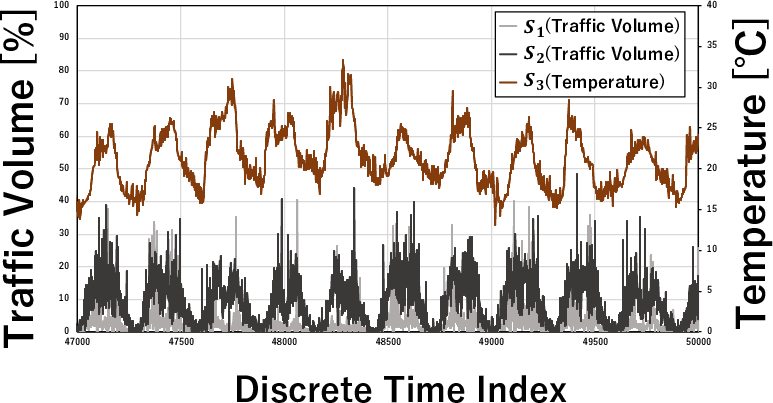
Figure 1 shows locations of three sensors , , and in Santander and these measured values. and measure traffic volume and measures temperature. These sensors are spatially close to each other, and the measurements of them co-evolve frequently (i.e., change the values simultaneously). The CAP mining can discover correlated patterns among traffic volume and temperature measured by the three sensors. Municipalities can understand that traffic behavior in the area is correlated to temperature from the CAP.
 (a) Sensor location
 (b) Correlation
|
Contribution: In this paper, we develop a visualization system for CAP mining, called Miscela-V, to support an intuitive analysis of smart city data. Miscela-V has the following characteristics:
-
•
Miscela-V natively supports CAP mining with user-specified parameters.
-
•
Miscela-V visualizes sensor locations on a map and temporal changes of sensor measurements.
-
•
Miscela-V caches results of CAP mining and reuses the cached results for efficient interactive analysis.
Our system supports intuitive understanding of analytic results via visualization. We demonstrate an analysis of smart city data by using our system. We use two different scale datasets: Santander (i.e., city size) and China (i.e., country size). Our system is effective for any space and time scales such as daily city-scale and minutely country-scale datasets. For further investigation, we open our source codes111https://github.com/OnizukaLab/MISCELA-v.
This work is a collaborated work with researchers in database, environmental, and urban science fields, so we validated that Miscela-V is effective for environmental and urban science studies. Through the demonstration of Miscela-V, we expect that Miscela-V helps researchers in more other fields for accelerating their analysis.
Related systems: There are several systems for visualizing spatio-temporal data (e.g., (Xiufeng et al., 2020; Hengl et al., 2015; Andrienko and Andrienko, 2013)). Some systems support spatial-temporal pattern mining but no systems support CAP mining. The novelty of our system is that it focuses on CAP mining with efficient interactive analysis.
Organization: The rest of this paper is organized as follows. We explain the CAP mining and the CAP mining method Miscela in Section 2 as preliminaries. Then, we present a visualization system Miscela-V in Section 3. After that, we show our demonstration plan in Section 4, followed by the conclusion in Section 5.
2. Preliminaries
We explain CAP mining and Miscela as preliminaries.
2.1. CAP mining
We consider a sensor set in a geographical region. Each sensor has longitude and latitude as spatial information. It measures a specific attribute, such as temperature, traffic volume, and PM2.5. Each sensor is synchronized, that is, it measures its sensor value at a certain interval. We define that measurements are co-evolved if they increase/decrease at the same timestamp.
The CAP mining aims for discovering spatially and temporally correlated environmental properties such that multiple sensors measure those attributes that satisfy the following conditions: (1) the set of sensors are located at spatially close locations to each other, (2) the measurements of the sensors co-evolve frequently, and (3) the set of attributes measured by the sensors includes multiple attributes. The CAP mining restricts the correlation between different attributes to support diversified analysis of smart cities. This restriction can be easily removed.
CAP mining has several parameters for obtaining CAPs that users want. We here summarize parameters and their impacts on the number of CAPs to be discovered.
-
•
Evolving rate : The CAP mining removes slight changes of measurements by specifying . If the amount of changes from the previous timestamp is smaller than , the timestamps are evaluated as that the measurements do not change. If is large, sensors likely co-evolve, so the number of CAPs likely becomes large.
-
•
Distance threshold : gives a criterion of close sensors. If a distance between the two sensors is less than , we define that they are close. If is large, many sensors are spatially close to each other.
-
•
The maximum number of CAP attributes : restricts the number of attributes in CAPs. The CAP mining discovers correlations among not larger than attributes.
-
•
The minimum support : is the minimum support. If measurements of two sensors co-evolve at more than timestamps, they are co-evolving sensors. If is small, many sensors become co-evolving sensors, and thus the number of CAPs likely becomes large.
Since the sensitivity of parameters depends on datasets, it is necessary to support interactive analysis. Please see more detailed definitions in (Harada et al., 2019).
2.2. MISCELA: an efficient algorithm for CAP mining
Miscela supports efficient computation for CAP mining, which comprises the following four steps.
-
(1)
Linear segmentation: We filter uninteresting data fluctuation by applying a linear segmentation algorithm to time series data.
-
(2)
Extracting evolving timestamps: We extract evolving timestamps in the measurements of all sensors by using the given evolving rate .
-
(3)
Discovering spatially connected sets of sensors: Since CAPs are discovered only from spatially connected sets, we divide a given sensor set into spatially close sensors to restrict the search space.
-
(4)
CAP search: For each set of spatially close sensors, we search for CAPs. We recursively conduct the CAP search with gradually expanding spatially close sensors according to a tree structure for CAP mining.
Please see more detailed and precise procedures in (Harada et al., 2019).
3. MISCELA-V: Visualizing System
We present our visualization system, which we call Miscela-V. The purposes of Miscela-V is (1) to easily find CAPs in users’ datasets, (2) to visually understand the CAPs, and (3) to efficiently support interactive analysis. First, Miscela-V natively supports CAP mining. It visualizes locations of sensors and changes of their measurements to understands reasons why these attributes are correlated. In addition, since Miscela may take a large execution depending on their parameters, it has a caching mechanism for efficient interactive CAP mining.
3.1. System overview
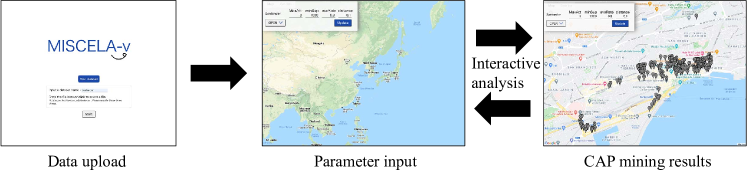
Figure 2 shows an overview of Miscela-V. Miscela-V has three main processes to visualize CAP mining results. First, we upload datasets to the system. Then, we input parameters of CAP mining for obtaining appropriate results. Finally, we can see the CAP results on a map and the temporal behaviors of their measurements. Since our system supports interactive analysis, data and CAPs are stored in databases. Users can easily change parameters to check CAPs in different parameters. If users specify the parameters of CAPs stored in databases, we can immediately see CAPs without processing Miscela.
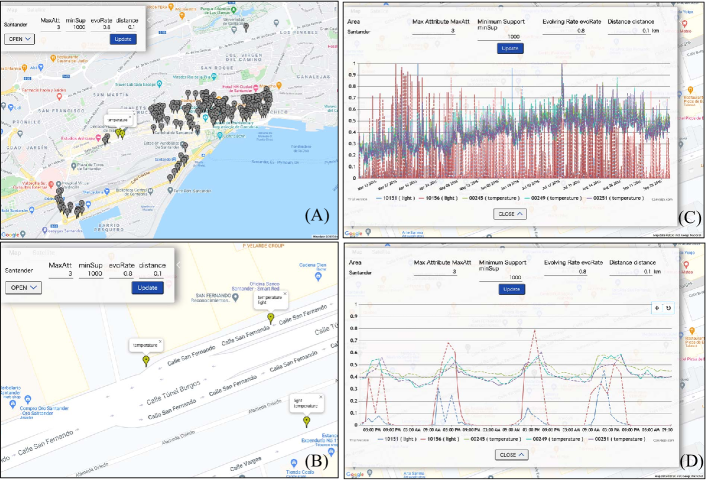
Figure 3 shows a visualization of sensor locations and temporal measurements. Figures (A) and (B) show sensor locations, and three sensors are highlighted. When we click a sensor in the map, sensors are highlighted if their measurements are correlated to measurements of the clicked sensor. In addition, we can see the attributes of correlated sensors. Figures (C) and (D) show temporal behaviors of measurements, which we can zoom in and zoom out. In (D), you can see that three measurements frequently increase/decrease together. Our visualization helps to intuitively understand correlations among sensors.
3.2. Data upload
We can easily upload our datasets via a user interface that provides two ways of data upload: drag-and-drop and selecting files from finder. For uploading datasets, we need to prepare three files; data.csv, location.csv, and attribute.csv. data.csv lists the set of measurements at all timestamps. We note that timestamps must be the same time intervals, and sensor values are null if the sensors do not have the sensor values at timestamps. location.csv lists the sensor information; identifier, attribute, and location. attribute.csv lists all attributes in the datasets. Each file should have the following formats:
[l]data.csv
id,attribute,time,data
00000,temperature,2016-03-01 00:00:00,null
00000,temperature,2016-03-01 01:00:00,9.87
[l]location.csv
id,attribute,lat,lon
00000,temperature,43.46192,-3.80176
00001,temperature,43.46212,-3.79979
[l]attribute.csv
temperature
light
The data.csv might be very large. For scalably uploading large datasets, we divide the file into 10,000 lines and send each divided set to our system. Each dataset is stored in databases, and thus we can use the dataset without re-uploading by specifying the dataset name.
3.3. Caching mechanism
Miscela may take a long time for finding CAPs depending on data and user-specified parameters. For efficient interactive analysis, Miscela-V caches CAP mining results and reuses the cached results if users specify the same parameter setting. This caching mechanism accelerates the analytic process and reduces the computational costs when the front end receives multiple requests at the same time.
We store the name of the dataset, parameters, and CAPs (i.e., a set of sets of sensors) to the database. Before computing CAPs by Miscela, our system searches for CAPs with the same parameters and the name of the dataset from the database. Since interactive analysis could input the same parameters to compare results repeatedly, the caching mechanism supports more efficient data analysis.
3.4. Implementation
We use MongoDB as database management systems and django as API servers. Miscela is implemented by Python, and a map visualization is implemented by JavaScript, jQuery, and Google Map API. Miscela returns a set of sets of sensors as CAPs that might include many sensors (or empty), and its format is JSON. Since RDBMS is not suitable for Miscela outputs, we select MongoDB to store datasets and CAP results. Since we design that these components are connected by APIs, we can modify each component individually.
4. Demonstration Plan
For Miscela-V demonstrations, we use smart city data in Santander and China, as a case study. We will introduce the system architecture, the analytic process, and how to use our system to find knowledge. Attendees can interact with our system to perform analysis using the data. For example, since Miscela-V can show temporal changes of sensors’ measurements, we can analyze the difference of measurements before/after COVID-19. The attendees will interactively discover CAPs of smart city data.
The attendees can use the following datasets222We consider sensors with different attributes as different sensors even if they are located at the same location.:
-
•
Santander includes 552 sensors in Stantander, Spain from 2016 March 1st to September 30th. The number of records is 2,329,936. Attributes are temperature, light, sound, traffic volume, and humidity.
-
•
China6 includes 9,438 sensors in China from 2016 September 1st to 2018 October 31st. The number of records is 6,889,740. Attributes are PM2.5, SO2, NO2, CO, and O3.
-
•
China13 includes 4,810 sensors. The period is the same as China6. The number of records is 3,511,300. Attributes are additionally included in temperature, humidity, air pressure, daylight, rainfall percentage, rain volume, and wind speed.
-
•
COVID-19 includes 12 sensors in Shanghai and Guangzhou, China from 2020 January 1st to June 30th. The number of records is 52,261. Attributes are PM2.5, PM10, SO2, NO2, CO, and O3. This data includes the period after and before spreading COVID-19.
We plan to demonstrate the following case studies.
Interactive analysis: In this demonstration, we first provide interactive analysis to upload datasets, input parameters, and view CAP results. Attendees can freely use our system and try to find interesting patterns in our datasets. First, attendees set the parameters for finding CAPs and see the visualization of the results. Second, the attendees can investigate why the CAPs are discovered by visualizing the temporal behavior of measurements of sensors. Since our system highlights sensors that are correlated, they can understand what sensors are correlated intuitively.
Santander dataset: a single city data analysis: This scenario aims to find interesting knowledge within Santander. Attendees will find interesting CAPs from Santander datasets and investigate the results via visualization. For example, we can find correlated patterns among temperatures and traffic volumes and among light and temperature.
China dataset: multiple cities data analysis: This scenario aims to find interesting knowledge among many cities in China. In particular, attendees can intuitively understand that two sensors are correlated even if they are distant from each other. Furthermore, sensors are not correlated if two sensors are vertically (north and south) close to each other, but if sensors are horizontally (east and west) close, they are correlated. These are often caused by wind directions. We can understand that wind directions affect to air quality from the CAPs. Our system supports for understanding reasons why sensors are correlated and not correlated.
COVID-19 analysis: COVID-19 dataset includes the period before and after spreading COVID-19. Attendees can know that levels of air pollution change due to spreading COVID-19. Figure 4 shows the correlation patterns before and after COVID-19. From these results, we can visually understand that our activity changes affect not only the amounts of air pollutants but also their correlation patterns.
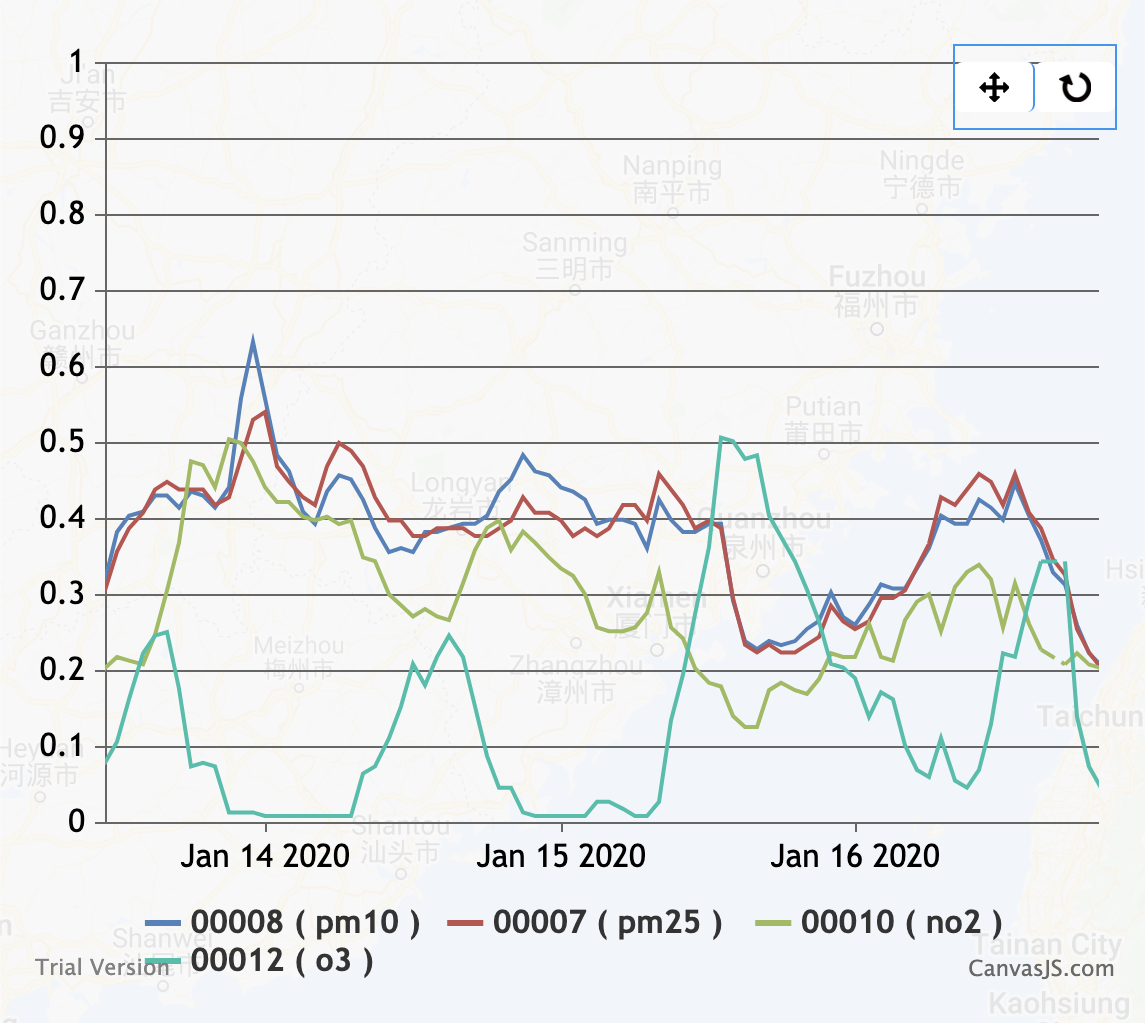 (a) Before
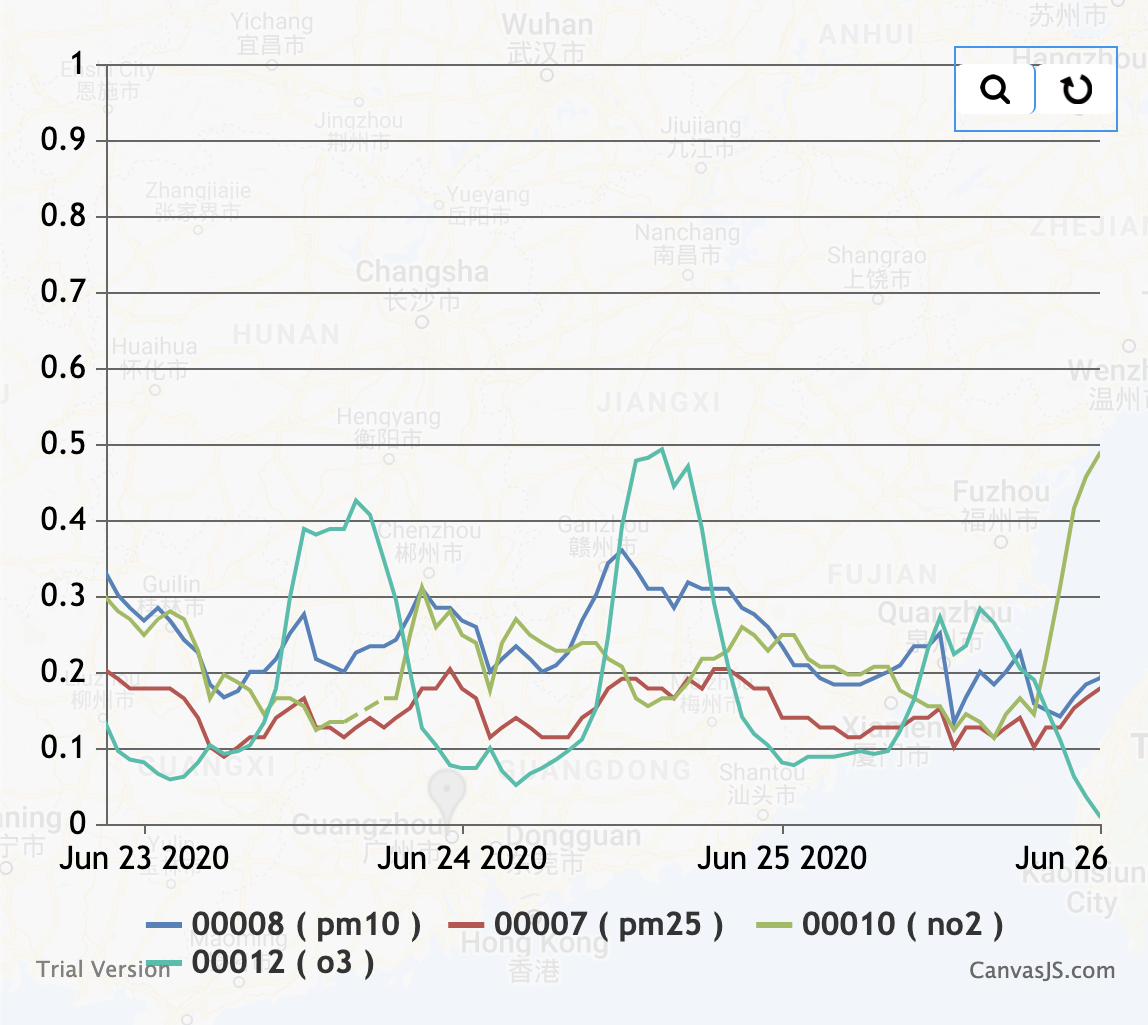 (b) After
|
5. Conclusion
In this paper, we introduced a visualization system Miscela-V for CAP mining and demonstrated the data analysis of smart city via Miscela-V. We plan to continuously extend our system to improve usability and add additional data mining techniques, based on user feedback. We hope that our system accelerates data analysis in many research fields.
Acknowledgements This work was supported by JSPS KAKENHI Grant Numbers JP20H00584.
References
- (1)
- Andrienko and Andrienko (2013) Natalia Andrienko and Gennady Andrienko. 2013. A visual analytics framework for spatio-temporal analysis and modelling. Data Mining and Knowledge Discovery 27, 1 (2013), 55–83.
- Harada et al. (2019) Kei Harada, Yuya Sasaki, and Makoto Onizuka. 2019. MISCELA: Discovering correlated attribute patterns in time series sensor data. In MDM. 72–80.
- Harada et al. (2020) Kei Harada, Yuya Sasaki, and Makoto Onizuka. 2020. MISCELA: discovering simultaneous and time-delayed correlated attribute patterns. Distributed and Parallel Databases (2020), 1–28.
- Hengl et al. (2015) Tomislav Hengl, Pierre Roudier, Dylan Beaudette, Edzer Pebesma, et al. 2015. plotKML: Scientific visualization of spatio-temporal data. Journal of Statistical Software 63, 5 (2015), 1–25.
- Jiang et al. (2017) Baoguo Jiang, Song Liang, Zhong-Ren Peng, Haozhe Cong, Morgan Levy, Qu Cheng, Tianbing Wang, and Justin V Remais. 2017. Transport and public health in China: the road to a healthy future. The Lancet 390, 10104 (2017), 1781–1791.
- Sanchez et al. (2014) Luis Sanchez, Luis Muñoz, Jose Antonio Galache, Pablo Sotres, Juan R Santana, Veronica Gutierrez, Rajiv Ramdhany, Alex Gluhak, Srdjan Krco, and Evangelos Theodoridis. 2014. SmartSantander: IoT experimentation over a smart city testbed. ELSEVIER Computer Networks 61 (2014), 217–238.
- Wang et al. (2020) Hong-Wei Wang, Xiao-Bing Li, Dongsheng Wang, Juanhao Zhao, Hong di He, and Zhong-Ren Peng. 2020. Regional prediction of ground-level ozone using a hybrid sequence-to-sequence deep learning approach. Journal of Cleaner Production 253, 119841 (2020), 1–12.
- Xiufeng et al. (2020) Liu Xiufeng, Zhibin Niu, Linda Yang, Junqi Wu, Dawei Cheng, and Xin Wang. 2020. VAP: a visual analysis tool for energy consumption spatio-temporal pattern discovery. In EDBT. 579–582.