Effect of stand-off distance and spatial resolution on the pressure impact of near-wall vapor bubble collapses
Abstract
We consider the collapse behavior of cavitation bubbles near walls under high ambient pressure conditions. Generic configurations with different stand-off distances are investigated by numerical simulation using a fully compressible two-phase flow solver including phase change. The results show that the stand-off distance has significant effects on collapse dynamics, micro-jet formation, rebound, and maximum wall pressure. A relation between cavitation induced material damage and corresponding collapse mechanisms is obtained from pressure-impact data at the wall.
We analyze the resolution dependence of collapse and rebound and the observed maximum pressure distributions. The comparison of the results on six different grid resolutions shows that main collapse features are already captured on the coarsest resolution, while the peak pressures are strongly resolution dependent.
keywords:
cavitation, bubble dynamics, aspherical collapse, erosion potential, grid study1 Introduction
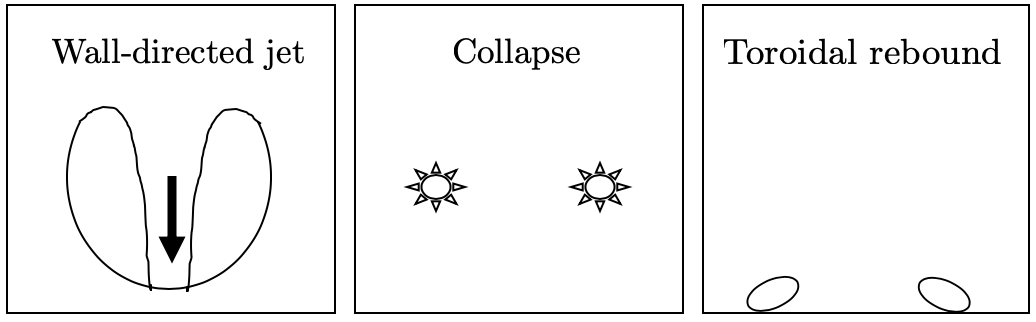
When a cavitation bubble collapses in the vicinity of a wall, a wall-directed jet is formed [33, 42], and intense pressure waves are emitted from the collapse site [18, 17]. Jet and pressure waves cause considerable material damage, representing a serious problem in marine applications, hydraulic power generation and injector components [1, 2, 16]. On the other hand, cavitation bubbles are also exploited to benefit from the intense localized pressure waves and energy focusing, as e.g. in biomedical applications, such as urinary stone ablation [41] and drug delivery [11], or new technologies, such as surface-cleaning [35, 45], micro-pumps in microfluidics [12] and water treatment [68]. In this paper, the cavitation dynamics and damage potential of near-wall bubble collapses are numerically studied in detail. Furthermore, we quantify the effect of the grid resolution on the numerical results, which is relevant for engineering predictions.
Early studies by Benjamin et al. [4], Plesset and Chapman [42], Hickling and Plesset [18], Naude and Ellis [33], Shima and Nakajima [53] already reported on the damage potential of collapses in the vicinity of walls and found an aspherical behavior leading to the formation of a jet. Later, Shima et al. [54, 55], Tomita and Shima [60], Philipp and Lauterborn [39] experimentally examined the erosion potential of single bubble collapses and showed that the distance to the wall is decisive for the damage potential. However, despite numerous studies, the role of the jet and the shock wave for the damage is still not fully understood [13]. The dynamics of aspherical collapses have been studied by e.g. Lindau and Lauterborn [29], Brujan et al. [8, 9], Kröninger et al. [23] and more recently by Supponen et al. [57, 58, 56]. Over the last decade, compressible numerical simulations have started to complement experimental studies allowing for new insights with their time-resolved flow field data. For example, Johnsen and Colonius [19], Lauer et al. [25] numerically studied the collapse behavior and erosion potential of bubbles in the vicinity of walls. While most numerical studies focus on the first collapse [e.g. 19, 3, 40, 62], Ochiai et al. [34], and more recently Sagar and el Moctar [47], also evaluated the erosion potential of the second collapse by considering phase change.
We revisit the dynamics and damage potential of aspherical bubble collapses and investigate the underlying mechanisms. For this purpose, we perform compressible, high-resolution, 3-D simulations of collapsing vapor bubbles with varying stand-off distances to a wall. Following previous studies [e.g. 3, 25, 24, 62], we consider a driving pressure of 100 bar, which is representative for high-pressure applications such as pumps [6] and injector components [38]. Our goal is to determine where the highest pressures occur and to investigate the relevant processes jet impact, collapse and rebound and their effects in detail. For the modeling of the two-phase flow, we employ a homogeneous mixture model with a thermodynamic equilibrium cavitation model [51, 52]. By considering phase change we avoid possible effects of non-condensable bubble content on jet velocity, maximum pressure and rebound [40, 59, 63]. Furthermore, the modeling of evaporation allows us to capture the rebound in post-collapse low-pressure regions.
In numerical simulations, the result can be affected by a variety of modeling parameters, such as the grid resolution [32], the numerical scheme [15, 48], the thermodynamic modeling of the liquid [24], and the modeling of the bubble content (see above). The grid resolution is one of the most important aspects and determines the minimum resolvable bubble radius (if non-condensable bubble content is present) [e.g. 3], the form and intensity of the rebound [e.g. 48], and especially the intensity of the pressure peaks [e.g. 50, 32, 31]. Since there are no detailed previous studies on grid dependence of aspherical bubble collapses, we consider six different grid resolutions and determine the grid dependence of the rebound and the pressure peaks. Based on the literature, a grid resolution of about 100 cells over the maximum radius can be considered as state of the art [25]. The highest reported resolutions are for 3-D [3] and for axisymmetric 2-D simulations [20]. The results presented here of resolutions of and represent the highest grid resolution used so far for 3-D simulations.
The paper is structured as follows. In Section 2, we describe the physical model and numerical method. Section 3 presents the numerical set-up and the considered configurations. Then, the collapse behavior of the bubble, its pressure impact on the wall and the maximum pressure distribution are analyzed for different stand-off distances in Section 4. In Section 5, the effect of the grid resolution on the collapse dynamics and the pressure impact is evaluated by comparing results for six different grid resolutions. Section 6 summarizes the paper.
2 Physical model and numerical method
2.1 Governing Equations
We solve the fully compressible Navier-Stokes equations in conservative form
| (1) |
The state vector is composed of the conserved variables density and momentum . Due to the assumed barotropic modeling (), the energy equation can be omitted. The convective fluxes and the flux contributions due to pressure and shear read
| (2) |
with the velocity , the static pressure , the unit tensor , and the viscous stress tensor
| (3) |
where is the dynamic viscosity.
2.2 Thermodynamic Model
Schmidt et al. [51] and Schnerr et al. [52] formulated a cavitation model based on the assumption that the liquid and gas phase of a cavitating liquid are in thermal and mechanical equilibrium. This model has been successfully validated for spherical collapse with analytical solutions [e.g. 15, 63] and aspherical collapse with the collapse behavior and pressure data of Lauer et al. [25] by e.g. Pöhl et al. [43], Örley [36], Koukouvinis et al. [22]. Apart from that, it has been extensively validated for cavitating nozzle flows [14, 37, 64, 65, 10] and numerical cavitation erosion prediction [32, 50] with experimental data.
Due to the thermodynamic equilibrium assumption for the cavitation model, finite-rate mass transfer terms are avoided. The liquid starts to cavitate if the pressure drops beneath saturation pressure
| (4) |
and then a liquid-vapor mixture is present. For instantaneous phase change in local thermodynamic equilibrium, the densities of liquid and vapor are their saturation densities , . Thus, the vapor volume fraction is given by the density of the liquid-vapor mixture as
| (5) |
For water at reference temperature , the corresponding values are , and .
Different equations of state for the pure liquid and the liquid-vapor mixture are employed. The pure liquid is modeled using a modified Tait equation
| (6) |
The equation of state for the two-phase region () is derived from the definition of the isentropic speed of sound
| (7) |
Assuming that phase change takes place in equilibrium, we use the equilibrium speed of sound [16]
| (8) |
where is the specific heat capacity, the speed of sound of the component , and the latent heat. Integration from saturation conditions yields into
| (9) |
with the fluid-specific constants and
| (10) |
where and are defined by
| (11) |
We have used the following values: , , , , , , and .
Viscous effects are considered in our simulations. The dynamic viscosity of the mixture is determined by
| (12) |
with and . Surface tension is neglected in our model as it is only significant at a bubble radius of [16], which is at the considered conditions (driving pressure , surface tension ) on the negligible order of .
2.3 Numerical Method
The thermodynamic model is embedded into a density-based fully compressible flow solver with a low-Mach-number-consistent flux function, see Schmidt [49]. For the reconstruction at the cell faces an upwind biased scheme is used, where the velocity components are reconstructed with the up to third-order-accurate limiter of Koren [21] and the thermodynamic quantities , with the second-order minmod slope limiter of Roe [46].
Time integration is performed with an explicit second-order, 4-step low-storage Runge-Kutta method [49].
3 Set-up
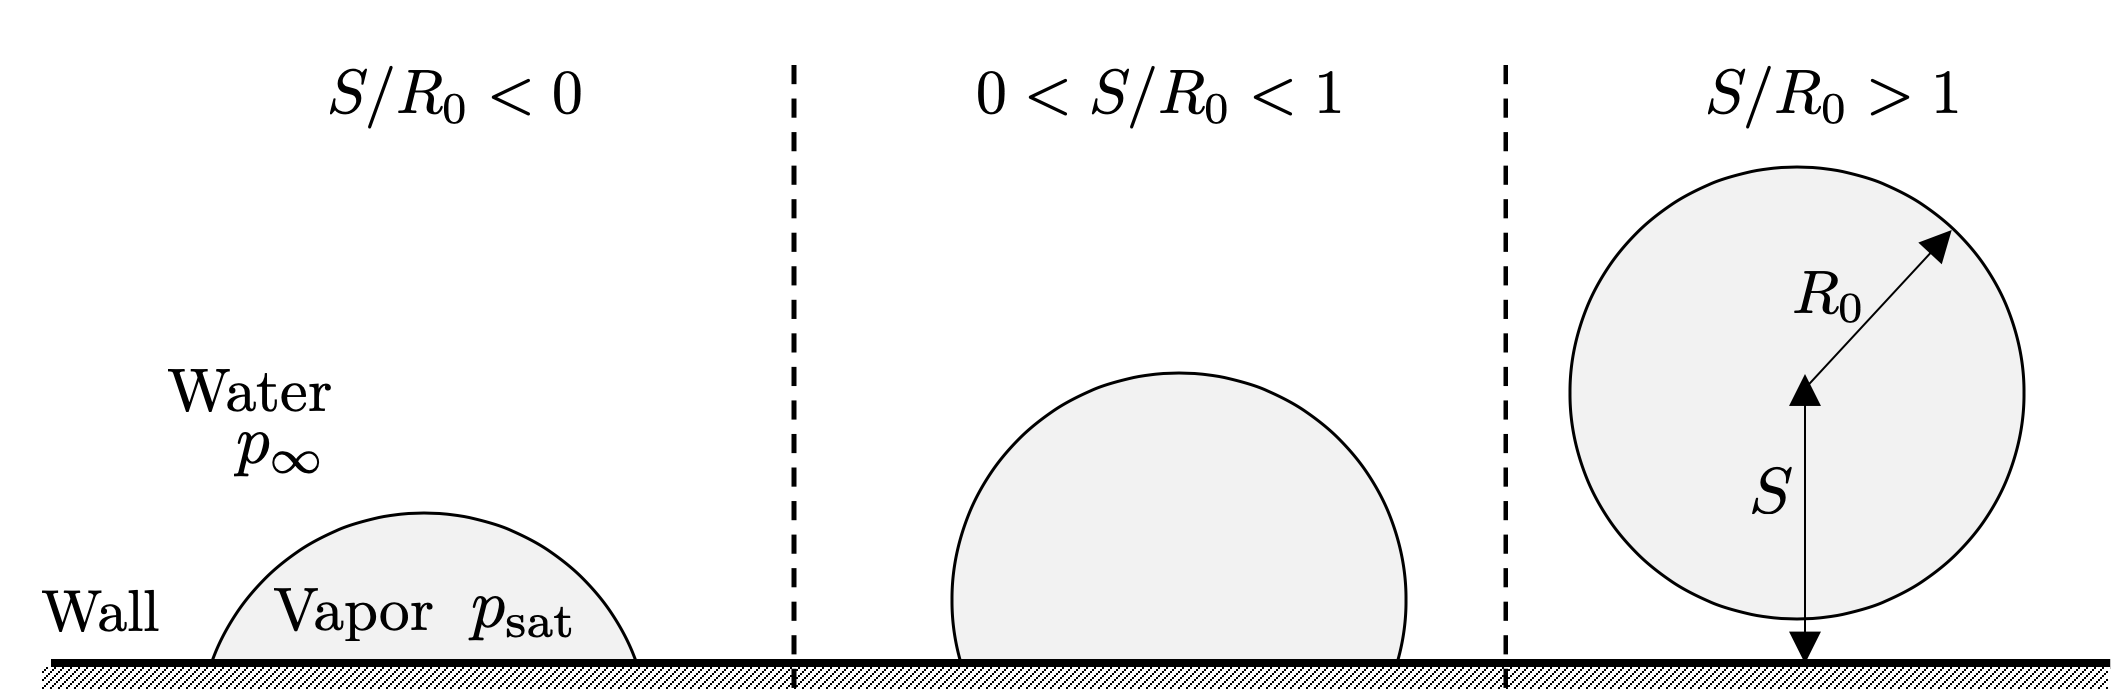
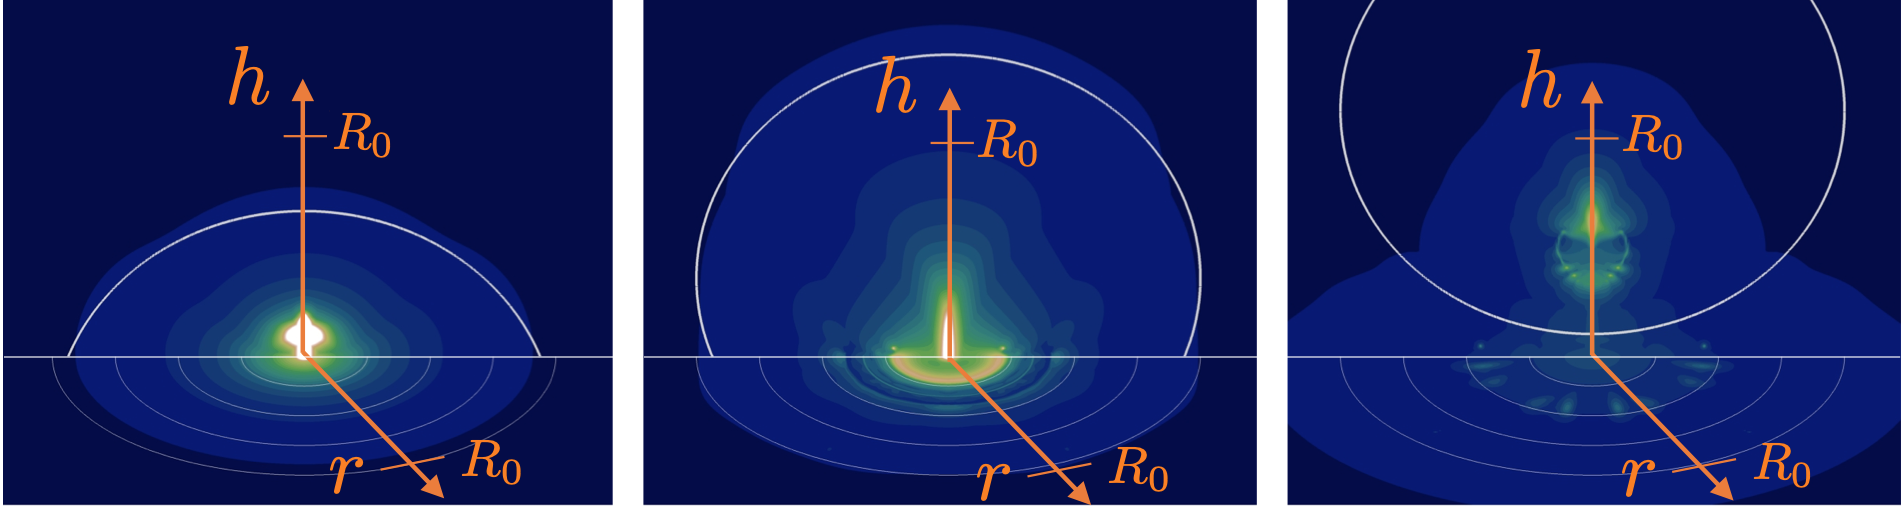
We consider a vapor bubble with initial radius and varying stand-off distances from the wall as shown in Fig. 1. The bubble is surrounded by water with a driving pressure difference of , and the pressure field is initialized as
| (13) |
where is the radial coordinate with its origin at the bubble center. This initialization matches the pressure distribution predicted by the Rayleigh equation for the Besant problem [7, 5]. For the configurations considered, it provides a valid approximation of the realistically evolving pressure field and suppresses the formation of spurious pressure waves due to pressure jumps at the bubble interface. Rasthofer et al. [44] have demonstrated that such an approximation evolves towards an exact solution of the Besant problem within a very short time.
Our initial conditions are chosen to facilitate comparison with other studies, including Beig et al. [3], Lauer et al. [25], and, most importantly, to provide well-defined and easily reproducible conditions. To assess the effect of the grid resolution on the collapse behavior and the wall pressure impact, a resolution-independent initialization procedure is essential. Initial conditions similar to experimental ones can be obtained by including the bubble growth phase in the simulation, see e.g. Lauterborn et al. [26], Lechner et al. [27, 28].
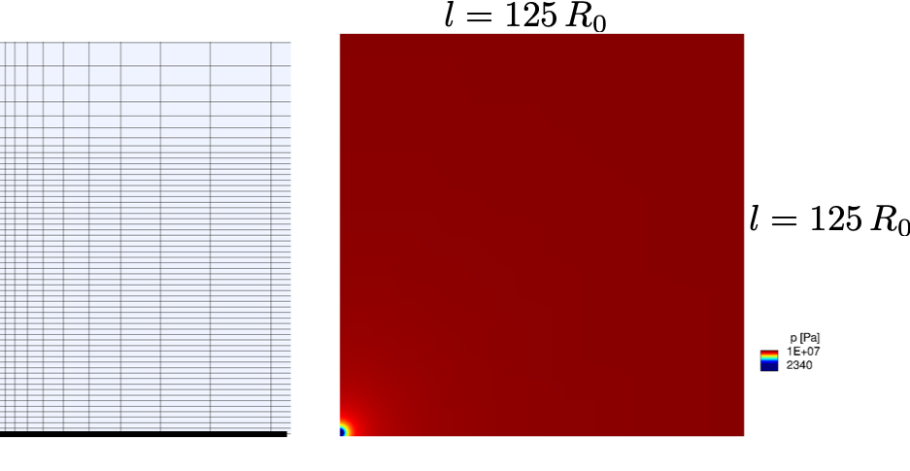
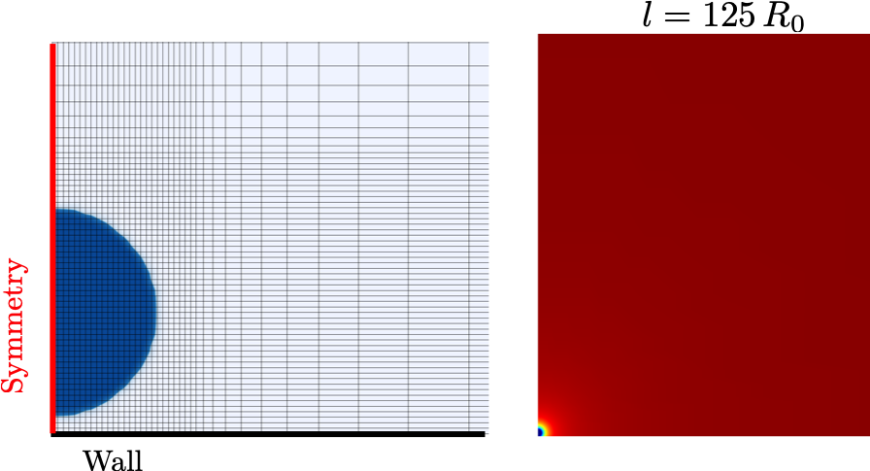
Figure 2 shows the numerical set-up and the computational grid. Taking advantage of symmetry, only a quarter of a bubble is simulated. The bubble is put in the center of a 3-D domain with a length of in wall-parallel direction and of in wall-normal direction. The grid is equally spaced with a defined number of cells per initial radius () in the near bubble region, which is until in wall-parallel direction and in wall-normal direction, and is progressively stretched farther from the bubble. The highest grid resolution is with a total of 670 million cells. A constant CFL number of is used, which corresponds to a time step of at the highest grid resolution. The total simulation time is adapted to capture the second collapse and is about .
Results are presented in a non-dimensional form. Therefore the time scale is normalized with
| (14) |
which is an estimate of the collapse time of a near-wall bubble collapse [42]. The wall has a retarding effect on the collapse and thus is longer than the Rayleigh collapse time for spherical collapses () [30]. Velocity and pressure are normalized with
| (15) |
Note that corresponds to a water hammer pressure induced by the velocity as
| (16) |
Additionally, the employed expression for can be related to the scaling found by Supponen et al. [57] for the maximum pressure for aspherical bubble collapses
| (17) |
where denotes the distance to the focus point.
4 Near-wall bubble collapses with varying stand-off distances
In this section, simulation results of collapsing bubbles for varying stand-off distances and a grid resolution of are presented. Sections 4.1, 4.2, 4.3 and 4.4 analyze the collapse behavior of the different configuration (see also Fig. 1) and Section 4.5 compares and discusses the induced pressure impacts and collapse behaviors.
4.1 Wall-attached bubble with zero stand-off distance
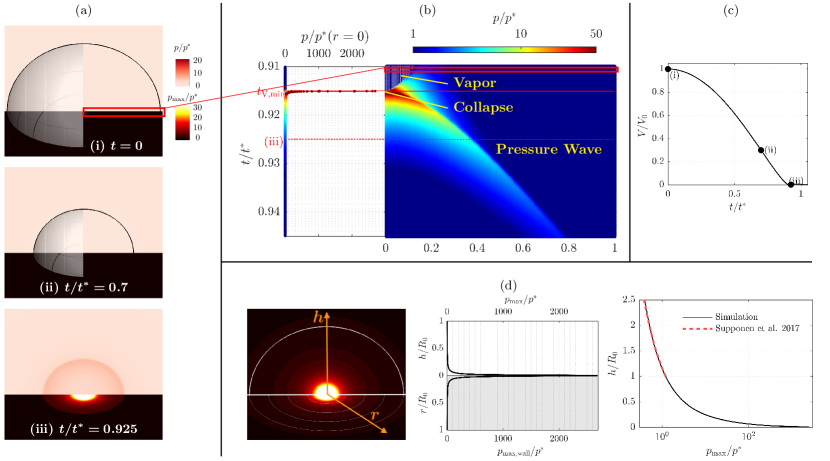
Figure 3 (a) presents a time series for a collapsing wall-attached bubble with . The pressure impact on the wall is shown as a wall-pressure-diagram in Fig. 3 (b), the temporal evolution of the bubble volume in Fig. 3 (c), and the maximum pressure distribution in Fig. 3 (d).
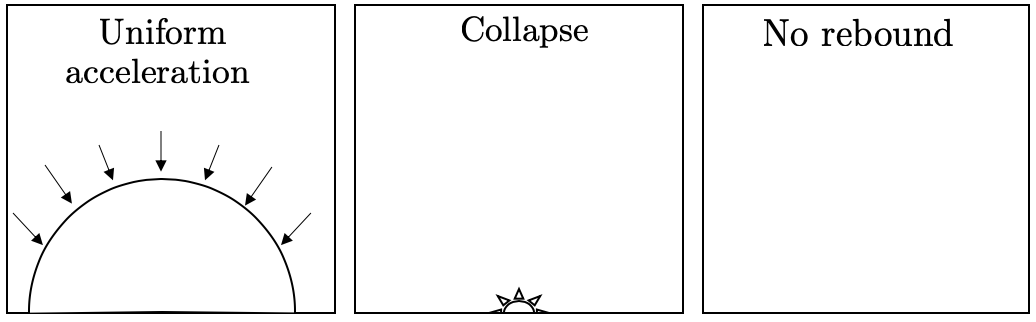
The collapse of a wall-attached bubble with resembles that of a spherical bubble, see Fig. 3 (a,i–iii). Note that for a slip wall boundary condition, the collapse would be a spherical one. Although we apply no slip boundary conditions, inertia forces are predominant due to the high ambient pressure so that viscous effects become only relevant at the final stage of the collapse. The time series shows that the bubble interface accelerates uniformly and the retarding effect of the wall is annihilated by this dominance. The collapse occurs in the center of the bubble directly at the wall and results in the emission of a spherical pressure wave, decaying in intensity with the distance to the focus point (Fig. 3 (a,iii)). At the wall (Fig. 3 (a,i-iii)), we visualize the maximum recorded wall pressure, which can be interpreted as continuous monitoring of the wall deformation. To study the relevant mechanisms for potential wall damage in detail, we present a wall-pressure-diagram in Fig. 3 (b) showing the time-resolved pressure impact on the wall (first domain cell). At the beginning of the considered time interval, the remaining vapor bubble is visible. The vapor is further compressed by the surrounding liquid and the subsequent collapse () causes the maximum wall pressure. After the collapse, the wall-pressure-diagram shows a radially outwards propagating pressure wave and its decay.
4.2 Wall-attached bubble with a negative stand-off distance
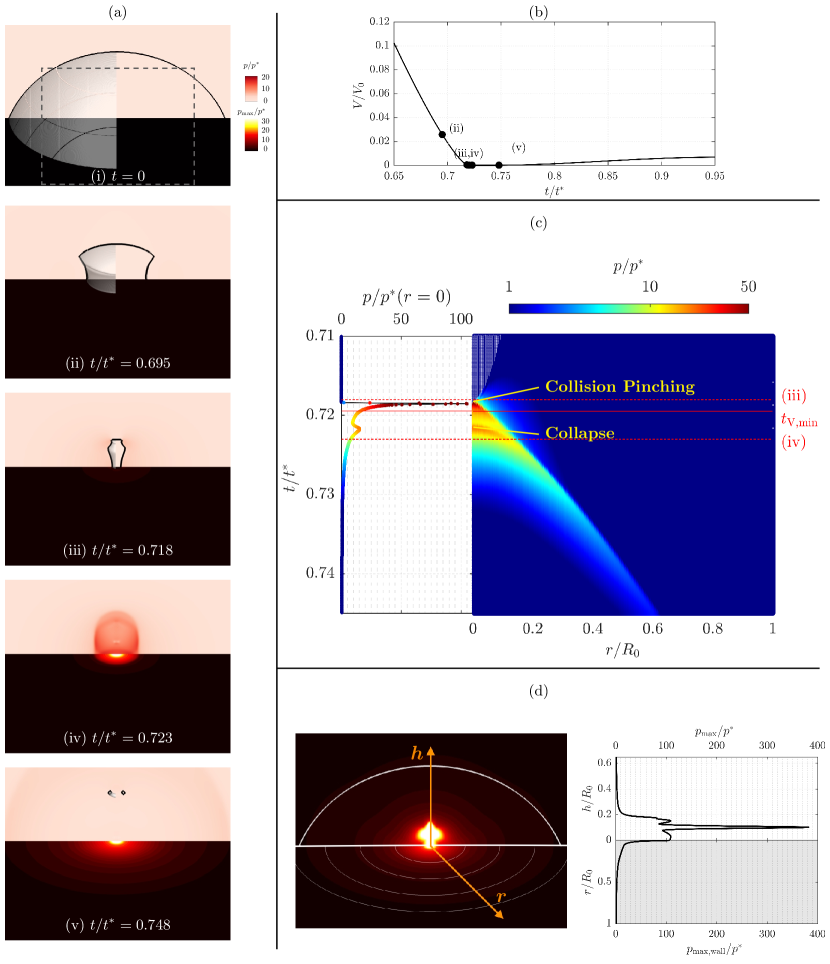
Figure 4 shows the data for a collapsing wall-attached bubble with consisting of a time series in (a), the temporal evolution of the bubble volume in (b), a wall-pressure-diagram in (c), and the maximum pressure distribution in (d). A schematic representation of the collapse and rebound behavior is visualized in Fig. 9 (b).
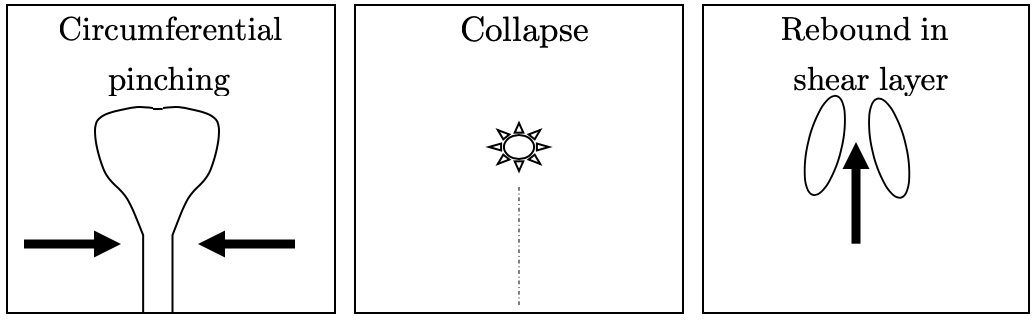
The wall-attached bubble is pinched at its maximum expansion in the circumferential direction, resulting in a mushroom shape (Fig. 4 (a,ii,iii)), as also reported by Shima and Nakajima [53], Lauer et al. [25]. The radially inwards directed flow reaches very high velocities, exceeding . The subsequent collision of these inward moving liquid fronts induces a high pressure peak, which is visible in the wall-pressure-diagram and the wall-centered pressure signal in Fig. 4 (c). Shortly afterwards, the remaining upper part (the ’mushroom head’) collapses and emits a pressure wave. When this wave reaches the wall, it causes the smaller second pressure increase (see Fig. 4 (c)). Due to the conservation of momentum, the preceding radial inward flow at the pinching now causes an upward flow with velocities greater than . In the shear layer of this upward flow, the liquid evaporates, surrounding the flow with a vapor torus (see Fig. 4 (a,v)).
Figure 4 (d) shows the distribution of the maximum pressure. As can be seen in the extracted data, the highest pressure occurs at the focus point of the collapse. The pressure peaks along the symmetry line and in the center of the wall are due to the collision of the liquid fronts.
4.3 Wall-attached bubbles with positive stand-off distances
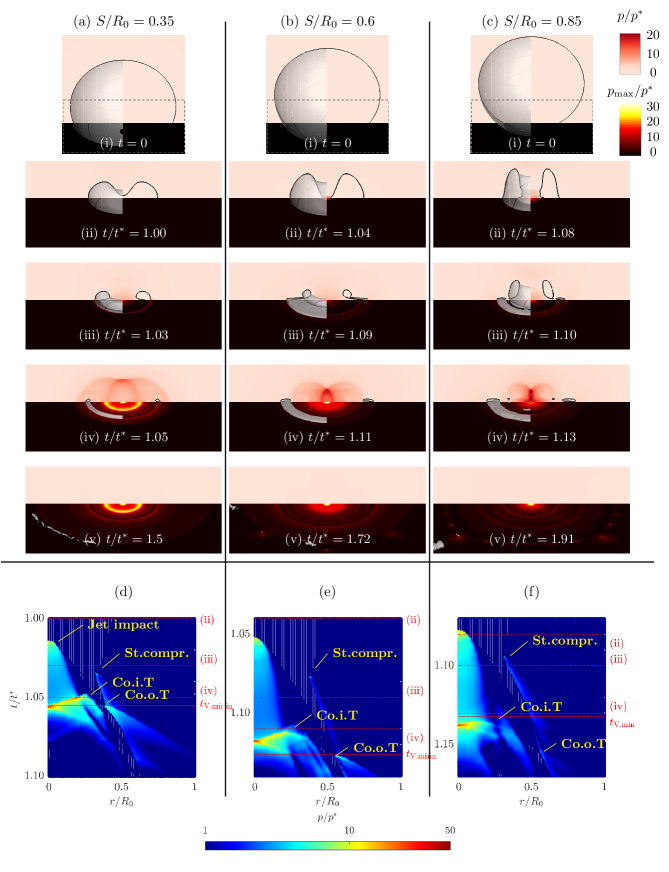
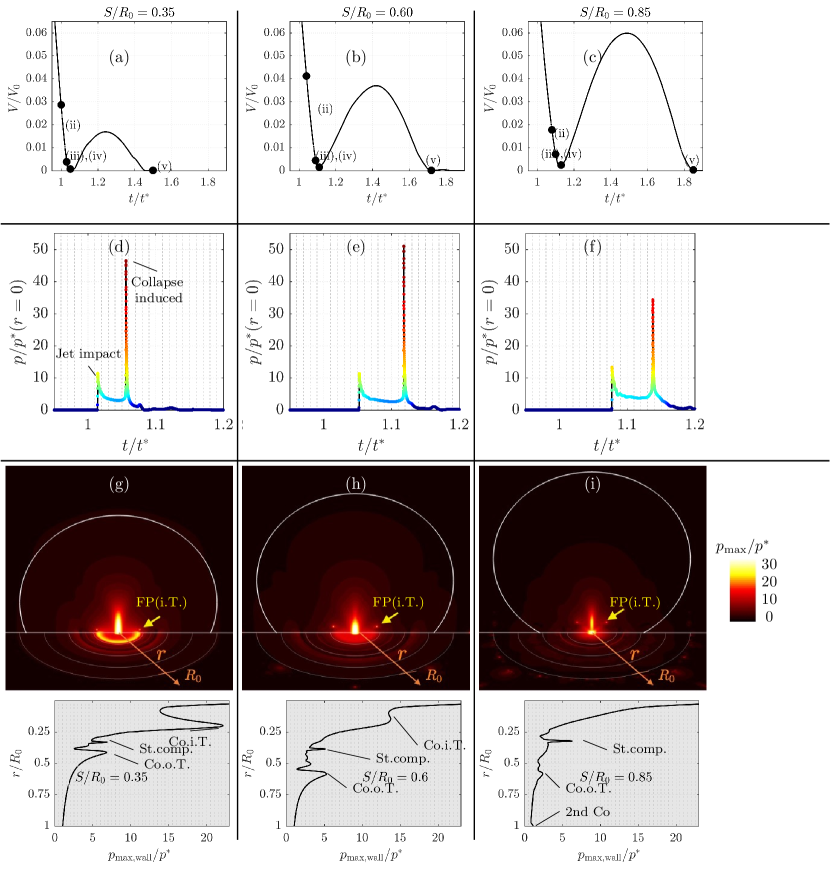
In the following, we analyze the collapse behavior of wall-attached bubbles with a positive stand-off distance. The general behavior is well known and depicted in Fig. 9 (b). Figure 5 shows time series for collapsing wall-attached bubbles in (a)–(c) and the corresponding wall-pressure-diagrams in (d)–(f). Figure 6 contains the temporal evolution of the bubble volume in (a)–(c), the wall-centered pressure signals in (d)–(f) and the distribution of the maximum pressure in (g)–(i).
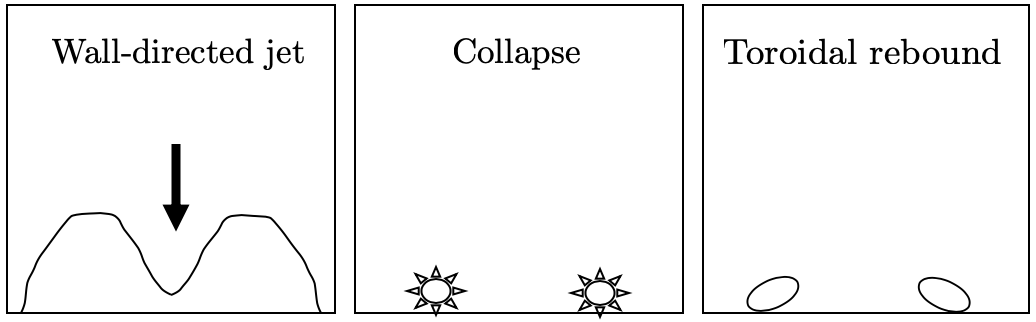
For all cases, a wall-directed jet forms during the initial collapse phase resulting in a toroidal bubble. With increasing stand-off distance, the bubble is more elongated in wall-normal direction, see Fig. 5 (a–c,ii). This observation was also reported by Philipp and Lauterborn [39]. When the jet hits the wall, it induces a pressure peak of about and afterwards moves radially outwards along the wall pushing the vapor away (see Fig. 5 (d)–(f) and Fig. 6 (d)–(f)). Consequently, the remaining torus is compressed from in- and outside. Then, the compression from outside is stopped, causing an outward propagating pressure wave and a first ring-shaped pressure impact on the wall (see Fig. 5 (a–c,iii), (d)–(f) labeled with ’St.compr.’). Afterwards, the collapse of the torus becomes increasingly non-uniform with a portion near the wall being pinched away from the main torus, as was also observed by Lindau and Lauterborn [29], Trummler et al. [62]. At subsequent time steps, the bubble fragments into an inner bulged part and an outer pinched away one, which can be seen best in Fig. 5 (c, iii). The inner part collapses first, emitting a pulse that travels radially inward, collides at the center, and continues in opposite direction (Fig. 5 (a–c,iv)). These processes are also obvious in the wall-pressure diagrams (see Fig. 5 (d)–(f) labeled with ’Co.i.T.’), especially at . The collapse of the inner torus induces the largest wall pressure (see also pressure signals Fig. 6 (d)–(f)), which matches the findings by Philipp and Lauterborn [39], Lauer et al. [25], Trummler et al. [62]. Then, the outer torus collapses emitting a less intense pressure wave propagating radially outwards, see wall-pressure-diagrams Fig. 5 (d)–(f) ’Co.o.T’. Note that at the smaller stand-off distances (), the collapse of the outer torus results in the minimum bubble volume , while at is correlated with the collapse of the inner torus and is slightly larger (Fig. 6 (c)). The subsequent rebound is toroidal and more pronounced at higher stand-off distances, see Fig. 6 (a)–(c). At the second collapse, the torus fragments more and therefore the induced pressure impacts are not circumferentially uniform, which can be seen in Fig. 5 (a–c,v).
Figure 6 (g)–(i) visualizes the distribution of . Along the centerline in the domain and at the wall center, the superposition of pressure waves leads to high values. Significant pressure peaks are also induced by the collapse of the inner torus (see ’FP(i.T.)’). At , this peak is closest to the wall and thus the wall pressure increase underneath it, located at , is most significant. At , that peak is attenuated and at no wall-pressure peak can be correlated to that collapse. The collapse of the outer torus causes a wall-pressure peak radially further outwards, which moves outwards and decreases with increasing . Further, for all cases, there is a spike at about associated with the abrupt stopping of the compression at the beginning (see Fig. 5 (a–c,iii)). The second collapse only causes a visible wall pressure increase at at .
4.4 Wall-detached bubbles
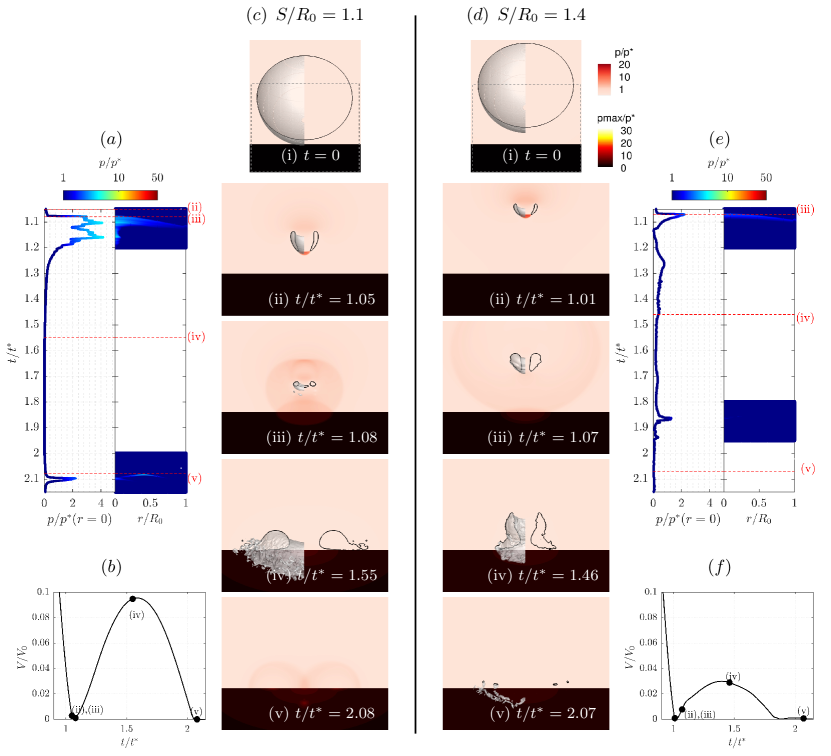
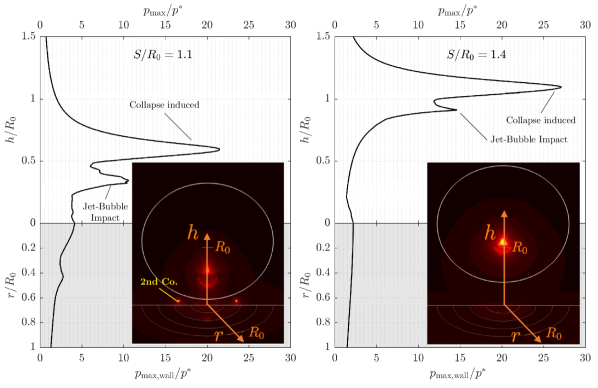
Figure 7 shows time series (c,d), wall-pressure-diagrams (a,e) and temporal bubble-volume evolutions (b,f) for collapsing wall-detached bubbles with and . The maximum pressure distributions are shown in Fig. 8.
The aspherical pressure distribution leads to the formation of a jet penetrating the bubble. The jet is stopped at the lower bubble side, emitting a pressure wave (Fig. 7 (c,d,ii)). At , the intensity of the pressure wave is stronger, and the torus is more flattened and the bubble volume is smaller at jet impact. All three observations can be explained by the reduced anisotropy at the increased stand-off distance [58]. The pressure wave at jet-bubble-impact propagates radially outwards, hits the wall and is reflected there (Fig. 7 (c,d,iv)). The impact on the wall is obvious in the wall-pressure-diagrams (Fig. 7 (a,e)) and responsible for the highest peak at the wall center. At , this wall-pressure increase is stronger since the jet-bubble-interaction is closer to the wall. Then, the first collapse takes place, followed by a rebound close to the wall (Fig. 7 (c,d,iv)). At the rebound volume is larger (see Fig. 7 (b,f)) and the second collapse results in a stronger impact on the wall (Fig. 7 (a), Fig. 8).
Figure 8 shows the distribution of the maximum pressure and the extracted data. The induced pressure peak by the jet-bubble-impact can be clearly seen. These values are in a range of , which corresponds to a jet velocity at impact of about (see Eq. 16) and agrees with the findings of e.g. Philipp and Lauterborn [39], Supponen et al. [58], Lauer et al. [25]. The highest maximum pressure in the domain is recorded on the centerline and caused by superposition of the pressure waves emitted at first collapse. At the wall, the highest maximum pressure occurs in the center and is due to the jet-bubble-impact (see Fig. 7 (a,e)). At , there is another peak at about caused by the second collapse.
| –0.35 | 0 | 0.35 | 0.6 | 0.85 | 1.1 | 1.4 | |
|---|---|---|---|---|---|---|---|
| 0.54 | 0.27 | 0.16 | 0.10 | ||||
| Shape | S | S | T | T | T | T | T |
| (cfp) 107.20 | 11.45 | 11.39 | 13.39 | 10.45 | 14.64 | ||
| (cfp) 107.20 | - | 11.45 | 11.39 | 13.39 | 4.20 | 2.30 | |
| 383.50 | 2687.00 | 30.00 | 33.00 | 22.00 | 10.00 | 20.00 | |
| 0.10 | 0.00 | 0.04 | 0.07 | 0.12 | 0.56 | 0.94 | |
| 0.22 | 0.22 | 0.15 | 0.12 | 0.07 | |||
| 0.33 | 0.21 | 0.15 | 0.11 | ||||
| 0.01 | 0.00 | 0.02 | 0.04 | 0.06 | 0.10 | 0.03 | |
| 107.20 | 2687.00 | 46.50 | 51.40 | 33.70 | 4.20 | 2.30 | |
| Mechanism | J | C | C | C | C | J | J |
4.5 Discussion and comparison
In the previous subsections, we observed distinctly different collapse and rebound behaviors for varying stand-off distances as illustrated in Fig. 9. Table 1 compares the bubble shape during collapse (spherical () or toroidal ()), the jet-induced pressure peaks , the collapse-induced pressure peaks (first collapse), the radial position and wall-normal position of the first collapse, the intensity of the rebound , the maximum wall pressure , and the mechanism causing the maximum wall pressure (jet () or collapse ()).
leads to a spherical collapse and to a toroidal one, where the torus is created by a wall-normal jet. When this jet hits the wall or the distal bubble side, it is abruptly stopped and induces a pressure peak (). The range of the estimated jet velocities (Eq. 16) agrees with data from the literature [58, 39, 42, 8]. The increasing jet velocity with increasing stand-off for matches the findings by Supponen et al. [58], Philipp and Lauterborn [39]. With respect to the impact of the jet on the wall () our simulations are in very good agreement with the data of Philipp and Lauterborn [39]. At a circumferential pinching takes place, which can also be interpreted as a lateral wall-parallel jet [25]. The collision of the fronts induces high peak values, here counted as and .
The collapse-induced pressure peak for spherical collapses with is significantly higher than for toroidal ones with . decays with increasing for , and then increases again for . This trend matches experimental findings for the intensity of the emitted pressure wave [66, 67, 57].
In addition to the intensity, the position of the collapse is also an interesting parameter. The radius of the collapsing torus decreases with increasing . Supponen et al. [58] found that the jet impact diameter correlates with the anisotropy parameter as , where reads for walls . Assuming , we can compare her findings with our data and observe the same trend, only that our values are slightly smaller (see Table 1). Moreover, our data for roughly match experimentally obtained damage radii of wall-attached bubbles of about [39]. The distance of the collapsing torus to the wall increases, as expected, with .
The maximum wall pressure depends on the intensity of the highest pressure and its relative position to the wall. At , the collapse takes place directly at the wall with an extremely high collapse-induced pressure peak, resulting in the highest for all . At , is induced by the collision of the circumferential jet and one order of magnitude smaller than at . For , decreases with increasing , is collapse-induced for wall-attached bubbles and jet-induced for wall-detached ones, and is two orders of magnitude smaller than at . The observed decrease of the maximum wall pressure with increasing stand-off distance matches experimental observations for wall-attached bubbles at atmospheric conditions [54, 55, 60] and is consistent with measured cavitation damage depths [39]. Further, our data is in an excellent agreement with numerically predicted maximum wall pressures for similar configurations [25, 62]. as a function of is also further discussed at the end of the next section.
Here we consider generic configurations of spherical bubbles that are cut or detached from the wall at different positions. In recent studies [27, 28], the growth phase of the bubbles was included, resulting in elliptical bubble shapes at maximum expansion for small stand-off distances. Additionally, surface tension was also taken into account. These studies provided new insights into the subsequent deformation of the bubble during collapse, leading to the formation of high velocity jets that can potentially induce high pressure peaks on the wall.
5 Effect of the grid resolution
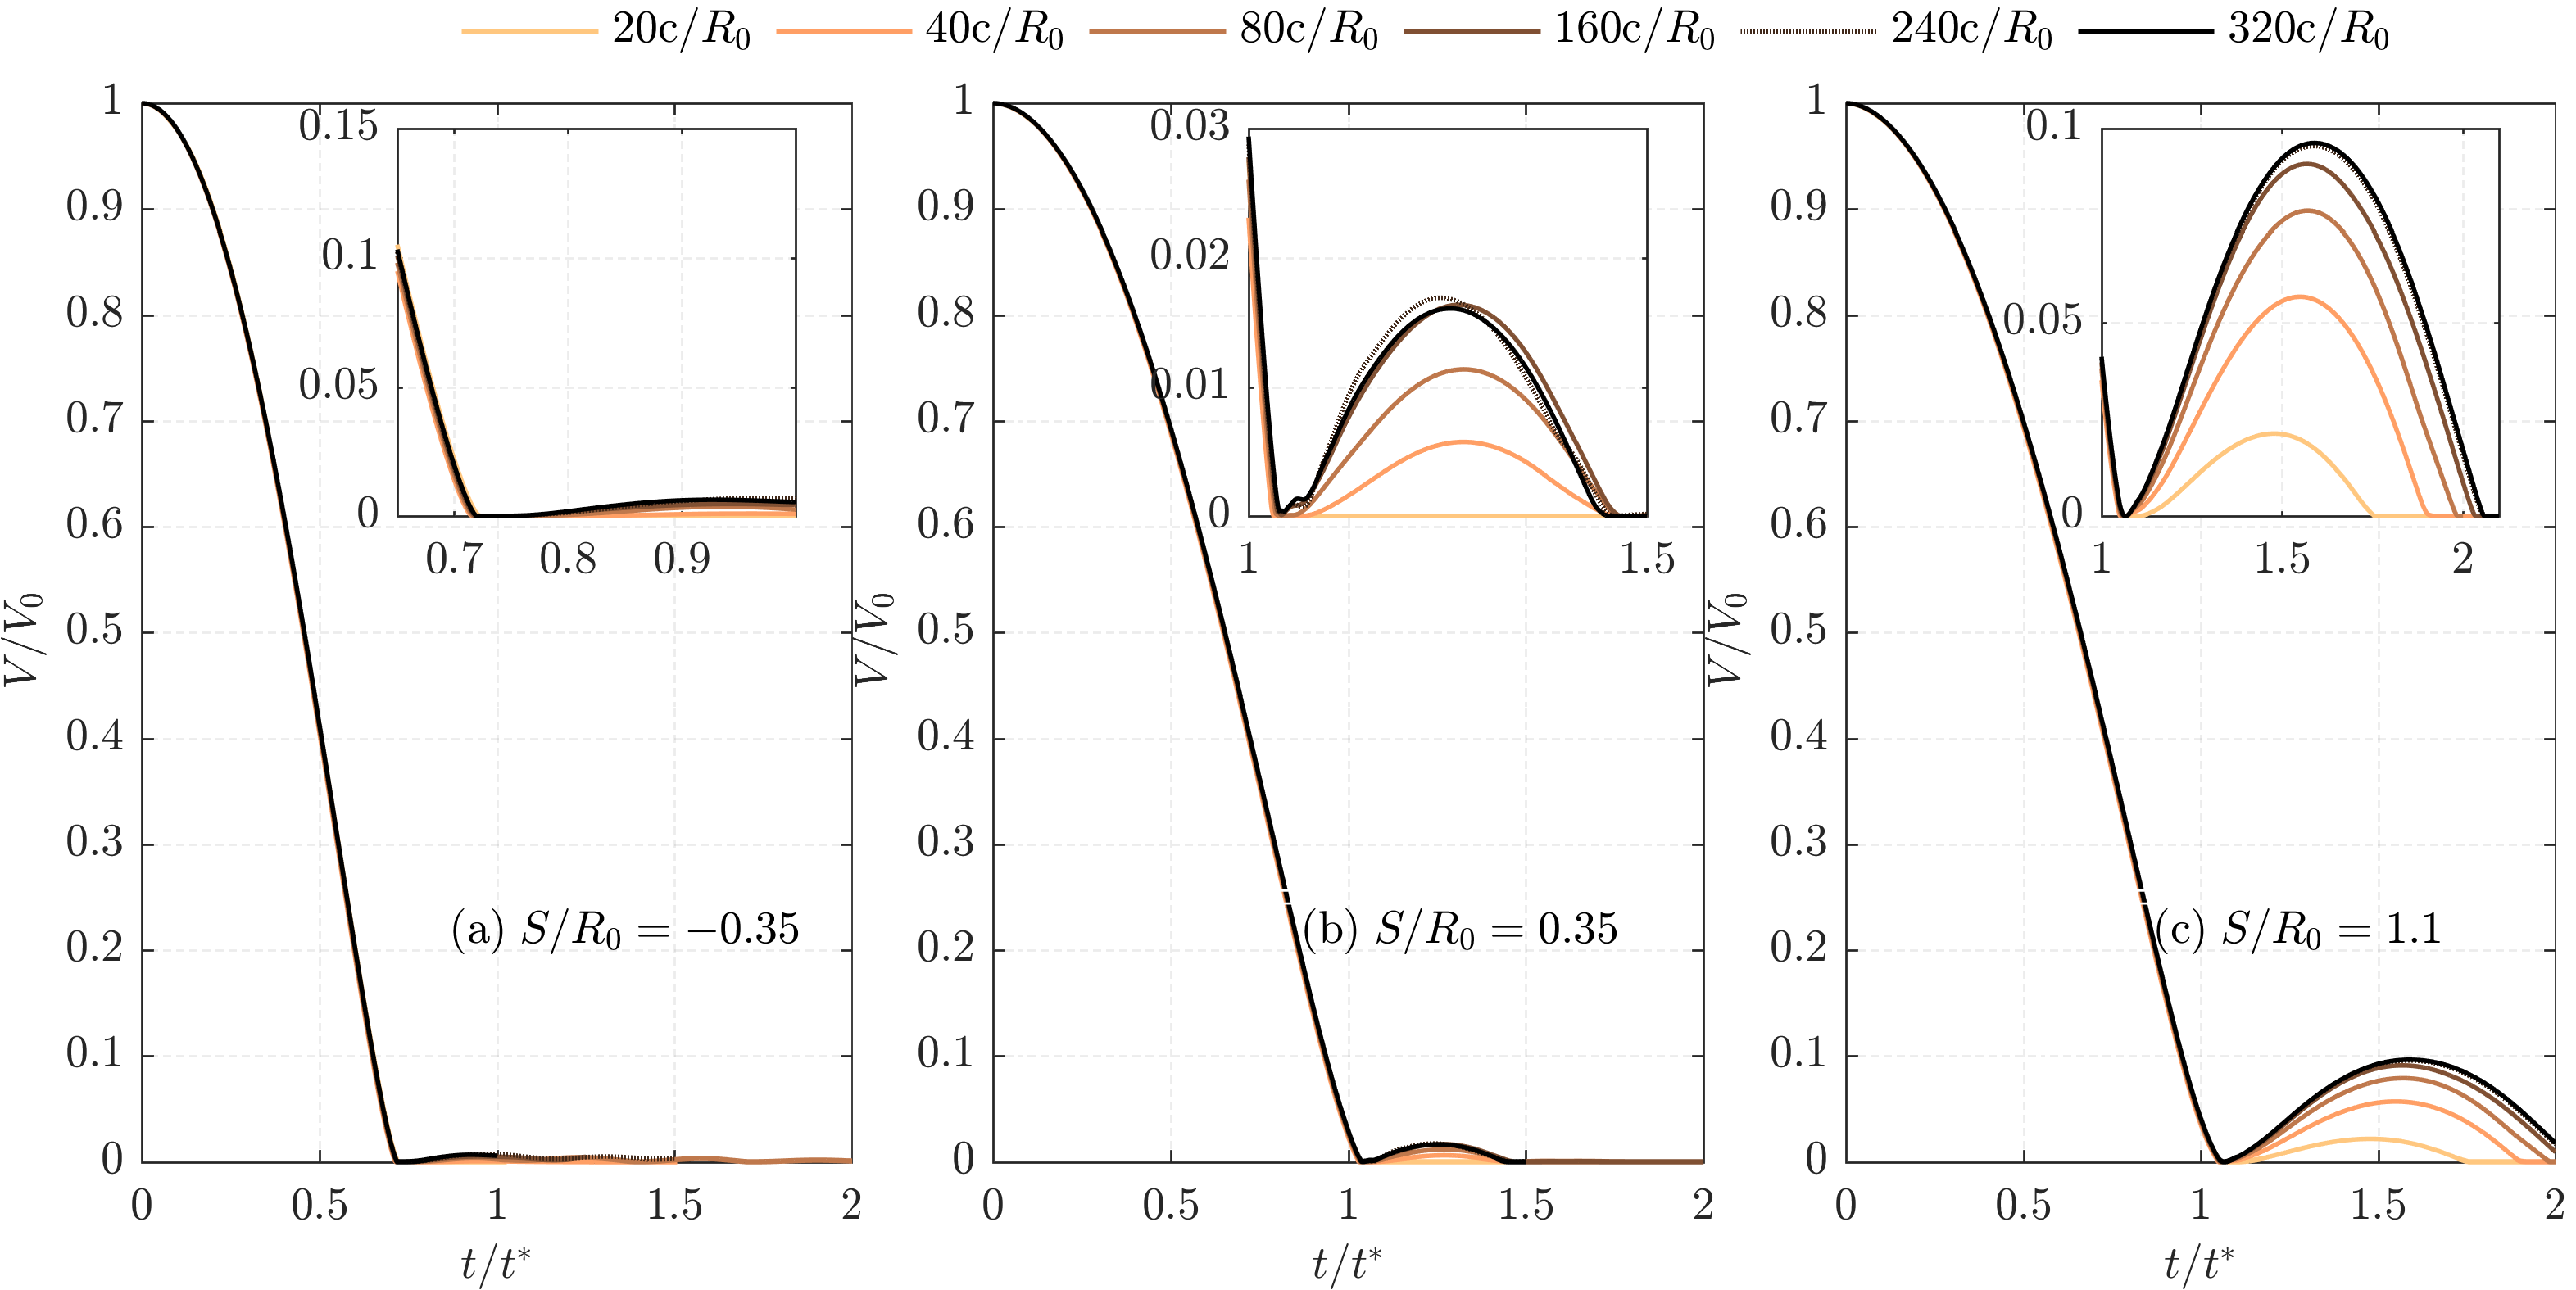
(a), (b), (c). Since does not fit into the sequence with 1:2 refinements, the data are shown with a dotted line.
The previous section has shown that there are different collapse behaviors, rebound intensities, and maximum pressure distributions for varying stand-off distances. In the following, we assess the effect of the grid resolution on these features. For this purpose, we have performed simulations with grid resolutions of and . Note that does not follow the otherwise present 1:2 refinement. The simulations with are that resource-intensive and produce such large amounts of data that the detailed analysis in the previous section would not have been feasible with that resolution, motivating the resolution of .
Figure 10 presents the temporal evolution of the bubble volume for different grid resolutions and stand-off distances. In our simulations, the time of minimum bubble volume is well captured for all grid resolutions, while the rebound is clearly grid dependent and converges for .
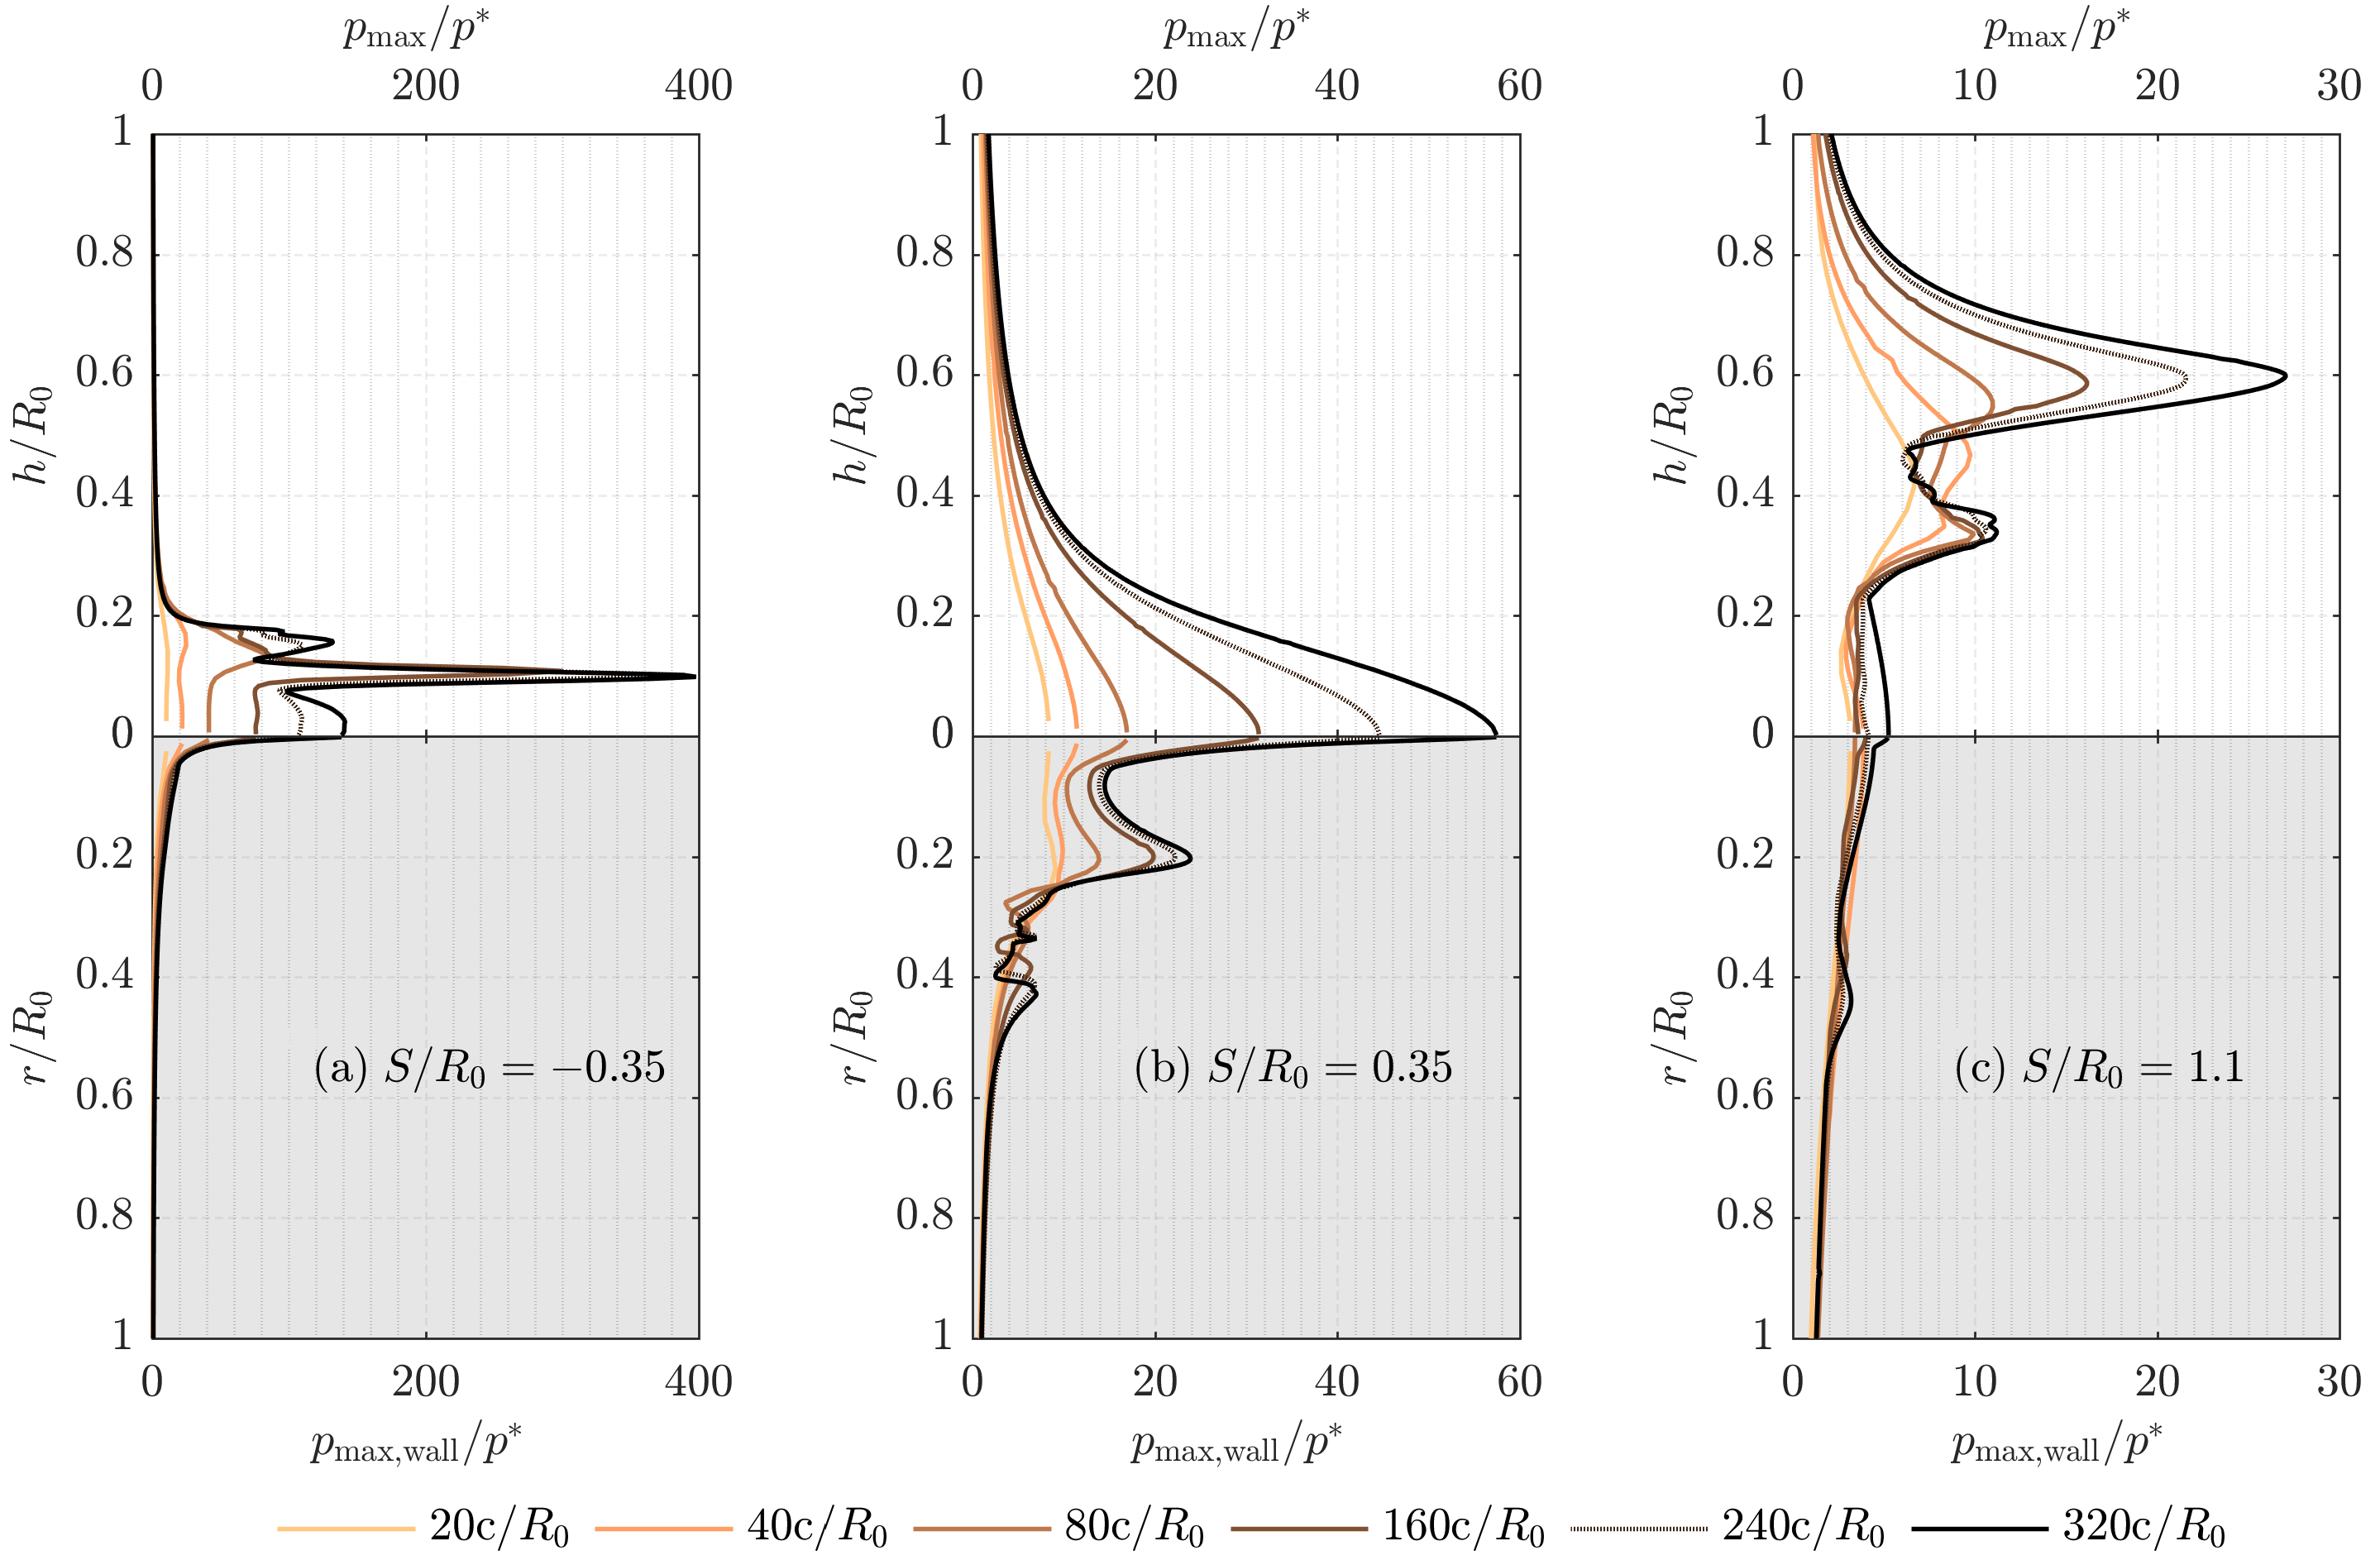
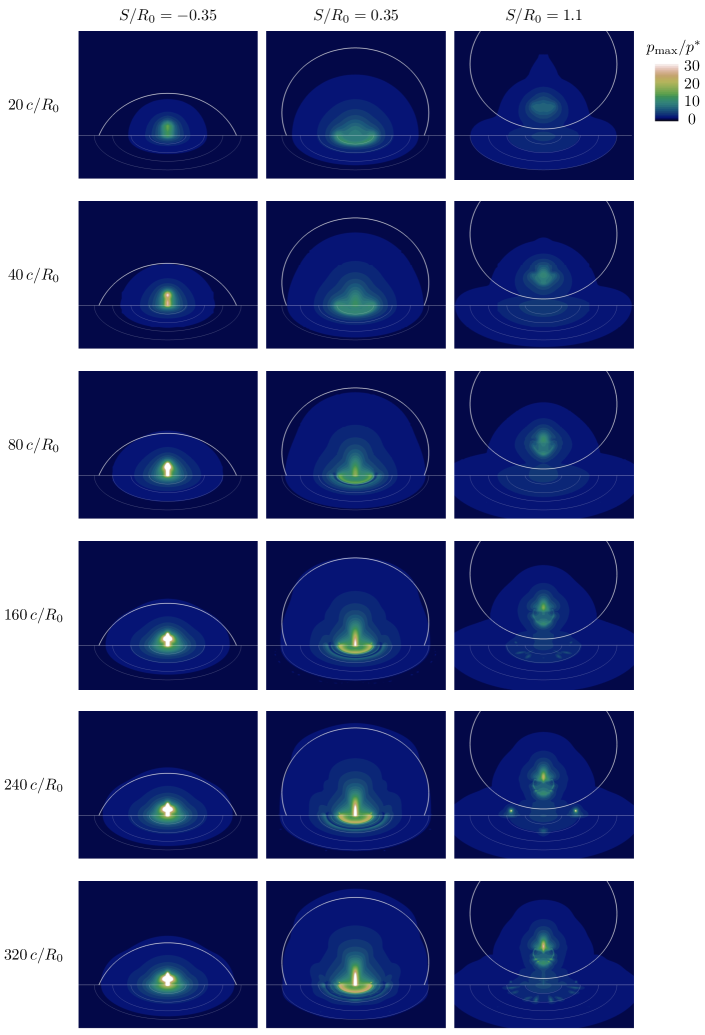
The peak pressures in the domain and at the wall are also affected by the grid resolution. Figure 11 shows the extracted maximum pressure on the centerline in the domain and the circumferentially averaged values at the wall and Figure 12 visualizes the maximum pressure distribution for the different grid resolutions.
At , there is a circumferential pinching of the bubble and a spherical collapse of the upper part with an offset to the wall, see Section 4.2. With increasing grid resolution, the focus point of the collapse moves closer to the wall. For , the wall-normal position of the focus point remains the same and only the peak value still increases. On the centerline beneath the focus point and directly at the wall, the maximum pressure is induced by the collision of the liquid fronts at circumferential pinching. Due to the acceleration of the liquid radially inwards, the smallest distance to the centerline, and thus the cell length, determines the maximum velocity and the induced peak pressure. For , the peak value at the wall center increases inversely proportional to the cell length. At higher resolutions this proportionality is no longer given, possibly due to viscous effects.
At , the first toroidal collapse induces the maximum pressure, see Section 4.3. The ring-shaped pressure impact on the wall caused by this collapse is already visible at and more pronounced at higher grid resolutions without changing its radial position (). At this stand-off distance, three radial pressure peaks occur in the maximum pressure distribution at the wall. As discussed in Section 4.3, these are induced by the stopped compression from outside (spike at ), the collapse of the inner torus () (the torus fragments into an inner and an outer one) and the collapse of the outer torus (). For , all three peaks are recorded and the wall pressure distribution converges, except for the peak value in the wall-center.
At the detached configuration (), a wall-directed jet pierces the bubble and a pressure peak is induced when the jet hits the distal bubble side. The subsequent collapse of the torus induces peak values on the centerline at . After the rebound, the second collapse takes place near the wall and induces a pressure impact on the wall at , see Section 4.4. The pressure peak caused by the jet-bubble-impact is visible for all grid resolutions except for the coarsest grid. For , this peak converges to , which coincides with the expected value (see Section 4.4). The collapse-induced peak on the centerline is again strongly grid-dependent. At the wall, the jet-bubble-impact induces a pressure peak in the center with little grid dependence. The ring-shaped pressure impact of the second collapse () is captured for . Its intensity and distribution depends on the grid resolution and grid orientation and is therefore not radially symmetric.
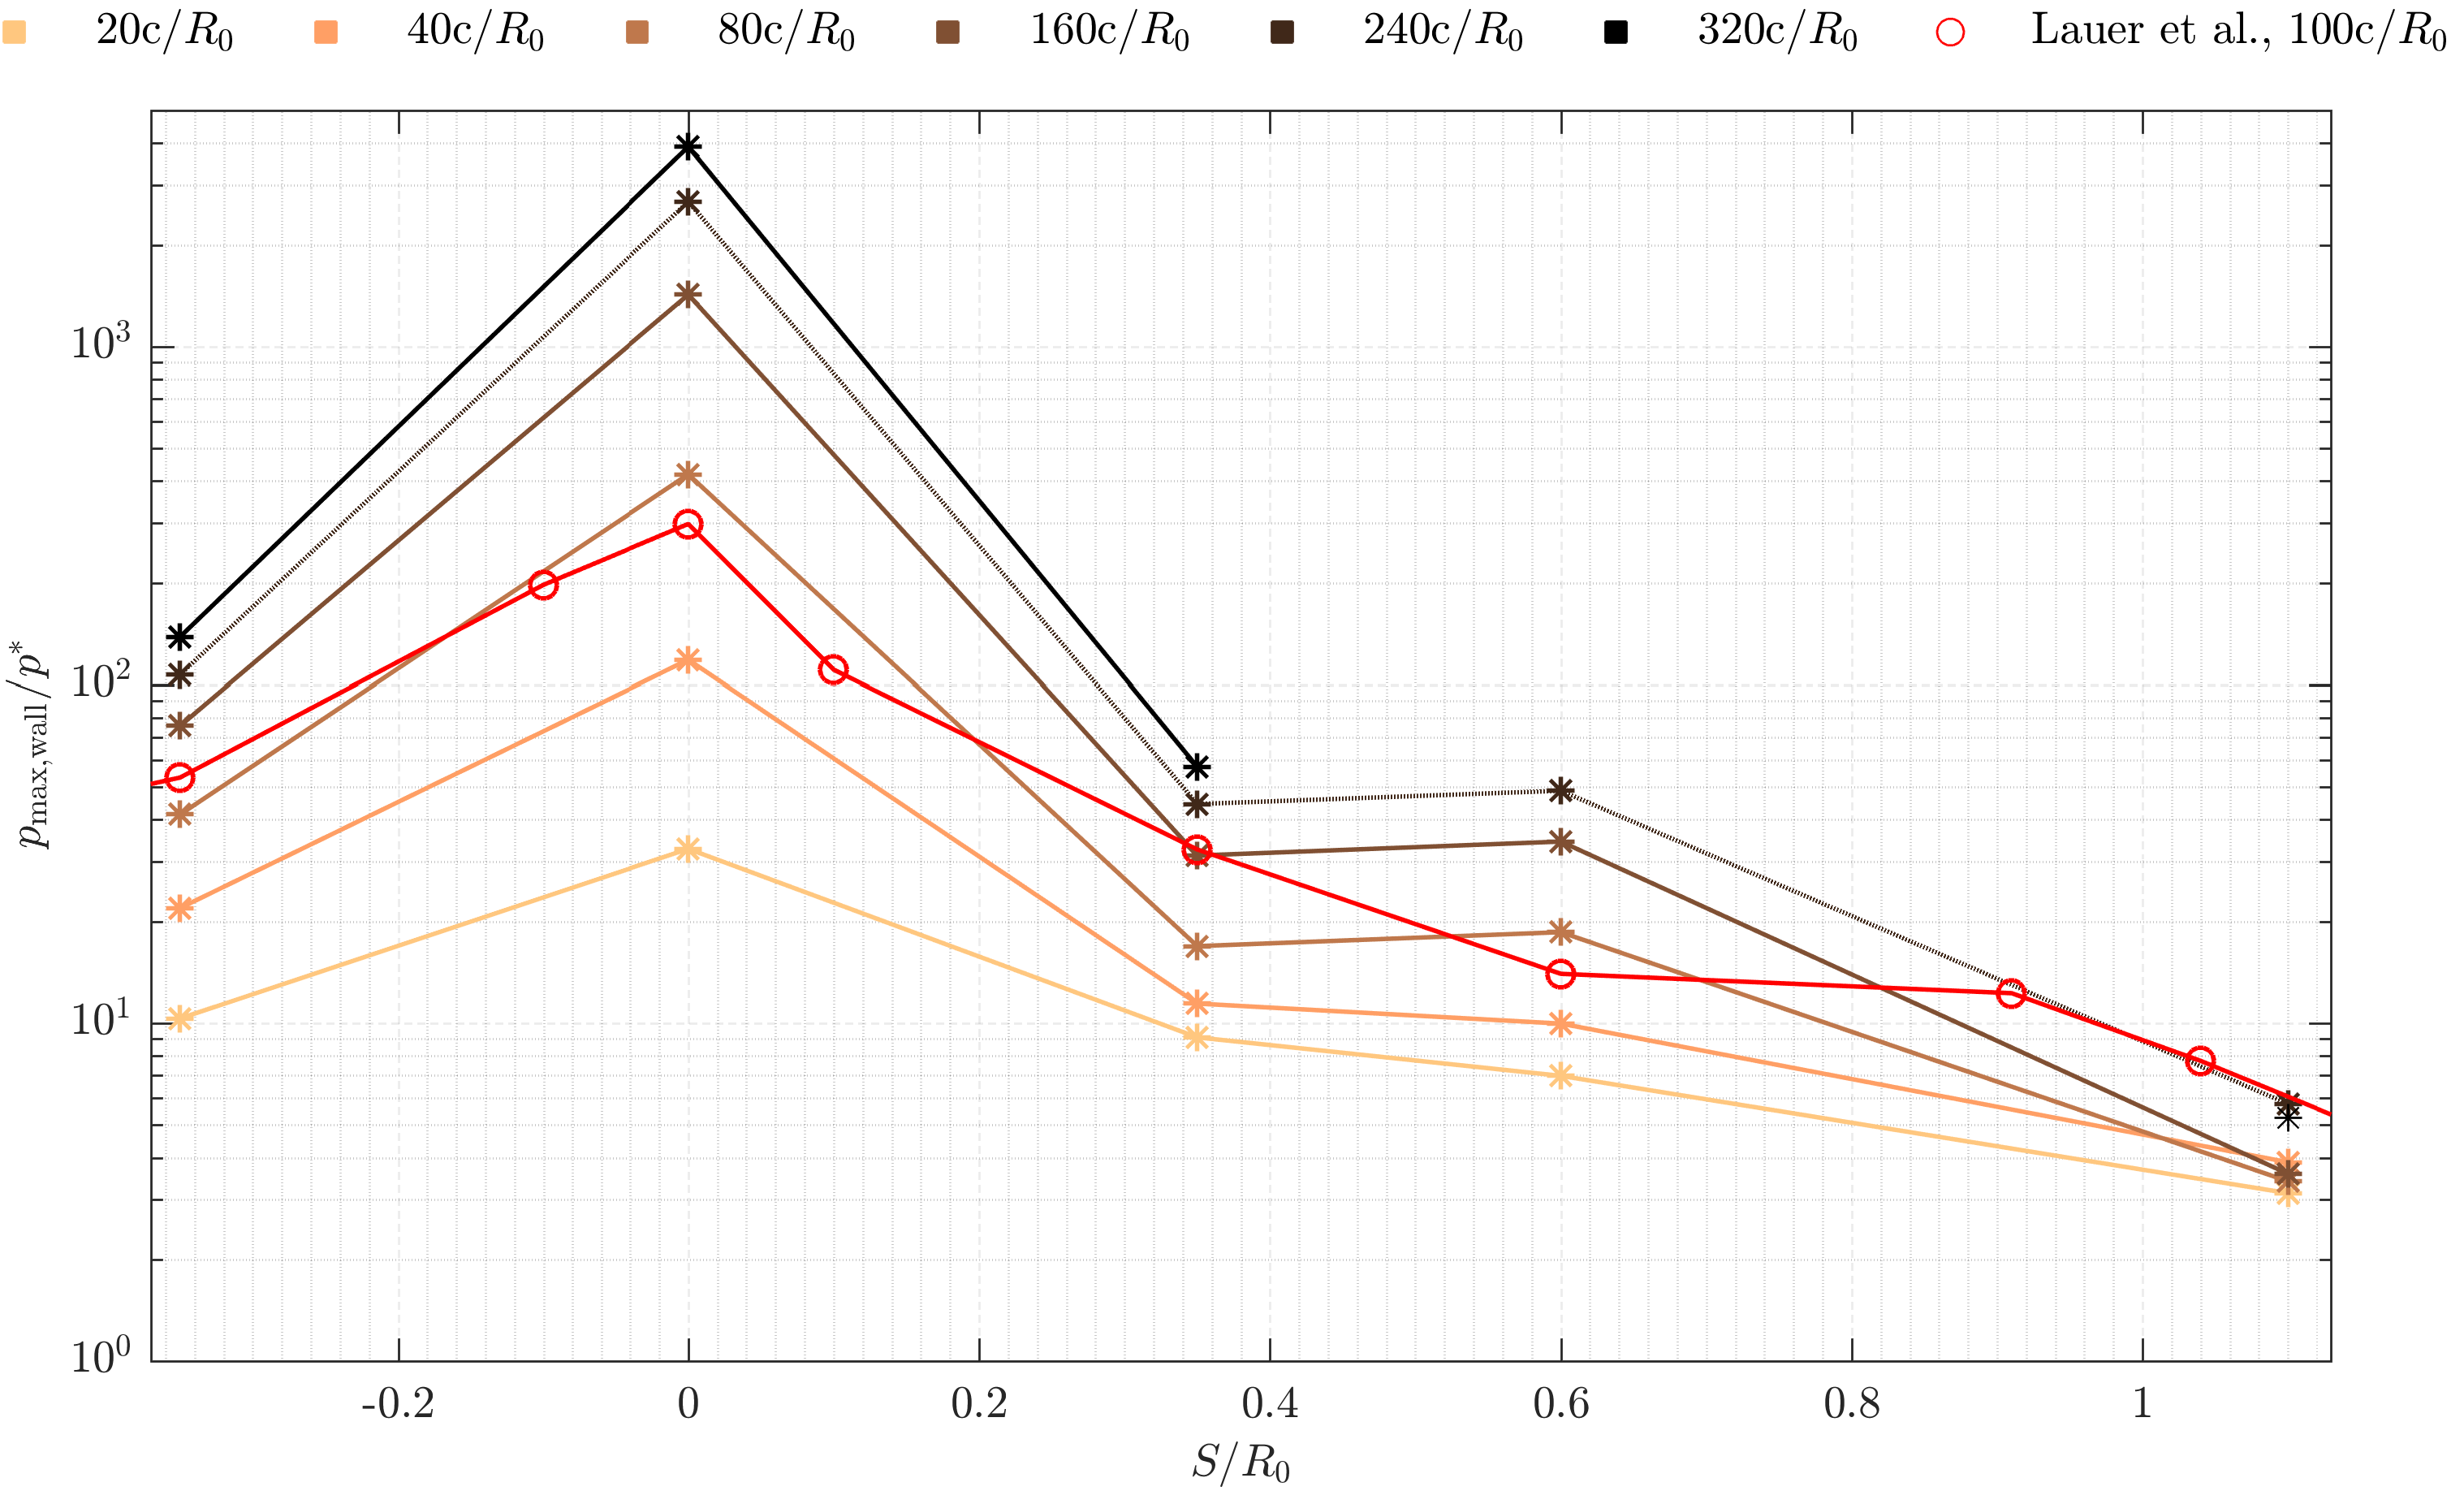
Figure 13 shows the maximum wall pressure for different grid resolutions and stand-off distances . At all configurations, the maximum pressure was recorded in the center. With an increasing absolute stand-off distance , decreases. This matches experimental and numerical investigations from the literature, see Section 4.5. Our data for are in good agreement with the reference data of Lauer et al. [25] with . Regarding grid dependence, we observe the following. For wall-attached bubbles, the increase in is approximately inversely proportional to the cell length, whereas for wall-detached bubbles is less grid dependent. Overall, the relative ratio of pressure peaks is comparable at identical grid resolutions and, consequently, the data obtained at a certain grid resolution allow for a comparative and qualitative assessment of the cavitation erosion potential.
In summary, the most important collapse features are already captured at the coarsest grid resolution of . The main features of the maximum pressure distribution, such as pronounced pressure peaks at toroidal collapses, are mostly resolved for and at higher resolutions mainly the intensity of the peaks changes. For the peak values, we observe that the values induced by a collision of accelerated liquid fronts or a collapse are approximately inversely proportional to the cell length, as also found by Mihatsch et al. [32]. Away from the focus point, the grid dependence of the maximum pressure vanishes, which is consistent with the observations of Schmidt et al. [50], Mihatsch [31]. For the rebound and the second collapse we find a strong grid dependence, but a convergence of the rebound volume for high grid resolutions.
A doubling of the grid resolution (1:2 refinement) leads for 3-D calculations to 8-times as many cells. Additionally, the average time step is inversely proportional to the cell length, thus doubling the number of iterations. Hence, a 1:2 grid refinement requires 16-times as many resources for an assumed ideal scaling. In fact, a finer grid requires even more resources, because the computing domain is typically distributed over more compute cores, resulting in additional communication overhead between the cores. This is the reason why quantitative estimates for resolution effects are pivotal for engineering predictions that typically are marginally resolved.
6 Conclusion
We have numerically investigated the collapse and rebound behavior and the erosion potential of vapor bubbles collapsing close to a wall. Contrary to most previous studies, we consider phase transition and thus also capture rebound processes. We have evaluated the maximum pressure in the domain and at the wall and additionally presented time-resolved wall pressure signals, which allow for the identification of the mechanism inducing the highest wall pressure peaks. For bubbles with a negative stand-off distance, the collision of the circumferential pinching induces the highest peak pressure at the wall. For wall-attached bubbles with a positive stand-off distance, the first collapse leads to the highest wall pressures, which are associated with the superposition of the emitted pressure waves in the center. For wall-detached bubbles, the highest pressure at the wall is induced by the pressure wave emitted at jet-bubble-impact and the second collapse can also cause a relevant increase in wall pressure.
Furthermore, the influence of the grid resolution on the collapse dynamics and the maximum pressures distribution was investigated. For this purpose, we have performed simulations of collapsing bubbles at different stand-off distances with grid resolutions from to . The grid study shows that the collapse behavior and the maximum pressure distribution are already captured with the coarsest resolution. With increasing resolution, the rebound and characteristic features of the maximum pressure distribution are better resolved and converge at higher resolutions (), except for the intensity of the peak values. In agreement with the literature, we found that peak values induced by a collision of accelerated liquid fronts scale approximately inversely proportional to the cell length. The presented comprehensive study provides a reference for choosing the required grid resolution at future simulations.
We were able to identify the decisive processes for wall pressure peaks induced by near-wall bubble collapses under high ambient pressure. Already at the considered ambient pressure of 100 bar, the rebound volume was up to 10% of the initial volume and significant wall pressure peaks were caused by the second collapse, which is in accordance with experimental observations that the second collapse can be decisive for cavitation erosion. In future studies, we plan to investigate the influence of the driving pressure difference on the collapse dynamics and erosion potential and to perform simulations under atmospheric conditions. This is motivated by the fact that at lower ambient pressures a stronger rebound [59] and thus higher pressure peaks at the second collapse are expected. Additionally, a better comparability with experimental studies would be given, since these are mainly conducted under atmospheric conditions [39, 13]. First numerical studies under atmospheric conditions were already presented in Trummler [61].
Declaration of Competing Interest
The authors declare that they have no known competing financial interests or personal relationships that could have appeared to influence the work reported in this paper.
Acknowledgment
The authors gratefully acknowledge the Gauss Centre for Supercomputing e.V. (www.gauss-centre.eu) for funding this project by providing computing time on the GCS Supercomputers SuperMUC and SuperMUC-NG at Leibniz Supercomputing Centre (www.lrz.de). N.A.A. acknowledges support through the ERC Advanced Grant NANOSHOCK (grant agreement No. 667483).
References
References
- Arndt [1981] Arndt, R. E., 1981. Cavitation in fluid machinery and hydraulic structures. Annual Review of Fluid Mechanics 13 (1), 273–326.
- Asi [2006] Asi, O., 2006. Failure of a diesel engine injector nozzle by cavitation damage. Engineering Failure Analysis 13 (7), 1126–1133.
- Beig et al. [2018] Beig, S. A., Aboulhasanzadeh, B., Johnsen, E., 2018. Temperatures produced by inertially collapsing bubbles near rigid surfaces. Journal of Fluid Mechanics 852, 105–125.
- Benjamin et al. [1966] Benjamin, T. B., Ellis, A. T., Bowden, F. P., 1966. The collapse of cavitation bubbles and the pressures thereby produced against solid boundaries. Philosophical Transactions for the Royal Society of London. Series A, Mathematical and Physical Sciences 260 (1110), 221–240.
- Besant [1859] Besant, W., 1859. A Treatise on Hydrostatics and Hydrodynamics. Deighton, Bell, London.
- Bohner et al. [2001] Bohner, M., Fischer, R., Gscheidle, R., 2001. Fachkunde Kraftfahrzeugtechnik. HaanGruiten, Verlag Europa-Lehrmittel.
- Brennen [1995] Brennen, C. E., 1995. Cavitation and bubble dynamics. Oxford University Press.
- Brujan et al. [2002] Brujan, E., Keen, G., Vogel, A., Blake, J., 2002. The final stage of the collapse of a cavitation bubble close to a rigid boundary. Physics of fluids 14 (1), 85–92.
- Brujan et al. [2005] Brujan, E.-A., Ikeda, T., Matsumoto, Y., 2005. Jet formation and shock wave emission during collapse of ultrasound-induced cavitation bubbles and their role in the therapeutic applications of high-intensity focused ultrasound. Physics in Medicine & Biology 50 (20), 4797.
- Budich et al. [2018] Budich, B., Schmidt, S. J., Adams, N. A., 2018. Numerical simulation and analysis of condensation shocks in cavitating flow. Journal of Fluid Mechanics 838, 759–813.
- Coussios and Roy [2008] Coussios, C. C., Roy, R. A., 2008. Applications of acoustics and cavitation to noninvasive therapy and drug delivery. Annu. Rev. Fluid Mech. 40, 395–420.
- Dijkink and Ohl [2008] Dijkink, R., Ohl, C.-D., 2008. Laser-induced cavitation based micropump. Lab on a Chip 8 (10), 1676–1681.
- Dular et al. [2019] Dular, M., Požar, T., Zevnik, J., et al., 2019. High speed observation of damage created by a collapse of a single cavitation bubble. Wear 418, 13–23.
- Egerer et al. [2014] Egerer, C. P., Hickel, S., Schmidt, S. J., Adams, N. A., 2014. Large-eddy simulation of turbulent cavitating flow in a micro channel. Physics of Fluids 26 (8), 085102.
- Egerer et al. [2016] Egerer, C. P., Schmidt, S. J., Hickel, S., Adams, N. A., 2016. Efficient implicit LES method for the simulation of turbulent cavitating flows. Journal of Computational Physics 316, 453–469.
- Franc and Michel [2005] Franc, J.-P., Michel, J.-M., 2005. Fundamentals of cavitation. Dordrecht: Springer science & Business media.
- Fujikawa and Akamatsu [1980] Fujikawa, S., Akamatsu, T., Apr. 1980. Effects of the non-equilibrium condensation of vapour on the pressure wave produced by the collapse of a bubble in a liquid. Journal of Fluid Mechanics 97 (03), 481–34.
- Hickling and Plesset [1964] Hickling, R., Plesset, M. S., 1964. Collapse and rebound of a spherical bubble in water. Physics of Fluids 7 (1), 7–14.
- Johnsen and Colonius [2009] Johnsen, E., Colonius, T., 2009. Numerical simulations of non-spherical bubble collapse. Journal of Fluid Mechanics 629, 231–32.
- Koch et al. [2017] Koch, M., Lechner, C., Reuter, F., hler, K. K., Mettin, R., Lauterborn, W., 2017. Numerical modeling of laser generated cavitation bubbles with the finite volume and volume of fluid method, using OpenFOAM. Computers and Fluids, 1–34.
- Koren [1993] Koren, B., 1993. A robust upwind discretization method for advection, diffusion and source terms. Centrum voor Wiskunde en Informatica Amsterdam.
- Koukouvinis et al. [2016] Koukouvinis, P., Gavaises, M., Georgoulas, A., Marengo, M., Mar. 2016. Compressible simulations of bubble dynamics with central-upwind schemes. International Journal of Computational Fluid Dynamics 30 (2), 129–140.
- Kröninger et al. [2009] Kröninger, D., Köhler, K., Kurz, T., Lauterborn, W., Sep. 2009. Particle tracking velocimetry of the flow field around a collapsing cavitation bubble. Experiments in Fluids 48 (3), 395–408.
- Kyriazis et al. [2017] Kyriazis, N., Koukouvinis, P., Gavaises, M., 2017. Numerical investigation of bubble dynamics using tabulated data. International Journal of Multiphase Flow 93, 158–177.
- Lauer et al. [2012] Lauer, E., Hu, X. Y., Hickel, S., Adams, N. A., 2012. Numerical modelling and investigation of symmetric and asymmetric cavitation bubble dynamics. Computers and Fluids 69 (C), 1–19.
- Lauterborn et al. [2018] Lauterborn, W., Lechner, C., Koch, M., Mettin, R., Jul. 2018. Bubble models and real bubbles: Rayleigh and energy-deposit cases in a Tait-compressible liquid. IMA Journal of Applied Mathematics 83 (4), 556–589.
- Lechner et al. [2019] Lechner, C., Lauterborn, W., Koch, M., Mettin, R., Feb. 2019. Fast, thin jets from bubbles expanding and collapsing in extreme vicinity to a solid boundary: A numerical study. Physical Review Fluids 4 (2), 021601.
- Lechner et al. [2020] Lechner, C., Lauterborn, W., Koch, M., Mettin, R., 2020. Jet formation from bubbles near a solid boundary in a compressible liquid: Numerical study of distance dependence. Physical Review Fluids 5 (9), 093604.
- Lindau and Lauterborn [2003] Lindau, O., Lauterborn, W., 2003. Cinematographic observation of the collapse and rebound of a laser-produced cavitation bubble near a wall. Journal of Fluid Mechanics 479, 327–348.
- Lord Rayleigh [1917] Lord Rayleigh, O. F., 1917. VIII. On the pressure developed in a liquid during the collapse of a spherical cavity. The London, Edinburgh, and Dublin Philosophical Magazine and Journal of Science 34 (200), 94–98.
- Mihatsch [2017] Mihatsch, M. S., 2017. Numerical prediction of erosion and degassing effects in cavitating flows. Ph.D. thesis, Technical University of Munich.
- Mihatsch et al. [2015] Mihatsch, M. S., Schmidt, S. J., Adams, N. A., 2015. Cavitation erosion prediction based on analysis of flow dynamics and impact load spectra. Physics of Fluids 27 (10), 103302–22.
- Naude and Ellis [1961] Naude, C. F., Ellis, A. T., 1961. On the mechanism of cavitation damage by nonhemispherical cavities collapsing in contact with a solid boundary. ASME Journal of Basic Engineering 83, 648–656.
- Ochiai et al. [2011] Ochiai, N., Iga, Y., Nohmi, M., Ikohagi, T., 2011. Numerical analysis of nonspherical bubble collapse behavior and induced impulsive pressure during first and second collapses near the wall boundary. Journal of Fluid Science and Technology 6 (6), 860–874.
- Ohl et al. [2006] Ohl, C.-D., Arora, M., Dijkink, R., Janve, V., Lohse, D., 2006. Surface cleaning from laser-induced cavitation bubbles. Applied Physics Letters 89 (7), 074102.
- Örley [2016] Örley, F., 2016. Numerical simulation of cavitating flows in diesel injection systems. Ph.D. thesis, Technical University of Munich.
- Örley et al. [2015] Örley, F., Trummler, T., Hickel, S., Mihatsch, M. S., Schmidt, S. J., Adams, N. A., 2015. Large-eddy simulation of cavitating nozzle flow and primary jet break-up. Physics of Fluids 27 (8), 086101–28.
- Payri et al. [2009] Payri, R., Salvador, F. J., Gimeno, J., de la Morena, J., 2009. Effects of nozzle geometry on direct injection diesel engine combustion process. Applied Thermal Engineering 29 (10), 2051–2060.
- Philipp and Lauterborn [1998] Philipp, A., Lauterborn, W., 1998. Cavitation erosion by single laser-produced bubbles. Journal of Fluid Mechanics 361, 75–116.
- Pishchalnikov et al. [2019] Pishchalnikov, Y. A., Behnke-Parks, W. M., Schmidmayer, K., Maeda, K., Colonius, T., Kenny, T. W., Laser, D. J., 2019. High-speed video microscopy and numerical modeling of bubble dynamics near a surface of urinary stone. The Journal of the Acoustical Society of America 146 (1), 516–531.
- Pishchalnikov et al. [2003] Pishchalnikov, Y. A., Sapozhnikov, O. A., Bailey, M. R., Williams Jr., J. C., Cleveland, R. O., Colonius, T., Crum, L. A., Evan, A. P., McAteer, J. A., 2003. Cavitation bubble cluster activity in the breakage of kidney stones by lithotripter shockwaves. Journal of Endourology 17 (7), 435–446.
- Plesset and Chapman [1971] Plesset, M. S., Chapman, R. B., 1971. Collapse of an initially spherical vapour cavity in the neighbourhood of a solid boundary. Journal of Fluid Mechanics 47 (2), 283–290.
- Pöhl et al. [2015] Pöhl, F., Mottyll, S., Skoda, R., Huth, S., 2015. Evaluation of cavitation-induced pressure loads applied to material surfaces by finite-element-assisted pit analysis and numerical investigation of the elasto-plastic deformation of metallic materials. Wear 330-331, 618–628.
- Rasthofer et al. [2019] Rasthofer, U., Wermelinger, F., Karnakov, P., Šukys, J., Koumoutsakos, P., 2019. Computational study of the collapse of a cloud with 12 500 gas bubbles in a liquid. Physical Review Fluids 4 (6), 063602.
- Reuter et al. [2017] Reuter, F., Gonzalez-Avila, S. R., Mettin, R., Ohl, C.-D., 2017. Flow fields and vortex dynamics of bubbles collapsing near a solid boundary. Physical Review Fluids 2 (6), 51–34.
- Roe [1986] Roe, P. L., 1986. Characteristic-based schemes for the euler equations. Annual Review of Fluid Mechanics 18 (1), 337–365.
- Sagar and el Moctar [2020] Sagar, H. J., el Moctar, O., 2020. Dynamics of a cavitation bubble near a solid surface and the induced damage. Journal of Fluids and Structures 92, 102799.
- Schmidmayer et al. [2020] Schmidmayer, K., Bryngelson, S. H., Colonius, T., 2020. An assessment of multicomponent flow models and interface capturing schemes for spherical bubble dynamics. Journal of Computational Physics 402 (109080).
- Schmidt [2015] Schmidt, S. J., 2015. A low mach number consistent compressible approach for simulation of cavitating flows. Ph.D. thesis, Technical University of Munich, Technical University of Munich.
- Schmidt et al. [2014] Schmidt, S. J., Mihatsch, M. S., Thalhamer, M., Adams, N. A., 2014. Assessment of erosion sensitive areas via compressible simulation of unsteady cavitating flows. In: Kim, K.-H., Chahine, G., Franc, J.-P., Karimi, A. (Eds.), Advanced experimental and numerical techniques for cavitation erosion prediction. Springer, pp. 329–344.
- Schmidt et al. [2006] Schmidt, S. J., Sezal, I. H., Schnerr, G. H., 2006. Compressible simulation of high-speed hydrodynamics with phase change. In: Proceedings of the European Conference on Computational Fluid Dynamics.
- Schnerr et al. [2008] Schnerr, G. H., Sezal, I. H., Schmidt, S. J., Apr. 2008. Numerical investigation of three-dimensional cloud cavitation with special emphasis on collapse induced shock dynamics. Physics of Fluids 20 (4), 040703–10.
- Shima and Nakajima [1977] Shima, A., Nakajima, K., 1977. The collapse of a non-hemispherical bubble attached to a solid wall. Journal of Fluid Mechanics 80 (02), 369–23.
- Shima et al. [1983] Shima, A., Takayama, K., Tomita, Y., Ohsawa, N., 1983. Mechanism of impact pressure generation from spark-generated bubble collapse near a wall. AIAA Journal 21 (1), 55–59.
- Shima et al. [1984] Shima, A., Tomita, Y., Takahashi, K., 1984. The collapse of a gas bubble near a solid wall by a shock wave and the induced impulsive pressure. Proceedings of the Institution of Mechanical Engineers, Part C: Journal of Mechanical Engineering Science 198 (2), 81–86.
- Supponen et al. [2018] Supponen, O., Obreschkow, D., Farhat, M., 2018. Rebounds of deformed cavitation bubbles. Physical Review Fluids 3 (10), 103604.
- Supponen et al. [2017] Supponen, O., Obreschkow, D., Kobel, P., Tinguely, M., Dorsaz, N., Farhat, M., 2017. Shock waves from nonspherical cavitation bubbles. Physical Review Fluids 2 (9), 093601.
- Supponen et al. [2016] Supponen, O., Obreschkow, D., Tinguely, M., Kobel, P., Dorsaz, N., Farhat, M., 2016. Scaling laws for jets of single cavitation bubbles. Journal of Fluid Mechanics 802, 263–293.
- Tinguely et al. [2012] Tinguely, M., Obreschkow, D., Kobel, P., Dorsaz, N., de Bosset, A., Farhat, M., 2012. Energy partition at the collapse of spherical cavitation bubbles. Physical Review E, 1–7.
- Tomita and Shima [1986] Tomita, Y., Shima, A., 1986. Mechanisms of impulsive pressure generation and damage pit formation by bubble collapse. Journal of Fluid Mechanics 169, 535–564.
- Trummler [2021] Trummler, T., 2021. Numerical investigations of cavitation phenomena. Ph.D. thesis, Technical University of Munich.
- Trummler et al. [2020a] Trummler, T., Bryngelson, S. H., Schmidmayer, K., Schmidt, S. J., , Colonius, T., Adams, N. A., 2020a. Near-surface dynamics of a gas bubble collapsing above a crevice. Journal of Fluid Mechanics, accepted May 2020., 1–21.
- Trummler et al. [2018a] Trummler, T., Freytag, L., Schmidt, S. J., Adams, N. A., 2018a. Large-eddy simulation of a collapsing vapor bubble containing non-condensable gas. In: Katz, J. (Ed.), Proceedings of the 10th International Symposium on Cavitation CAV. ASME Press, pp. 656–659.
- Trummler et al. [2018b] Trummler, T., Rahn, D., Schmidt, S. J., Adams, N. A., 2018b. Large eddy simulations of cavitating flow in a step nozzle with injection into gas. Atomization and Sprays 28 (10), 931–955.
- Trummler et al. [2020b] Trummler, T., Schmidt, S. J., Adams, N. A., 2020b. Investigation of condensation shocks and re-entrant jet dynamics in a cavitating nozzle flow by Large-Eddy Simulation. International Journal of Multiphase Flow 125, 103215.
- Vogel and Lauterborn [1988] Vogel, A., Lauterborn, W., 1988. Acoustic transient generation by laser-produced cavitation bubbles near solid boundaries. The Journal of the Acoustical Society of America 84 (2), 719–731.
- Vogel et al. [1989] Vogel, A., Lauterborn, W., Timm, R., 1989. Optical and acoustic investigations of the dynamics of laser-produced cavitation bubbles near a solid boundary. Journal of Fluid Mechanics 206, 299–338.
- Zupanc et al. [2012] Zupanc, M., Kosjek, T., Petkovšek, M., Dular, M., Kompare, B., Širok, B., Blažeka, Ž., Heath, E., 2012. Removal of pharmaceuticals from wastewater by biological processes, hydrodynamic cavitation and uv treatment. Ultrasonics - Sonochemistry, 1–49.