On the relationship between gas content, star-formation, and global H i asymmetry of galaxies on the star-forming main-sequence
Abstract
Observations have revealed that disturbances in the cold neutral atomic hydrogen (H i) in galaxies are ubiquitous, but the reasons for these disturbances remain unclear. While some studies suggest that asymmetries in integrated H i spectra (‘global H i asymmetry’) are higher in H i-rich systems, others claim that they are preferentially found in H i-poor galaxies. In this work, we utilise the ALFALFA and xGASS surveys, plus a sample of post-merger galaxies, to clarify the link between global H i asymmetry and the gas properties of galaxies. Focusing on star-forming galaxies in ALFALFA, we find that elevated global H i asymmetry is not associated with a change in the H i content of a galaxy, and that only the galaxies with the highest global H i asymmetry show a small increase in specific star-formation rate (sSFR). However, we show that the lack of a trend with H i content is because ALFALFA misses the ‘gas-poor’ tail of the star-forming main-sequence. Using xGASS to obtain a sample of star-forming galaxies that is representative in both sSFR and H i content, we find that global H i asymmetric galaxies are typically more gas-poor than symmetric ones at fixed stellar mass, with no change in sSFR. Our results highlight the complexity of the connection between galaxy properties and global H i asymmetry. This is further confirmed by the fact that even post-merger galaxies show both symmetric and asymmetric H i spectra, demonstrating that merger activity does not always lead to an asymmetric global H i spectrum.
keywords:
galaxies: evolution – galaxies: ISM – galaxies: star formation – galaxies: kinematics and dynamics – radio lines: galaxies1 Introduction
The interstellar medium in star-forming galaxies is dominated by neutral atomic hydrogen (H i), which exists in a thin, rotationally supported disc. As H i is typically detectable to galactocentric radii a factor of 2-3 times higher than the bright optical component of galaxies (e.g. Wang et al., 2014), it is a sensitive tracer of external environmental mechanisms such as ram-pressure stripping or tidal interactions. The impact of these mechanisms is apparent in spatially resolved H i observations as asymmetric distributions of H i gas or deviations from ordered kinematics (e.g. Swaters et al., 1999; Chung et al., 2007), but the vast majority of H i observations are only spectrally (and not spatially) resolved. Global H i spectra carry little direct spatial information about the gas, but the signature of a disturbance nonetheless can be encoded in the shape of the emission line profile (e.g. Walter et al., 2008; de Blok et al., 2020; Reynolds et al., 2020a). Quantifying and interpreting these disturbances in global H i spectra, their relationship to galaxy properties, and whether they can be used to identify different evolutionary processes is vital to fully utilising the next generation of blind H i surveys, which are predicted to detect over 500 000 global H i spectra (Koribalski et al., 2020).
Disturbances in the H i reservoirs in galaxies, measured through quantified asymmetry of global H i spectra (from here ‘global H i asymmetry’), are commonplace (Richter & Sancisi, 1994; Haynes et al., 1998; Espada et al., 2011), as per cent of galaxies show significant global H i asymmetry after correcting for noise effects (Watts et al., 2020a). This has lead to numerous physical processes being proposed as their driving mechanisms, such as tidal interactions, gas accretion or removal, and lopsided dark matter haloes (see the review by Jog & Combes, 2009, and references therein). In the isolated environment, a higher rate of global H i asymmetry has been found in late-type galaxies, which are typically more gas-rich (Matthews et al., 1998; Haynes et al., 1998; Espada et al., 2011). Galaxy pairs have been found to show higher global H i asymmetry compared to isolated galaxies (Bok et al., 2019), and Ellison et al. (2018) found that post-merger galaxies are systematically H i-rich at fixed stellar mass. This has lead to the interpretation that H i asymmetry is higher in more gas-rich systems; and that gas accretion, which is stochastic in the local Universe (Sancisi et al., 2008), or accretion events such as mergers, could be the driving mechanisms.
However, recent work by Reynolds et al. (2020b) utilising 1167 galaxies limited to the gas-rich regime from the H i Parkes All-Sky Survey (HIPASS, Barnes et al., 2001; Meyer et al., 2004; Wong et al., 2006) found no strong correlation between global H i asymmetry and H i content. An even more extreme result was found by Watts et al. (2020a), who analysed global H i asymmetry in the extended GALEX Arecibo SDSS Survey (xGASS, Catinella et al., 2018) and found that global H i asymmetries are actually more common in H i-poor galaxies. This apparent contradiction between the results of Watts et al. (2020a), Reynolds et al. (2020b), and the higher asymmetry rates of late-type isolated galaxies and mergers likely originates from the different sample selections in these studies, and the galaxy environments to which they are sensitive. xGASS detects galaxies down to H i mass-fractions () of per cent in large group to small cluster environments, while isolated late-type galaxies and mergers are typically gas-rich systems. This demonstrates the need to quantify the relationship between galaxy properties and global H i asymmetry in systems that are not strongly affected by environment, namely gas-rich, star-forming galaxies.
In this work, we show how previous results are not in contradiction with each other once sample selection is taken into account. We take advantage of the Arecibo Legacy Fast ALFA (ALFALFA, Giovanelli et al., 2005; Haynes et al., 2018) blind H i survey, which by construction is biased toward detecting the most H i-rich objects in its volume, and thus samples the H i-rich regime with high statistics. We also include a sample of post-merger galaxies (Ellison et al., 2018) to explore the parameter space of systems undergoing strong gravitational interactions and the xGASS sample of Watts et al. (2020a) for context outside the gas-rich regime. By combining these three samples, our data are specifically designed to span a comprehensive range in H i fractions and level of disturbance. Utilising this, we aim to determine how the H i and star-formation content of galaxies change as a function of their global H i asymmetry.
This paper is formatted as follows. In §2 we describe our three data-sets, and in §3 we describe our spectrum fitting, asymmetry measurements, quality cuts, population selections, and our method of comparing galaxy populations. Our results are presented in §4, and in §5 we discuss them in context with the literature, and conclude. All distance-dependant quantities in this work are computed assuming a flat -Cold Dark Matter cosmology with , and .
2 Datasets
2.1 ALFALFA sample
We identified the best optical counterparts in The Sloan Digital Sky Survey (SDSS, York et al., 2000) DR7 spectroscopic catalogue (Abazajian et al., 2009) to ALFALFA detected (code=1) sources (Haynes et al., 2018) within 10", and selected galaxies also covered by the GALEX-SDSS-Wise Legacy Master Catalogue (GSWLC-X2, Salim et al., 2016, 2018) within the following tolerances:
-
•
-
•
The stellar mass-selection is defined to cover the same range as xGASS (see 2.2); and the redshift selection is defined to avoid significant contributions from peculiar motions to recessional velocity measurements below , and the frequency range of the San Juan airport radar affecting ALFALFA observations above . In 3.1, we employ further selection cuts to make sure our results are not affected by artefacts in the data. We use stellar masses and star-formation rates (SFR) from the GSWLC-X2 catalogue as SFRs have been estimated using energy-balance constrained fitting of the UV/optical spectral energy distribution, plus infra-red luminosity of galaxies, as described in Salim et al. (2018). This is to avoid underestimation of the SFR derived from the centrally-targeted SDSS fibre spectra in some massive star-forming galaxies (e.g. Cortese et al., 2020), which can host passive bulges at their centre while star-formation proceeds as normal in the disc. The GSWLC-X2 catalogue is produced from the deepest UV data for each object in the GALEX shallow, medium, and deep catalogues, and is suited to studies of the star-forming main-sequence where UV emission is bright.
2.2 xGASS sample
xGASS (Catinella et al., 2018) is a stellar mass- and redshift-selected sample of 1179 galaxies in the ranges and . The parent sample is the overlap of the SDSS DR7 spectroscopic survey, the GALEX Medium Imaging Survey (Martin et al., 2005), and ALFALFA footprints. Galaxies not detected by ALFALFA were re-observed with targeted Arecibo observations until detected, or until an upper limit of per cent in was reached (depending on galaxy stellar mass), making xGASS the deepest observations of cold gas in a representative sample of galaxies in the local Universe. Stellar masses in xGASS are from the Max Planck Institute for Astrophysics (MPA)/Johns Hopkins University (JHU) value-added catalogues (VAC) based on SDSS DR7, and SFRs are calculated from GALEX near-UV (NUV) plus Wide-field Infrared Survey Explorer (WISE, Wright et al., 2010) mid-infrared (MIR) fluxes as described in Janowiecki et al. (2017), and are comparable to the GSWLC-X2 catalogue used for ALFALFA. In this work, we use the sub-sample of xGASS detections presented in Watts et al. (2020a). Briefly, from the 804 xGASS detections (formal and marginal), seven galaxies were removed due to RFI overlapping the H i spectrum, and 108 H i confused galaxies were removed using the confusion flags in the xGASS catalogue as the detected H i is not meaningfully associated with the optical target. This left 689 galaxies in our xGASS sample, which we refine in 3.1.
2.3 Post-merger galaxies
We include a sample of merging galaxies identified as being in the post-coalescence phase (post-mergers) as presented and described in Ellison et al. (2018). Briefly, the sample consists of systems with and redshift compiled from: post-mergers identified in the Galaxy Zoo project by Darg et al. (2010) with extra quality control by Ellison et al. (2013), visual classification of SDSS galaxies by Nair & Abraham (2010), and visual inspection of galaxies with Simard et al. (2011) -band asymmetry by Ellison et al. (2018). Post-mergers without archival H i detections were re-observed with Arecibo using the same survey design as xGASS, resulting in a sample of 86 post-mergers with H i detections. We cross-matched these galaxies with GSWLC-X2 to get stellar masses and SFRs consistent with our ALFALFA sample, leaving 75 galaxies.
3 Measurements and population selections
3.1 Spectrum fitting and asymmetry measurement
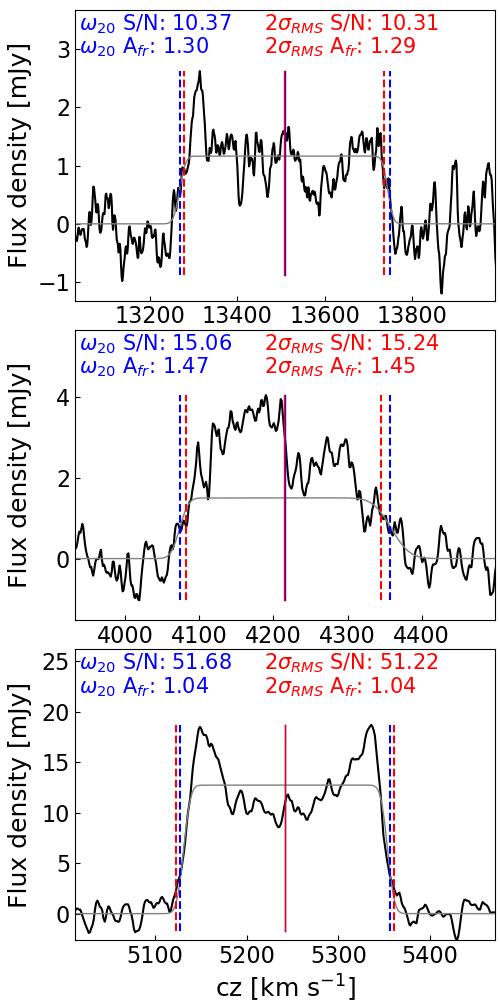
As in Watts et al. (2020a), we use the busy function (Westmeier et al., 2014) to parameterise our H i spectra. However, here we only use the fits to identify the edges of each spectrum, without attempting to optimise the fit to the shape of the H i profile. Examples of busy function fits can be seen in Fig. 1 as thin, grey lines. We define lower- () and upper- () velocity limits for the spectra as where the busy function fit equals twice the RMS noise (), measured in the signal-free part of the data, and taking the difference of these limits we measure the velocity width () and integrating between them we measure the integrated flux ().
We computed the median and median absolute deviation (multiplied by 1.4826 to convert to a standard deviation, ) of the difference between our measurements and the ALFALFA catalogue values, and selected any spectra with more than a 1 difference from the ALFALFA value as outliers, and all cases where at least one of the error function terms in the busy function fit was 111This is not a universal threshold as some Gaussian-shaped spectra are fit well by this parameter value, but a value identified from visual inspection of cases where straight-edged spectra are incorrectly fit., as this typically means it has not meaningfully fit the edges of the spectrum. We manually intervened in these fits, and boxcar smoothed the spectra or fixed fit parameters as necessary to parameterise the edges.
Using our measurements, we computed the integrated signal-to-noise ratio of each spectrum (, Saintonge, 2007)
| (1) |
where is the final velocity resolution of the spectrum after boxcar smoothing. To measure asymmetry we define the middle velocity , and compute the ratio of integrated flux in each half of a spectrum
| (2) |
which we use to define the integrated flux ratio asymmetry parameter (e.g. Haynes et al., 1998; Watts et al., 2020a)
| (3) |
This definition of removes the left/right-handedness inherent to the ratio , such that a perfectly symmetric spectrum has and values of indicate deviation from symmetry.
To define our ALFALFA sample, we selected 2742 galaxies with to avoid low-quality spectra and reduce uncertainty in the measurement of (Watts et al., 2020a). We removed a further 251 (9%) galaxies that had measurement limits separated by less than 20 channels (i.e., narrower than ) to avoid the regime where cannot be properly determined (Deg et al., 2020), 142 (5%) galaxies that had missing data due to RFI removal that overlapped the H i spectral line, and a further 98 (4%) that did not have well-defined edges and could not be fit, leaving 2251 galaxies in our sample (82%). Last, we assessed our ALFALFA sample for H i confusion by cross-matching each galaxy to all objects with in the MPA/JHU value-added catalogue within a tolerance of 2 arcmins and 200 . 219 galaxies had at least one companion within these limits, and we removed 191 with companions bluer than the colour cut of Zu & Mandelbaum (2016) used to separate blue and red sequence galaxies,
| (4) |
using the SDSS model magnitudes of each companion. Only galaxies with blue companions are removed, as their colour indicates that they are star-forming and thus host cold gas that could contribute non-negligible H i emission to the spectrum of the target galaxy, while red companions are likely to be passive and not host significant cold gas. We inspected the 2032 galaxies with no identified companions and removed 76 clear cases of confusion where the companion is not part of the SDSS DR7 catalogue. Thus, the final number of galaxies in our ALFALFA sample is 1984222We also tested stricter confusion limits of 3 arcmins and 300 , which removes 200 more galaxies, and found no quantitative changes to our results..
The post-merger galaxies were fit using the same procedure, and the quality cuts reduced the sample size from 75 galaxies to 45. We utilised the busy function fits to xGASS spectra from Watts et al. (2020a), remeasured them using 2 measurement limits, and applied the same quality cuts to ensure consistency between the samples, leaving 399 galaxies. Both the post-merger and xGASS catalogues have already been assessed for H i confusion. We refer to these samples of 1984, 399, and 45 galaxies as the parent-samples for ALFALFA, xGASS, and the post-mergers, respectively.
Finally, we note that our velocity limits are not a ‘standard’ choice for H i studies, which typically adopt some fraction of the peak(s) in the spectrum. The values of these peak(s) are not immune to elevation or suppression due to noise, particularly at low , and we have not parameterised them with our busy function fits. In Fig. 1, we show how our velocity limits compare to the choice of 20% of a spectrum’s peak(s), as adopted by Watts et al. (2020a) for xGASS, for three different spectra. Clearly, there is no significant difference between the locations of the limits, or the resulting measurements of or in these examples. We also compared the differences in these measurements for our whole xGASS sample and found a median and of 0.017 and 0.124 for , and -0.0016 and 0.014 for , respectively.
3.2 Star-forming main-sequence selection
To study galaxies that have not undergone significant suppression of their SFR, we restrict our samples to the star-forming main-sequence (SFMS). To do so, we use the fits by Janowiecki et al. (2020) to the xGASS specific SFR () SFMS
| (5) |
and its scatter
| (6) |
and select galaxies with from the SFMS. Namely, galaxies more star-forming than below the SFMS. The final number of galaxies in the SFMS sub-samples for ALFALFA, xGASS, and the post-mergers are 1784, 322, and 38, respectively, which from here we denote as ALFALFAMS, xGASSMS, and PMMS.
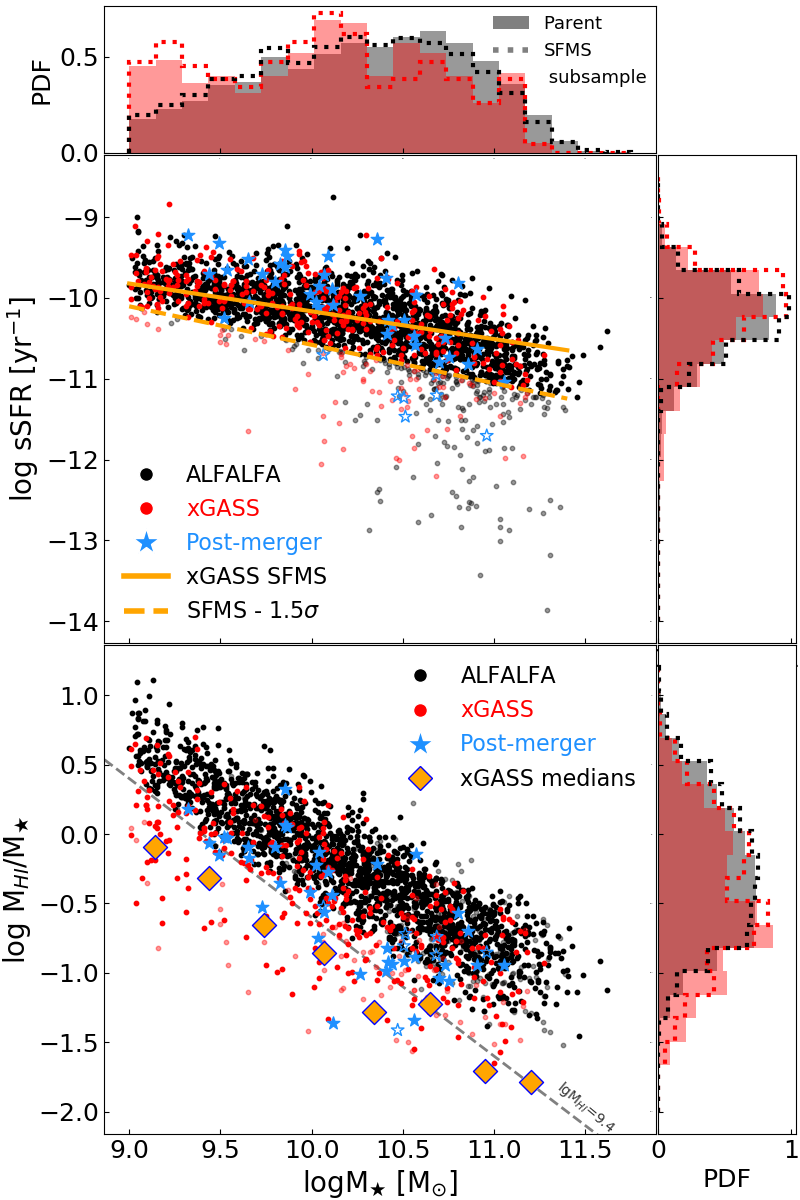
In Fig. 2 we show the stellar mass versus sSFR plane and H i gas fraction scaling relation for our xGASS, ALFALFA, and post-merger parent-samples and SFMS sub-samples, alongside density-normalised probability distributions of the parameters for xGASS and ALFALFA. We do not show the parameter distributions for the post-mergers due to their small sample size. The distributions of ALFALFA and xGASS show that they cover the same range, with xGASS having slightly more lower mass galaxies, and that there are no significant differences between the parent-samples and SFMS sub-samples. In the top panel, we see that even before the selection of the SFMS, the xGASS and ALFALFA parent-samples are dominated by main-sequence galaxies. This is unsurprising as we can only measure asymmetry in high H i detections, which are more likely to be star-forming systems. Both before and after the sSFR cut the distribution of both samples are well matched. Post-mergers galaxies are, as expected, preferentially star-forming systems above the SFMS due to the star-formation triggered during the merging process (Ellison et al., 2013).
In the bottom panel, the main difference between xGASS and ALFALFA is clear: ALFALFA almost exclusively detects galaxies above the xGASS median333weighted medians computed including upper limits. H i mass fraction scaling relation, shown as orange diamonds. The xGASS parent- and SFMS sub-samples show a similar bias toward galaxies above the median scaling relation, due to being detection-selected, but the targeted survey design of xGASS means that there are also galaxies below the medians. Selecting the SFMS causes a slight shift toward higher H i fractions, as gas content and star-formation are correlated, but the effect is small for both samples. The PMMS sample occupies the same region of the parameter space as xGASS as they have the same survey design and are also detection-selected. These distributions demonstrate the advantage of analysing these three samples together: ALFALFA samples the gas-rich regime with high statistics, xGASS extends dex lower in H i mass-fraction than ALFALFA, and the post-mergers provide strongly interacting, star-forming galaxies with similar coverage as xGASS. However, it also highlights how a SFMS-selected sample does not translate to a clear selection in galaxy H i mass fraction. ALFALFA is not representative of the H i fractions of galaxies within the SFMS, missing the ‘gas-poor’ tail of star-forming galaxies that is revealed by xGASS, and this will limit our ability to use ALFALFA to look for trends between H i asymmetry and gas content.
3.3 Asymmetric and symmetric galaxies
The uncertainty in an measurement is closely linked to the of a spectrum (Watts et al., 2020a), and this must be taken into account when selecting and comparing different samples, particularly if they have different distributions. We briefly describe how we model and account for this effect here, but refer the reader to Watts et al. (2020a) for a more detailed description. We also acknowledge that there are other sources of uncertainty on measurements, as mentioned in Watts et al. (2020a), but these are minimised by our cut and removal of confused systems, and we do not expect them to impact our results.
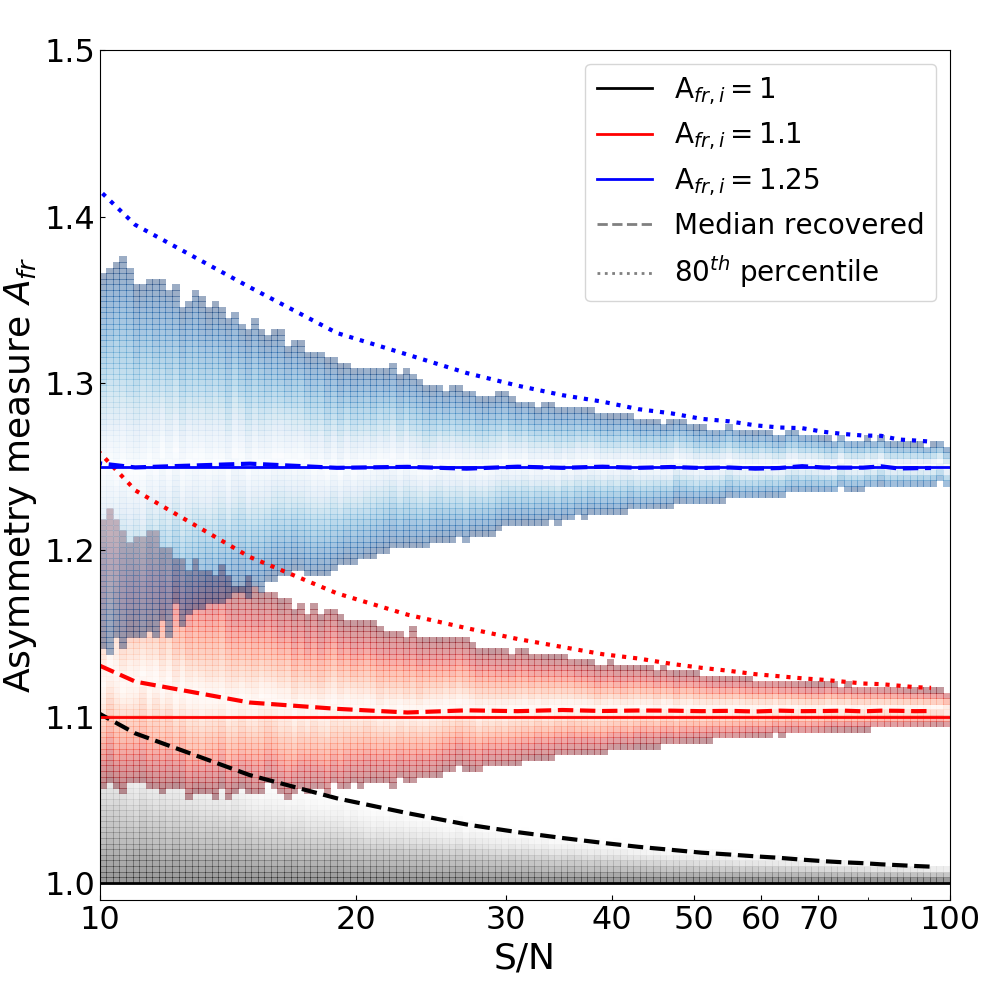
A toy model is used to create noiseless, model H i spectra with intrinsic asymmetries () of , 1.1, and 1.25, corresponding to symmetric spectra, asymmetric spectra (Haynes et al., 1998; Watts et al., 2020a), and a higher value to model strongly-asymmetric spectra. Mock observations are created by degrading the model spectra to a desired by adding Gaussian random noise, and 104 noise realisations are created for values in the range in steps of , to properly model marginal detections below our cut to high spectra. The ‘observed’ and of each mock spectrum is calculated using measurement limits defined on the noiseless model spectrum by treating it as a ‘fit’ to the mock spectra, as the straight edges of H i spectra are typically well-defined and not significantly impacted by noise.
In Fig. 3, we show the distribution of recovered measurements as a function of for our three modelled values. The background density plots show the normalised probability distribution function of recovered measurements in bins of , sampled in bins of , and truncated at their and percentiles (the for the model, as it is reflected about ). The intrinsic asymmetry of each model and the median recovered in bins of are shown with black (), red (), and blue (), solid and dashed lines, respectively. Clearly, the uncertainty in an measurement increases as a decreases, and at low galaxies preferentially scatter toward higher values due to the distributions being bounded by . This is visible in the distribution of recovered measurements for the model, as the median recovered is for all ; and in the model by the deviation of its median to , and the upward compression of the low- side of its distribution.
We quantify this scatter in measurements due to noise at a given by computing the percentiles of the distribution for all mock spectra in bins of . These percentiles are well described by an inverse power law of the form
| (7) |
where the constants and depend on the desired percentile ‘XX’. We fit these percentiles to parameterise as a function of for a given . It is important to mention that these percentiles are almost completely insensitive to the degree of smoothing and shape of a H i spectrum, so long as they are parameterised as a function of as defined in eq. 1 (Watts et al., 2020a).
Utilising this model, we select asymmetric and symmetric populations from each SFMS sub-sample using the same thresholds as Watts et al. (2020a), with an additional ‘strong-asymmetry’ population to investigate the properties of the most asymmetric galaxies.
-
•
The symmetric population is selected as (i.e. the median), as 50 per cent of intrinsically symmetric spectra will have below this percentile.
-
•
The asymmetric population is defined as , i.e. galaxies that have at least 10 per cent intrinsic asymmetry to at least an 80% confidence level, considering noise.
-
•
The strong-asymmetry population is defined as , namely at least 25 per cent intrinsic asymmetry with 80% confidence.
These selections are visible in Fig. 3 as the black dashed (symmetric), dotted red (asymmetric), and dotted blue (strong-asymmetry) lines. There will be some contamination of the symmetric population, particularly at lower , but we must compromise between sample size and purity, and the deviation from symmetry shown by these galaxies is small compared to the effect of noise, so we do not expect them to affect our results. Fig. 3 also demonstrates why it is necessary to use these percentiles to select our populations, as they increase the confidence in the separation of intrinsically symmetric and asymmetric galaxies. At , a galaxy with has a 50 per cent chance of having , namely being intrinsically symmetric. Similarly, a galaxy with has a 20 per cent chance of having , namely it is asymmetric, but not strongly-asymmetric, as might be inferred if the effect of noise was not accounted for. Thus, the number of galaxies in the asymmetric and symmetric populations, respectively, are 121 and 87 for xGASSMS, 12 and 8 for PMMS, and 541 and 431 for ALFALFAMS. The strong-asymmetry population is only defined for ALFALFAMS, and consists of 168 galaxies.
3.4 Offset parameters
We quantify the difference in the H i and star-formation properties of asymmetric galaxies compared to symmetric ones with a matched-galaxy offset analysis (e.g. Ellison et al., 2018; Watts et al., 2020a), using only galaxies within the SFMS. Each asymmetric galaxy is matched to all symmetric galaxies within 0.1 dex in and , and if less than five symmetric galaxies are matched then we expand these tolerances by 0.1 and 0.05 dex, respectively, until at least 5 matches are found. Typically of galaxies find sufficient matches without needing to increase the tolerances in ALFALFAMS, and with only one expansion in xGASSMS due to the smaller sample size. The match is included because lower galaxies typically have higher due to the effect of noise and, in xGASS, there is a correlation where higher galaxies typically have higher H i content. This correlation is also present in xGASSMS, and if left uncorrected it could bias us toward inferring higher galaxies are more gas-poor. This correlation is not present in ALFALFAMS and we note that removing the matching does not change our results, but we keep it for consistency between analyses and with previous work. Last, we allow galaxies with to match to other galaxies with regardless of , as the effect of noise on is small above this value, and to avoid discarding the fewer high spectra.
The H i mass fraction () and sSFR () offsets are then defined as the logarithmic difference between the value for the asymmetric galaxy, and the median of the matched symmetric galaxies:
| (8) | ||||
| (9) |
In this way, we compare the properties of asymmetric galaxies to what would be expected for a symmetric galaxy at fixed and . We also compute these offsets for each symmetric galaxy using the same process, to inform us about the distribution of the symmetric population.
4 Results
| Sample | Offset | Median | -value | -value |
|---|---|---|---|---|
| AAMS asymmetric | 0.05 | 0.45 | ||
| 0.09 | 0.03 | |||
| AAMS strong asymm | 0.11 | 0.11 | ||
| 0.18 | ||||
| xGASSMS asymmetric | 0.22 | 0.03 | ||
| 0.15 | 0.22 |
4.1 Global H i asymmetries on the SFMS
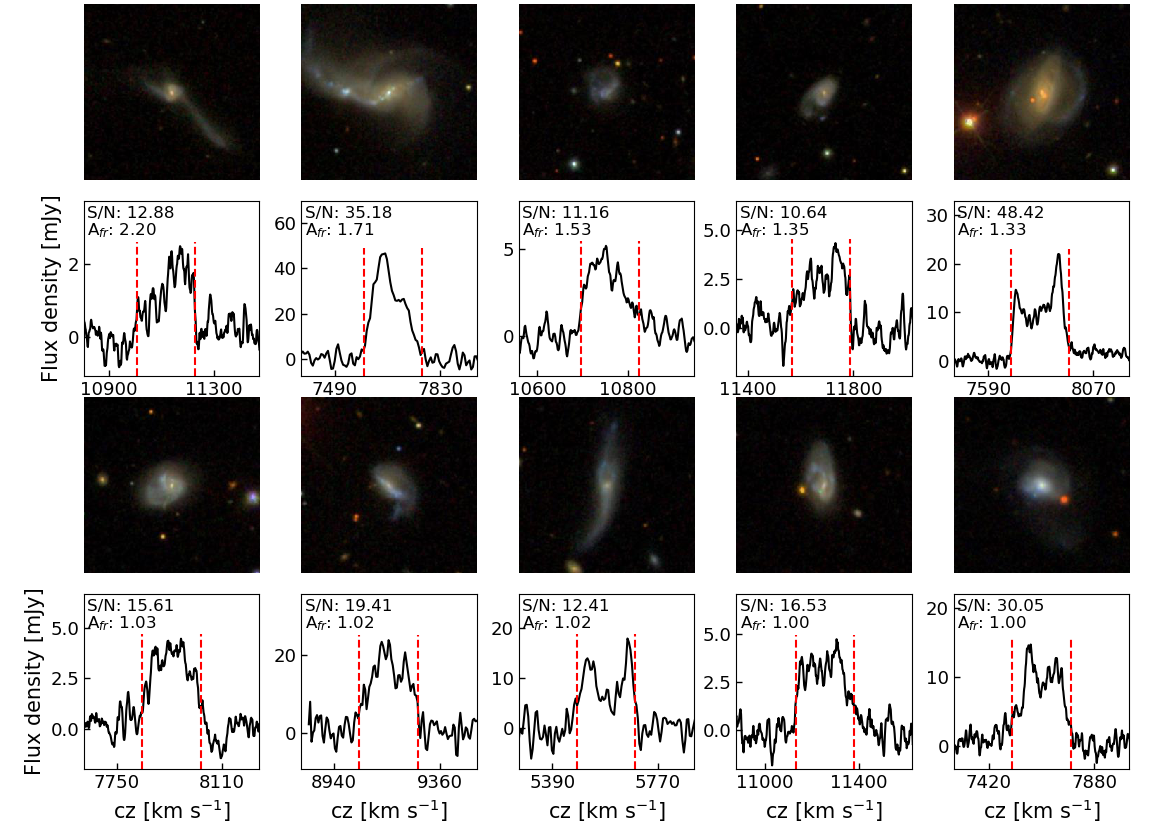
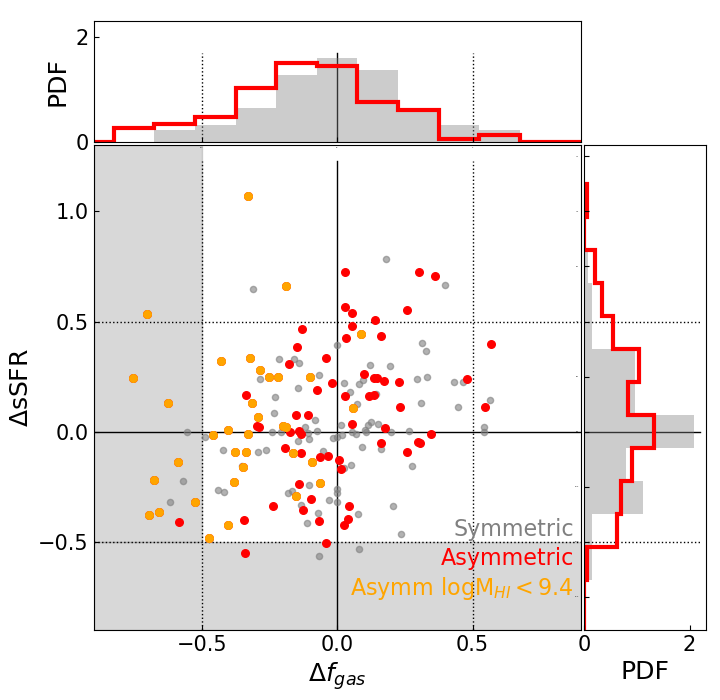
We first focus on the properties of galaxies in the ALFALFAMS sample. In Fig. 4 we show the parameter space for the ALFALFAMS sample, where the asymmetric and strongly asymmetric samples are matched to the symmetric sample, and the symmetric sample matched to itself. We show thin, black lines at to provide a visual centre of the parameter space, and dotted, black lines at to demonstrate the extent of the scatter. To the top and right of the central panel, we show density-normalised probability distributions of each offset parameter and extensions of the and lines. Surrounding the main panel, we show SDSS cutouts and global H i spectra of example (strongly) asymmetric and symmetric galaxies, to show the diversity of optical properties of galaxies in the parameter space. These example galaxies are paired according to their similar and , denoted by the large, bordered, markers that are shown both in the main panel and inset beside their spectrum, with a thin, black line connecting each pair to its location in the parameter space.
Clearly, the bulk of the symmetric and asymmetric populations are contained within . The only clear deviation outside this scatter is for , and this part of the parameter space is occupied by both asymmetric and symmetric galaxies. This is also reflected in the distributions of each offset parameter. The distributions are centred on zero with similar widths, while the asymmetric galaxies show slightly higher values. To provide quantitative comparisons, we calculate the median offsets of the asymmetric population with uncertainty derived from 104 bootstraps and perform a two-sample Kolmogorov-Smirnov test (KS-test) between the asymmetric and symmetric populations. These medians, and the KS-test -statistics and -values are listed in Table 1. The median offsets for the asymmetric population are small, with and with , though the KS-test result indicates that the distribution of asymmetric galaxies is different to that of symmetric ones.
It is important to note that the lack of galaxies with and , shown as the grey shaded regions in the main panel of Fig. 4, is simply due to the fact that ALFALFA does not reach lower (relative) gas fractions and our sample is only representative of the SFMS. However, despite restricting our sample to the most gas-rich and star-forming systems, we can already conclude that global H i asymmetries are not preferentially found in gas-rich or highly star-forming objects.
In Fig. 4 we also highlight the subset of asymmetric galaxies with strong asymmetry, to investigate the properties of the most disturbed systems. This population spans the same and ranges as the asymmetric and symmetric populations, and the offset distributions show little difference from the asymmetric population aside from a small increase in positive offset values. The median offsets for this population are with and with , indicating that a significant offset is only present in sSFR, not H i fraction. This suggests that greater is associated with greater . To further confirm this, we performed the same analysis on the subset of the asymmetric population after removing the strong asymmetry galaxies. We find that this remaining subset of 373 galaxies has a median , namely consistent with no elevation in , and the KS-test cannot determine that the distribution is different to that of symmetric galaxies. Thus, the difference in between symmetric and asymmetric galaxies is primarily driven by galaxies with the highest .
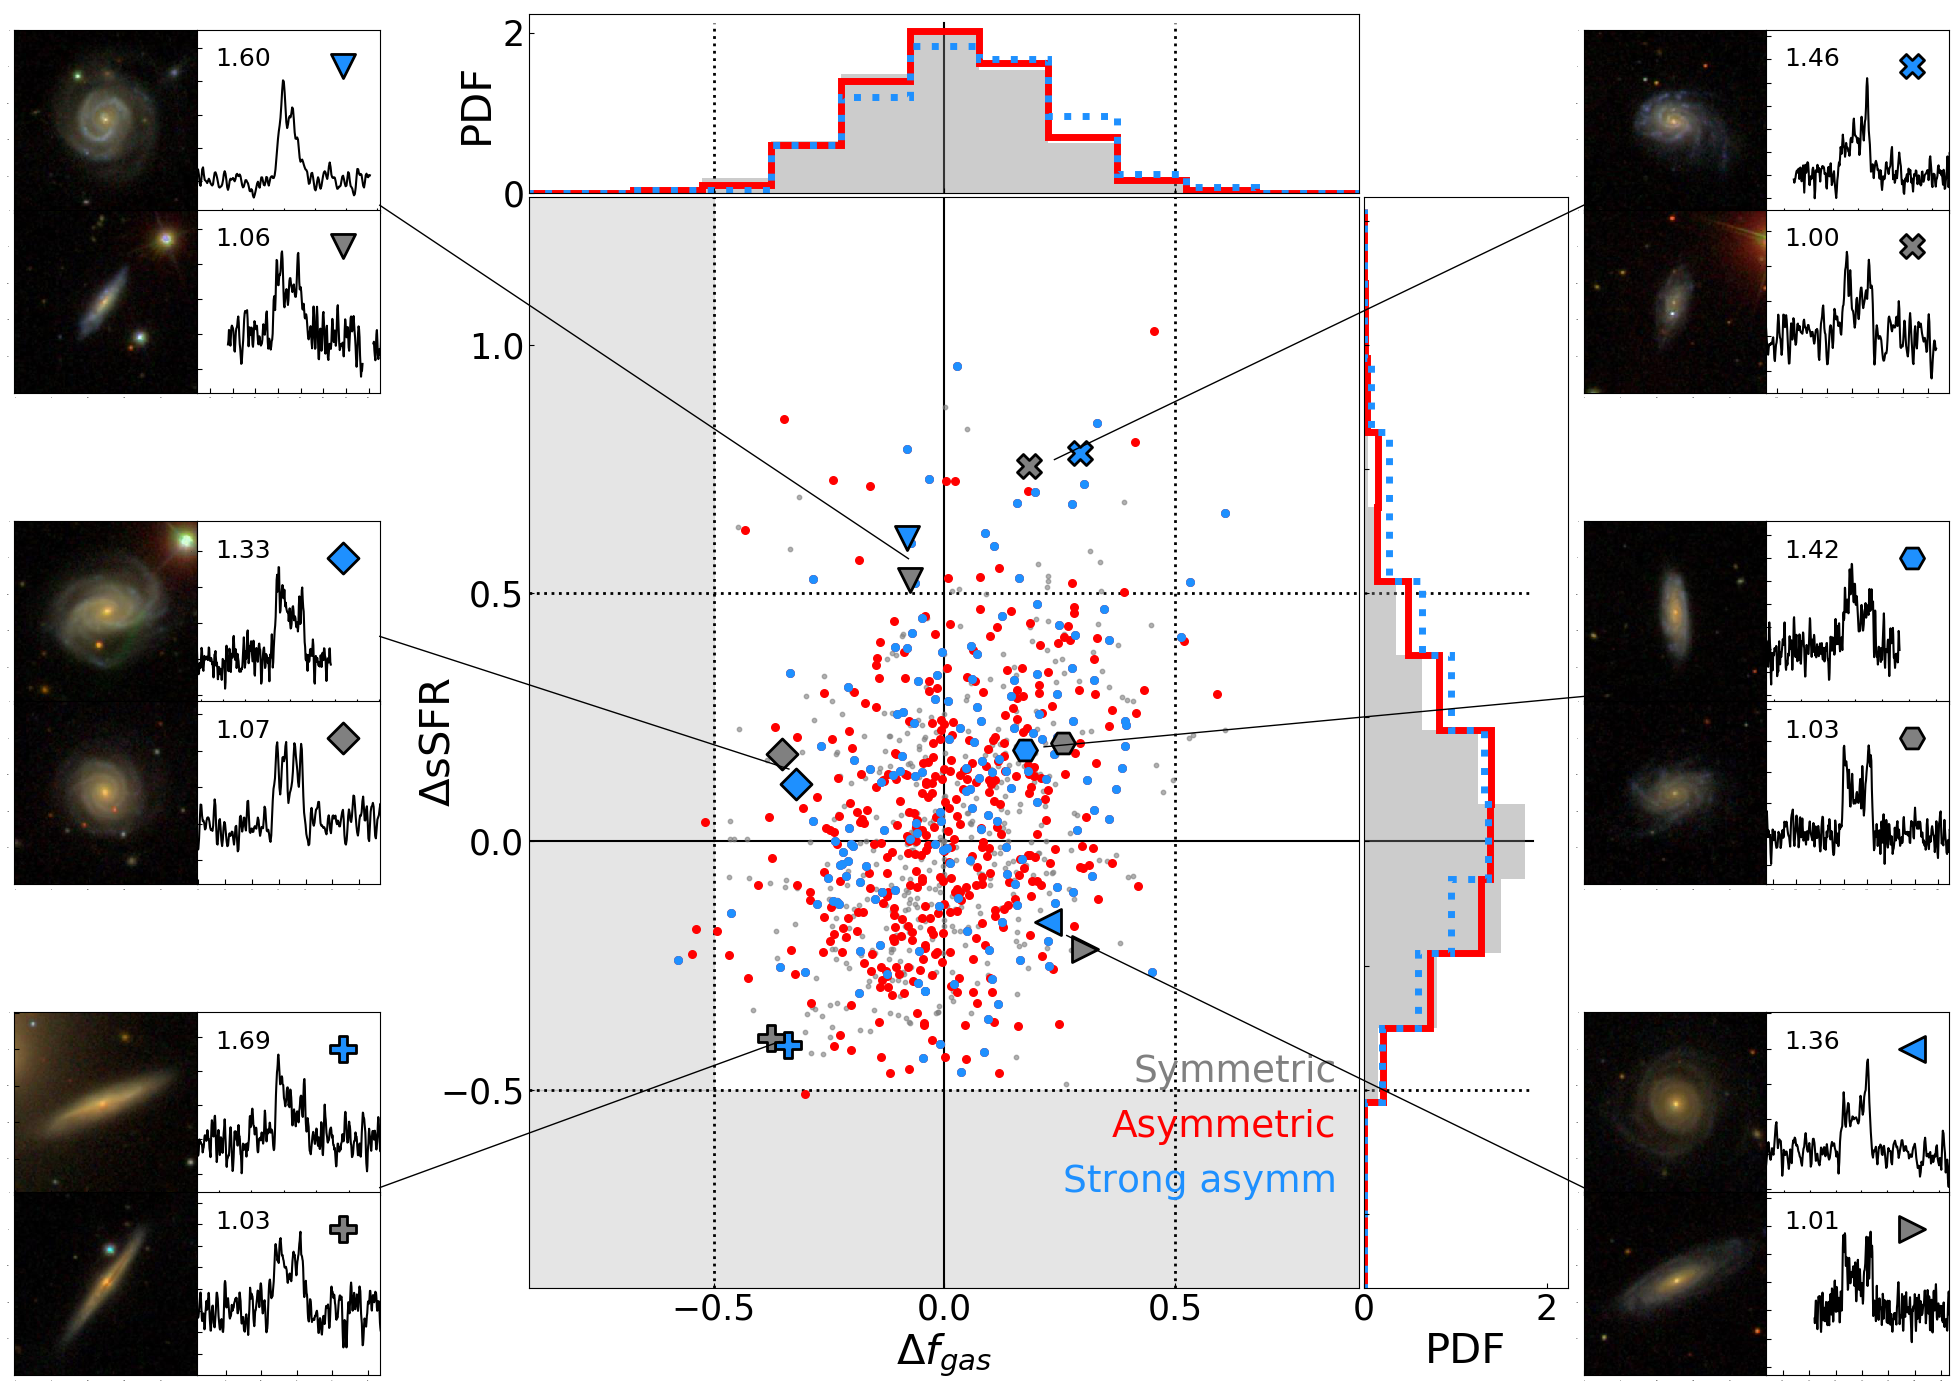
The example galaxies surrounding Fig. 4 highlight the diversity in the optical properties of symmetric and strongly asymmetric galaxies across the parameter space. Both populations show signatures of optical disturbances, blue star-forming discs, and apparent prominence of the bulge. There is no clear distinction in the optical morphologies of galaxies whether they are classified as symmetric or asymmetric, and this diversity is present across the parameter space. Thus, we emphasise here the main result of this work. Any physical process(es) driving H i disturbances in the gas-rich regime on the SFMS are only evident in the highest systems, and only appear to impact the star-formation properties of galaxies with no measurable impact on their H i content.
The complexity of the link (or lack thereof) between H i asymmetry and other galaxy properties is further highlighted by our sample of post-merger galaxies. Our small sample size does not permit any statistical comparisons, so in Fig. 5 we show the five highest and the five most H i symmetric PMMS galaxies. The fact that PMMS galaxies span the same range of asymmetries – from almost perfectly symmetric to highly asymmetric – demonstrates that the presence of optical disturbance in a galaxy does not necessarily imply elevated H i asymmetry, and vice-versa. While merger activity can enhance global H i asymmetry on a statistical level (e.g. Bok et al., 2019), projection effects (e.g. Deg et al., 2020) or the settling of the gas back into regular rotation in advanced merging stages (e.g. Manthey et al., 2008; Schiminovich et al., 2013) could be responsible for symmetric H i spectra, even when signatures of the merger remain in optical images, or stellar or ionised gas kinematics (e.g. Feng et al., 2020; Nevin et al., 2021)
4.2 Comparison with xGASS
The results presented in the previous section may appear in contradiction with the recent work by Watts et al. (2020a) who, using xGASS, found that H i asymmetries are preferentially found in gas-poor galaxies. Here, we discuss how these two results can be easily reconciled. In Fig. 6, we show the parameter space for xGASSMS. As in ALFALFAMS, there are some galaxies with , though the median offset with is small, and we cannot determine that the two distributions are different. The most significant difference compared to ALFALFAMS is that the asymmetric population preferentially inhabits the half of the parameter space, and there are now clearly galaxies with . This is evident in the distribution, which has a median and suggesting that the asymmetric galaxies have a different distribution from the symmetric ones. This reflects the sensitive H i observations of xGASS and the fact that a SFMS-selected sample does not translate to a clear selection in H i mass fraction. We demonstrate this by highlighting galaxies below an ALFALFA-like H i mass limit of (shown in the H i mass fraction scaling relation panel of Fig. 2 with a grey, dashed line) with orange points in Fig. 6. These galaxies constitute all but one of the points, and all apart from two have , showing that the ‘gas-poor’ tail of the SFMS drives the suppressed H i content of asymmetric galaxies. Thus, in terms of their gas content, asymmetric galaxies preferentially scatter toward lower H i fractions, but evidencing this requires deep H i observations that are not typically reached by blind H i surveys. The xGASSMS sample is consistent with ALFALFAMS once selection biases are properly taken into account.
5 Discussion and conclusions
In this work, we have investigated the shape of global H i spectra, through measurement of their asymmetry, in a data-set that samples the gas-rich regime with high statistics, covers dex in H i mass-fraction, and provides insight into strong gravitational interactions. In particular, we have determined whether elevated global H i asymmetry in galaxies is also associated with a change in their H i content or sSFR. Our key result is that at fixed stellar mass, in the gas-rich regime, and on the SFMS, there is no systematic difference in the H i content of galaxies with asymmetric global H i spectra compared to symmetric ones. It is only mechanisms that disturb and remove the H i that cause a clear, systematic, difference in the H i content of H i asymmetric galaxies, and this requires observations that measure H i fractions below the median scaling relations of representative samples. There is some evidence for elevated sSFR in H i asymmetric galaxies, and this is primarily driven by galaxies with the highest H i asymmetry. There is also no clear correlation between optical morphology and global H i asymmetry, and post-merger galaxies, despite being strongly disturbed systems optically, show a range of H i asymmetries.
Gas accretion has been proposed as a mechanism that could drive the ubiquity of disturbances in the H i in galaxies. Matthews et al. (1998) found that 77% of late-type galaxies had asymmetric global H i spectra, while Haynes et al. (1998) found 45% in isolated galaxies in general. As late-type galaxies are typically more H i rich, this has been interpreted as the signature of accretion-driven asymmetries. We find no evidence for an elevation in the H i content of galaxies with asymmetric H i spectra in the gas-rich regime, in agreement with Reynolds et al. (2020b). The difference in these results could be explained by the smaller sample sizes and the lack of compensation for measurement noise which must be taken into account when comparing asymmetry rates. 57% of our ALFALFA spectra have , but after accounting for noise with the asymmetric population (before SFMS selection), i.e. 80% confidence that their , this is reduced to 29%. To the same threshold, xGASS and xGASS isolated galaxies show asymmetry rates of 37% and 32%, respectively. Thus, gas-rich galaxies do not show a higher rate of H i asymmetry than a sample that is more representative of the H i fractions of galaxies, even when restricted to isolated systems. Assuming that gas-richness is a consequence of gas accretion, this implies that either gas accretion is not a dominant driver of global H i asymmetry or that, if it is, it affects more the dynamics of the H i reservoir (causing asymmetry in global spectra) than its H i content. Simulations of gas accretion on the galaxy scale have shown that, by mass, the dominant channel of gas accretion onto galaxies is through the accretion of satellite galaxies (Nelson et al., 2013, 2015). This scenario brings additional gravitational perturbation to the picture, and the repeated merging of these satellites has been proposed to explain the ubiquity of disturbances in galaxies (Zaritsky & Rix, 1997). Bassett et al. (2017) showed that gas accreted onto a gas-rich galaxy will settle into co-rotating orbits, causing a smaller perturbation, whereas accretion onto a gas-poor galaxy allows the gas to retain memory of its accretion history, potentially causing greater asymmetry. Whether it is the active accretion of satellites, particularly those below the detection limit of many optical surveys (e.g. Portas et al., 2011; Ramírez-Moreta et al., 2018), the ongoing response to perturbations in the gravitational potential of the dark matter halo caused by these accretions (e.g. van Eymeren et al., 2011), or a combination of both (Zaritsky et al., 2013), remain unknown. Unfortunately, the marginal increase in sSFR that we have observed in galaxies with the strongest asymmetry cannot discriminate between these two scenarios, as both can cause increased sSFR (e.g. Jog, 1997; Cox et al., 2008).
Current cosmological-hydrodynamical simulations of galaxy formation are well suited to investigating H i asymmetry in the gas-rich regime (e.g. Watts et al., 2020b), and the relationship between gas accretion, tidal interactions, and global H i asymmetry in these cosmological volumes remain to be quantified. Furthermore, determining how disturbances move across the stellar, ionised, atomic, and molecular gas components of galaxies is an exciting prospect for future multi-wavelength observations.
Acknowledgements
ABW acknowledges the support of an Australian Government Research Training Program (RTP) Scholarship throughout the course of this work. LC is the recipient of an Australian Research Council Future Fellowship (FT180100066) funded by the Australian Government. Parts of this research were supported by the Australian Research Council Centre of Excellence for All-Sky Astrophysics in 3 Dimensions (ASTRO 3D), through project number CE170100013.
Data Availability
The data that support the findings of this study are available upon request from the corresponding author, ABW.
References
- Abazajian et al. (2009) Abazajian K. N., et al., 2009, ApJS, 182, 543
- Barnes et al. (2001) Barnes D. G., et al., 2001, MNRAS, 322, 486
- Bassett et al. (2017) Bassett R., Bekki K., Cortese L., Couch W., 2017, MNRAS, 471, 1892
- Bok et al. (2019) Bok J., Blyth S.-L., Gilbank D. G., Elson E. C., 2019, MNRAS, 484, 582
- Catinella et al. (2018) Catinella B., et al., 2018, MNRAS, 476, 875
- Chung et al. (2007) Chung A., van Gorkom J. H., Kenney J. D. P., Vollmer B., 2007, ApJL, 659, L115
- Cortese et al. (2020) Cortese L., Catinella B., Cook R. H. W., Janowiecki S., 2020, MNRAS, 494, L42
- Cox et al. (2008) Cox T. J., Jonsson P., Somerville R. S., Primack J. R., Dekel A., 2008, MNRAS, 384, 386
- Darg et al. (2010) Darg D. W., et al., 2010, MNRAS, 401, 1552
- Deg et al. (2020) Deg N., Blyth S. L., Hank N., Kruger S., Carignan C., 2020, MNRAS, 495, 1984
- Ellison et al. (2013) Ellison S. L., Mendel J. T., Patton D. R., Scudder J. M., 2013, MNRAS, 435, 3627
- Ellison et al. (2018) Ellison S. L., Catinella B., Cortese L., 2018, MNRAS, 478, 3447
- Espada et al. (2011) Espada D., Verdes-Montenegro L., Huchtmeier W. K., Sulentic J., Verley S., Leon S., Sabater J., 2011, A&A, 532, A117
- Feng et al. (2020) Feng S., Shen S.-Y., Yuan F.-T., Riffel R. A., Pan K., 2020, ApJL, 892, L20
- Giovanelli et al. (2005) Giovanelli R., et al., 2005, AJ, 130, 2598
- Haynes et al. (1998) Haynes M. P., Hogg D. E., Maddalena R. J., Roberts M. S., van Zee L., 1998, AJ, 115, 62
- Haynes et al. (2018) Haynes M. P., et al., 2018, ApJ, 861, 49
- Janowiecki et al. (2017) Janowiecki S., Catinella B., Cortese L., Saintonge A., Brown T., Wang J., 2017, MNRAS, 466, 4795
- Janowiecki et al. (2020) Janowiecki S., Catinella B., Cortese L., Saintonge A., Wang J., 2020, MNRAS, 493, 1982
- Jog (1997) Jog C. J., 1997, ApJ, 488, 642
- Jog & Combes (2009) Jog C. J., Combes F., 2009, Phys.Rep., 471, 75
- Koribalski et al. (2020) Koribalski B. S., et al., 2020, ApSS, 365, 118
- Manthey et al. (2008) Manthey E., Aalto S., Hüttemeister S., Oosterloo T. A., 2008, A&A, 484, 693
- Martin et al. (2005) Martin D. C., et al., 2005, ApJL, 619, L1
- Matthews et al. (1998) Matthews L. D., van Driel W., Gallagher J. S. I., 1998, AJ, 116, 1169
- Meyer et al. (2004) Meyer M. J., et al., 2004, MNRAS, 350, 1195
- Nair & Abraham (2010) Nair P. B., Abraham R. G., 2010, ApJS, 186, 427
- Nelson et al. (2013) Nelson D., Vogelsberger M., Genel S., Sijacki D., Kereš D., Springel V., Hernquist L., 2013, MNRAS, 429, 3353
- Nelson et al. (2015) Nelson D., Genel S., Vogelsberger M., Springel V., Sijacki D., Torrey P., Hernquist L., 2015, MNRAS, 448, 59
- Nevin et al. (2021) Nevin R., et al., 2021, arXiv e-prints, p. arXiv:2102.02208
- Portas et al. (2011) Portas A., et al., 2011, ApJ, 739, L27
- Ramírez-Moreta et al. (2018) Ramírez-Moreta P., et al., 2018, A&A, 619, A163
- Reynolds et al. (2020a) Reynolds T. N., Westmeier T., Staveley-Smith L., Chauhan G., Lagos C. D. P., 2020a, MNRAS,
- Reynolds et al. (2020b) Reynolds T. N., Westmeier T., Staveley-Smith L., 2020b, arXiv e-prints, p. arXiv:2010.03720
- Richter & Sancisi (1994) Richter O. G., Sancisi R., 1994, A&A, 290, L9
- Saintonge (2007) Saintonge A., 2007, AJ, 133, 2087
- Salim et al. (2016) Salim S., et al., 2016, ApJS, 227, 2
- Salim et al. (2018) Salim S., Boquien M., Lee J. C., 2018, ApJS, 859, 11
- Sancisi et al. (2008) Sancisi R., Fraternali F., Oosterloo T., van der Hulst T., 2008, A&AR, 15, 189
- Schiminovich et al. (2013) Schiminovich D., van Gorkom J. H., van der Hulst J. M., 2013, AJ, 145, 34
- Simard et al. (2011) Simard L., Mendel J. T., Patton D. R., Ellison S. L., McConnachie A. W., 2011, ApJS, 196, 11
- Swaters et al. (1999) Swaters R. A., Schoenmakers R. H. M., Sancisi R., van Albada T. S., 1999, MNRAS, 304, 330
- Walter et al. (2008) Walter F., Brinks E., de Blok W. J. G., Bigiel F., Kennicutt Robert C. J., Thornley M. D., Leroy A., 2008, AJ, 136, 2563
- Wang et al. (2014) Wang J., et al., 2014, MNRAS, 441, 2159
- Watts et al. (2020a) Watts A. B., Catinella B., Cortese L., Power C., 2020a, MNRAS, 492, 3672
- Watts et al. (2020b) Watts A. B., Power C., Catinella B., Cortese L., Stevens A. R. H., 2020b, MNRAS, 499, 5205
- Westmeier et al. (2014) Westmeier T., Jurek R., Obreschkow D., Koribalski B. S., Staveley-Smith L., 2014, MNRAS, 438, 1176
- Wong et al. (2006) Wong O. I., et al., 2006, MNRAS, 371, 1855
- Wright et al. (2010) Wright E. L., et al., 2010, AJ, 140, 1868
- York et al. (2000) York D. G., et al., 2000, AJ, 120, 1579
- Zaritsky & Rix (1997) Zaritsky D., Rix H.-W., 1997, ApJ, 477, 118
- Zaritsky et al. (2013) Zaritsky D., et al., 2013, ApJ, 772, 135
- Zu & Mandelbaum (2016) Zu Y., Mandelbaum R., 2016, MNRAS, 457, 4360
- de Blok et al. (2020) de Blok W. J. G., et al., 2020, arXiv e-prints, p. arXiv:2009.09766
- van Eymeren et al. (2011) van Eymeren J., Jütte E., Jog C. J., Stein Y., Dettmar R. J., 2011, A&A, 530, A30