Spin dynamics of the director state in frustrated hyperkagome systems
Abstract
We present an experimental study of the magnetic structure and dynamics of two frustrated hyperkagome compounds, Gd3Ga5O12 and Gd3Al5O12. It has previously been shown that Gd3Ga5O12 exhibits long-range correlations of multipolar directors, that are formed from antiferromagnetic spins on loops of ten ions. Using neutron diffraction and Reverse Monte Carlo simulations we prove the existence of similar magnetic correlations in Gd3Al5O12, showing the ubiquity of these complex structures in frustrated hyperkagome materials. Using inelastic neutron scattering we shed further light on the director state and the associated low-lying magnetic excitations. In addition we have measured quasielastic dynamics that show evidence of spin diffusion. Finally, we present AC susceptibility measurements on both Gd3Ga5O12 and Gd3Al5O12, revealing a large difference in the low frequency dynamics between the two otherwise similar compounds.
I Introduction
Emergence is the phenomenon of collective behavior that does not depend solely on the individual parts of a system, but rather through their interactions. This effect often results in novel and diverse states of matter. For example, in the field of magnetic frustration, emergent phenomena have been gracefully demonstrated by the observation of magnetic monopoles emerging in spin ice materials Fennell et al. (2009); Morris et al. (2009); Castelnovo et al. (2007); Giblin et al. (2011); Dusad et al. (2019).
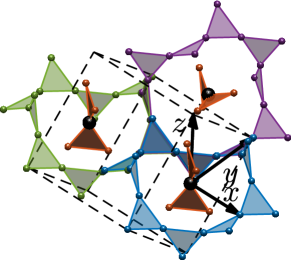
A further example is the director state uncovered in the geometrically frustrated garnet, Gd3Ga5O12 (GGG) Paddison et al. (2015). The Gd3+ ions in GGG form two interpenetrating hyperkagome lattices. In these structures, the resultant moment on connected loops of ten ions form a nematic director state at low temperaturesPaddison et al. (2015). Fig. 1 illustrates three such ten-ion loops. Taking the position of each director as the atom at the center of the ten-ion loop (illustrated in black), the directors also form a hyperkagome structure.
The directors in GGG are reminiscent of the emergent cluster state in the geometrically frustrated spinel ZnCr2O4 Lee et al. (2002), where groups of six spins self-organise into decoupled antiferromagnetic (AF) loops, also known as director protectorates.
It has been suggested that such directors are inherent in geometrically frustrated systems, and that they provide an organising principle in which emergent clusters form out of a manifold of ground states with the low temperature dynamics governed by the director state.
In Gd3Ga5O12 the director state originates from the interplay between near-neighbor AF interactions and local anisotropy Paddison et al. (2015). The directors are highly anisotropic and align along their local -axis. The alignment of all the directors along their local axis leads to long range correlations, in contrast to the decoupled directors in ZnCr2O4. The observed magnetic excitations in GGG range from the peV to the meV scale Ghosh et al. (2008); Deen et al. (2010); Dunsiger et al. (2000); Marshall et al. (2002); Bonville et al. (2004); d’Ambrumenil et al. (2015), and the ten-ion loops seem to be central to understanding these dynamics in GGG Ghosh et al. (2008); d’Ambrumenil et al. (2015).
In this paper we delve further into the dynamics of the emergent behavior of spins on the hyperkagome lattice. We first reveal the existence of the director state in Gd3Al5O12 (GAG), isostructural to GGG, thus showing that such emergent behavior is not unique to GGG. We further probe the low energy magnetic dynamics in GGG and GAG using AC magnetic susceptibility and inelastic neutron scattering with eV and meV energy resolution. Finally, we discuss how the magnetic excitations can be understood in terms of a combination of single spin dynamics and collective dynamics on the ten-ion loops.
II Background
GGG is a well known magnetically frustrated compound with Gd3+ ions positioned on a three dimensional hyperkagome lattice. The Gd3+ ions have and are usually regarded as spherically symmetric, although there are indications of a weak planar anisotropy stemming from crystal field effects Paddison et al. (2015); Lefrançois et al. (2019). The space group of GGG is Iad, with Å. The Curie-Weiss temperature of GGG is K and neighboring spins are coupled with an antiferromagnetic exchange of mK Kinney and Wolf (1979). No conventional long-range magnetic order has been found down to 25 mK Petrenko et al. (1998). Neutron scattering revealed the onset of short-range correlations for K with the director correlations developing for K Petrenko et al. (1998); Paddison et al. (2015). Below mK, the spins freeze partially Schiffer et al. (1994); Quilliam et al. (2013); Florea et al. (2017). The freezing is a result of the interplay between the next nearest exchange interaction, mK mK, the inter-sublattice exchange interaction, mK mK, and the long-range dipole interaction, Yavors’kii et al. (2006). The magnetic behavior of GGG can be modeled using a standard Heisenberg model d’Ambrumenil et al. (2015):
| (1) |
where is a unit vector between atoms and .
In comparison to GGG, GAG has a larger near-neighbor exchange constant of mK Florea et al. (2017), and the magnitude of the Curie-Weiss constant is larger as well, K. The further-neighbor exchange constants are presently unknown for GAG. The phase diagram determined for GAG Florea et al. (2017) is similar to that of GGG Deen et al. (2015a); Schiffer et al. (1994) with phase boundaries normalised to the magnitude of . A spin freezing in GAG happens below mK. The dipolar interaction strength, , in GAG and GGG, calculated using the near-neighbor Gd distances in each compound, are similar, being slightly larger in GAG (48 mK) than in GGG (45 mK). The ratio is thus smaller in GAG than in GGG by a factor 0.6. The parameters for GGG and GAG are summarized in Table 1.
| GGG | K | 107 mK | 45 mK | 0.42 | 175 mK |
|---|---|---|---|---|---|
| GAG | K | 186 mK | 48 mK | 0.26 | 300 mK |
III Experimental details
We have carried out several experiments on powdered samples of GAG and GGG, previously used in Ref. Florea et al., 2017 and Refs. Petrenko et al., 1997; Deen et al., 2010, 2015a respectively. Both samples use isotopically enriched 160Gd (99.98% for GGG, 98.4% for GAG) to reduce the neutron absorption cross-section.
We have performed a polarized neutron powder diffraction experiment on 1.6 g of GAG on the diffuse scattering spectrometer D7 at the Institut Laue Langevin (ILL)Deen et al. (2015b, 2014a) . The sample was cooled using a dilution refrigerator, to access the temperature regime mK K. The magnetic signal was separated from the nuclear and spin incoherent signal using the 10-point method Ehlers et al. (2013). We corrected for finite polarization using a quartz standard and for detector efficiency using a vanadium standard Stewart et al. (2009). These corrections were carried out using the Large Array Manipulation Program, LAMP Richard et al. (1996). Leaked signals at -values corresponding to strong nuclear Bragg peaks from the copper sample container were removed. The data were normalized to mbarns/sr/Gd3+ by refining the nuclear structure using Fullprof Rodríguez-Carvajal (1993).
The magnetic dynamics of powdered GAG on the meV scale were measured using the cold neutron multi-chopper spectrometer LET at ISIS Bewley et al. (2011); Deen et al. (2015c) using incident energies = 1.25, 2.0, 3.96 and 8.69 meV with an elastic energy resolution of 0.023(1), 0.042(1), 0.11(1) and 0.42(1) meV, respectively (full width at half maximum (FWHM)), determined using an incoherent scatterer. The data were reduced using Mantid Arnold et al. (2014). We measured the magnetic dynamics at three temperatures (50 mK, 500 mK and 1 K). The slow magnetic dynamics of powdered GGG on the eV scale were measured using the neutron backscattering instrument IN16b of the ILL Deen et al. (2014b); Frick et al. (2010), across a temperature range mK K, using a dilution refrigerator. The neutron data were converted from acquisition channel to energy using standard treatments using LAMP Richard et al. (1996). The instrumental resolution function can be described by a Gaussian with weak Lorentzian tails, FWHM of 0.94(2) eV, determined using a vanadium standard.
In all neutron scattering experiments the samples were cooled for 24 hours prior to measurements to ensure that base temperature was reached.
AC susceptibility measurements were performed using a superconducting quantum interference device magnetometer equipped with a miniature dilution refrigerator, developed at the Institut Néel, Grenoble Paulsen . Powders of GGG (17.13 mg) and GAG (5.7 mg) were cooled in zero applied magnetic field, and measured at temperatures down to 80 mK with the frequency varied between 0.057 Hz and 1110 Hz under an applied field of = 0.055 mT. In these low temperature measurements, the samples were mixed with Apiezon N grease to ensure thermalization. Furthermore, a single crystal of GGG was measured at frequencies down to 1 mHz with the AC field applied along the (110) direction.
IV Results and discussion
IV.1 Magnetic structure of GAG
Fig. 2(a) shows the magnetic scattering cross section, , of powdered GAG as a function of wave vector transfer, , at 60 mK, measured at D7. It is worth noting that no energy analysis is performed on D7, and the observed signal is thus integrated over energy. This means that low energy magnetic excitations contribute to the observed diffraction signal. However, from the LET experiment on GAG presented in the next section we find that 97.4% of the energy integrated signal is within the elastic line, and the low energy magnetic excitations thus contribute only 2.6% to the total magnetic and nuclear scattering. At the peak near Å-1 more than half of the total signal observed at D7 is magnetic. Therefore, the observed magnetic signal at D7 is at least % elastic scattering, and the small contribution from inelastic scattering can safely be ignored.
The broad diffuse peaks around Å-1, Å-1 and Å-1 are similar to those observed in GGG Petrenko et al. (1998), and indicate the presence of short-range magnetic order. In GGG, a detailed Reverse Monte Carlo (RMC) analysis further showed that the shape of the peaks at Å-1 and Å-1, is a signature of the director correlations Paddison et al. (2015). We have carried out a similar analysis of our GAG data using the RMC program SPINVERT as explained below Paddison et al. (2013).
The SPINVERT analysis was performed using a magnetic supercell of unit cells with a spin on each of the magnetic sites. We found (5184 spins) to be the smallest unit cell to yield a refinement consistent with our data. The spins were treated as classical vectors, an approximation which is justified by the large spin of Gd3+ and the localized nature of the spins. Each simulation was initiated with every spin pointing along a random direction. In each Monte Carlo step a random spin was rotated slightly, and the powder averaged magnetic neutron diffraction signal from the spin configuration was calculated and scaled by a constant scale factor, , then compared with the experimental data. The new spin orientation was kept or rejected using the Metropolis algorithm Metropolis and Ulam (1949). We carried out 100 independent simulations for each temperature, with 100 steps per Gd3+ ion, resulting in 518400 steps for each simulation. Data presented are an average of these 100 simulations. We note that unlike direct Monte Carlo, this procedure provides no information on the relevant exchange interactions, but does yield a spin structure consistent with the neutron scattering data.
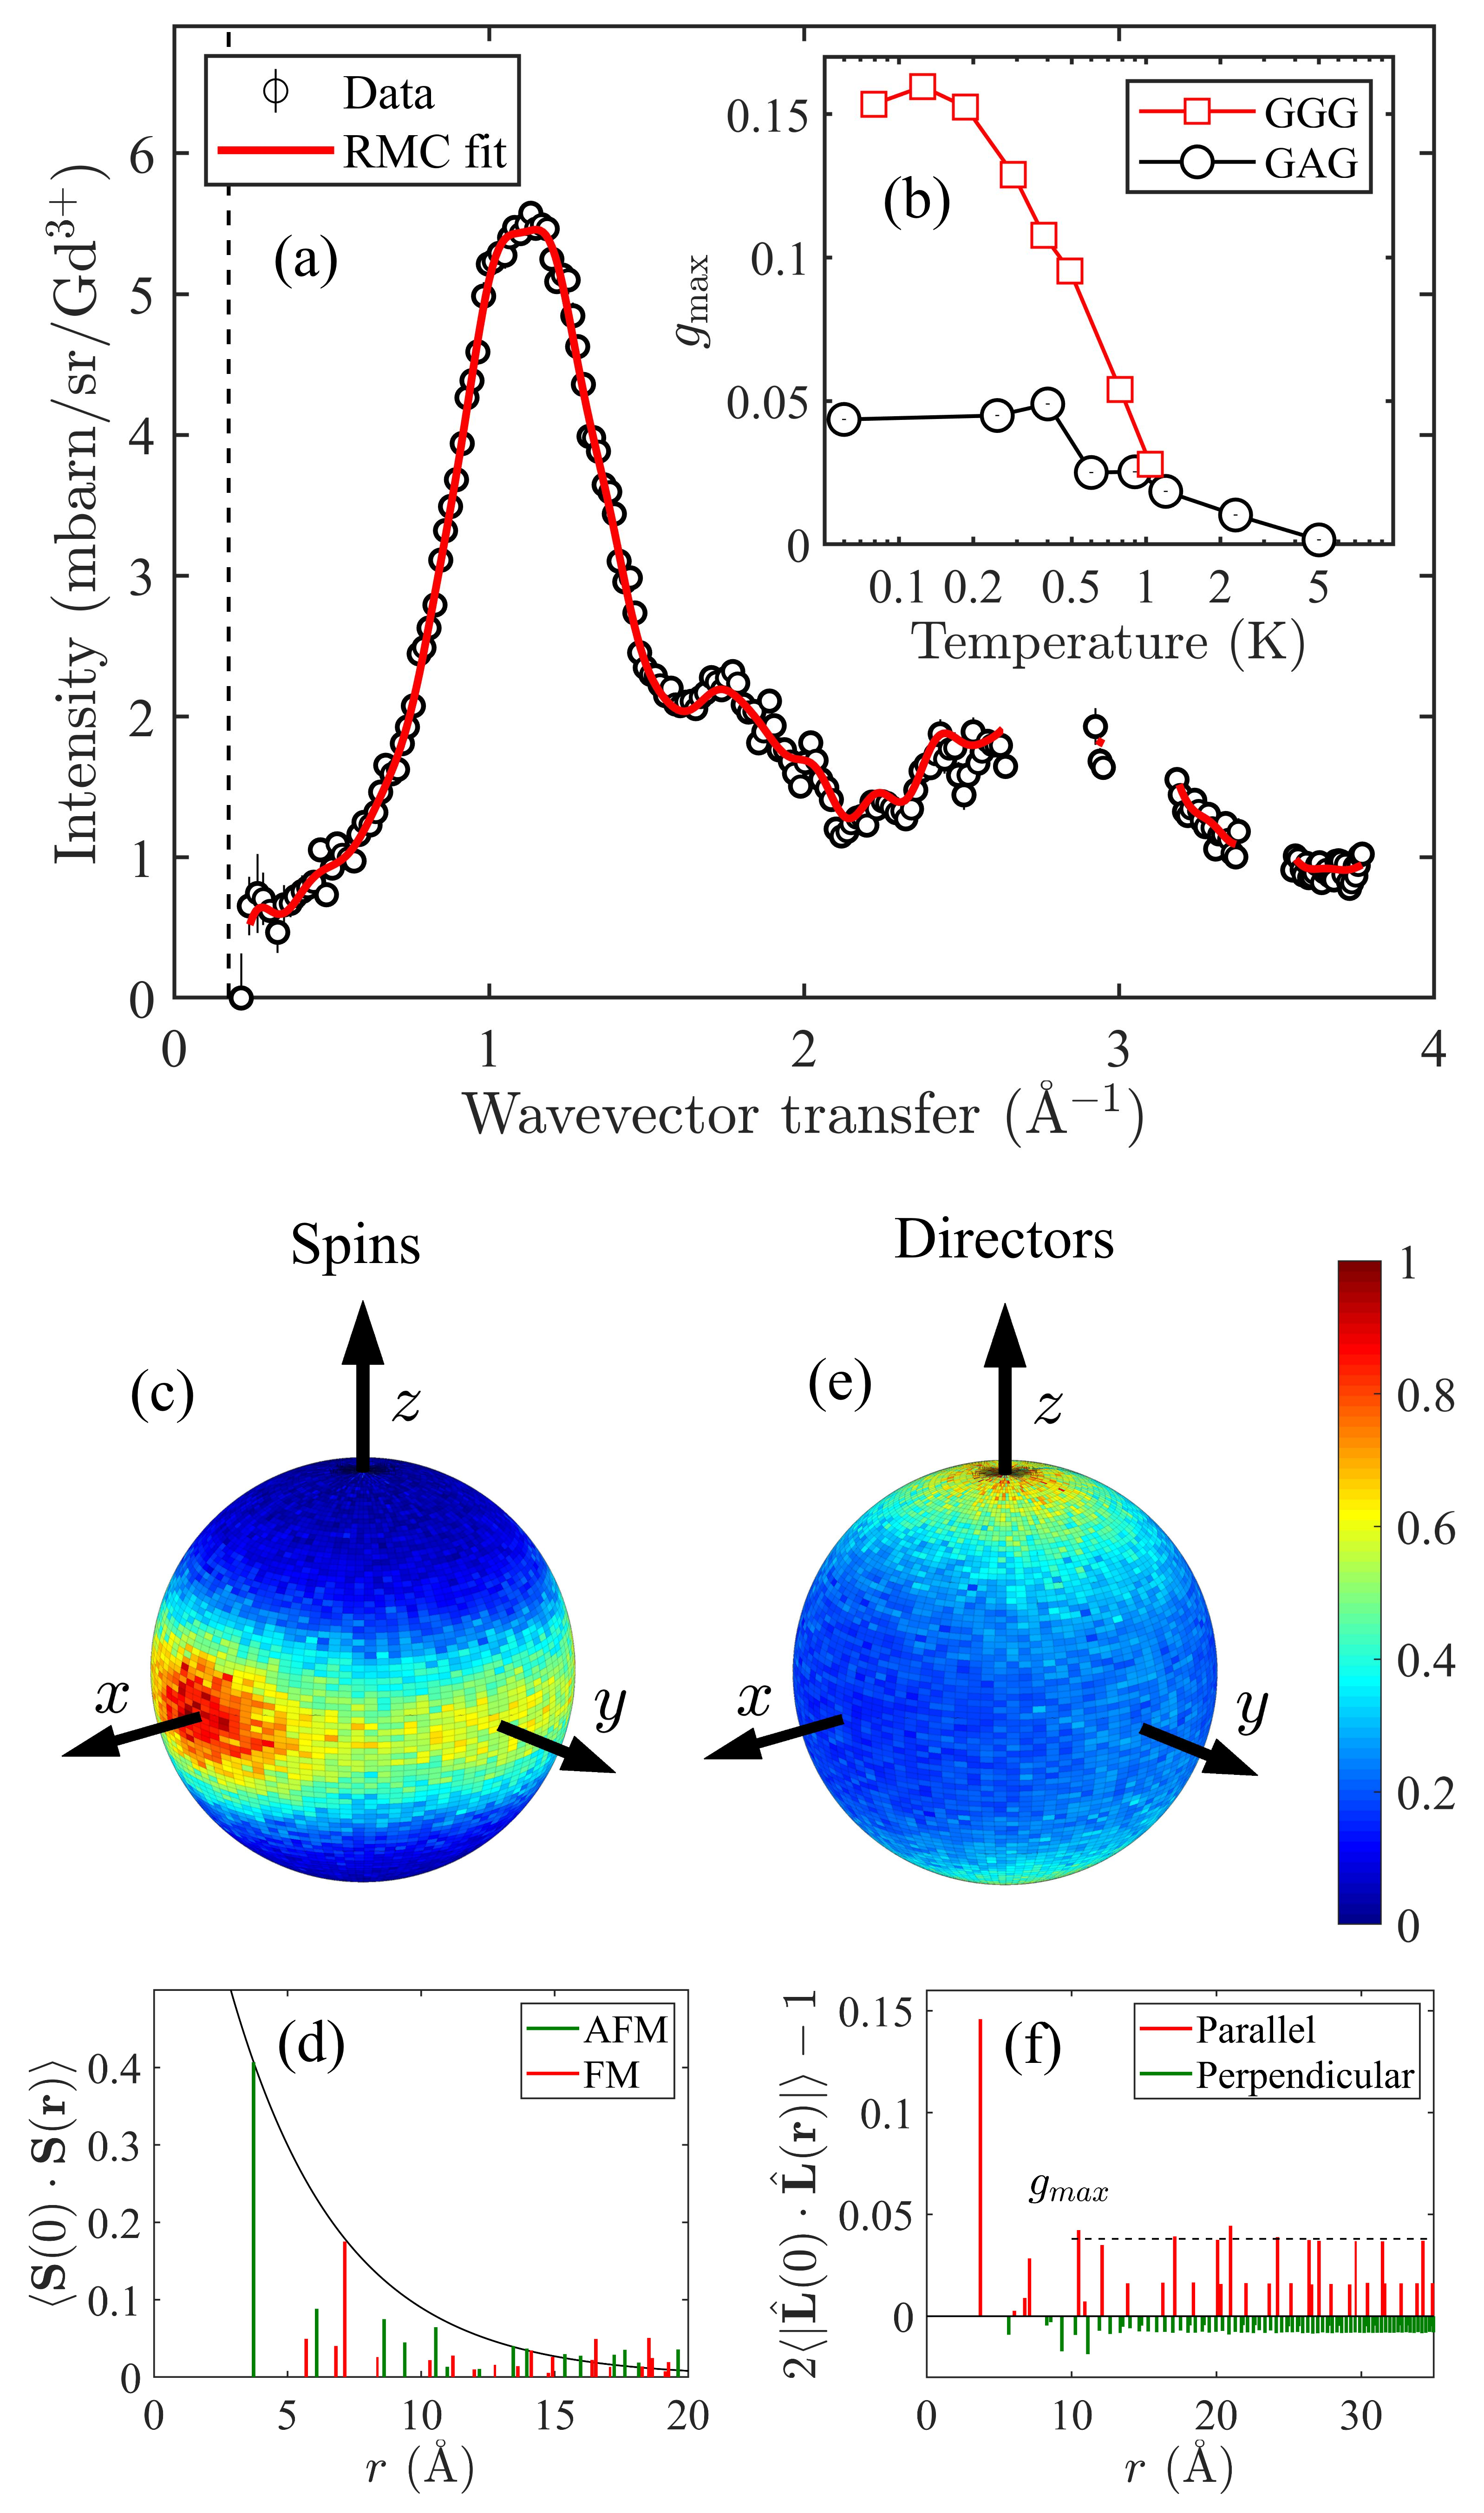
The resulting RMC fit is shown as a continuous red line through the data points in Fig. 2(a), showing excellent agreement with the data. The finite system size makes the calculation unreliable for Å-1, indicated by the dashed black line.
We now look at the RMC spin structure to determine the local spin directions and any director correlations. Fig. 2(c) shows a three dimensional histogram of the local orientation of each Gd3+ spin at 60 mK, normalized by the solid angle of the bin. Similar to GGG we find a strong local -anisotropy. It is possible that the anisotropy originates from the dipolar interaction Paddison et al. (2015). Fig. 2(d) shows the magnitude of the spin-spin correlations averaged over shells at distance , . We find antiferromagnetic near-neighbor correlations which follow an approximate exponentially decay, , with Å. For near neighbors we find . This corresponds to an average angle between near-neighbor spins of 114∘, significantly lower than the 120∘ expected for a pure Heisenberg spin state. In GGG a much smaller deviation was found, 118∘.
In GGG it was found that the spin structure depends strongly on the precise values of , and , and their interplay with the dipolar interaction Yavors’kii et al. (2006). The same is true for GAG, but since and presently are unknown in GAG, we cannot quantify their effect on the spin structure.
In order to look for evidence of the director state we follow Ref. Paddison et al., 2015 and define the 10-spin directors, as the staggered magnetization of a loop
| (2) |
The distribution of directors in GAG is shown in Fig. 2(e), revealing a strong local anisotropy, as also found in GGG. The correlation between directors can be quantified as
| (3) |
where . The director-director correlation is for directors that are parallel, and for directors that are orthogonal. We show in Fig. 2(f). The near-neighbor director-director correlation is strong, which is unsurprising, as neighboring directors share several spins. Importantly, the director-director correlations then falls to a constant value, , that extends beyond 30 Å. As such we find that the directors in GAG remain correlated, albeit weakly, over long distances.
Fig. 2(b) shows the temperature dependence of for GGG and GAG. Both compounds show an increase in below 1.5 K, as the director state emerges. increases rapidly with decreasing temperatures, and peaks at 400 mK and 175 mK for GAG and GGG, respectively. Below this temperature, which coincides roughly with the onset of the spin freezing Schiffer et al. (1994); Quilliam et al. (2013); Florea et al. (2017), appears to remain constant. indicating that the director-director correlations at the lowest temperatures are stronger in GGG than in GAG.
This difference is likely caused by a combination of variations in and , as well as the variation in , with for GAG being smaller by a factor 0.6. It would be interesting to study other Gd3+ based garnets with different values of . For example, Gd3Te2Li3O12 (GTLG) has Quilliam et al. (2013), and we therefore predict a director state to be present in GTLG with . Ref. Mukherjee et al. (2017) also suggests multiple Gd3+-based garnets with varying values of that would be interesting to study. It would also be valuable to determine and for GAG. For GGG, the most accurate determination of these parameters was based on an analysis of the longer-range correlations that set in in GGG for temperatures below 175 mK Yavors’kii et al. (2006). Such correlations are not present in GAG, making a similar analysis impossible at present.
The presence of director correlations in GAG as well as in GGG indicate that any hyperkagome system with antiferromagnetic near-neighbor interactions and relatively strong dipolar interactions should display a director state.
A recent study of the isostructural compound Yb3Ga5O12, (YbGG), also reveals a director state. However, in stark contrast to GGG and GAG, the director state in YbGG is derived from ferromagnetic near-neighbor exchange, with spins directed along the local direction Sandberg et al. (2020), with directors correlated over short distances. Despite these differences, the director state on hyperkagome lattices thus appears to be rather robust. To form a director state, some form of anisotropy in the spin orientation seems to be required. In GGG and GAG, this anisotropy is most likely a result of the dipolar interaction, with the potential addition of small crystal field effects, whereas the anisotropy in YbGG originates almost entirely from crystal field effects,. The precise interactions which determine whether the director state is long- or short-range are unclear.
IV.2 meV dynamics of GAG
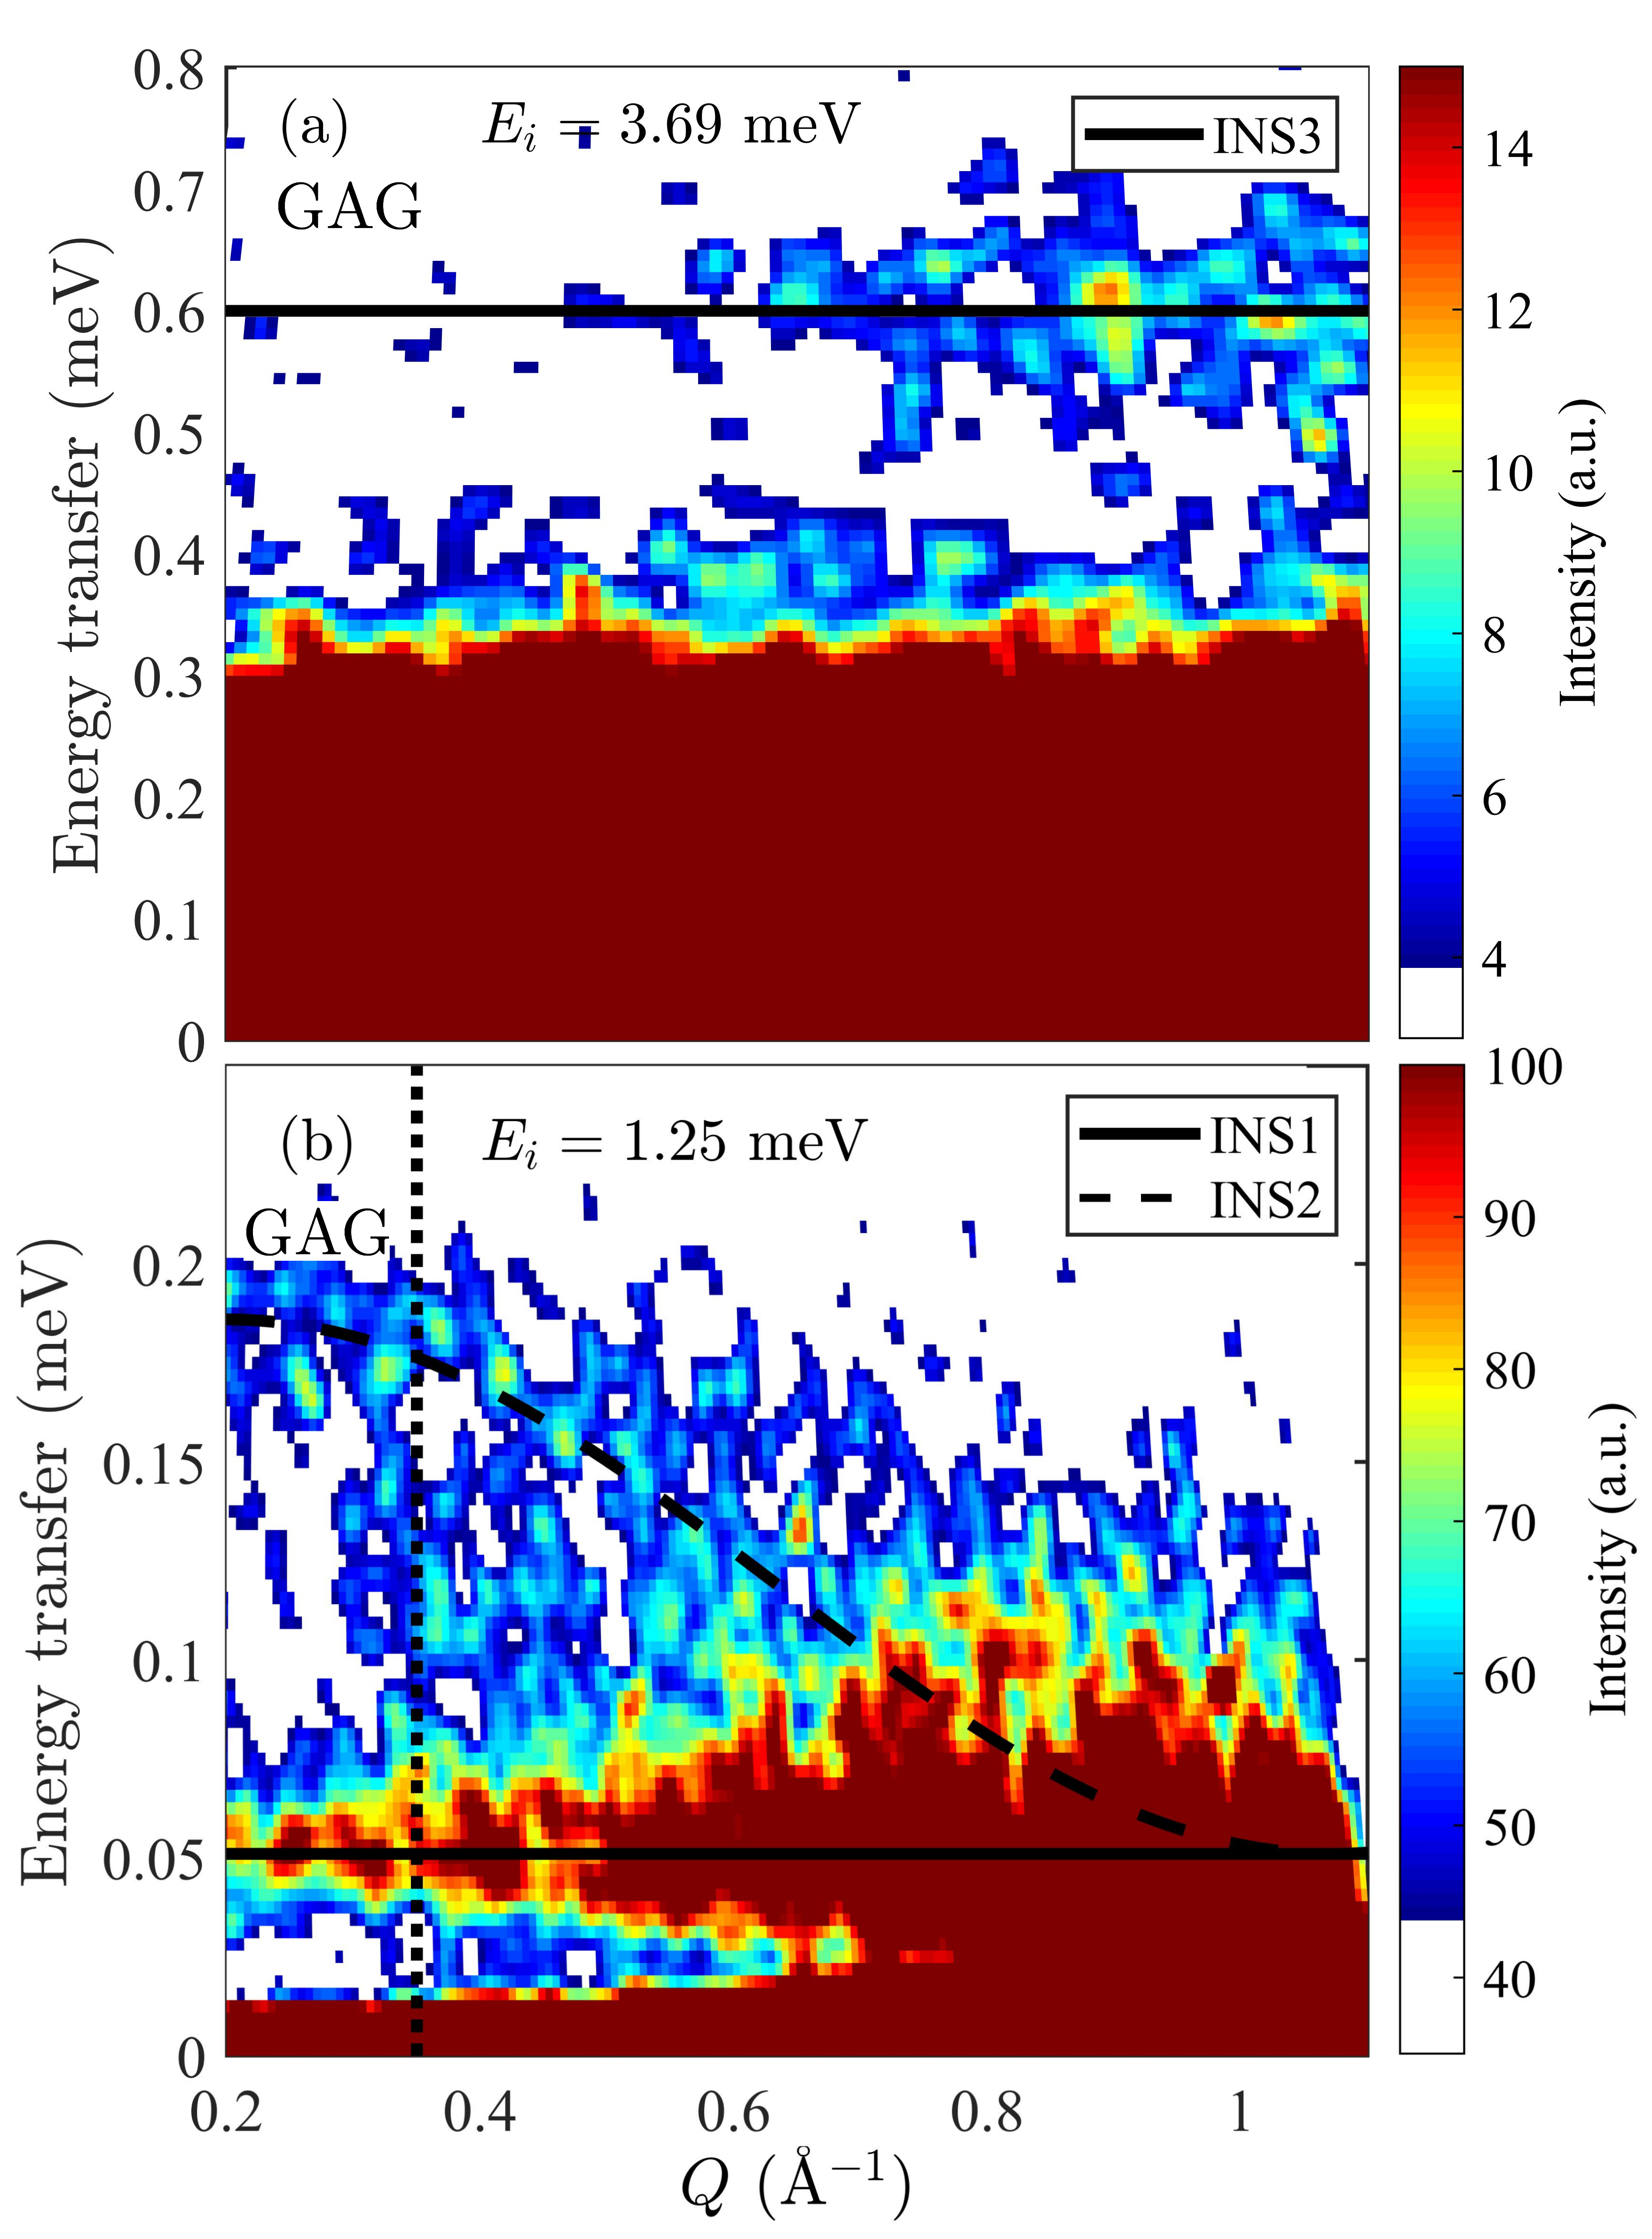
Fig. 3 shows , at 50 mK for GAG measured at LET using incident energies = 3.69 and 2.0 meV. We observe three distinct features, similar to previous results on GGG Deen et al. (2010). We label the three features INS1, INS2 and INS3 in line with the nomenclature employed for GGG.
INS3 is a weak non-dispersive excitation observed at meV, shown in Fig. 3(a). The intensity of this excitation does not follow a single ion form factor, and is thus not a crystal field excitation. In GGG this excitation was found at 0.58(3) meV Deen et al. (2010). At lower energies, Fig. 3(b), we observe two further distinct features, labelled INS1 and INS2. Within the energy resolution and statistics afforded by the experiment INS1 is a low-lying dispersionless excitation at meV with INS2, a much broader feature that is more dispersive in nature. At low , INS2 appears at meV and falls into the elastic line near Å-1. All three excitations have slightly higher energies in GAG than in GGG, consistent with the stronger exchange interactions in GAG.
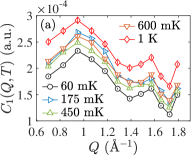
The dotted vertical line in Fig. 3(b) shows the direction of cuts through the data for a range of temperatures mK, 500 mK and 1 K. The cuts are presented in Fig. 4(b). At 50 mK the three excitations are well defined and can be modeled as gapped modes. Upon increasing the temperature, the signal broadens. The gap to INS1 remains visible, but INS2 appears to become overdamped and thus transforms into almost featureless quasi-elastic scattering. INS3, in contrast, remains well defined at least up to 1 K.
The temperature dependence of the position of INS3 is similar to GGG, see Fig. 5(a). Fig. 5(b) shows the resolution-corrected half width at half max () of the INS3 peak in GAG and GGG and the excitation life-time, . At elevated temperatures the excitation life time is nearly identical in the two compounds Deen et al. (2010). The solid line is a guide to the eye.
A magnetic field study by d’Ambrumenil et al. of the magnetic excitations in GGG have previously provided theoretical insight into the excitations of GGG d’Ambrumenil et al. (2015). d’Ambrumenil et al. accurately reproduced the full dispersion of GGG in an applied magnetic field using linear spin-wave theory on the ten-ion loops, including near-neighbor interactions and the dipolar interaction. This study was carried out in a magnetic field large enough to create a ferromagnetic ground state, very different from the zero-field ground state. Still, the dispersion is similar in both applied and zero field, indicating that the underlying excitations are similar. Comparing our results with those of Ref. d’Ambrumenil et al. (2015) suggests that INS1 originates from bands that are near dispersion-less across the entire Brillouin Zone. INS2, on the other hand, consists of multiple dispersive excitations that cross and overlap in reciprocal space.
No equivalent of INS3 is found by linear spin wave theory in the ordered state, and it may therefore have an entirely different origin. The mode is relatively sharp in energy, and has a strikingly similar position and width in the two compounds. The lack of scaling with suggests that near-neighbor interactions is not the main driver of this excitation. In GGG, the INS3 mode was modeled as a singlet-triplet excitation, based on the -dependence of the intensity Deen et al. (2010). Due to the weak signal we could not extract the -dependence of the intensity in GAG, and thus cannot verify if this model fits the present data.
IV.3 eV dynamics of GGG
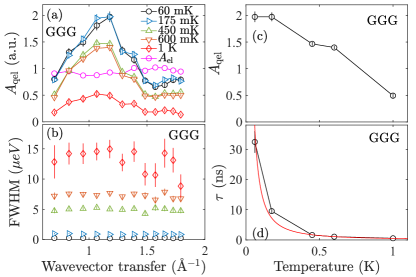
An overview of the backscattering data, , for GGG is shown in Fig. 6 for mK K. At all temperatures a strong elastic signal is present for all accessible wavevector transfers. At the lowest temperature probed, 60 mK, the signal appears almost entirely elastic. A broad quasielastic broadening is observed around 450 mK with a peak in intensity near wavevevector transfer Å-1. At 1 K the quasi-elastic signal has broadened further and reaches the edge of the experimental energy window.
The energy dependence of the total scattering signal is well described, for all scattering vectors and temperatures, by a convolution of the resolution function with a temperature independent elastic term, represented by a delta function, and a temperature dependent quasi-elastic Lorentzian term
| (4) |
where is the resolution function, is the integrated intensity of the elastic signal, and is the intensity of the quasielastic signal, is the FWHM of the quasielastic signal. A linear sloping background is included, described by the parameters and . We have accounted for detailed balancing in the fitting Boothroyd (2020), although the effect is minimal. Fig. 7 shows an example of the data (black circles) and fit (red solid line) at 450 mK and Å-1. We see a significant quasielastic broadening, compared with the instrumental resolution (dashed green line).
The inset of Fig. 7 shows the temperature dependence of the wavevector integrated intensity, which follows the trend seen in Fig. 6. The temperature dependence of the Lorentzian signal indicates its magnetic origin.
The most important fitted parameters are shown in Fig. 8, and the background parameters are discussed in the appendix. The - and temperature dependence of the integrated intensity of the Lorentzian signal, , is shown in Fig. 8(a). The integrated intensity, with broad peaks at =1.1 and 1.8 Å-1, follows the dependence of the elastic magnetic structure factor previously determined for GGGPetrenko et al. (1997), and shown for GAG in Fig. 2(a). The temperature dependence of the integrated intensity of the quasi-elastic component, at Å-1 is shown in Fig. 8(c). It remains roughly constant for K and decreases rapidly with increasing temperature, consistent with the decrease of magnetic correlations with increasing temperature.
The temperature and dependence of the FWHM of the quasi-elastic signal, , is shown in Fig. 8(b). It is interesting to note that is independent of in the accessible range ( Å Å-1), but increases rapidly with increasing temperature. The lack of -dependence indicates that the spin fluctuations are uncorrelated on this energy scale, a surprising result given the existence of both director and static spin-spin correlations in GGG.
A single Lorentzian lineshape indicates that the temporal spin-spin correlations decay as
| (5) |
where the decay rate, is related to the FWHM by Mirebeau et al. (2008). The temperature dependence of at Å-1 is shown in Fig. 8(d) and follows , with . Our results are consistent with earlier Mössbauer measurements on GGG Bonville et al. (2004) as well as muon spin rotation measurements Marshall et al. (2002); Dunsiger et al. (2000), who all found spin fluctuations in GGG on a similar time scale as presented here. In the Mössbauer measurements, the temperature dependence was quadratic Bonville et al. (2004) and the fluctuations were shown to be confined to a plane, consistent with the spin anisotropy mentioned earlier Paddison et al. (2015).
Significant theoretical work has been performed on the spin fluctuation rate for a system of classical spins on frustrated lattices. Conlon and Chalker predicted, for Heisenberg spins on a pyrochlore lattice in a cooperative paramagnetic regime, a linear temperature dependence of the spin fluctuation rate () with spin correlations that relax at a rate independent of the wavevector transfer Conlon and Chalker (2009) The hyperkagome lattice can be viewed as a depleted pyrochlore lattice, where each tetrahedron is missing a site. As such, we can expect the magnetic behavior on these two systems to be similar. In GGG, for K, the spin correlations are indeed independent of , although follows a power law rather than being linear.
More recently, the diffusive dynamics on frustrated kagome lattices have been investigated. Taillefumier predicts a distribution of timescales in the cooperative paramagnetic regime representing loops diffusing in an entropically dominated free energy landscape. The signature of such diffusion can be observed for where is the loop spatial scale. In this region, increases linearly with Taillefumier et al. (2014). Unfortunately, we do not access a wavevector transfer below 0.7 Å-1, and thus do not directly observe this. However, in line with Taillefumier, at larger wavevector transfers the fluctuation rate is proportional to temperature and independent of Taillefumier et al. (2014). We therefore suggest that we are probing the diffusive dynamics of the multipolar director state in GGG. Data at lower is required to confirm or reject this hypothesis. Such experiments will be challenging due to the vanishing intensity at low as seen in diffraction experiments.
Further progress on understanding the director dynamics on the eV and meV energy scale will also require inelastic neutron scattering experiments on single crystal samples. Such experiments are only feasible on isotope enriched single crystals to minimize the absorption of cold neutrons required to achieve the relevant energy resolutions. The cost of such crystals is prohibitively high.
Finally, we note that some magnetic scattering is seen in the apparent background signal, as it depends on temperature (see the appendix for details). This indicates that part of the background originates from motions on a larger energy scale than the accessible energy window of IN16b ( eV), as also found in similar backscattering measurements on Tb2Sn2O7 Mirebeau et al. (2008). It is likely that this contribution originates from the tails of the lowest excitation, INS1, observed at 0.05(1) meV at the lowest temperature.
IV.4 AC susceptibility
AC susceptibility is a very sensitive probe of low frequency magnetic dynamics Topping and Blundell (2019). In our AC susceptibility measurements we measure the real () and imaginary susceptibility (), for both GGG and GAG as a function of temperature.
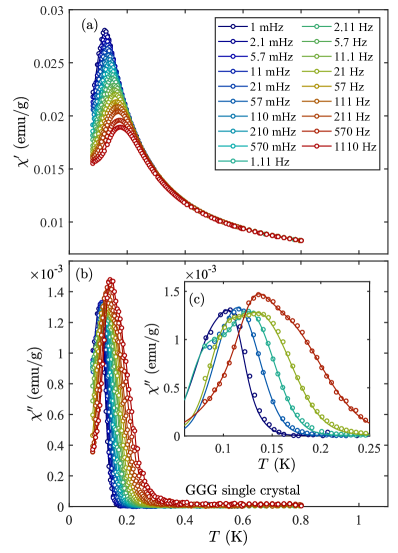
Fig. 9(a) shows for a single crystal of GGG with the AC field applied along the direction. An anomaly around mK is seen, with a slight frequency-dependence. Fig. 9(b) shows for the same single crystal, with (c) zooming in on selected frequencies. The temperature dependence of varies from a single peak for frequencies below Hz to a double peak structure emerging for frequencies 5 Hz. We fitted the peaks using Gaussian line shapes to extract the position of the peaks.
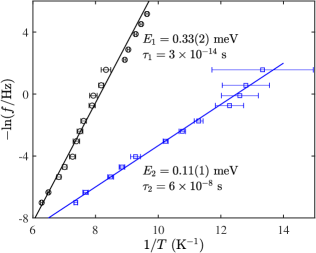
The frequency dependence of the peak position of these curves follows an Arrhenius temperature dependence, see Fig. 10.
| (6) |
where , is an activation energy and the relaxation lifetime of spin vector reversal. The excellent fit to the Arrhenius law indicates that the motion of the spins on this energy scale is governed by thermal activation across an energy barrier. Two distinct peaks indicate two distinct relaxation processes.
The fits to the data using the Arrhenius law for each of the two peaks provide activation energies of = 0.33(2) meV (3.8(3) K) and = 0.11(1) meV (1.3(2) K) and relaxation lifetimes of = s and = s. It should be noted that the uncertainty on is about an order of magnitude. The energy barriers are the same order of magnitude as the excitation energies probed with neutron scattering.
The temperature dependence of for powdered GGG is given in Fig. 11(a) for , 111 and 211 Hz. Two anomalies are seen, near 350 mK and 100 mK, as also found previously Schiffer et al. (1995). The signal is much broader than for the single crystal, and the two anomalies are at different temperatures than the anomaly in for the single crystal of GGG.
Fig. 9(b) shows the temperature dependence of for powdered GAG for a larger range of frequencies. Here, a single, broad peak is seen around 350 mK. The broadness of the peak indicates a broad distribution of time scales in the system.
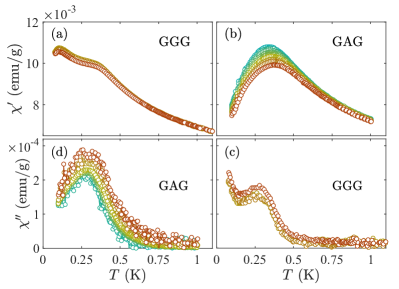
The temperature dependence of is shown in Fig. 9(c) for GGG and Fig. 9(d) for GAG. In both cases a broad anomaly is seen around 250 mK. The peaks in the powdered data are substantially broader than the single crystal data on GGG, which indicates the existence of a broader distribution of relaxation times in the system. In both compounds the peak temperature of depends very weakly on frequency. However, fitting to an Arrhenius law, gives unphysical characteristic times, suggesting that the freezing mechanism is more complex, and cannot be explained with a single energy barrier. Modifications to the Arrhenius law, such as the Vogel-Fulcher law Shtrikman and Wohlfarth (1981), can be made to fit the data with sensible parameters, but the correlations between fitted parameters become so large that interpretation of their values is meaningless. Instead, the frequency dependence of the peak can be analyzed through the Mydosh parameter , frequently used to describe spin glasses,
| (7) |
where is the temperature of the maximum. For the GGG powder, we have insufficient data to determine . For GAG, we obtain , which falls in the range of insulating spin-glasses, if a bit smaller Mydosh (1993). Nevertheless, the broad shape of the features in GAG and of the ZFC-FC magnetization Florea et al. (2017) seems to preclude a conventional spin-glass transition. In particular, we could not accurately determine the freezing temperature which would have allowed us to perform dynamical scaling and estimate possible critical exponents. Further measurements, in a larger frequency range are thus needed to conclude on the nature of the freezing in GAG. The broad feature is reminiscent of the heterogeneous freezing scenario proposed for Heisenberg kagomé antiferromagnets Cépas and Canals (2012), and thus suggests that multiple time and lengths scales are involved in this relaxation mechanism.
Our AC susceptibility measurements on GGG and GAG confirm the spin freezing upon cooling below 175 mK and 300 mK respectively, with a frequency dependent and . Most interestingly, the temperature dependence of for the single crystal of GGG displays an unusual double peaked structure. The frequency dependence of each peak follows an Arrhenius law, thus indicating the presence of two distinct thermally activated processes. Single spin magnetization precession is typically on the ps timescale, e.g. Ref. Beauvillain et al., 1984, indicating that the first process in GGG, with s, is related to single spin reversal. The second process ( s) is too slow to involve single spins, and is thus probing the dynamics of larger structures, which we can reasonably assume to be the ten-ion loops. These results differ from those by Ghosh et al. Ghosh et al. (2008) who probed the ten-ion looped structure using magnetic hole burning and found temperature independent clusters behaving as quantum objects. In our case the signatures remain thermally driven.
In contrast to the single crystal measurements on GGG, the temperature dependence of the powdered GAG AC susceptibility displays a very broad single peaked structure, from which we could not extract a characteristic energy scale. Most probably, a wide distribution of correlation lengths is involved in this dynamical process, which is consistent with the smaller strength of the ten-ion loops correlations in GAG compared with GGG. The larger deviation from the spin structure in GAG than in GGG obtained in the diffraction measurements may also explain the differences between the observed slow dynamics.
V Summary and conclusion
In summary, we have presented an extensive comparative study of GGG and GAG using neutron diffraction, neutron backscattering and time-of-flight spectroscopy and AC susceptibility. We confirm the existence of long range director correlations in GAG, and propose that it will be present in all garnets with antiferromagnetic near-neighbor exchange and relatively strong dipolar interaction or local -anisotropy. The reduced value in GAG as well as possible changes in and result in weaker director correlations.
On the meV scale, GGG and GAG show similar dynamics with three distinct excitations, INS1-3. In particular, the temperature dependence of the excitation energy and lifetime of the INS3 excitation at 0.58 meV is nearly identical in the two compounds, indicating that it is not driven by near neighbor exchange interactions. The other two excitations are reminiscent of spin waves found in the polarized state of GGG.
On the eV scale, the spins in GGG fluctuate with a rate that decreases as . The fluctuations are independent of wavevector transfer in the probed range, consistent with the presence of spin diffusion. The slowest dynamics probed by AC susceptibility with low frequencies reveal two distinct fluctuation processes in GGG. One of these is associated with single spin fluctuations, while the other is associated to larger structures, most likely the directors.AC susceptibility on powders of GGG and GAG furthermore give insight into the nature of the freezing of the spins that occurs at low temperature.
We have suggested several directions for further experimental and theoretical work: On the experimental side it would be interesting to ascertain the presence of director correlations in other Gd-based hyperkagome systems, such as Gd3Te2Li3O12. In addition, experimental work to determine the further-neighbor exchange constants in GAG would be valuable.
Based on our AC susceptibility data we expect the eV dynamics of GAG to be different from GGG. This prediction can be straightforwardly tested experimentally on powders of GAG. To determine if the -independence of the quasi-elastic broadening is caused by spin diffusion or uncorrelated fluctuations, we propose two experiments: First, similar backscattering experiments as presented here, but reaching lower -values, would reach the regime where the width of the signal decreases linearly with decreasing in a spin diffusion model. Such an experiment will be difficult due to the small magnetic signal at the required low . Second, measurements on an isotope enriched single crystal would reveal any -dependence on the signal which is currently lost in powder averaging. Unfortunately, 160Gd is extremely expensive.
With an isotope enriched single crystal the meV dynamics could also be studied further. We expect INS2 to consist of multiple broad bands of excitations that are similar in nature to the excitations found in the field-polarized state.
Finally, it is also clear that more theoretical work is required. The origin of the INS3 excitation remains unclear, as does the exact nature of the excitations associated with the director correlations. Conventional spin wave theory is not applicable to these systems, but another avenue to approach this problem could be numerical Langevin simulations.
Acknowledgements.
This work was supported by the Danish Council for Independent Research through DANSCATT. This work is based on neutron scattering experiments performed at Institut Laue-Langevin, France, and at ISIS, UK. Experiments at the ISIS Neutron and MuonSource were supported by beam-time allocations from the Science and Technology Facilities Council. The work was supported by MAX4ESSFUN as part of the Interreg project ESS&MAX IV Cross Border Science and Society, Ref. no. KU-001. HJ acknowledges funding from the EU Horizon 2020 programme under the Marie Sklodowska-Curie grant agreement No701647. We thank Rasmus Tang and Emil Martiny for useful discussions.References
- Fennell et al. (2009) T. Fennell, P. P. Deen, A. R. Wildes, K. Schmalzl, D. Prabhakaran, A. T. Boothroyd, R. J. Aldus, D. F. McMorrow, and S. T. Bramwell, “Magnetic Coulomb phase in the spin ice Ho2Ti2O7.” Science 326, 415 (2009).
- Morris et al. (2009) D. J. P. Morris, D. A. Tennant, S. A. Grigera, B. Klemke, C. Castelnovo, R. Moessner, C. Czternasty, M. Meissner, K. C. Rule, J. Hoffmann, K. Kiefer, S. Gerischer, D. Slobinsky, and R. S. Perry, “Dirac Strings and Magnetic Monopoles in the Spin Ice Dy2Ti2O7,” Science 326, 411 (2009).
- Castelnovo et al. (2007) C. Castelnovo, R. Moessner, and S. L. Sondhi, “Magnetic monopoles in spin ice,” Nature 451, 42 (2007).
- Giblin et al. (2011) S. R. Giblin, S. T. Bramwell, P. C. W. Holdsworth, D. Prabhakaran, and I. Terry, “Creation and measurement of long-lived magnetic monopole currents in spin ice,” Nature Physics 7, 252 (2011).
- Dusad et al. (2019) R. Dusad, F. K. K. Kirschner, J. C. Hoke, B. R. Roberts, A. Eyal, F. Flicker, G. M. Luke, S. J. Blundell, and J. C. S. Davis, “Magnetic monopole noise,” Nature 571, 234 (2019).
- Paddison et al. (2015) J. A. M. Paddison, H. Jacobsen, O. A. Petrenko, M. T. Fernandez-Diaz, P. P. Deen, and A. L. Goodwin, “Hidden order in spin-liquid Gd3Ga5O12,” Science 350, 179 (2015).
- Lee et al. (2002) S. Lee, C. Broholm, W. Ratcliff, G. Gasparovic, Q. Huang, T. H. Kim, and S. Cheong, “Emergent excitations in a geometrically frustrated magnet.” Nature 418, 856 (2002).
- Ghosh et al. (2008) S. Ghosh, T. F. Rosenbaum, and G. Aeppli, “Macroscopic signature of protected spins in a dense frustrated magnet,” Phys. Rev. Lett. 101, 157205 (2008).
- Deen et al. (2010) P. P. Deen, O. A. Petrenko, G. Balakrishnan, B. D. Rainford, C. Ritter, L. Capogna, H. Mutka, and T. Fennell, “Spin dynamics in the hyperkagome compound Gd3Ga5O12,” Phys. Rev. B 82, 174408 (2010).
- Dunsiger et al. (2000) S. R. Dunsiger, J. S. Gardner, J. A. Chakhalian, A. L. Cornelius, M. Jaime, R. F. Kiefl, R. Movshovich, W. A. MacFarlane, R. I. Miller, J. E. Sonier, and B. D. Gaulin, “Low temperature spin dynamics of the geometrically frustrated antiferromagnetic garnet Gd3Ga5O12,” Phys. Rev. Lett. 85, 3504 (2000).
- Marshall et al. (2002) I. M. Marshall, S. J. Blundell, F. L. Pratt, A. Husmann, C. A. Steer, A. I. Coldea, W. Hayes, and R. C. C. Ward, “A muon-spin relaxation (SR) study of the geometrically frustrated magnets Gd3Ga5O12 and ZnCr2O4,” J. Phys. Condens. Matter 14, L157 (2002).
- Bonville et al. (2004) P. Bonville, J. A. Hodges, J. P. Sanchez, and P. Vulliet, “Planar spin fluctuations with a quadratic thermal dependence rate in spin liquid Gd3Ga5O12,” Phys. Rev. Lett. 92, 167202 (2004).
- d’Ambrumenil et al. (2015) N. d’Ambrumenil, O. A. Petrenko, H. Mutka, and P. P. Deen, “Dispersionless Spin Waves and Underlying Field-Induced Magnetic Order in Gadolinium Gallium Garnet,” Phys. Rev. Lett. 114, 227203 (2015).
- Lefrançois et al. (2019) E. Lefrançois, L. Mangin-Thro, E. Lhotel, J. Robert, S. Petit, V. Cathelin, H. E. Fischer, C. V. Colin, F. Damay, J. Ollivier, P. Lejay, L. C. Chapon, V. Simonet, and R. Ballou, “Spin decoupling under a staggered field in the Gd2Ir2O7 pyrochlore,” Phys. Rev. B 99, 060401(R) (2019).
- Kinney and Wolf (1979) W. I. Kinney and W. P. Wolf, “Magnetic interactions and short-range order in gadolinium gallium garnet,” Journal of Applied Physics 50, 2115 (1979).
- Petrenko et al. (1998) O. A. Petrenko, C. Ritter, M. Yethiraj, and D. McK Paul, “Investigation of the Low-Temperature Spin-Liquid Behavior of the Frustrated Magnet Gadolinium Gallium Garnet,” Phys. Rev. Lett. 80, 4570 (1998).
- Schiffer et al. (1994) P. Schiffer, A. P. Ramirez, D. A. Huse, and A. J. Valentino, “Investigation of the field induced antiferromagnetic phase transition in the frustrated magnet: Gadolinium gallium garnet,” Phys. Rev. Lett. 73, 2500 (1994).
- Quilliam et al. (2013) J. A. Quilliam, S. Meng, H. A. Craig, L. R. Corruccini, G. Balakrishnan, O. A. Petrenko, A. Gomez, S. W. Kycia, M. J. P. Gingras, and J. B. Kycia, “Juxtaposition of spin freezing and long range order in a series of geometrically frustrated antiferromagnetic gadolinium garnets,” Phys. Rev. B 87, 174421 (2013).
- Florea et al. (2017) O. Florea, E. Lhotel, H. Jacobsen, C. S. Knee, and P. P. Deen, “Absence of magnetic ordering and field-induced phase diagram in the gadolinium aluminum garnet,” Phys. Rev. B 96, 220413(R) (2017).
- Yavors’kii et al. (2006) T. Yavors’kii, M. Enjalran, and M. J. P. Gingras, “Spin hamiltonian, competing small energy scales, and incommensurate long-range order in the highly frustrated Gd3Ga5O12 garnet antiferromagnet,” Phys. Rev. Lett. 97, 267203 (2006).
- Deen et al. (2015a) P. P. Deen, O. Florea, E. Lhotel, and H. Jacobsen, “Updating the phase diagram of the archetypal frustrated magnet Gd3Ga5O12,” Phys. Rev. B 91, 014419 (2015a).
- Petrenko et al. (1997) O. A. Petrenko, C. Ritter, M. Yethiraj, and D. McK Paul, “Spin-liquid behavior of the gadolinium gallium garnet,” Physica B 241-243, 727 (1997).
- Deen et al. (2015b) P. P. Deen, O. Florea, H. Paul, H. Jacobsen, A. Khaplanov, C. Knee, E. Lhotel, and A. Wildes, “Magnetic frustration in 3d hyperkagome compounds,” Institut Laue-Langevin (ILL), doi:10.5291/ILL-DATA.5-32-805 (2015b).
- Deen et al. (2014a) P. P. Deen, O. Florea, P. Henry, H. Jacobsen, C. Knee, E. Lhotel, and A. Wildes, “Emergent excitations and long range order in Gd3Al5O12,” Institut Laue-Langevin (ILL), doi:10.5291/ILL-DATA.5-32-795 (2014a).
- Ehlers et al. (2013) G. Ehlers, J. R. Stewart, A. R. Wildes, P. P. Deen, and K. H. Andersen, “Generalization of the classical xyz-polarization analysis technique to out-of-plane and inelastic scattering,” Review of Scientific Instruments 84, 093901 (2013).
- Stewart et al. (2009) J. R. Stewart, P. P. Deen, K. H. Andersen, H. Schober, J. Barthélémy, J. M. Hillier, A. P. Murani, T. Hayes, and B. Lindenau, “Disordered materials studied using neutron polarization analysis on the multi-detector spectrometer, D7,” J. Appl. Crystallogr. 42, 69 (2009).
- Richard et al. (1996) D. Richard, M. Ferrand, and G. J. Kearley, “Analysis and visualisation of neutron-scattering data,” Journal of Neutron Research 4, 33 (1996).
- Rodríguez-Carvajal (1993) J. Rodríguez-Carvajal, “Recent advances in magnetic structure determination by neutron powder diffraction,” Physica B: Condensed Matter 192, 55 (1993).
- Bewley et al. (2011) R. I. Bewley, J. W. Taylor, and S. M. Bennington., “LET, a cold neutron multi-disk chopper spectrometer at ISIS,” Nucl. Instrum. Methods Phys. Res. A 637, 128 (2011).
- Deen et al. (2015c) P. P. Deen, K. Lefmann, J. Guyon-Le-Bouffy, C. Knee, P. Henry, O. Petrenko, N. d’Ambrumenil, H. Jacobsen, and R. Bewley, “Dispersionless spin waves and field-induced magnetic order in Gd3Al5O12,” STFC ISIS Neutron and Muon Source, https://doi.org/10.5286/ISIS.E.RB1520308 (2015c).
- Arnold et al. (2014) O. Arnold, J. C. Bilheux, J. M. Borreguero, A. Buts, S. I. Campbell, L. Chapon, M. Doucet, N. Draper, R. Ferraz Leal, M. A. Gigg, V. E. Lynch, A. Markvardsen, D. J. Mikkelson, R. L. Mikkelson, R. Miller, K. Palmen, P. Parker, G. Passos, T. G. Perring, P. F. Peterson, S. Ren, M. A. Reuter, A. T. Savici, J. W. Taylor, R. J. Taylor, R. Tolchenov, W. Zhou, and J. Zikovsky, “Mantid - Data analysis and visualization package for neutron scattering and SR experiments,” Nucl. Instrum. Methods Phys. Res. A 764, 156 (2014).
- Deen et al. (2014b) P. P. Deen, B. Frick, H. Jacobsen, and T. Seydel, “ Exploring microeV dynamics in Gadolinium Gallium Garnet,” Institut Laue-Langevin (ILL), doi:10.5291/ILL-DATA.4-03-1704 (2014b).
- Frick et al. (2010) B. Frick, E. Mamontov, L. V. Eijck, and T. Seydel, “Recent Backscattering Instrument Developments at the ILL and SNS,” Zeitschrift für Physikalische Chemie 224, 33 (2010).
- (34) C. Paulsen, “Introduction to physical techniques in molecular magnetism: Structural and macroscopic techniques,” (University of Zaragoza, Zaragoza, 2001).
- Paddison et al. (2013) J. A. M. Paddison, J. Ross Stewart, and A. L. Goodwin, “Spinvert: a Program for Refinement of Paramagnetic Diffuse Scattering Data,” J. Phys. Condens. Matter 25, 454220 (2013).
- Metropolis and Ulam (1949) N. Metropolis and S. Ulam, “The Monte Carlo Method,” Journal of the American Statistical Association 44, 335 (1949).
- Mukherjee et al. (2017) P. Mukherjee, A. C. S. Hamilton, H. F. J. Glass, and S. E. Dutton, “Sensitivity of magnetic properties to chemical pressure in lanthanide garnets Ln3A2X3O12, Ln = Gd, Tb, Dy, Ho, A = Ga, Sc, In, Te, X = Ga, Al, Li,” J. Phys. Condens. Matter 29, 405908 (2017).
- Sandberg et al. (2020) L. Ø. Sandberg, R. Edberg, I. M. B. Bakke, K. S. Pedersen, M. C. Hatnean, G. Balaskrishnan, L. Mangin-Thro, A. Wildes, B. Fåk, G. Ehlers, G. Sala, P. Henelius, K. Lefmann, and P. P. Deen, “Emergent magnetic behavior in the frustrated Yb3Ga5O12 garnet,” (2020), arXiv:2005.10605 .
- Boothroyd (2020) A. Boothroyd, Principles of Neutron Scattering from Condensed Matter (Oxford University Press, Oxford, 2020).
- Mirebeau et al. (2008) I. Mirebeau, H. Mutka, P. Bonville, A. Apetrei, and A. Forget, “Investigation of magnetic fluctuations in Tb2Sn2O7,” Phys. Rev. B 78, 174416 (2008).
- Conlon and Chalker (2009) P. H. Conlon and J. T. Chalker, “Spin Dynamics in Pyrochlore Heisenberg Antiferromagnets,” Phys. Rev. Lett. 102, 237206 (2009).
- Taillefumier et al. (2014) M. Taillefumier, J. Robert, C. L. Henley, R. Moessner, and B. Canals, “Semiclassical spin dynamics of the antiferromagnetic Heisenberg model on the kagome lattice,” Phys. Rev. B 90, 064419 (2014).
- Topping and Blundell (2019) C. V. Topping and S. J. Blundell, “A.C. susceptibility as a probe of low-frequency magnetic dynamics,” J. Phys. Condens. Matter 31, 013001 (2019).
- Schiffer et al. (1995) P. Schiffer, A. P. Ramirez, D. A. Huse, P. L. Gammel, U. Yaron, D. J. Bishop, and A. J. Valentino, “Frustration Induced Spin Freezing in a Site-Ordered magnet: Gadolinium Gallium Garnet,” Phys. Rev. Lett. 74, 2379 (1995).
- Shtrikman and Wohlfarth (1981) S. Shtrikman and E.P. Wohlfarth, “The theory of the vogel-fulcher law of spin glasses,” Physics Letters A 85, 467–470 (1981).
- Mydosh (1993) J. Mydosh, Spin Glasses: An Experimental Introduction (1st ed.) (CRC Press, 1993) https://doi.org/10.1201/9781482295191.
- Cépas and Canals (2012) O. Cépas and B. Canals, “Heterogeneous freezing in a geometrically frustrated spin model without disorder: Spontaneous generation of two time scales,” Phys. Rev. B 86, 024434 (2012).
- Beauvillain et al. (1984) P. Beauvillain, C. Dupas, J. P. Renard, and P. Veillet, “Experimental study of the spin freezing in an insulating spin-glass: Static and dynamical aspects,” Phys. Rev. B 29, 4086 (1984).
Appendix A Analysis of backscattering data
The Lorentzian signal sits atop a linear background, with the flat part , increasing with temperature as shown in Fig. 12(a). The slope of the background depends slightly on and shows no systematic temperature dependence. Importantly, the slope is small compared with the flat part, and we can ignore it in the following analysis. The flat part of the background signal depends on temperature and , but can be subdivided into two parts to represent a background contribution from sample environment (-independent part ) and a magnetic contribution, (Q-independent part, ):
| (8) |
Fig. 12(b) shows , the magnetic component.
increases with increasing temperature and thus indicates that it originates from motions on a larger energy scale than the accessible energy window of IN16b ( eV), similar to previous backscattering measurements on Tb2Sn2O7 Mirebeau et al. (2008). It is likely that this contribution originates from the tails of the lowest excitation, INS1, observed at 0.05(1) meV.