Selectivity in yttrium manganese oxide synthesis via local chemical potentials in hyperdimensional phase space
Abstract
In sharp contrast to molecular synthesis, materials synthesis is generally presumed to lack selectivity. The few known methods of designing selectivity in solid-state reactions have limited scope, such as topotactic reactions or strain stabilization. This contribution describes a general approach for searching large chemical spaces to identify selective reactions. This novel approach explains the ability of a nominally “innocent” \ceNa2CO3 precursor to enable the metathesis synthesis of single-phase \ceY2Mn2O7 – an outcome that was previously only accomplished at extreme pressures and which cannot be achieved with closely related precursors of \ceLi2CO3 and \ceK2CO3 under identical conditions. By calculating the required change in chemical potential across all possible reactant-product interfaces in an expanded chemical space including Y, Mn, O, alkali metals, and halogens, using thermodynamic parameters obtained from density functional theory calculations, we identify reactions that minimize the thermodynamic competition from intermediates. In this manner, only the Na-based intermediates minimize the distance in the hyperdimensional chemical potential space to \ceY2Mn2O7, thus providing selective access to a phase which was previously thought to be metastable. Experimental evidence validating this mechanism for pathway-dependent selectivity is provided by intermediates identified from in situ synchrotron-based crystallographic analysis. This approach of calculating chemical potential distances in hyperdimensional compositional spaces provides a general method for designing selective solid-state syntheses that will be useful for gaining access to metastable phases and for identifying reaction pathways that can reduce the synthesis temperature, and cost, of technological materials.
These authors contributed equally to this work. \alsoaffiliationDepartment of Materials Science and Engineering, University of California, Berkeley, CA 94720, USA \altaffiliationThese authors contributed equally to this work. \alsoaffiliationDepartment of Chemistry, Brookhaven National Laboratory, Upton, NY 11973, USA \alsoaffiliationDepartment of Materials Science and Engineering, University of California, Berkeley, CA 94720, USA
1 Introduction
Molecular reactions use catalysts to increase the rate of reaction and achieve selectivity by modifying specific barriers in the reaction pathway. However, this approach cannot be readily translated to the synthesis of non-molecular compounds, which are found in a wide range of industrial applications ranging from batteries in electronic devices to cement in concrete. To achieve selective control over solid-state reactions, a necessary first step is “turning down the heat” enough to prevent non-selective phase interconversion 1. An extreme example of this strategy is a topotactic reaction involving ion exchange in which only a single type of atom is mobile (e.g., cations 2 or anions 3, 4), which has enabled lithium-ion battery technology 5. However, such reactions require a relatively inert framework that facilitates the mobility of these ions. Another route to selective synthesis is epitaxial strain stabilization on a single-crystal or polycrystalline substrate 6. While algorithms to search for suitable substrates exist 7, the epitaxial stabilization requires the synthesis of a chemically-compatible lattice-matched substrate, which yields only a limited amount of material that is necessarily attached to the underlying substrate.
To address the challenge of designing selective reactions in solid-state chemistry, one must have an understanding of how the reaction proceeds. Pairwise reactions at interfaces between solids dominate selection of a reaction pathway 8, 9. With the inclusion of additional elements, as in metathesis reactions 10, 11, one can avoid highly stable and thus unreactive intermediates, as demonstrated in the formation of \ceMgCr2S4 while avoiding the inert reactant \ceCr2S3 12, 13. In the preparation of complex oxides, “assisted” metathesis reactions reach quantitative yields at lower temperatures than conventional ceramic reactions,14 and they can even exhibit product selectivity depending on which alkali (A = Li, Na, K) carbonate precursor is used. This is seen for the reactions of \ce3A2CO3 + 2YCl3 + Mn2O3, where in the case of \ceLi2CO3 the reaction selectively forms orthorhombic \ceYMnO3, \ceNa2CO3 yields \ceY2Mn2O7, and \ceK2CO3 does not yield selectivity 15.
A central challenge of this contribution is to understand the origin of the different product outcomes that result from changing an ancillary precursor that is not directly involved in any elementary reaction producing a yttrium manganese oxide. In conventional stoichiometric reactions using binary yttrium oxide and manganese oxide precursors, hexagonal \ceYMnO3, denoted h-\ceYMnO3, forms at temperatures greater than 950 ℃ 16, 17. Previous reports have described the synthesis of \ceY2Mn2O7 under high temperatures and highly oxidizing conditions (1100 ℃ and 4 GPa with \ceKIO4 -¿ KIO3 + 1/2 O2)18 or hydrothermally under oxidizing conditions (NaOH, \ceNaClO3 in \ceH2O at 500 ℃ and 3 GPa)19, leading to its previous characterization as a metastable phase 20. Interestingly, thermogravimetric analysis shows the \ceY2Mn2O7 pyrochlore to be stable up to 800 ℃, above which it decomposes to the perovskite \ceYMnO3.19 Therefore, if \ceY2Mn2O7 is stable at the lower temperatures, its stability cannot solely explain why only the sodium-based assisted metathesis precursors are selective for its formation given the low reaction temperatures for all of the alkali metathesis reactions.
Here, using temperature-dependent synchrotron powder X-ray diffraction (SPXRD) experiments to study the \ceY2Mn2O7-forming assisted metathesis reaction with a sodium precursor, \ceMn2O3 + 2 YCl3 + 3 Na2CO3 + 1/2 O2 -¿ Y2Mn2O7 + 6 NaCl + 3 CO2, we identify a specific reaction pathway dependent on the formation of \ceY2O3 and its reaction with \ceNa_MnO2 intermediates. Density functional theory (DFT) derived thermochemistry reveals that \ceY2Mn2O7 is thermodynamically stable below 1100 ℃ and that sodium-based intermediates provide selective formation of this phase by circumventing the formation of other Y-Mn-O intermediates (e.g., \ceYMnO3 and \ceYMn2O5). This sodium based reaction differs from the equivalent reactions with \ceLi2CO3 and \ceK2CO3, which we previously showed instead yield \ceYMnO3, with a reaction temperature as low as 500 ℃ 21, 22. We attribute the selective formation of \ceY2Mn2O7 to the distance of the Na-based intermediates in chemical potential space, which is shown visually on the chemical potential diagram and is numerically calculated between the stability regions of the reactants and products in a reaction. These methods, applied to easily retrievable materials data, now allow one to search for selective reactions over large, hyperdimensional compositional spaces.
2 Methods
2.1 Experimental methods
All reagents were prepared, stored, and weighed in an argon-filled glovebox with \ceO2 and \ceH2O levels 0.1ppm. Manganese(III) oxide (Sigma Aldrich 99%) was purified by heating \ceMn2O3 in an alumina boat at 1 ℃/min to 700 ℃ for 16 h in air and quenched into the glovebox; purity was verified by powder X-ray diffraction (PXRD). Manganese (IV) oxide (Sigma Aldrich 99%), \ceYCl3 (Alfa Aesar 99.9%), sodium carbonate (ACROS Organics 99.5%), and manganese (II) carbonate (Sigma Aldrich 99.99%) were purchased and stored under argon. All gases (\ceO2, \ceAr, He) were purchased through Airgas at the Ultra High Purity grade (99.999%). \ceNaMnO2 () was prepared by mixing manganese (III) oxide and sodium carbonate in a 1:1 molar ratio, grinding for 15 minutes in an agate mortar and pestle, and pelleting using a in die under 1 tn of force. The pellet was placed upon a sacrificial layer of powder in an alumina crucible and heated in a muffle furnace at 1 ℃/min to 700 ℃ for 10 h. The reaction was subsequently quenched into the antechamber of the glovebox and stored under argon. Similarly, \ceNa_0.7MnO2 () was prepared by mixing manganese (II) carbonate and sodium carbonate in a 0.70:1 Na:Mn ratio following the same pellet preparation as \ceNaMnO2. The reaction was performed by heating at 5 ℃/min to 1050 ℃ for 15 h and then quenching into the antechamber of a glovebox and stored under argon. \ceY2O3 was purified of hydroxide in an alumina boat at 1 ℃/min to 900 ℃ for 4 h in air, cooled to 200 ℃ at 1 ℃/min for 12 h, and quenching into the glovebox. \ceYOCl was prepared by heating \ceYCl3*6H2O in an alumina boat to 350 ℃ at 10 ℃/min for 4 h in air. The \ceYOCl product formed as the \cePbClF structure-type. All prepared reactants were confirmed using laboratory PXRD. Preparations for assisted metathesis reactions have been described in detail previously where reaction yields match the expected \ceY2Mn2O7:6NaCl by PXRD (14.2(3) mol% \ceY2Mn2O7).15 Laboratory PXRD data were collected on a Bruker D8 Discover diffractometer using Cu K radiation and a Lynxeye XE-T position-sensitive detector.
For temperature-dependent in situ assisted metathesis reactions that produce carbon dioxide as a by-product, open-ended quartz capillaries (1.1 mm OD) were packed in a glove-bag under argon using glass wool as a plug. Synchrotron X-ray diffraction experiments were performed at beamline 17-BM-B ( = 0.2415 Å) at the Advanced Photon Source (APS) at Argonne National Laboratory using a Perkin Elmer plate detector at a distance of 700 mm. All capillaries were loaded into a flow-cell apparatus equipped with resistive heating elements and heated at 10 ℃/min.23 Gas flow (\ceO2, He) was controlled through mass flow controllers at a rate of 0.2 cc/min. Assisted-metathesis reactions were heated to a maximum temperature of 850 ℃ while the sample continuously rocked at 5∘ around the axis of the capillary. Diffraction patterns were collected every two seconds and summed every 20 seconds for powder averaging. Plate detector images were integrated using GSAS-II and calibrated using a \ceLaB6 standard.
All Rietveld refinements were performed using TOPAS v6. Due to the number and positional overlap of intermediates during the sequential refinements, thermal displacement parameters were fixed at 5Å2 and the full-width-half-max using a Lorentzian polynomial was fixed at 178 nm to better account for changes in peak intensity during the reaction. In order to compare the relative fractions of phases determined from Rietveld calculations24, a weighted scale factor (WSF) is defined as: where = weighted scale factor of phase p, = Scale factor calculated from Rietveld for phase p, is the volume of the unit cell for phase p, and is the atomic mass of the unit cell for phase p. It should be noted that we omit the Brindley coefficient for microabsorption correction in our calculation of weighted scale factor due to the unreliable refinement of particle sizes for individual phases. Amorphous material and product lost as vapor are not accounted for in the sequential refinement. We reference all phases by their nominal stoichiometric formula; however, the actual chemical formula may be distinct from the written formula as XRD data alone cannot typically resolve non-stoichiometric compounds.
It has been recently demonstrated by some of us that diagrams are a powerful tool for understanding defects in chemical systems with three different crystallographic sites, allowing a diffraction analog of a ternary phase diagram to be calculated in which each axis represents the relative scattering power of each crystallographic site (at 2) rather than the chemical composition.25, 26 The diagram method is applied here with a slight modification to understand the evolution of defects within the \ceNa_xMnO2 intermediates. The P3 structure has three distinct crystallographic sites (one for each element), whereas the Birnessite P2 phase has four distinct crystallographic sites (2 Na, 1 Mn, 1 O) rather than three. Therefore, the scattering powers of the two Na sites were summed together in the construction of the diagram.
2.2 Computational methods
2.2.1 Calculating thermodynamic free energies
DFT-based atomic structures and formation enthalpies for material phases in the Y-Mn-O-Na-Li-K chemical systems were acquired from the Materials Project (MP) database, version 20210̇51̇3 27 Gibbs free energies of formation, , of solid DFT compounds were estimated using the machine-learned Gibbs free energy descriptor approach implemented by Bartel, et al. 28 and applied to MP data. The pymatgen package was used to perform convex hull phase stability analysis. 29
To model the energetics of reactions occurring in flowing \ceO2 gas, the grand potential energy, , was used as the relevant thermodynamic potential:
| (1) |
where is normalized to the number of non-oxygen atoms. Since in place of we used standard Gibbs free energies of formation, (T=650℃), the chemical potential of oxygen was assigned a value of zero, i.e., ( MPa, ℃). While this did not result in a shift in the total grand potential energy of any particular phase, it did change the number of atoms used for normalization and hence affected the magnitude of the normalized reaction energies, .
2.2.2 Construction of chemical potential diagrams
Chemical potential diagrams, as well as their more traditional two-dimensional versions (predominance diagrams), were constructed using the methodology described by Yokokawa. 30 We used an algorithmic approach inspired by a similar method for construction of Pourbaix diagrams,31 which is briefly summarized here.
For a pure substance with atoms per chemical formula unit, consisting of unique elements indexed with concentrations of , its hyperplane in -dimensional chemical space is defined via the equation:
| (2) |
where the standard Gibbs free energy of formation, , has been normalized to an energy-per-atom basis by dividing by the total number of atoms per formula unit, . Note that all reference chemical potentials are set to zero when working with elements in their standard states.
Following the construction of hyperplanes for all phases in the chemical system, the stability domains are acquired by taking the convex hull of all points belonging to that phase in the set of intersections of the lowest energy hyperplanes, as calculated with the HalfspaceIntersection code implemented in SciPy. 32 In this construction, each stability region is a convex dimensional polytope in -dimensional chemical potential space. Since many possible chemical reactions involve more than elements, we must take additional steps to visualize the hyperdimensional () phase boundaries relevant to the reactions in this work. This can be accomplished by 1) using clever transformations of the axes, 2) setting one or more chemical potentials to fixed values, or 3) taking a slice of the relevant chemical potential polytopes in lower dimensions. Here we choose the third option, which uniquely allows for comparison across the full Y-Mn-O-Na-Li-K-Cl assisted metathesis system. Phases that do not directly appear on the generalized chemical potential diagram in three dimensions, e.g., \ceAMnO2 in the Y-Mn-O subspace, are thus computed first in higher dimension chemical potential space (A-Y-Mn-O) and then sliced to plot in lower-dimensional subspace. In the case of \ceAMnO2, these regions appear as three-dimensional polyhedra due to the added degree of freedom in the chemical potential of the alkali element, . These polyhedra also at least partially contact the stability areas of Y-Mn-O compounds, indicating where phases are adjacent in higher-dimensional space.
The “chemical potential distance”, , between any two phases and was calculated geometrically by finding the minimum Euclidean distance between the domains (i.e., the convex stability polytopes) of each phase on the chemical potential diagram. This was accomplished practically by computing the minimum Euclidean distance between all pairs of vertices (, ) defining each of the two convex polytopes of phases and :
| (3) |
While the minimum distance between vertices is not necessarily equivalent to the minimum distance between any facet of the polytopes, the implementation of the more accurate distance calculation is nontrivial. We thus found the vertex based k-d tree method, as implemented in SciPy, to be an appropriate trade-off between computational complexity and accuracy.
2.2.3 Enumerating reactions with \ceY2Mn2O7 as a product
Chemical reactions with \ceY2Mn2O7 as a product were enumerated via a network-based approach described in a previous work 33 and implemented in the reaction-network Python package. 34 To summarize, the enumeration approach is a combinatorial brute force approach whereby every combination of phases up to a size of is considered both as a possible set of reactants or products. The set of all possible reactions is calculated by taking the Cartesian product between the set of reactant phase combinations and product phase combinations and filtering by whether it is possible to write a stoichiometrically balanced reaction equation between the reactants and products. In this work, reactions up to a size are enumerated from the set of 2,878 phases predicted to be stable at ℃ within the alkali metal (Li, Na, K, Rb, Cs), halogen (F, Cl, Br, I), carbon (C), and target (Y, Mn, O) chemical system. To account for the system being open to oxygen gas, we also consider reaction equations with oxygen as an optional reactant or product beyond the limitation.
The enumerated reactions were compared against each other by using both the normalized reaction free energy and a “total” chemical potential distance for the reaction as “cost” variables. For the purposes of ranking reactions, the total cost of a reaction, , was calculated using the softplus function with an equally weighted mean between the two cost variables:
| (4) |
where corresponds to a temperature of K, the reaction energy, , corresponds to the normalized change in grand potential energy, and represents the total chemical potential distance for a reaction, which is calculated as the sum of the (minimum) chemical potential distances between all possible pairwise interfaces in the reaction, excluding the interface(s) between the reactants. For example, in the hypothetical reaction A+B C+D, the total chemical potential distance is calculated by taking the summation of (A, C), (A, D), (B, C), (B, D), and (C, D).
The full set of enumerated chemical reactions, as well as all experimental raw data, processed data, data processing scripts, and figure plotting scripts, are available at \urlhttps://github.com/GENESIS-EFRC/y2mn2o7-selectivity. The entire reaction enumeration and ranking approach has also been implemented within the aforementioned reaction-network Python package 34 and can be applied in a similar fashion to recommend precursors for synthesizing other target materials. The applicability of this approach beyond the Y-Mn-O system is the subject of future work(s).
3 Results and Discussion
3.1 Reaction pathway from phase evolution

In situ synchrotron powder X-ray diffraction (SPXRD) studies were used to identify the intermediate phases and reaction pathways that permit the selective formation of \ceY2Mn2O7 through assisted metathesis reactions with \ceNa2CO3. Figure 1 shows the integrated SPXRD diffraction patterns collected during a reaction using precursor phases of \ceMn2O3 + 2YCl3 + 3Na2CO3. Data were collected during heating to 650 ℃ at 10 ℃/min then dwelling at 650 ℃ for 60 min, performed under flowing oxygen. Quantitative phase analysis using the Rietveld method reveals the identities and phase fractions of intermediates of P3-\ceNa_MnO2, P2′-\ceNa_MnO2, YOCl, \ceY3O4Cl, \ceY2O3; products of \ceNaCl and \ceY2Mn2O7; and a small amount of \ceNa3MnO4 impurity, as summarized in Figure 1. No other yttrium manganese oxide phases were observed.
The relevant intermediates that exist at the onset of formation of \ceY2Mn2O7 are \ceY2O3, P3-\ceNa_MnO2, and a small amount of \ceMn2O3. \ceY2O3 forms with a very small particle size (less than 35 nm, Figure LABEL:S-fig:particlesizeY2O3), and its production yields a large fraction of the expected NaCl product (Figure 1). P3-\ceNa_MnO2 forms directly from the reaction of \ceNa2CO3 and \ceMn2O3, in agreement with a previous in situ and computational study.9 Once both of these key intermediates are present, P3-\ceNa_MnO2 then reacts with \ceY2O3 to form pyrochlore \ceY2Mn2O7, also triggering the formation of P2′-\ceNa_MnO2 ( structure, with a slight shear of the ideal P2- structure)35, 36, 37. Thereafter, selective formation of \ceY2Mn2O7 is sustained through the reaction of P2′-\ceNa_xMnO2 with \ceY2O3. After P3-\ceNa_MnO2 is fully consumed, the rate of \ceY2Mn2O7 production slows dramatically, as \ceNa3MnO4 gradually forms (Fig 1). \ceNa3MnO4 does not appear in reaction products of ex situ studies of these assisted metathesis reactions performed on bulk scales, although it may be present as a trace quantity.15
3.2 Thermodynamic stability of \ceY2Mn2O7
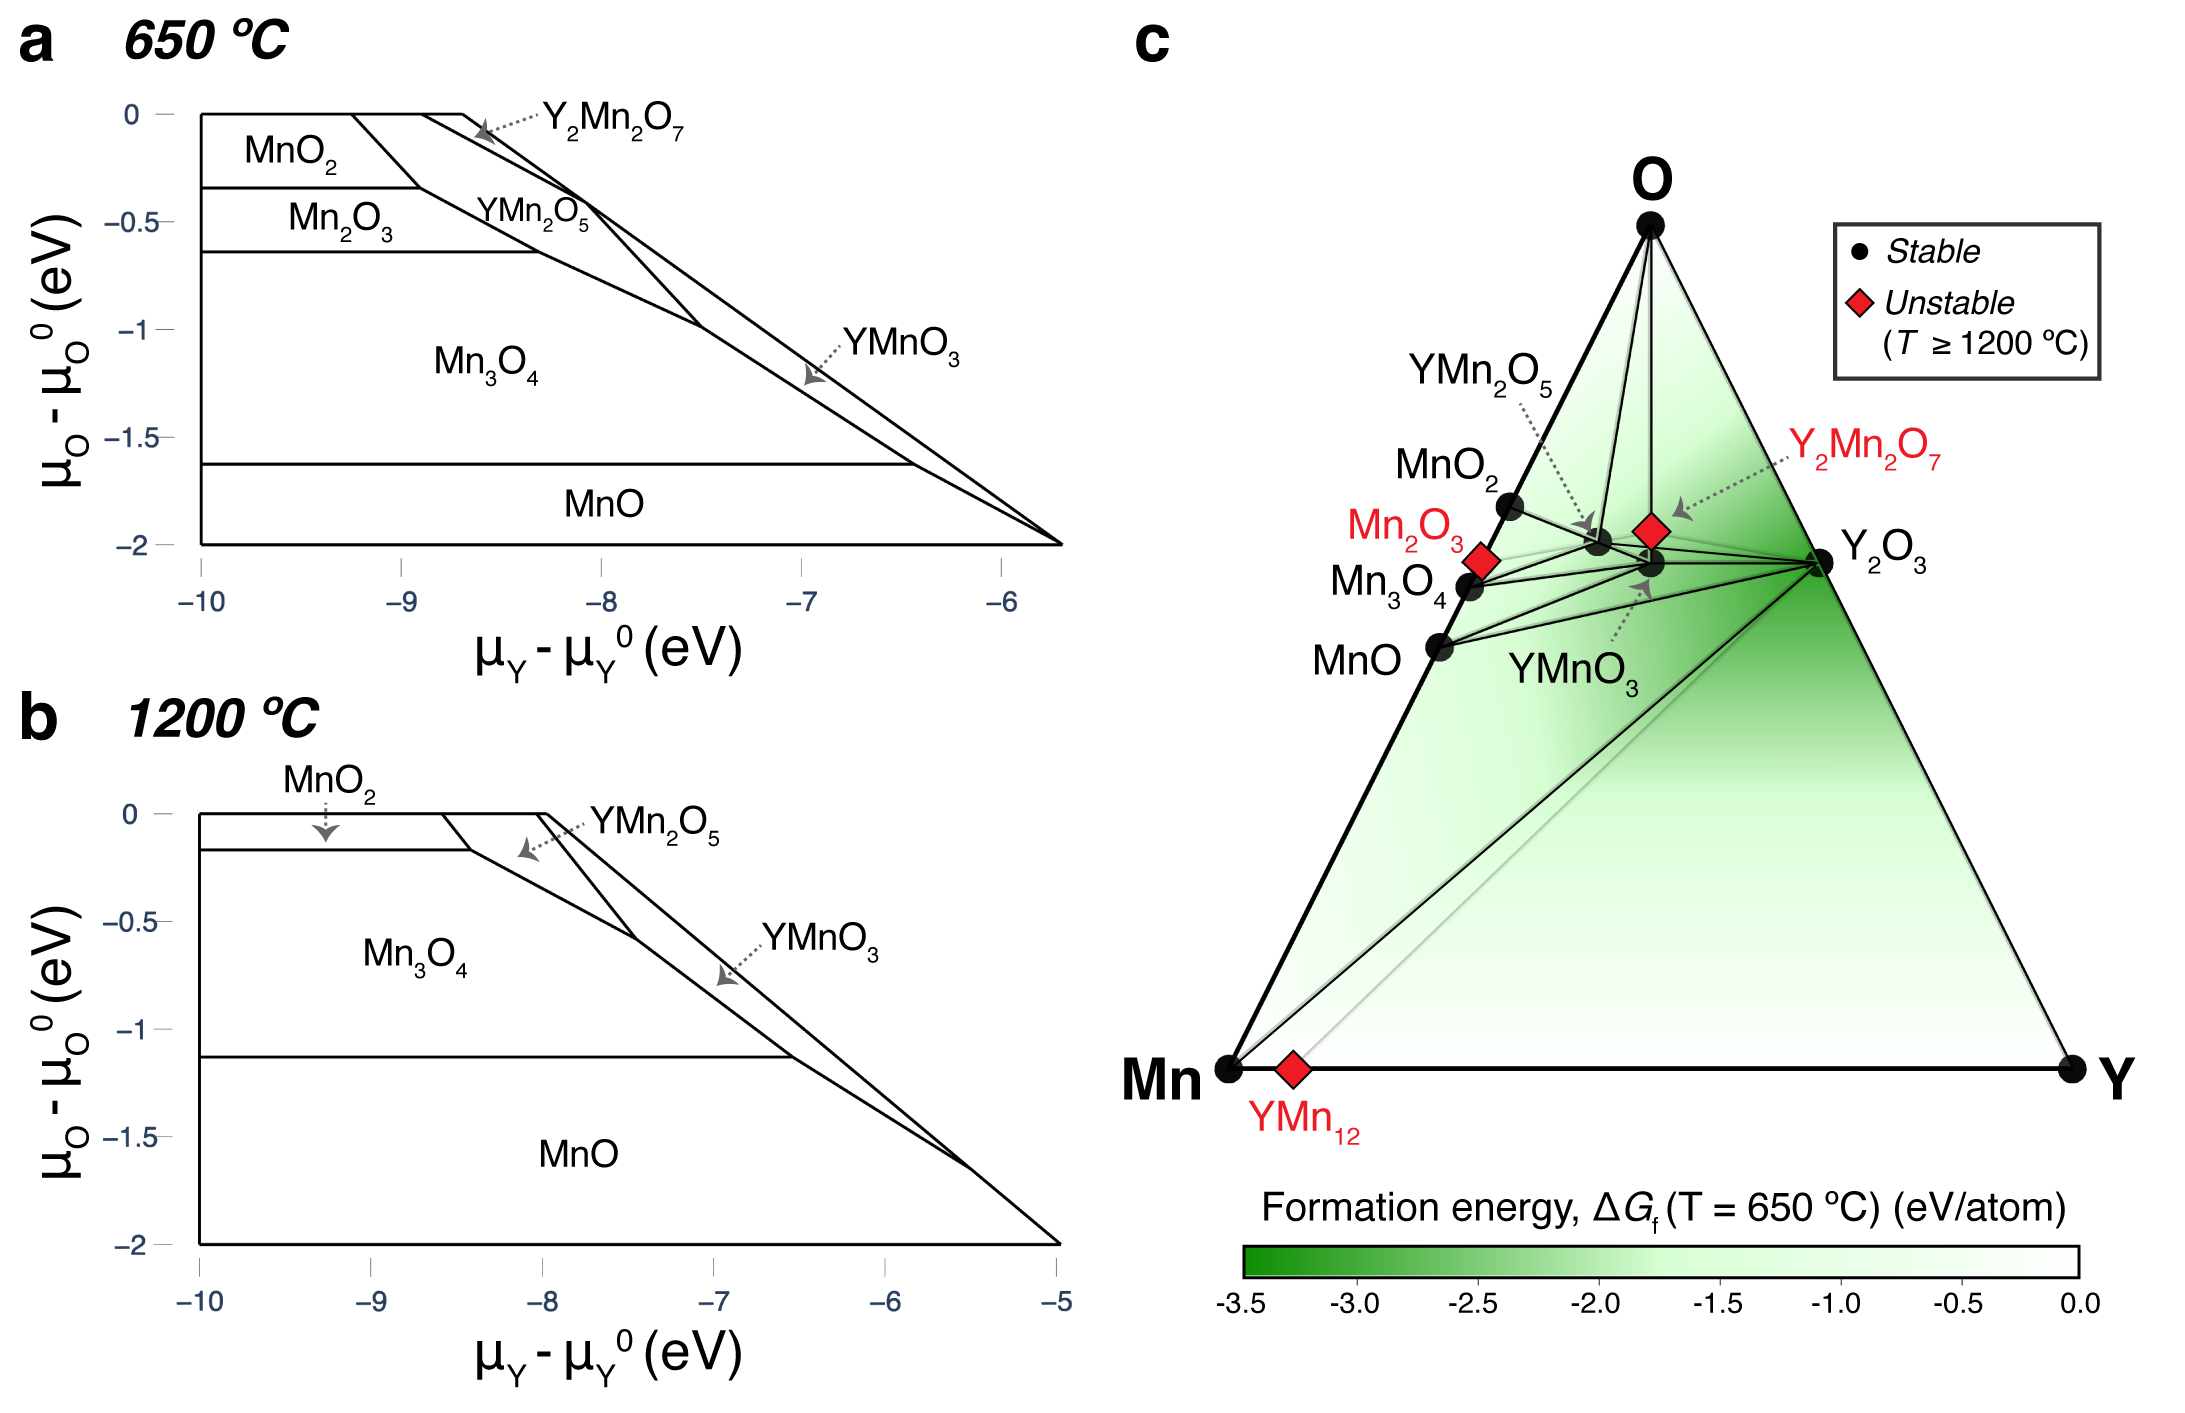
Evaluation of the Y-Mn-O phase diagram reveals that \ceY2Mn2O7 is thermodynamically stable (i.e., it is on the convex hull) at low temperatures (T 1100 ℃). Using error-corrected formation energies derived from DFT calculations 38 and a previous Gibbs free energy model for solids 28, the phase diagram of the Y-Mn-O system has been calculated at finite temperatures relevant to the synthesis reactions being investigated, with results of calculations at 650 ℃ and 1200 ℃ shown in Figure 2. Figure 2a depicts that the predominance area of \ceY2Mn2O7 is quite small, indicating its low relative stability with respect to thermodynamic decomposition to neighboring phases. For a 1:1 Y:Mn composition ratio in an environment open to oxygen, h-\ceYMnO3 is thermodynamically stable at all temperatures and under a wide range of oxygen chemical potentials, while \ceY2Mn2O7 is thermodynamically stable only below 1100 ℃ and at higher oxygen chemical potentials (i.e., oxygen rich conditions). While the predicted temperature below which \ceY2Mn2O7 is stable is overestimated by these calculations since only h-\ceYMnO3 was observed to form at 950 ℃ in experiments 17, the low-temperature thermodynamic stability of \ceY2Mn2O7 is assessed experimentally here by heating \ceY2Mn2O7 in flowing oxygen at 650 ℃ for two weeks (Figure LABEL:S-fig:Y2Mn2O7), a result that is in agreement with previous thermogravimetric analysis 19. The fact that the \ceLi2CO3 and \ceK2CO3 precursors do not produce the thermodynamically favored phase of \ceY2Mn2O7 at temperatures below 950 ℃ and (\ceO2) = 1 atm (i.e., 0) indicates that the metathesis reaction temperatures are sufficiently low to yield kinetic control in the formation of o-\ceYMnO3 or h-\ceYMnO3 39. Finally, it indicates the need for a deeper understanding of the specific factors that determine which reaction pathway is followed for a given alkali carbonate precursor.
3.3 Product selectivity via chemical potential distances
We hypothesize that the generalized chemical potential diagram, which was previously devised as a three-dimensional extension of predominance diagrams with application to modeling interface stability and reactivity 30, clarifies the large differences in product selectivity that arise by changing the identity of the alkali precursor. As the mathematical dual to the convex hull of the extensive energy-composition space, the generalized chemical potential diagram explicitly defines phase stability regions as bounded convex dimensional polytopes within the full -dimensional, intensive chemical potential space. Although in principle the chemical potential diagram conveys identical information as the traditional compositional phase diagram, it has the unique advantage of directly revealing the relative stability of phases. In fact, the volume of each phase’s stability polytope increases with its energy “below” the convex hull, i.e., the energy that would be released forming this phase via decomposition from the neighboring phases within a facet of the hull. The chemical potential diagram also directly links thermodynamic phase construction with atomic diffusion, and its construction even permits the visualization of diffusion paths in solid-state reactions 30. Hence the chemical potential diagram is well-suited for application to understanding and predicting the local behavior of reactions at solid interfaces.
Selective reactions in solid state chemistry need to minimize the probability of forming an undesired product phase at any point in time during the reaction pathway. As has been previously proposed,40 a reaction at the interface between two solid phases can proceed through either interface control or diffusion control, the latter resulting in local thermodynamic equilibrium and the corresponding requirement that elemental chemical potentials be continuous across the interfaces between reactants and product phase(s). All solid-state reactions eventually tend towards diffusion control as the product layer thickness grows. For this reason, predicted reactions which pose synthetic challenges are those in which it is impossible to achieve local equilibrium without decomposition to other phases before formation of the equilibrium product. On the chemical potential diagram, such reactions involve reactant-product pairs which do not share a phase boundary. Considering the reaction \ceY2O3 + Mn2O3 -¿ 2 YMnO3, if local equilibrium is achieved during the reaction, then according to Figure 3a, one expects \ceYMn2O5 and/or \ceMn3O4 to form before formation of the final \ceYMnO3 product, consistent with the results of control reactions presented in Figure LABEL:S-fig:MnOControls and the previously-reported phase diagram 17.
Therefore, selective reactions are those which can be balanced, produce the desired product, and minimize the distance in chemical potential space between pairwise reactant-product interfaces. On the chemical potential diagram, this manifests as determining whether each reactant-product pair shares a boundary (i.e., zero distance) or is separated by the polytope(s) of one or more additional phases (i.e., non-zero distance). This also applies to product-product pairs, which may further react if they do not share a boundary on the chemical potential diagram. Plotting trial reactants in the three-dimensional chemical potential subspace of the product (Figure 3a), or plotting products in the reactant subspace (Figure 3b-d), permits direct visualization of the pairwise interfaces that control reactivity 8, 9. This “chemical potential distance”, is geometrically calculated for all reactant-product and product-product interfaces in a reaction by determining the minimum Euclidean distance between polytopes (see Methods). The primary advantage of calculating a distance value rather than a Boolean variable for whether or not two phases share a boundary is that the distance is more robust against inaccuracies in thermochemical data and conveys the degree to which the competing phases may interfere with the selectivity of the reaction.
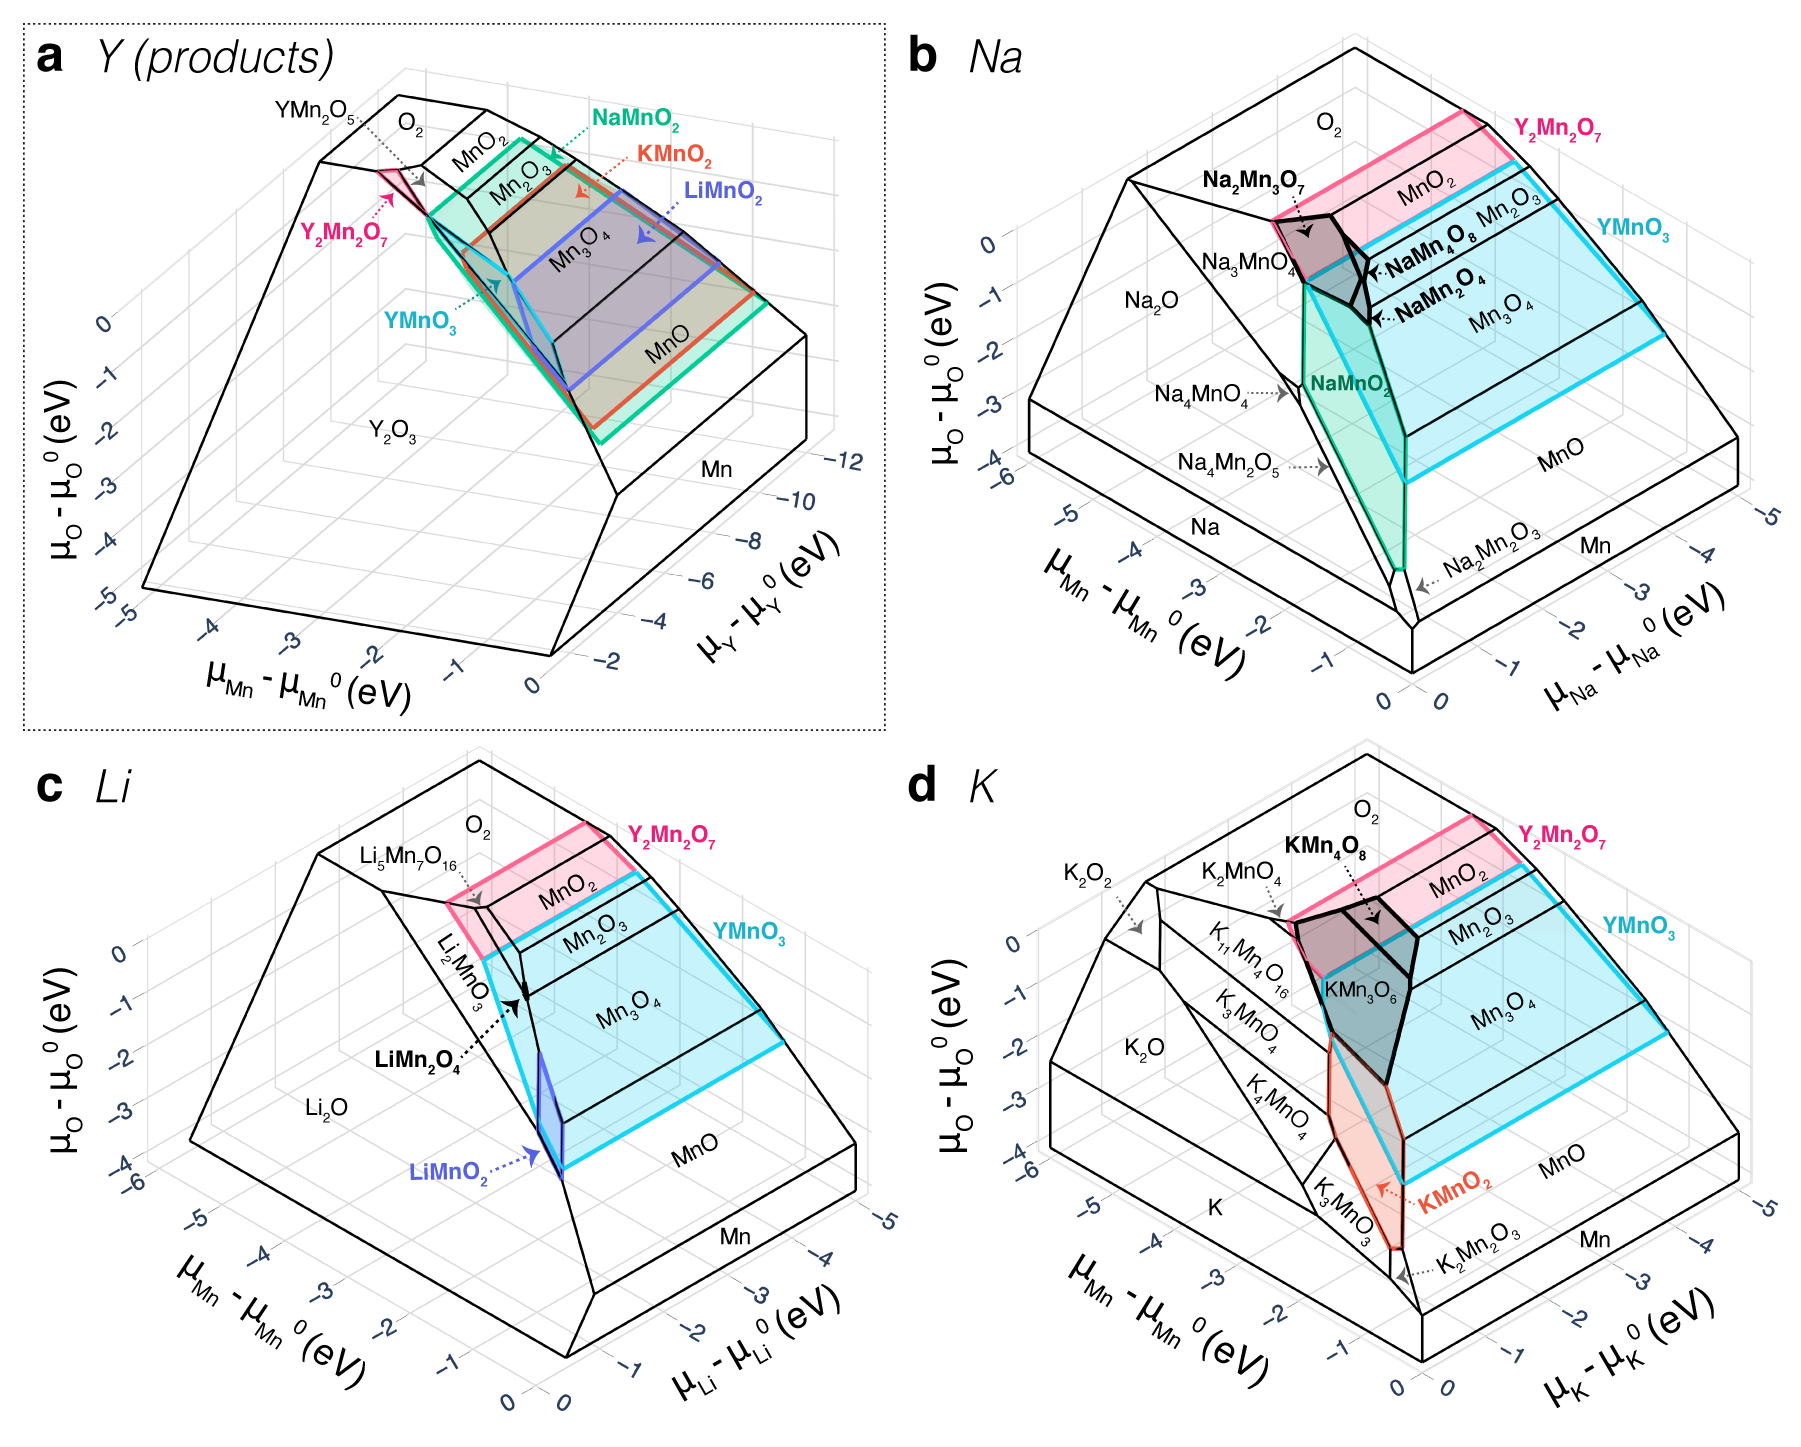
Visualizing three-dimensional slices of the full Y-Mn-O-Na-Li-K chemical potential space reveals why only the sodium-based intermediates lead to formation of \ceY2Mn2O7. Figure 3a illustrates slices of the stoichiometric \ceAMnO2 intermediates in the Y-Mn-O product chemical potential space. The \ceNaMnO2 stability polyhedron extends well beyond the range of both the \ceLiMnO2 and \ceKMnO2 phases. In fact, this Na-containing phase extends into high enough values to reach the stability area for \ceY2Mn2O7. This enhanced stability of the \ceNaMnO2 phase into higher oxygen (and lower manganese) chemical potentials suggests that it may be uniquely capable of forming a stable interface with \ceY2Mn2O7 and facilitating direct reaction to this pyrochlore phase. Specifically, the nearly shared boundary between the \ceNaMnO2 intermediate and \ceY2Mn2O7 means that the reaction kinetics should be facile since the local chemical potentials of Mn and O do not need to change as the intermediate converts to the product. Furthermore, even though the global oxygen chemical potential is controlled through partial pressure of \ceO2, the reaction of \ceNaMnO2 provides locally available oxygen at the chemical potential required to form \ceY2Mn2O7. In the case of the A = Li, K precursors, the lack of available oxygen with an appropriately high chemical potential necessitates the reaction to proceed through other intermediates before it is even possible to reach \ceY2Mn2O7.
The complementary inverse slices of the Y-Mn-O ternaries within the reactant A-Mn-O spaces (Figure 3b-d), along with the study of the atomic structures of the \ceAMnO2 phases, provide further explanation as to why the sodium-based intermediates facilitate reaction to \ceY2Mn2O7 even for Na-deficient phases, \ceNa_MnO2 (where x 1). In agreement with prior work 41, the sodium-based phases show a strong preference for the layered -NaFeO2-type structures relative to tunnel-like (e.g., Ramsdellite-derived) or spinel-derived structures. \ceNa2Mn3O7, \ceNaMn2O4, and \ceNaMn4O8, illustrated as gray shaded areas in Figure 3b, are all predicted to share the structurally analogous layered framework with stoichiometric \ceNaMnO2 (Figure LABEL:S-fig:structuresa). Together these structures create an interconnected pathway along the Na-Mn-O chemical potential surface towards higher oxygen chemical potentials where the surface touches the \ceY2Mn2O7 product (e.g., oxidation states ranging from +3 to +5 depending on the nature of the vacancies and whether the composition is Na-poor or Mn-poor). In contrast, \ceLiMnO2 has a narrower range of stability than its neighboring Li-Mn-O phases, which each prefer distinct non-layered structures (Figure LABEL:S-fig:structuresb). In both the \ceLi2CO3 assisted metathesis reactions 21 and the direct reaction between \ceLiMnO2 and \ceYOCl 22, we observed formation of \ceYMnO3 and \ceYMn2O5, suggesting that the decreased range of chemical potentials over which layered \ceLiMnO2 is stable and lack of structural homology between the \ceLi_MnO2 phases inhibits the accessibility of \ceY2Mn2O7 (e.g., due to rearrangement of the phases into spinel-derived structures). Finally, in the \ceK2CO3 assisted metathesis reactions, no product selectivity was observed as the reaction produced a mixture of \ceYMnO3, \ceYMn2O5, and \ceY2Mn2O7 products.21 While the \ceK_MnO2 phases indeed exhibit a similar extension into high oxygen chemical potentials akin to \ceNa_MnO2 (Figure 3d), the stoichiometric \ceKMnO2 ground-state structure does not follow the layered (nor even another another common) \ceMnO2 framework,41 (Figure LABEL:S-fig:structuresc) although the layered phase is predicted to be about 44 meV/atom higher in energy than the ground state. We thus conclude that similar to Li, the K-based system lacks the structural connectivity for interconversion between different \ceK_MnO2 intermediates, although direct formation of K-deficient phases may promote formation of \ceY2Mn2O7. In both the Li and K systems, the initial formation of \ceYMnO3 or \ceYMn2O5 hence imposes significant kinetic barriers to the formation of \ceY2Mn2O7. According to the chemical potential diagrams, \ceYMnO3 would have to decompose into \ceYMn2O5 and \ceY2O3 en route to forming \ceY2Mn2O7, which is consistent with myriad control experiments between binary yttrium and manganese oxides, with or without the presence of sodium (see Figures LABEL:S-fig:MnOControls and LABEL:S-fig:MnONaClControls). Based on these observations, we argue that the minimized chemical potential distance presented in Figures 3 and 4 and ability of sodium-based intermediate to interconvert across a wide range of stoichiometries and oxidation states explain why sodium provides selectivity of \ceY2Mn2O7 via a kinetically-viable pathway at lower temperatures.
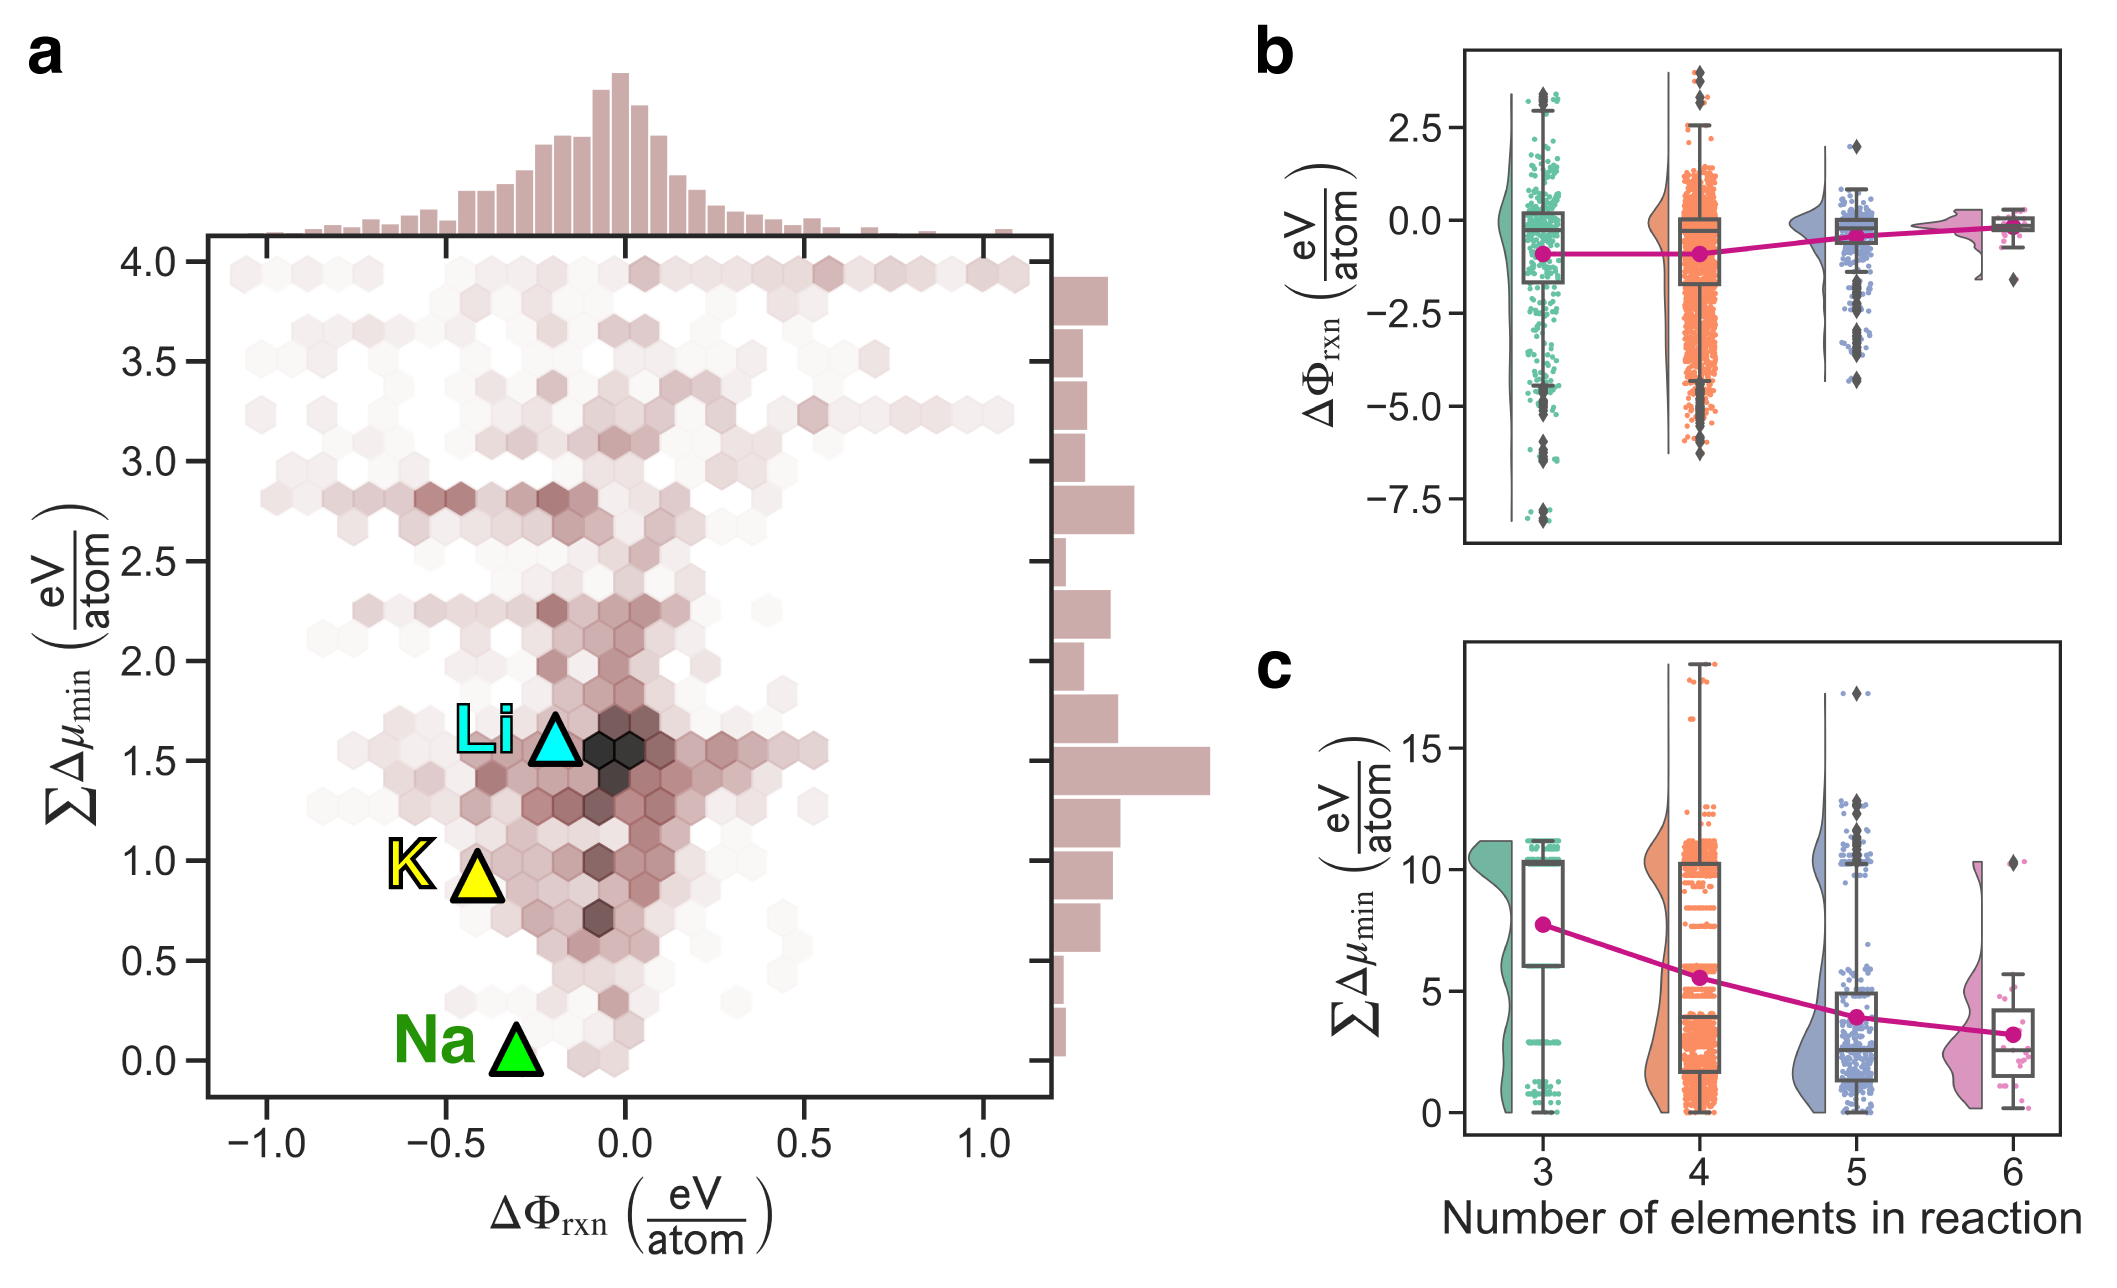
Analysis of 3,017 unique chemical reactions predicted to form \ceY2Mn2O7 within the full alkali metal (Li, Na, K, Rb, Cs), halogen (F, Cl, Br, I), carbon (C), and target (Y, Mn, O) chemical system show that the Na-based ternary metathesis reaction, \ce2 NaMnO2 + 2 YOCl + 1/2 O2 -¿ Y2Mn2O7 + 2 NaCl is the most optimal reaction for both minimizing the total chemical potential distance and maximizing the (negative) grand potential energy of reaction, , when these two parameters are weighted equally (see Methods). This result suggests that the Na-based pathway is not only a good pathway for producing \ceY2Mn2O7 but that it may also be the most suitable metathesis reaction for making this product. The full set of reactions and their weighted rankings can be found in provided data in the Supporting Information. The energy and total chemical potential distributions for these reactions illustrate that the Na-based reaction (green triangle in Figure 4a) optimizes both total chemical potential distance and overall reaction energy. The Na-based reaction has a near-zero total chemical potential distance (0.055 eV/atom) that is significantly smaller than those of the Li and K reactions (1.608 and 0.924 eV/atom respectively) and has a more negative reaction energy than any other reaction pathway with a near-zero total chemical potential distance. Figure 4 also reveals a major design principle behind using an expanded chemical space with metathesis reactions – the addition of other elements beyond those of the target phase (Y, Mn, O) can decrease the mean total chemical potential distance of the reaction without significantly changing the mean reaction energy. This hence provides many more opportunities for finding selective reactions beyond those that exclusively contain the target chemical species, i.e., 3,017 reactions in the full 13-element chemical system vs. 362 potential reactions in the Y-Mn-O chemical system.
Direct ternary metathesis reactions carried out between \ceNa_MnO2 and \ceYOCl do indeed form \ceY2Mn2O7 as predicted, but they also reveal important mechanistic details missing from the presented thermodynamic analysis that impacts product selectivity. For example, available density functional theory data is highly focused on stoichiometric compounds but tends to be lacking for solid solution and defect-containing phases. The reaction \ceNaMnO2 + YOCl -¿[O2] results in some \ceY2Mn2O7 formation, but also the formation of \ceYMnO3 and \ceYMn2O5 (Figure LABEL:S-fig:mNaMnO2YOCl), suggesting that the evolution of the \ceNa_MnO2 precursor during the reaction is important to consider, as illustrated in Figure 3b. A partially-oxidized precursor in the reaction, P2′-\ceNa_0.7MnO2 + YOCl selectively yields \ceY2Mn2O7, but the reaction is incomplete after 24 h (Figure LABEL:S-fig:oNaMnO2YOCl). Together, these control reactions suggest that the reaction rates also depend on the specific nature of defects present in the reactants and intermediates.
3.4 Mechanistic facilitation through defect reactions
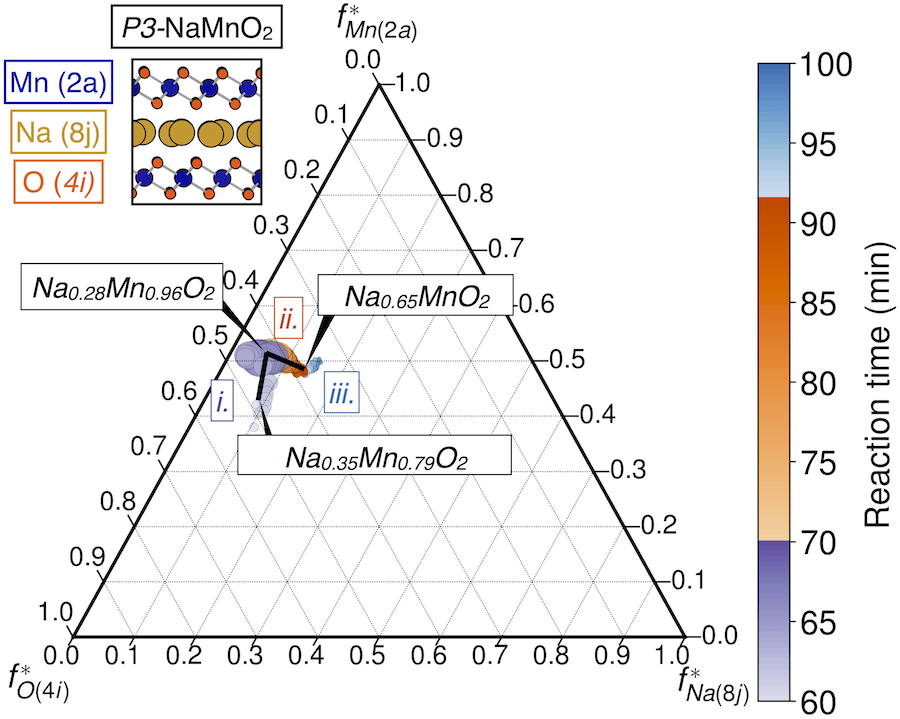
As the reaction pathway of the Li-based assisted metathesis reaction was previously reported 21, we focus on how \ceNa_MnO2-based intermediates react in a manner consistent with the predicted thermodynamic connectivity. Crystallographic analysis of the \ceNa_MnO2 phases by free refinement of the crystallographic site occupancies of all elements in each \ceNa_MnO2 structure and their subsequent analysis on an diagram25 together reveal how the stoichiometry of \ceNa_MnO2 changes through three different defect reactions along the reaction pathway for P3-\ceNa_MnO2 (Figure 5) and for P2′-\ceNa_MnO2 (Figure LABEL:S-fig:fstarP2). While the exact compositions defined by the site occupancies are correlated with other refinement variables (e.g., atomic displacement parameters, as addressed in the Supporting Information), the compositional trajectories observed in Figure 5 are robust25. Two distinct compositional trajectories of the P3-\ceNa_MnO2 phase on Figure 5 follow two major processes during the reaction pathway: (i) P3-\ceNa_MnO2 formation and (ii) reaction of P3-\ceNa_MnO2 to yield \ceY2Mn2O7 and P2′-\ceNa_MnO2. Additionally, delineation of trajectory (iii) describes when P2′-\ceNa_MnO2 begins reacting to yield \ceY2Mn2O7.
The reaction of the P3-\ceNa_MnO2 follows a compositional trend in chemical potential space towards the \ceY2Mn2O7 product (Figure 3). The initial formation of P3-\ceNa_MnO2 results in a very sodium-deficient composition, P3-\ceNa_0.29Mn_0.96O2. This manifests crystallographically as an excess of scattering intensity on the sodium site relative to the manganese site, suggestive of anti-site disorder, as well as decreased scattering relative to oxygen, suggestive of metal deficiency (Figure 5, as described in detail in the Supporting Information), which is also observed in the initial formation of \ceLiNiO2 42. Additionally, there is decreased scattering intensity of the metal sites relative to oxygen, which suggests the existence of overall cation deficiencies in the structure, calculated as \ceNa_0.35Mn_0.79O_2 from Rietveld analysis of the PXRD data. The composition evolves in time through a cation-ordering reaction, where manganese occupying the () sodium site moves to the manganese () site (trajectory (i) in Figure 5). Movement along trajectory (i) yields site ordering as the phase fraction is increased; the proposed stoichiometry is analytically calculated as the black line overlaid on these data in Figure 5 (see Eqn. LABEL:S-eq:cationswap). This ordering reaction yields a calculated composition of P3-\ceNa_0.29Mn_0.96O2 at its maximal phase fraction observed in Figure 1. At that point in the overall reaction, this intermediate with a relatively high oxygen chemical potential (Figure 3b) reacts to form \ceY2Mn2O7.
There is a change in the defect chemistry of P3-\ceNa_MnO2 consistent with the loss of Mn4+ + 2 O2-, concomitant with consumption of \ceY2O3 and production of \ceY2Mn2O7 and P2′-\ceNa_MnO2. Along trajectory (ii) in Figure 5, there is a decrease in relative electron density from the oxygen site (), as well as an increase in the sodium to manganese site ratio, as described by Eqn. LABEL:S-eq:simulreactions. This reflects a change in defect chemistry along trajectory (ii) from the P3-\ceNa_0.29Mn_0.96O2 calculated composition at the end of trajectory (i) to that of P3-\ceNa_0.65MnO2. During this process, the pyrochlore phase fraction grows rapidly and P2′-\ceNa_MnO2 forms (Figure 1, at 70–90 min) before tapering off at the end of the second trajectory in Figure 5 as the amount of P3-\ceNa_MnO2 depletes.
Analysis of the in situ diffraction data reveals that selective formation of \ceY2Mn2O7 occurs through two parallel reactions that start during trajectory (ii) in Figure 5:
consistent with the predicted thermodynamic connectivity in Figure 3. In contrast, Li-based assisted metathesis reactions performed at temperatures between 500 ℃ and 850 ℃ proceed via \ceLiMnO2-based intermediates that result in the direct formation of \ceYMnO3 phase 21, 22, which is also predicted from the thermodynamic connectivity (Figure 3a,c).
Based on the stoichiometry of the residual Na-Mn-O phases in each step, there is a loss of Mn4+ + 2 O2- along with the consumption of \ceY2O3. Thermodynamically, we expect that stoichiometric \ceNaMnO2 reacts with \ceY2O3 at a relatively high and low (see Figure 3b), as suggested by the average stoichiometry of the transferred species in the parallel cascade of defect reactions (Eqns. LABEL:eq:elementary1 and LABEL:eq:elementary2). Curiously, the \ceY2Mn2O7-forming reaction does not proceed via a typically labile topochemical deintercalation of the alkali cation 43 or oxygen anion 44, 3, 4, but instead the chemical potential boundaries shown in Figure 3 guide the reaction to direct formation of the \ceY2Mn2O7 product from the Na-Mn-O intermediates by avoiding the formation of other Y-Mn-O phases.
4 Conclusions
In assisted metathesis reactions, the presence of an appropriate alkali ion controls the selectivity of the reaction via differences in the thermodynamic stabilities of the reaction intermediates, as defined by the chemical potentials of the constituents in a hyperdimensional compositional space. In the reaction of \ce3Na2CO3 + 2YCl3 + Mn2O3, the \ceY2Mn2O7 pyrochlore forms selectively via the direct reaction of \ceNa_MnO2 and \ceY2O3 intermediates, as revealed by in situ temperature- and time-dependent SPXRD experiments. However, this pyrochlore selectivity is not achieved with the analogous \ceLi2CO3 or \ceK2CO3 precursors. Mapping the reaction species in chemical potential space illustrates that \ceNaMnO2, and structurally-related compositional variants permit a small difference in local chemical potentials between the NaxMnyO2 intermediates and \ceY2Mn2O7, as the chemical stability windows of structurally homologous NaxMnyO2 phases connect directly with that of \ceY2Mn2O7. The short distance in chemical potential space illustrates why the reaction to form \ceY2Mn2O7 is selective. In contrast, the other alkali-based (Li, K) intermediate phases lack the same degree of structural homology and share different boundaries, thus resulting in the formation of different products. The mechanistic details obtained from crystallographic analysis highlight that the thermodynamic boundaries dictate the reactivity rather than the mobility of an alkali cation within the oxide framework. This analysis illustrates how local thermodynamic equilibrium principles provide a direct connection to reaction kinetics in guiding the mechanistic pathway of solid-state reactions, thus providing a notion of a protecting group in materials synthesis. The thermodynamic underpinnings permit high-throughput prediction of precursors in higher dimensional chemical spaces that can impart selectivity, kinetic viability, and reversibility.
5 Supporting Information
-
•
Figures S1-LABEL:S-fig:pareto: Assisted metathesis reaction energetics, detailed description of the Na-based reaction progression, testing of alternative \ceNaMnO2 polytypes, ex situ control experiments, comparison of neighboring ternary oxide structures in chemical potential space, and Pareto frontier of predicted reactions forming \ceY2Mn2O7
-
•
Full set of enumerated chemical reactions, experimental raw data, processed data, data processing scripts, and figure plotting scripts
6 Acknowledgements
This work was supported as part of GENESIS: A Next Generation Synthesis Center, an Energy Frontier Research Center funded by the U.S. Department of Energy, Office of Science, Basic Energy Sciences under Award Number DE-SC0019212. We would also like to acknowledge the facilities at 17-BM-B at the Advanced Photon Source at Argonne National Laboratory and, in particular, the support of A. Yakovenko, W. Wu. JRN acknowledges partial support from a Sloan Research Fellowship.
Theoretical calculations completed in this research used resources of the National Energy Research Scientific Computing Center (NERSC), a U.S. Department of Energy Office of Science User Facility operated under Contract No. DE-AC02-05CH11231.
References
- Stein et al. 1993 Stein, A.; Keller, S. W.; Mallouk, T. E. Turning Down the Heat : Design and Mechanism in Solid-State Synthesis. Science 1993, 259, 1558–1564
- Murphy et al. 1977 Murphy, D. W.; Cros, C.; Di Salvo, F. J.; Waszczak, J. V. Preparation and properties of LixVS2 (0 x 1). Inorg. Chem. 1977, 16, 3027–3031
- Tsujimoto et al. 2007 Tsujimoto, Y.; Tassel, C.; Hayashi, N.; Watanabe, T.; Kageyama, H.; Yoshimura, K.; Takano, M.; Ceretti, M.; Ritter, C.; Paulus, W. Infinite-layer iron oxide with a square-planar coordination. Nature 2007, 450, 1062–1065
- Yajima et al. 2015 Yajima, T.; Takeiri, F.; Aidzu, K.; Akamatsu, H.; Fujita, K.; Yoshimune, W.; Ohkura, M.; Lei, S.; Gopalan, V.; Tanaka, K.; Brown, C. M.; Green, M. A.; Yamamoto, T.; Kobayashi, Y.; Kageyama, H. A labile hydride strategy for the synthesis of heavily nitridized BaTiO3. Nature Chemistry 2015, 7, 1017–1023
- Armand and Tarascon 2008 Armand, M.; Tarascon, J. M. Building better batteries. Nature 2008, 451, 652–657
- Havelia et al. 2013 Havelia, S.; Wang, S.; Balasubramaniam, K. R.; Schultz, A. M.; Rohrer, G. S.; Salvador, P. A. Combinatorial substrate epitaxy: a new approach to growth of complex metastable compounds. CrystEngComm 2013, 15, 5434–5441
- Ding et al. 2016 Ding, H.; Dwaraknath, S. S.; Garten, L.; Ndione, P.; Ginley, D.; Persson, K. A. Computational Approach for Epitaxial Polymorph Stabilization through Substrate Selection. ACS Applied Materials & Interfaces 2016, 8, 13086–13093
- Miura et al. 2021 Miura, A.; Bartel, C. J.; Goto, Y.; Mizuguchi, Y.; Moriyoshi, C.; Kuroiwa, Y.; Wang, Y.; Yaguchi, T.; Shirai, M.; Nagao, M.; Rosero-Navarro, N. C.; Tadanaga, K.; Ceder, G.; Sun, W. Observing and Modeling the Sequential Pairwise Reactions that Drive Solid-State Ceramic Synthesis. Advanced Materials 2021, 33, 2100312
- Bianchini et al. 2020 Bianchini, M.; Wang, J.; Clément, R. J.; Ouyang, B.; Xiao, P.; Kitchaev, D.; Shi, T.; Zhang, Y.; Wang, Y.; Kim, H.; Zhang, M.; Bai, J.; Wang, F.; Sun, W.; Ceder, G. The interplay between thermodynamics and kinetics in the solid-state synthesis of layered oxides. Nat. Mater. 2020, 19, 1088–1095
- Bonneau et al. 1991 Bonneau, P. R.; Jarvis, R. F.; Kaner, R. B. Rapid solid-state synthesis of materials from molybdenum disulphide to refractories. Nature 1991, 349, 510–512
- Wiley and Kaner 1992 Wiley, J. B.; Kaner, R. B. Rapid solid-state precursor synthesis of materials. Science 1992, 255, 1093–1097
- Miura et al. 2020 Miura, A.; Ito, H.; Bartel, C. J.; Sun, W.; Rosero-Navarro, N. C.; Tadanaga, K.; Nakata, H.; Maeda, K.; Ceder, G. Selective metathesis synthesis of MgCr2S4 by control of thermodynamic driving forces. Mater. Horiz. 2020, 7, 1310–1316
- Wustrow et al. 2018 Wustrow, A.; Key, B.; Phillips, P. J.; Sa, N.; Lipton, A. S.; Klie, R. F.; Vaughey, J. T.; Poeppelmeier, K. R. Synthesis and Characterization of MgCr2S4 Thiospinel as a Potential Magnesium Cathode. Inorg. Chem. 2018, 57, 8634–8638
- Seshadri et al. 2012 Seshadri, R.; Brock, S. L.; Ramirez, A.; Subramanian, M.; Thompson, M. E. Advances in the development and growth of functional materials: Toward the paradigm of materials by design. MRS Bull. 2012, 37, 682–690
- Todd and Neilson 2019 Todd, P. K.; Neilson, J. R. Selective Formation of Yttrium Manganese Oxides through Kinetically Competent Assisted Metathesis Reactions. J. Am. Chem. Soc. 2019, 141, 1191–1195
- Kamata et al. 1979 Kamata, K.; Nakajima, T.; Nakamura, T. Thermogravimetric study of rare earth manganites AMnO3 (A=Sm,Dy,Y,Er,Yb) at 1200°C. Mater. Res. Bull. 1979, 14, 1007–1012
- Balakirev and Golikov 2003 Balakirev, V. F.; Golikov, Y. V. Heterogeneous Phase Equilibria in Rare Earth–Mn–O Systems in Air. Inorganic Materials 2003, 39, S1–S10
- Fujinaka et al. 1979 Fujinaka, H.; Kinomura, N.; Koizumi, M.; Miyamoto, Y.; Kume, S. Syntheses and physical properties of pyrochlore-type A2B2O7 (A = Tl,Y; B = Cr,Mn). Mater. Res. Bull. 1979, 14, 1133–1137
- Subramanian et al. 1988 Subramanian, M.; Torardi, C.; Johnson, D.; Pannetier, J.; Sleight, A. Ferromagnetic R2Mn2O7 pyrochlores (R = Dy, Lu, Y). J. Solid State Chem. 1988, 72, 24–30
- Gardner et al. 2010 Gardner, J. S.; Gingras, M. J. P.; Greedan, J. E. Magnetic pyrochlore oxides. Rev. Mod. Phys. 2010, 82, 53–107
- Todd et al. 2019 Todd, P. K.; Smith, A. M. M.; Neilson, J. R. Yttrium Manganese Oxide Phase Stability and Selectivity Using Lithium Carbonate Assisted Metathesis Reactions. Inorg. Chem. 2019, 58, 15166–15174
- Todd et al. 2020 Todd, P. K. et al. Defect-Accommodating Intermediates Yield Selective Low-Temperature Synthesis of YMnO3 Polymorphs. Inorg. Chem. 2020, 59, 13639–13650
- Chupas et al. 2008 Chupas, P. J.; Chapman, K. W.; Kurtz, C.; Hanson, J. C.; Lee, P. L.; Grey, C. P. A versatile sample-environment cell for non-ambient X-ray scattering experiments. J. Appl. Crystallogr. 2008, 41, 822–824
- Jiang et al. 2017 Jiang, Z.; Ramanathan, A.; Shoemaker, D. P. In situ identification of kinetic factors that expedite inorganic crystal formation and discovery. J. Mater. Chem. C 2017, 5, 5709–5717
- Yin et al. 2018 Yin, L.; Mattei, G. S.; Li, Z.; Zheng, J.; Zhao, W.; Omenya, F.; Fang, C.; Li, W.; Li, J.; Xie, Q.; Zhang, J.-G.; Whittingham, M. S.; Meng, Y. S.; Manthiram, A.; Khalifah, P. G. Extending the limits of powder diffraction analysis: Diffraction parameter space, occupancy defects, and atomic form factors. Review of Scientific Instruments 2018, 89, 093002
- Yin et al. 2020 Yin, L. et al. Thermodynamics of Antisite Defects in Layered NMC Cathodes: Systematic Insights from High-Precision Powder Diffraction Analyses. Chem. Mater. 2020, 32, 1002–1010
- Jain et al. 2013 Jain, A.; Ong, S. P.; Hautier, G.; Chen, W.; Richards, W. D.; Dacek, S.; Cholia, S.; Gunter, D.; Skinner, D.; Ceder, G.; Persson, K. A. Commentary: The Materials Project: A materials genome approach to accelerating materials innovation. APL Mater. 2013, 1, 011002
- Bartel et al. 2018 Bartel, C. J.; Millican, S. L.; Deml, A. M.; Rumptz, J. R.; Tumas, W.; Weimer, A. W.; Lany, S.; Stevanović, V.; Musgrave, C. B.; Holder, A. M. Physical descriptor for the Gibbs energy of inorganic crystalline solids and temperature-dependent materials chemistry. Nature Communications 2018, 9, 4168
- Ong et al. 2010 Ong, S. P.; Jain, A.; Hautier, G.; Kang, B.; Ceder, G. Thermal stabilities of delithiated olivine MPO4 (M=Fe, Mn) cathodes investigated using first principles calculations. Electrochem. Commun. 2010, 12, 427–430
- Yokokawa 1999 Yokokawa, H. Generalized chemical potential diagram and its applications to chemical reactions at interfaces between dissimilar materials. Journal of Phase Equilibria 1999, 20, 258
- Patel et al. 2019 Patel, A. M.; Nørskov, J. K.; Persson, K. A.; Montoya, J. H. Efficient Pourbaix diagrams of many-element compounds. Phys. Chem. Chem. Phys. 2019, 21, 25323–25327
- Virtanen et al. 2020 Virtanen, P. et al. SciPy 1.0: fundamental algorithms for scientific computing in Python. Nature Methods 2020, 17, 261–272
- McDermott et al. 2021 McDermott, M. J.; Dwaraknath, S. S.; Persson, K. A. A graph-based network for predicting chemical reaction pathways in solid-state materials synthesis. Nature Communications 2021, 12, 3097
- McDermott and Dwaraknath 2021 McDermott, M.; Dwaraknath, S. GENESIS-EFRC/reaction-network: v2.0.3. 2021; \urlhttps://doi.org/10.5281/zenodo.5165276
- Caballero et al. 2002 Caballero, A.; Hernán, L.; Morales, J.; Sánchez, L.; Santos Peña, J.; Aranda, M. A. Synthesis and characterization of high-temperature hexagonal P2-Na0.6MnO2 and its electrochemical behaviour as cathode in sodium cells. J. Mater. Chem. 2002, 12, 1142–1147
- Paulsen and Dahn 1999 Paulsen, J.; Dahn, J. Studies of the layered manganese bronzes, Na2/3[Mn1-xMx]O2 with M=Co, Ni, Li, and Li2/3[Mn1-xMx]O2 prepared by ion-exchange. Solid State Ionics 1999, 126, 3–24
- Clément et al. 2015 Clément, R. J.; Bruce, P. G.; Grey, C. P. Review-Manganese-based P2-type transition metal oxides as sodium-ion battery cathode materials. J. Electrochem. Soc. 2015, 162, A2589–A2604
- Jain et al. 2011 Jain, A.; Hautier, G.; Ping Ong, S.; Moore, C. J.; Fischer, C. C.; Persson, K. A.; Ceder, G. Formation enthalpies by mixing GGA and GGA + U calculations. Physical Review B 2011, 84, 45115
- Martinolich et al. 2016 Martinolich, A. J.; Higgins, R. F.; Shores, M. P.; Neilson, J. R. Lewis Base Mediated Polymorph Selectivity of Pyrite CuSe2 through Atom Transfer in Solid-State Metathesis. Chem. Mater. 2016, 28, 1854–1860
- Schmalzried 1981 Schmalzried, H. Solid state reactions; Verlag Chemie, 1981
- Kitchaev et al. 2017 Kitchaev, D. A.; Dacek, S. T.; Sun, W.; Ceder, G. Thermodynamics of Phase Selection in MnO2 Framework Structures through Alkali Intercalation and Hydration. J. Am. Chem. Soc. 2017, 139, 2672–2681
- Bai et al. 2020 Bai, J.; Sun, W.; Zhao, J.; Wang, D.; Xiao, P.; Ko, J. Y. P.; Huq, A.; Ceder, G.; Wang, F. Kinetic Pathways Templated by Low-Temperature Intermediates during Solid-State Synthesis of Layered Oxides. Chemistry of Materials 2020, 32, 9906–9913, Publisher: American Chemical Society
- Neilson and McQueen 2012 Neilson, J. R.; McQueen, T. M. Bonding, Ion Mobility, and Rate-Limiting Steps in Deintercalation Reactions with ThCr2Si2-type KNi2Se2. J. Am. Chem. Soc. 2012, 134, 7750–7757
- Hayward et al. 1999 Hayward, M. A.; Green, M. A.; Rosseinsky, M. J.; Sloan, J. Sodium hydride as a powerful reducing agent for topotactic oxide deintercalation: Synthesis and characterization of the nickel(I) oxide LaNiO2. J. Am. Chem. Soc. 1999, 121, 8843–8854
![[Uncaptioned image]](/html/2104.05986/assets/figures/toc_fig.png)