A search for signatures of interactions of X-ray binary outflows with their environments with ALMA
We observed the X-ray binaries Cir X1, Sco X1, GRS 1915+105, GX 13+1, and Cyg X1 with the Atacama Large Millimeter/submillimeter Array (ALMA). Unresolved continuum emission is found at the positions of all the sources at a frequency of 92 GHz, with flux densities ranging between 0.8 and 10 mJy/beam. In all cases the emission can be associated with jets that have been extensively observed at lower frequencies. We searched for line emission from H recombination, SiO, H2O, and CH3OH at the positions of all the sources and, for Cir X1 and Cyg X1, also at regions where shocks associated with an interaction between the jet and the interstellar medium had previously been observed. The search did not yield any significant detection, resulting in 3 upper limits between 0.65 and 3.7 K km s-1 for the existence of line emission in these regions.
In contrast, we detected spatially unresolved SiO emission in the field of view of GX 13+1, and we tentatively associate this emission with a SiO maser in a potential young stellar object or evolved star. We also found spatially extended line emission at two additional sites in the field of view of GX 13+1 that we tentatively associate with emission from SO and CH3OH; we speculate that it may be associated with a star-forming region, but again we cannot rule out alternative origins such as emission from evolved stars.
Key Words.:
X-rays: binaries – Accretion, accretion disks – ISM: jets and outflows – stars: neutron, black holes – X-rays: individual: Cir X1, Sco X1, GRS 1915+105, GX 13+1, Cyg X11 Introduction
Accretion onto stellar-mass black holes (BHs) and neutron stars (NSs) in X-ray binaries (XRBs) releases copious amounts of radiation into the interstellar medium (ISM; Frank et al. 1992). X-ray binaries also show the two other fundamental ingredients of accretion onto compact objects: relativistic jets (Stirling et al. 2001; Fomalont et al. 2001) and hot, dense winds (Ueda et al. 2004; Miller et al. 2006; Muñoz-Darias et al. 2016).
Given the similarity between accretion processes in XRBs and other compact objects, such as supermassive BHs, where radiation and outflows interact with their host galaxy (see e.g. reviews by McNamara & Nulsen 2007; Fabian 2012) and even regulate galaxy growth (e.g. Maiolino et al. 2017), we also expect the XRB environments to be affected by the expelled material, energy, and momentum. As an example, jets are likely at the origin of the parsec-scale bubbles observed around ultra-luminous X-ray sources (e.g. Pakull et al. 2010) that are generally identified with (extragalactic) XRBs containing NSs or stellar-mass BHs and accreting well above the Eddington limit, or, in a few cases, intermediate-mass BHs accreting at the Eddington limit. However, in our galaxy, and despite extensive searches for signatures of an interaction between XRB jets and the ISM (Miller-Jones et al. 2008, and references therein), direct observational evidence of jet-inflated bubbles has only been reported in two cases (Dubner et al. 1998; Gallo et al. 2005; Russell et al. 2007); one of these two cases, SS 433, is the only known galactic ultra-luminous X-ray source (Begelman et al. 2006).
Recently, and following previous work by Rodriguez & Mirabel (1998) and Chaty et al. (2001), Tetarenko et al. (2018) searched for molecular line emission in the IRAS 19132+1035 region near the microquasar GRS 1915+105. They identified a zone with significant molecular line emission that could be traced back to a jet-ISM interaction but concluded that the jet did not appear to be powering the entire region. Tetarenko et al. (2020) also reported a detection of molecular line emission in the central molecular zone coinciding with candidate jet-ISM interaction zones near the BH XRBs GRS 1758–258 and 1E 1740.7–2942 that may trace the cavities in the gas surrounding those systems. Importantly, all these works report on jet-ISM interactions taking place relatively far from the XRBs, at parsec scales.
At smaller scales (a few tens of AU), Fomalont et al. (2001) detected radio lobes dominated by compact hot spots along the jet direction of the NS XRB Sco X1; they speculated that the radio lobes were generated at the working surface where the highly relativistic jet impacted the ambient medium. At even smaller scales, the effect of wide-angle X-ray winds from the accretion disc could become noticeable. Being dense (1012–1013 cm-3), relatively slow (with velocities of a few hundred km s-1), and with estimated mass loss rates of 1018–1019 g s-1(e.g. Ueda et al. 2004; Kubota et al. 2007; Ueda et al. 2009), such winds could have a significant impact close to the XRBs by sweeping up the ambient gas and compressing it. Alternatively, winds could cool, form cold clumps, and result in molecular outflows, at least in luminous quasars (Richings & Faucher-Giguère 2018, and references therein). However, to our knowledge, the effect of XRB winds in the ISM or their evolution as they leave the binary system has not yet been investigated.
While in terms of energetics XRB winds have been estimated to be less powerful than jets (1033–1035 erg s-1 vs. 1036 –1037 erg s-1, respectively; e.g. King et al. 2013; Fender & Muñoz-Darias 2016), the wind power estimates suffer uncertainties related to the wind optical thickness, the spectral energy distribution that is illuminating it, and the portion of the wind that is invisible via X-ray spectroscopy due to being fully ionised (e.g. Díaz Trigo & Boirin 2016). Moreover, the duty cycle of winds is still uncertain, the question being whether they co-exist with jets throughout an accretion outburst (e.g. Neilsen & Lee 2009; Homan et al. 2016). If so, their duty cycle would be longer than that of jets, making the total energy deposited over time more similar for both output channels. Finally, the high collimation and speed of jets may make a significant energy deposit in their environments unlikely until they encounter a dense medium (Heinz 2002; Miller-Jones et al. 2008) or are significantly decelerated (Corbel et al. 2002). In contrast, accretion disc winds may be more efficient at depositing energy in low density environments at sub-parsec scales due to their lower velocity and wide-angle geometry. In the end, the relative impact of jets, winds, and radiation will not only depend on their properties but also on the properties of the ISM where the XRBs reside. For example, Haid et al. (2018) found that stellar winds couple more efficiently to the ISM than ionising radiation but that the relative impact of those winds and the ionising radiation is strongly dependent on the properties of the ambient medium.
We observed five XRBs at millimetre wavelengths with the Atacama Large Millimeter/submillimeter Array (ALMA) with the goal of exploring the existence of atomic and molecular line emission from their accretion discs, both close to the XRBs, where powerful X-ray and optical winds are expelled, and farther away, where there are known sites of jet-ISM interaction and where shocks are expected. For this exploratory study we chose a sample of persistently accreting sources that includes both NS and BH systems and both low- and high-mass stellar companions. All sources are known jet emitters, and strong wide-angle winds have been well studied for a subset of them. We targeted molecular lines that trace high density gas commonly found in shocks and atomic recombination lines. In this paper, we report on the results of these observations.
2 Characteristics of the sample
2.1 Cir X1
Cir X1 is the youngest known XRB, with an estimated age of 5400 years (Heinz et al. 2013). It is located at a distance of 9.4 kpc (Heinz et al. 2015). It contains a star, the type of which remains in dispute (e.g. Jonker et al. 2007; Johnston et al. 2016), that orbits a NS (Tennant et al. 1986; Linares et al. 2010) in an eccentric orbit ( 0.4–0.45). Periodic flares at radio, infrared (IR), and X-ray frequencies every 16.6 d were interpreted as enhanced accretion close to periastron (Murdin et al. 1980; Nicolson et al. 1980). Radio observations at 5.5 and 9 GHz covering the full binary orbit showed that significant emission is present throughout the orbit, although the flux level is very low, 1 mJy, at phases outside periastron (Calvelo et al. 2012b). The same observations showed that the spectra evolve from optically thick to thin during the course of a flare, reaching already optical thinness by orbital phases of 0.05.
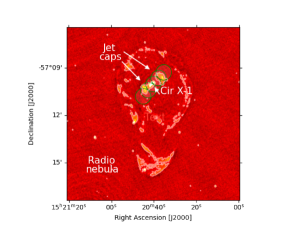
Calvelo et al. (2012a) reported, for the first time, millimetre emission (at 33 and 35 GHz) during a periastron flare that had structures at sub-arcsecond scales (1′′ corresponding to 0.04 pc at the distance of Cir X1) and decayed over the following four days. A comparison of the structure of this emission with the radio emission resolved at milliarcsecond scales by Miller-Jones et al. (2012) revealed a change in the position angle of the elongated structure, which has a size of 185 AU and had been identified as the jet, suggesting that it could be precessing. Indeed, Coriat et al. (2019) successfully modelled the emission observed at different frequencies and angular scales from sub-arcsecond to arcminutes as a jet precessing over a five-year period and with mildly relativistic ejecta. Jets have also been observed in X-rays and are spatially coincident with the radio jets (Heinz et al. 2007; Sell et al. 2010). The same X-ray observations show two diffuse X-ray caps that could be terminal shocks resulting from powerful jets running into the ISM (Sell et al. 2010). Besides the collimated jets, an accretion disc wind likely driven by thermal and radiation pressure has been inferred from the detection of X-ray P–Cygni profiles (Brandt & Schulz 2000; Schulz & Brandt 2002), and a stellar wind from the companion has been inferred from the detection of blueshifted X-ray emission lines at a different epoch (Schulz et al. 2020).
Cir X1 is embedded in a radio nebula that extends over several parsecs (Haynes et al. 1986) and is attributed to the supernova remnant at which Cir X1 originated (Heinz et al. 2013). Although not at the origin of the nebula as initially suggested (Stewart et al. 1993), there is increasing evidence that the precessing jets of Cir X1 may be shaping it by injecting energy at different scales and in different directions over its five-year cycle (Coriat et al. 2019).
2.2 Sco X1
At a distance of 2.8 0.3 kpc (Bradshaw et al. 1999), Sco X1 is the closest known ‘persistent’ NS XRB. It constantly radiates at or near Eddington luminosity and has a period of 0.787 days (Gottlieb et al. 1975). Steeghs & Casares (2002) performed high-resolution IR spectroscopy throughout 75% of the orbit of Sco X1 and suggested that the companion star must be a significantly evolved subgiant with a radius of more than twice the main-sequence radius of 0.5 R⊙ and a mass of 0.42 M⊙. Radio emission from the source was first detected by Andrew & Purton (1968). Measurements with the Very Large Baseline Array (VLBA) spanning three years revealed the existence of two components at 20–40 milliarcseconds of the radio core (corresponding to 20–170 AU at the distance of Sco X1), which are moving away from it and are reminiscent of the hot spots found in many extragalactic radio double sources (Fomalont et al. 2001). Their relative motion and flux densities implied an average component speed of = 0.45 0.03 at 446∘ to the line of sight. Fomalont et al. (2001) suggested that the two radio components consisted of ultra-relativistic plasma produced at a working surface where the highly relativistic beams impacted the ambient medium.
Evidence of a high-velocity outflow was also reported at near-infrared (NIR) frequencies based on the detection of a P-Cygni profile in the Brackett line of Sco X1 (Bandyopadhyay et al. 1999). The existence of the Brackett line was later confirmed, and its width was measured to be 480 km s-1, consistent with that of H (Mata Sanchez et al. 2015), although the P-Cygni profile indicative of a wind was not confirmed.
2.3 GRS 1915+105
GRS 1915+105 is a low-mass XRB (LMXB) at a distance of 8.6 kpc (Reid et al. 2014) that consists of a KIII companion (Greiner et al. 2001b) orbiting a 12 M⊙ BH with a period of 33.85 0.16 days (Steeghs et al. 2013). It was the first XRB to show episodic radio jets with apparently superluminal velocities (Mirabel & Rodriguez 1994). Besides the episodic jets, a compact radio jet of 2.5–7 AU was resolved in observations at 15–43 GHz (Dhawan et al. 2000).
Rodriguez & Mirabel (1998) first studied the surroundings of GRS 1915+105 and investigated the possible relation of the XRB with two IR-to-radio sources that appear symmetrically located with respect to GRS 1915+105 and aligned with the position angle of the relativistic ejecta. They reported on a potential non-thermal structure in one of these regions, IRAS 19132+1035, that could be related to either a bow shock or an ionisation front. Chaty et al. (2001) explored these regions further and reported that the evidence for the non-thermal structure being a jet-ISM interaction zone was indecisive. A similar conclusion was reached by Miller-Jones et al. (2008), who set upper limits to the presence of X-ray emission that could signal the presence of shock acceleration. Finally, Tetarenko et al. (2018) re-observed the zone of significant molecular line emission and concluded instead that it could be traced back to a jet-ISM interaction but also that the jet did not appear to be powering the entire region.
Similarly to other LMXBs observed at high inclination, GRS 1915+105 also shows an accretion disc wind, observed via blueshifted absorption lines in X-ray spectra (e.g. Kotani et al. 2000; Lee et al. 2002; Ueda et al. 2009). The wind is generally visible whenever the jet is absent (Neilsen & Lee 2009) and has been shown to react to changes in the broadband X-ray spectrum on timescales as short as 5 seconds (Neilsen et al. 2011).
2.4 GX 13+1
GX 13+1 is a NS LMXB (Fleischman 1985; Matsuba et al. 1995) observed at a high inclination (Díaz Trigo et al. 2012; Iaria et al. 2014). The companion star was identified as an evolved late-type K5 iii star, located at a distance of 71 kpc (Bandyopadhyay et al. 1999). An orbital period of 24.7 days was determined from IR and X-ray modulations (Bandyopadhyay et al. 2002; Corbet 2003; Corbet et al. 2010) and later refined to 24.5274(2) days based on the timing of X-ray dips (Iaria et al. 2014). Radio emission at centimetre wavelengths was first detected by Grindlay & Seaquist (1986). The similarity of the radio flux levels, spectral indices, and their variability with those of other NSs accreting at high Eddington luminosities was interpreted as an indication of the presence of relativistic jets (e.g. Garcia et al. 1988; Homan et al. 2004).
In addition to jets, GX 13+1 shows narrow absorption lines in the X-ray band that have been interpreted as a wide-angle accretion disc wind outflowing at 400 km s-1 (Ueda et al. 2001; Sidoli et al. 2002; Ueda et al. 2004; Díaz Trigo et al. 2012; Madej et al. 2014; Allen et al. 2018). Evidence for a disc wind was also reported at NIR frequencies based on the presence of a Brackett line with a P-Cygni profile that indicates an outflow velocity of 2400 km s-1 (Bandyopadhyay et al. 1999).
The existence of an extended nebula surrounding the source similar to those of Cir X1 (Haynes et al. 1986) and Cyg X1 (Gallo et al. 2005) has not been reported so far, and Garcia et al. (1988) attribute extended emission found in the area around GX 13+1 to unassociated galactic HII regions. They also set a 2 upper limit of 0.1 mJy at 6 cm and 1.0 mJy at 20 cm to the existence of Sco X1-like lobes within 1′ of GX 13+1 (equivalent to 2 pc at a distance of 7 kpc).
2.5 Cyg X1
Cyg X1 is one of the best studied BH XRBs and the only confirmed high-mass XRB (HMXB) in our sample. The binary has a period of 5.6 days (Holt et al. 1979), was most likely born in the stellar association Cygnus OB3 (Mirabel & Rodrigues 2003), and consists of a BH accreting from the stellar wind of a supergiant O9.7 star (Webster & Murdin 1972; Walborn 1973). At a distance of 2.22 kpc, according to the most recent estimate with VLBA (Miller-Jones et al. 2021), the BH would have a mass of 21.2 M⊙. Cyg X1 is one of the few persistently accreting BHs (GRS 1915+105 is another) and is predominantly in a spectrally hard accretion state (e.g. Grinberg et al. 2013). During such a state, the spectrum between 2 and 220 GHz shows a flat spectral index (Fender et al. 2000) and is attributed to a compact jet, resolved at milliarcsecond scales (33 AU at the distance of Cyg X1; Stirling et al. 2001). The line-driven stellar wind, focused towards the BH (e.g. Gies et al. 2003), is clumpy (e.g. Rahoui et al. 2011; Hirsch et al. 2019), dominates mass transfer, and is in turn affected by the X-rays of the BH (e.g. Gies et al. 2003, 2008; Nowak et al. 2011).
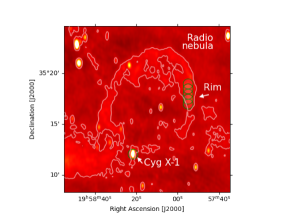
Cyg X1 is the only source in our sample associated with a parsec-scale nebula detected in radio (Gallo et al. 2005) and bright in H and [OIII] (5007 ) emission (Russell et al. 2007) that is thought to be inflated by the BH jet or the wind of the O star (Sell et al. 2015). Remarkably, the energy output of the O star wind is estimated to be of the order of that of the BH jet, indicating that, in addition to the two feedback channels considered here for XRBs (jets and accretion disc winds), stellar winds also have to be considered for HMXBs (we note that stellar winds from massive stars continue to be investigated as a source of feedback, and some authors even consider them to be more disruptive for molecular clouds than supernovae, e.g. Rey-Raposo et al. (2017); however, these investigations often do not consider the role of the compact object in shaping the stellar wind). Finally, the nebula around Cyg X1 has an age similar to the time that the XRB was close to a bright HII region, indicating that a dense local medium may be required to form the shock wave (Russell et al. 2007).
3 Observations and data analysis
[b]
| Source | Type | Compact | Orbital | Distance | Inclination | Observation date |
|---|---|---|---|---|---|---|
| object | period (d) | (kpc) | (degrees) | |||
| Cir X1 | HMXB/LMXB?1 | NS2 | 16.63 | 9.44 | 705 | 23 Oct 2016 17:26 – 18:45 |
| Sco X1 | LMXB6 | NS6 | 0.797 | 2.88 | 409 | 25 Oct 2016 16:50 – 17:38 |
| GRS 1915+105 | LMXB10 | BH11 | 33.812 | 8.613 | 66 211 | 25 Oct 2016 17:41 – 18:23 |
| GX 13+1 | LMXB14 | NS14 | 24.515 | 716 | 7017 | 05 Nov 2016 22:46 – 23:27 |
| Cyg X1 | HMXB18 | BH19 | 5.620 | 2.2221 | 27.1 0.819 | 06 Nov 2016 21:02 – 22:02 |
| 29 Nov 2016 20:39 – 21:40 |
- 1
- 2
-
3
Kaluzienski et al. (1976)
-
4
Heinz et al. (2015)
-
5
From the presence of dips in its light curve (Clarkson et al. 2004)
-
6
Steeghs & Casares (2002)
-
7
Gottlieb et al. (1975)
-
8
Bradshaw et al. (1999)
-
9
Mata Sanchez et al. (2015)
-
10
Greiner et al. (2001b)
-
11
Greiner et al. (2001a)
-
12
Steeghs et al. (2013)
-
13
Reid et al. (2014)
- 14
-
15
Bandyopadhyay et al. (2002)
-
16
Bandyopadhyay et al. (1999)
- 17
-
18
Webster & Murdin (1972)
-
19
Orosz et al. (2011)
-
20
Holt et al. (1979)
-
21
Miller-Jones et al. (2021)
ALMA observed the XRBs Cir X1, Sco X1, GRS 1915+105, GX 13+1, and Cyg X1 from October to November 2016 (see Table LABEL:tab:obslog). For these exploratory observations we only used the 12 m array due to its superior sensitivity and angular resolution, which was a better match for our search for weak and small regions of line emission. All observations were set up to use six spectral windows centred at 84.68117, 85.64439, 86.24337, 86.84696, 96.49964, 97.5, and 99.02295 GHz (Band 3). The characteristics of the spectral windows are listed in Table LABEL:tab:spwlog. The observations were performed using a number of 12 m antennas, between 37 and 44, and maximum baseline lengths between 0.7 and 1.8 km. One pointing was performed in the direction of each source, and we performed additional pointings for Cir X1 along the jet direction (a total of five pointings extending over a total of 189′′63′′ centred on the source; see Fig. 1) and for Cyg X1 at the shell of the nebula surrounding it (a total of five pointings extending over 189′′63′′ and centred at position 19:57:55.0 +35:18:30.0; see Fig. 2). Further technical characteristics of the observations are listed in Table LABEL:tab:obslog2.
We first examined the ALMA calibrated products. Re-calibration for all datasets as well as image generation and analysis was done with CASA version 5.6.1-8 (Emonts et al. 2019) and the integrated ALMA pipeline. We re-generated images from the calibrated products following standard procedures and applying natural weighting. We then applied phase-only self-calibration with solution intervals of 15, 90, 90, and 45 s for Cir X1, Sco X1, GRS 1915+105, and Cyg X1, respectively. We did not apply self-calibration to GX 13+1 as we deemed it too faint. We found that self-calibration significantly improved the images, recovering 30–45% of the flux at the source position that was otherwise spread outside of one synthesised beam due to phase decoherence. We attribute this phase decoherence to the relatively poor ( 30∘) phase rms conditions during all the observations except for GX 13+1 (see Table LABEL:tab:obslog2). While ALMA antennas are equipped with water vapour radiometers, which are used to correct differential phase errors introduced by precipitable water vapour (PWV) over the array, this correction is less efficient in conditions of very low PWV, as is the case for our observations (for reference, the maximum PWV value required for Band 3 observations is 5.186 mm111Remijan, A., Biggs, A., Cortes, P., A., Dent, B., Di Francesco, J., Fomalont, E., Hales, A., Kameno, S., Mason, B., Philips, N., Saini, K., Stoehr, F., Vila Vilaro, B., Villard, E. 2019, ALMA Technical Handbook, ALMA Doc. 7.3, ver. 1.1).
We also extracted data cubes at the spectral resolution of the cubes, 1 km s-1, and inspected them for the presence of line emission. Unless otherwise indicated, the reported flux density for all sources in this paper corresponds to the peak flux from the elliptical Gaussian fitted to the source emission in the image plane after primary beam correction, and the error corresponds to the rms of the image measured far away from the source position.
| Line | Rest frequency | Bandwidth | Resolution | Spw |
| (GHz) | (MHz) | (MHz) | ||
| Upper Side Band | ||||
| H (40) | 99.02295 | 937.5 | 0.488 | 0 |
| Continuum | 97.495 | 468.75 | 0.488 | 1 |
| H2O v2=1 4(4,0)-5(3,3) | 96.49964 | 468.75 | 0.488 | 2 |
| Lower Side Band | ||||
| SiO v=1 2-1 | 86.24337 | 468.75 | 0.488 | 3 |
| SiO v=0 2-1 | 86.84696 | 468.75 | 0.488 | 4 |
| CH3OH | 84.68628 | 468.75 | 0.488 | 5 |
| H (42) | 85.64956 | 468.75 | 0.488 | 6 |
| Source | ToS | Calibrators | FoV | Synthesised beam | PWV | Phase rms | ||||
|---|---|---|---|---|---|---|---|---|---|---|
| (s) | Bandpass | Flux | Phase | (arcsec) | (parsec) | (arcsec) | (parsec) | (mm) | before/after (∘) | |
| Cir X1 | 4768 | J16175848 | Titan | J15315108 | 63 189 | 2.87 8.61 | 0.67 0.63 | 0.030 0.029 | 1.5 | 63/29 |
| Sco X1 | 2928 | J15172422 | Callisto | J16291720 | 63 63 | 0.86 0.86 | 0.78 0.65 | 0.011 0.009 | 0.6 | 54/46 |
| GRS 1915+105 | 2527 | J1751+0939 | J1751+0939 | J1922+1530 | 63 63 | 2.63 2.63 | 1.44 0.63 | 0.060 0.026 | 0.5 | 32/24 |
| GX 13+1 | 2421 | J19242914 | J19242914 | J18322039 | 63 63 | 2.14 2.14 | 1.34 0.80 | 0.045 0.027 | 1.7 | 14/10 |
| Cyg X1 | 7249 | J2025+3343 | J2148+0657 | J1953+3537 | 63 63 | 0.57 0.57 | 1.65 0.96 | 0.015 0.009 | 2.9 | 44/34 |
4 Results
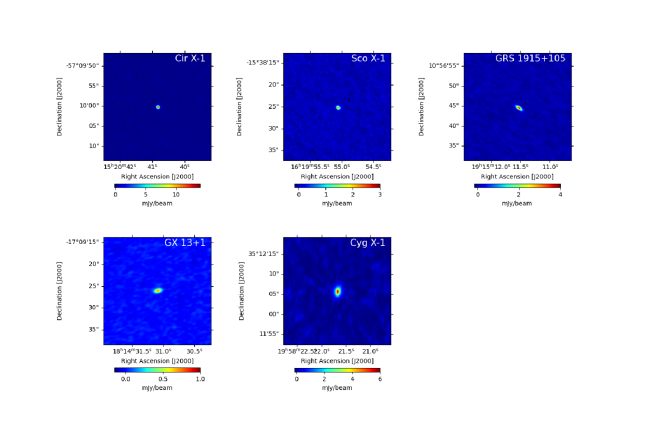
We detected significant spatially unresolved continuum emission at the position of all the XRBs in our sample (see Fig. 3 and Table LABEL:tab:fluxlog). The flux densities range from 0.7 to 13.7 mJy/beam, and the spectral index between 84 and 99 GHz is flat or inverted for all the sources except for Cir X1.
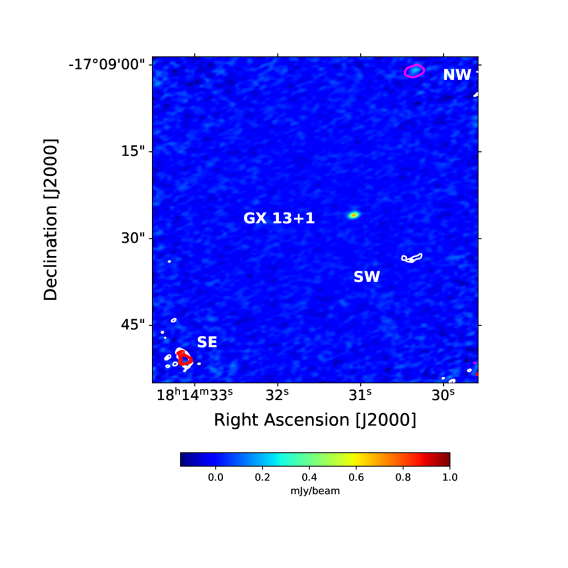
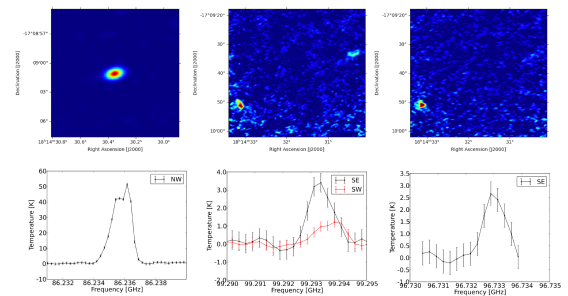
In contrast, we did not detect line emission at the position of any source down to 3 limits of 0.65 –3.7 K km s-1 (see Table LABEL:tab:linelog). However, we did detect line emission at three different positions within the field of view of GX 13+1 (see Table LABEL:tab:lineloggx and Fig. 4). This is the only source in the sample that shows line emission in its surroundings. Interestingly, we did not detect continuum emission down to noise levels of 30 Jy/beam in any of the positions that show significant line emission. In addition, the lines have different spatial properties since one is spatially unresolved and the others are spatially resolved at scales of up to 6′′ (see Figs. 5–7).
| Source | Peak flux | Spectral index |
|---|---|---|
| (mJy/beam) | ||
| Cir X1 | 13.69 0.05 | -0.09 0.01 |
| Sco X1 | 2.48 0.03 | -0.0070.008 |
| GRS 1915+105 | 3.63 0.04 | 0.0150.008 |
| GX 13+1 | 0.75 0.02 | 0.0050.005 |
| Cyg X1 | 5.69 0.05 | -0.02 0.01 |
| Source | Line intensity (K km s-1) | |
|---|---|---|
| Lower Side Band | Upper Side Band | |
| Cir X1 | 3.3 | 3.7 |
| Sco X1 | 2.1 | 2.4 |
| GRS 1915+105 | 1.5 | 1.5 |
| GX 13+1 | 0.65 | 0.65 |
| Cyg X1 | 1.0 | 1.0 |
| Frequency range | Position | Peak temperature | Peak frequency | |
|---|---|---|---|---|
| (GHz) | RA (J2000) | Dec (J2000) | (K km s-1) | (GHz) |
| 86.2344–86.2369 | 18 14 30.35 | -17 09 01.0 | 340.8 1.5 | 86.2362 |
| 96.7326–96.7333 | 18 14 33.13 | -17 09 50.9 | 8.3 1.0 | 96.7329 |
| 99.2928–99.2940 | 18 14 33.12 | -17 09 50.9 | 10.4 1.5 | 99.2933 |
| 99.2928–99.2940 | 18 14 30.38 | -17 09 33.3 | 5.0 0.7 | 99.2938 |
5 Discussion
Radio continuum emission at centimetre wavelengths was previously detected for all the XRBs in our sample and was identified with a jet origin. Emission up to at least 40 GHz has also been observed for all the sources except GX 13+1, for which reported detections span up to approximately 10 GHz. Given the previous measurements at lower frequencies and the spectral index of the emission at each accretion state of each source, the flux densities reported here are not unexpected. We give a detailed comparison for each source in Sect. 5.1.
We also searched for line emission down to a spectral resolution of 1 km s-1 at the positions of the XRBs and their surroundings. Water maser emission has been observed in the accretion discs of supermassive BHs (e.g. Humphreys et al. 2013) and at the regions where their jets impact molecular clouds (e.g. Peck et al. 2003). Given the similarities between accretion processes in XRBs and supermassive BHs, we would expect line emission to also be present in XRBs. While the upper limits to the presence of lines in our observations are quite stringent, all the observations showed continuum emission from the jet, which at the same time may hinder the detection of disc lines. Alternatively, strong line emission may only become significant over the continuum in the presence of flares. For example, Eikenberry et al. (1998) identified the NIR HeI and Brackett emission lines in GRS 1915+105 as arising in the accretion disc and found that their flux varied proportionally with the IR continuum flux, indicating that the lines were radiatively pumped by the flares. In this sense, our observations show relatively weak jet emission compared to the radio flares observed up to Jansky levels in these sources during other periods, such as changes of accretion state. For comparison, the Brackett emission line reported by Eikenberry et al. (1998) is only 5 mJy above the continuum when the continuum is 40 mJy, but it brightens to 10 mJy above the continuum when the continuum increases up to 60 mJy (see their Fig. 1).
As opposed to the positions of the XRBs, continuum emission is unlikely to be the reason for not detecting line emission near the XRBs and at the regions close to Cir X1 and Cyg X1, where evidence for jet-ISM interaction had previously been observed. A potential reason for the lack of lines is that the lines are weak or extend over large regions. For comparison, the molecular lines of SiO and CH3OH reported by Tetarenko et al. (2018, 2020) and traced back to jet-ISM interactions have temperatures generally below 0.6 K km s-1 and are extended over relatively large regions, at near-arcminute scales. Therefore, they would not be detected in our observations, which reached sensitivities of 0.6–4 K km s-1 (see Table LABEL:tab:linelog) and could only recover angular scales up to 15′′. Another potential reason could be that the medium that the jet or the wind is propagating through has a low density compared to the average ISM density, 1 cm-3. Based on the observation of GRS 1915+105 jet ejections travelling at a constant speed to distances of at least 0.04 pc (Mirabel & Rodriguez 1994; Fender et al. 1999; Miller-Jones et al. 2007) and on jet energetic arguments, Heinz (2002) estimated that the density around this XRB was 10-3 cm-3 (unless the jets were narrower than 0.15∘ or extremely energetic, 1047 ergs). They suggested that the region around GRS 1915+105 was occupied by the hot ISM phase or that previous activity of the jets (or the supernova at which the progenitor formed) could have created an evacuated bubble around it. Interestingly, Haid et al. (2018) found that, in the warm ionised ISM, stellar winds dominate the momentum injection when compared to ionising radiation for massive stars. Therefore, in LMXBs, accretion disc winds could provide an alternative to stellar winds for creating a cavity around the XRB or as a source of momentum injection in a previously evacuated bubble. A dedicated study considering the ratio of wind to XRB ionising radiation is needed to advance further on this topic.
Finally, while the shocked region around Cir X1, between 20 and 50′′ from the source (corresponding to 0.9–2.3 pc at the distance of the source), was found to be bright in diffuse X-rays and radio emission (Sell et al. 2010, see their Fig. 2), we did not detect any continuum emission in the same areas down to noise levels of 45 Jy/beam (but we note that we cannot exclude emission at the low level of 24 Jy/beam that was detected in the previous radio observations at 5.5 GHz). In contrast to Cir X1, the shocked emission region around Cyg X1 is bright in H and OIII emission and in 1.4 GHz radio continuum emission and is located at the rim of a jet-inflated nebula of 5 pc in diameter (Gallo et al. 2005; Russell et al. 2007). However, our continuum maps again show no significant emission (noise level of 40 Jy/beam) in the region where the ring in radio emission at 1.4 GHz was previously observed at a flux level of 0.2 mJy/beam. A potential reason for the non-detection of the continuum in this case may be a spatial extent larger than that recoverable with our observations, 15′′ (0.16 pc at the distance of Cyg X1).
In summary, we found neither continuum nor line emission that could signal the presence of shocks at regions near the probed XRBs, including regions around Cir X1 and Cyg X1 where evidence for jet-ISM interaction had been previously observed. However, we also note that many of the molecular tracers of jet-ISM interactions, such as the shock tracer CS or the high-density tracers HNCO or HCO+, remain unexplored for the sources of this study. Nevertheless, we discovered three different line emission features in the field of view of GX 13+1 that could signal the presence of a yet unknown star-forming region, albeit one probably unrelated to GX 13+1. We discuss these features in detail in Sect. 5.2.
5.1 Continuum emission from a jet
5.1.1 Cir X1
Using the ephemeris in Nicolson (2007) derived from the onset times of 21 well-observed radio flares spanning the past 28 years, the ALMA observation occurred at phase 0.08. This is 6 days later than the X-ray peak detected in the Monitor of All-Sky X-ray Image (MAXI) light curves between Modified Julian Date (MJD) 57675.5 and 57677.5, and it is consistent with previous observations that indicated that the radio flares occur later in the orbit compared to the X-ray flares.
We detected significant continuum emission with a peak flux of 13.69 0.05 mJy/beam and a spectral index of – 0.09 0.01 between 84 and 99 GHz. The emission is unresolved, implying a region of emission smaller than 1017 cm for the reported beam of 0.67′′ 0.63′′ and the distance of the source. In observations performed with the Australian Telescope Compact Array (ATCA) at a resolution of 0.44′′ 0.23′′ and frequencies of 33 and 35 GHz, extended emission was reported on two different occasions (Calvelo et al. 2012a; Coriat et al. 2019). The flux in our observations is stronger than that previously reported at 33–35 GHz at the core (7 and 0.7 mJy/beam). If the extension of the emission had been similar to that reported at 33-35 GHz, we would have detected it despite our slightly poorer resolution. Thus, we conclude that our non-detection of extended emission is more likely related to the higher frequency of our observations since the extension of the emission significantly decreases as the frequency increases (Coriat et al. 2019).
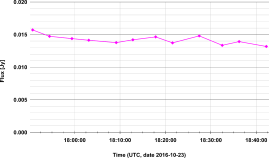
This source is the only one in our sample that shows a negative spectral index. This indicates optically thin emission, and it is consistent both with previous radio measurements at similar orbital phases that were interpreted as the decline of a periastron passage flare (Calvelo et al. 2012a) and with the flux decay observed in the light curve of the ALMA observation (see Fig. 8).
5.1.2 Sco X1
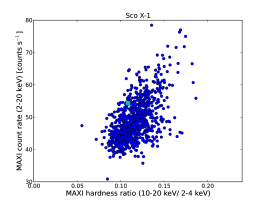
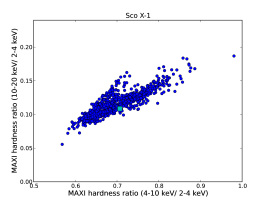
We detected unresolved emission with a flux density of 2.48 mJy/beam and a flat spectral index between 84 and 99 GHz at the position of Sco X1. Previous emission from lobes moving away from the core, such as those detected by Fomalont et al. (2001), occurred at milliarcsecond scales (1 mas corresponding to 2.8 AU at the distance of Sco X1) and would not have been resolved at the resolution of our images (see Table LABEL:tab:obslog2). However, the flat spectral index indicates that we are most likely detecting core-only (or core-dominated) emission since the lobe emission always had negative spectral indices, as expected from optically thin emission (Fomalont et al. 2001). Based on a timing analysis of contemporaneous X-ray observations, Motta & Fender (2019) associated the launch of the ultra-relativistic outflows causing the lobe emission with particular accretion states (between the so-called ‘normal’ and ‘horizontal’ branches). We produced X-ray colour-colour diagrams with data from MAXI (see Appendix A) and found that, at the time of the ALMA observations, the source was instead at the so-called ‘flaring branch’, a state associated with the weakest and least variable radio emission (Hjellming et al. 1990). The flux level detected by ALMA is of the order of the fluxes detected at such a state by Hjellming et al. (1990) between 1 and 8 GHz and with flat spectral index, although they also detected additional components during the same state with a negative spectral index. In conclusion, our detection is consistent with the jet emission extending from centimetre to millimetre wavelengths with a flat spectral index during the flaring branch, although simultaneous measurements at both wavelengths are needed to confirm this.
5.1.3 GRS 1915+105
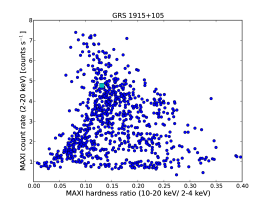
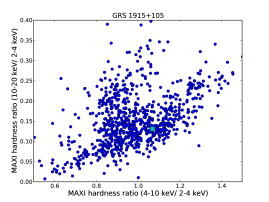
We detected spatially unresolved emission with a flux density of 3.63 mJy/beam and a slightly inverted spectral index between 84 and 99 GHz at the position of GRS 1915+105. Based on MAXI colour-colour diagrams, we infer that, at the time of the ALMA observations (see Appendix A), the source was most likely in the ‘A’ or ‘B’ state, according to the classification of Belloni et al. (2000), characterised by a substantial contribution of a disc component to the X-ray spectrum and low-level radio emission. Klein-Wolt et al. (2002) associated the radio emission during those states with either a hard component or a relic from a previous large radio event. The low flux density of the ALMA observation within this accretion state is consistent with a relatively radio-quiet period during that state.
5.1.4 GX 13+1
We detected, for the first time, compact continuum emission at a frequency of 92 GHz from GX 13+1. The flux density at centimetre wavelengths ranges from 0.25 mJy/beam to 1.3–7.2 mJy/beam and is correlated with the accretion state of the source as determined from X-ray observations (Garcia et al. 1988; Homan et al. 2004). The ALMA observations indicate a flux of 0.75 0.02 mJy/beam, in between the two ranges. The spectral index is flat, similar to that observed at radio frequencies during states with weak radio emission.
5.1.5 Cyg X1
The second observation of Cyg X1, based on hardness-intensity diagrams extracted from MAXI data (see Appendix A), was performed during a spectrally hard state. While the MAXI light curves do not cover the date of the first observation, we conclude, based on the similarity of the hardness and intensity before and after that observation, that the accretion state most likely did not change between the two observations. Our detection of continuum emission with a flat spectral index is consistent with previous findings of a flat spectra from radio to millimetre wavelengths and attributed to a compact jet (Fender et al. 2000).
5.2 Line emission in the field of view of GX 13+1
Similarly to all the other observed sources, no spectral lines were observed at the position of GX 13+1. In contrast, we detected three different line emission features in its field of view.
The strongest feature was observed 27′′ north-west (NW) of GX 13+1 at a frequency of 86.2361 GHz (see Table LABEL:tab:lineloggx and Fig. 5). We tentatively identified the line with emission from vibrationally excited SiO (v=1, J=2-1) with a redshift of 25 km s-1. The emission is spatially unresolved, implying an emission size of less than 8 1016 cm assuming the source is at a similar distance as GX 13+1 (i.e. 7 kpc). Assuming the line identification is correct and that its shift is not intrinsic to the source but is instead due to its position in the galaxy, we obtain 2.5 and 13.3 kpc as near and far kinematic distances, implying emission sizes of less than 5 1016 cm and 3 1017 cm, respectively.
We found a source coincident with the position of the line in the galactic young stellar object (YSO) catalogue of Marton et al. (2019), which was produced by running a supervised machine learning algorithm on the combined data from the Gaia DR2 database, the Wide-field Infrared Survey Explorer (WISE), and Planck. The source coincident with the SiO emission, J181430.35-170901.0, has a 57% and 42% probability of being a YSO or an evolved star, respectively, when all the WISE bands are used, and a 43% and 55% probability if WISE bands W3 and W4 are neglected. SiO masers are uncommon in star-forming regions (Zapata et al. 2009), with only six reported detections in YSOs so far (Cho et al. 2016). Additionally, if the SiO maser is associated with a star-forming region, we would expect to detect continuum emission in the ALMA maps unless the region is quite distant. For reference, a one-solar-mass core would have a flux of 0.3 mJy if placed at the near kinematic distance of 2.5 kpc, thus easily detectable in our maps (for this estimate we considered a 20 K dust temperature, the typically adopted dust opacity, and a gas-to-dust mass ratio of 100, and we assumed that the emission at 90 GHz was optically thin). Conversely, assuming the source of the SiO to be an evolved star at a distance of 2.5 kpc, we estimate, following calculations by Muller et al. (2007, 2008), a stellar flux of 25 Jy/beam and a dust envelope flux of 65 Jy/beam for a mass loss rate of 6 10 at 90 GHz. Therefore, our 3 upper limit of 90 Jy/beam indicates that our maps are not sensitive enough to detect the combined flux of the star and the dust envelope of a typical evolved star such as W Hya, for which a mass loss rate of 4.9 10 within a radius of about 70 AU has been derived (Vlemmings et al. 2011). Consequently, an evolved star origin for the SiO line remains a viable solution. Alternatively, if the source is relatively far (4 kpc), both a YSO and an evolved star remain possibilities. Further observations of the detected line and of other SiO transitions at a higher angular resolution are necessary to confirm the maser nature of the emission and the line identification.
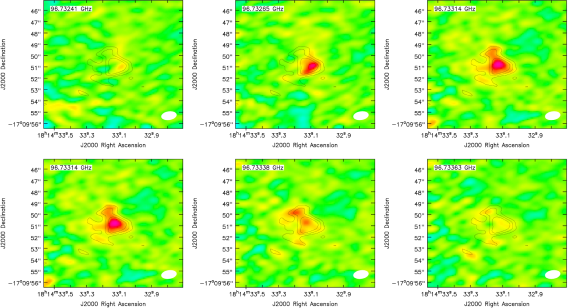
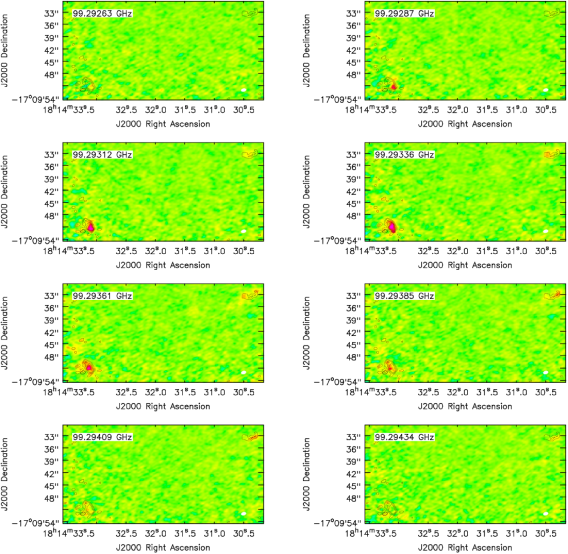
In addition to the potential SiO maser NW of GX 13+1, we also detected spatially extended line emission with a frequency of 99.2935 GHz at 12′′ south-west (SW) and 38′′ south-east (SE) of GX 13+1. If associated with H(40) , the line has a blueshift of 820 km s-1 or, if associated with SO, a redshift of 18 km s-1. At the SE position, we detected a second line with a frequency of 96.7329 GHz. If associated with H2O, the line has a blueshift of 725 km s-1 or, if associated, with CH3OH, a redshift of 20 km s-1. The spatial coincidence of two lines at the SE position indicates that a similar redshift of 18–20 km s-1 for the lines, and thus an identification with SO and CH3OH, is more plausible. The detection of the same line in the SE and SW positions may indicate that both regions are also related.
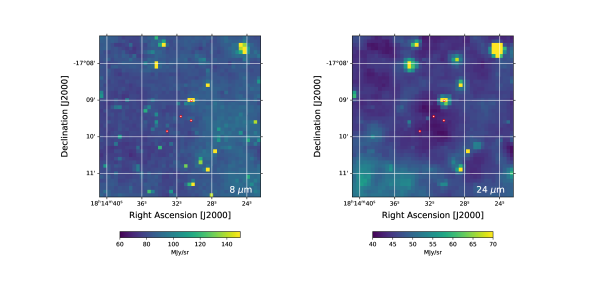
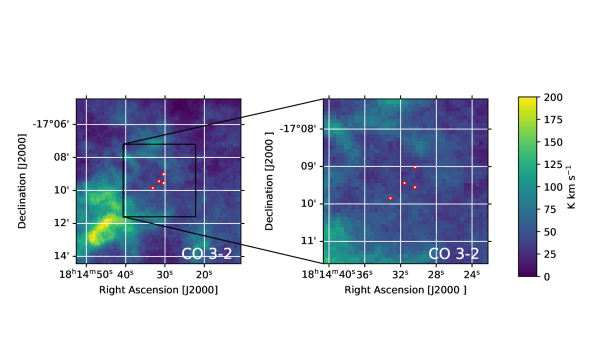
Given the uncertain origin of the SiO emission (YSO or evolved star) and the occurrence of CH3OH and SO molecules in regions of star formation (e.g. Öberg et al. 2014; Li et al. 2015; Aikawa et al. 2020), we searched for the signature of a parent molecular cloud in archival millimetre single-dish images that would indicate the existence of such a star-forming region, thus linking the three line emission regions. None of the positions were detected in the ATLASGAL survey at 850 m with a noise level of 50 mJy/beam (but we note the coarse resolution of this survey, 20′′) nor in the James Clerk Maxwell Telescope (JCMT) continuum maps at the same wavelength. This excludes the existence of at least an OB star cluster in this region and is consistent with the absence of any continuum detection in our images down to an rms of 30 Jy/beam. We also inspected the images of the Spitzer MIPSGAL 24 m (Carey et al. 2009) and GLIMPSE 8 m (Churchwell et al. 2009) surveys (see Fig. 9). The source coincident with the SiO emission, J181430.35-170901.0, is clearly visible at micrometre wavelengths in both images. It is also apparent that the positions of GX 13+1 and the line detections SE and SW of GX 13+1 are instead located in a relatively dark area in the MIPSGAL 24 m image, suggesting that no dust is present in that region. This is consistent with the absence of significant CO (3-2) emission in the JCMT/HARPS 345 GHz map (project code: M10AU20) of the same region (see Fig. 10), although we note that the cavity, or ‘dark’ region, surrounding GX 13+1 in the MIPSGAL image is significantly smaller than that of the CO (3-2) map. The existence of such a dark region around GX 13+1 could suggest a link between the XRB and the line emission regions, but this possibility remains speculative at this stage. Finally, we note that an old 20 cm image of the region (Garcia et al. 1988, see their Fig. 3) seems to show emission at the position of GX 13+1 and the SE line emission region at a level of 1 mJy but no emission at the NW or SW positions. Additionally, a 6 cm Very Large Array (VLA) image in August 1999 covering the region of the ALMA observation down to an rms of 50 Jy/beam only shows significant radio emission at the position of GX 13+1.
In summary, the field of view of GX 13+1 shows a set of features of which the strongest (SiO) is best interpreted in the context of an evolved star or a star-forming region that is currently unknown or has not been detected in continuum emission to date. The origin of the other features remains unexplained.
6 Summary and conclusions
We observed five XRBs at millimetre wavelengths with ALMA with the goal of exploring the existence of atomic and molecular line emission from their accretion discs, both close to the XRBs, where powerful X-ray and optical winds are expelled, and farther away, where sites of jet-ISM interaction are known and shocks are expected. All the sources show continuum emission consistent with a jet origin and previous observations below 40 GHz. In contrast, our exploratory search for line emission only resulted in upper limits at the position of all sources and at the sites near Cir X1 and Cyg X1, where previous signatures of jet-ISM interaction had been detected. Further searches for disc lines could specifically target either accretion states during which no, or only weak, jet emission is detected or, alternatively, states during which bright flares could pump line emission. Instead, searches for lines in the XRB environments should be complemented with searches of line emission at arcminute angular scales and target additional lines.
Interestingly, the field of view of GX 13+1 shows a set of features whose origin remains enigmatic. While the strongest feature (SiO) can be interpreted as originating in an evolved star, it is better interpreted (if it is related to the other two line emission regions) in the context of a star-forming region that is currently unknown or has not yet been detected in continuum emission. An association of these features with GX 13+1 remains speculative at this stage. Follow-up observations of CO at higher sensitivities could help us understand whether the sites of emission are related and shed light on the nature of this region. This should be complemented with observations of other transitions of the candidate molecules to confirm line identification.
Acknowledgements.
We thank the anonymous referee for a very useful report that helped to improve the quality of this paper. We also thank Mickael Coriat for providing the radio maps for Cir X1 and Elena Gallo and Dave Russell for those of Cyg X1. MDT thanks Yuxin Lin for help in producing figure 9. This paper makes use of the following ALMA data: ADS/JAO.ALMA#2016.1.00496.S. ALMA is a partnership of ESO (representing its member states), NSF (USA) and NINS (Japan), together with NRC (Canada) and NSC and ASIAA (Taiwan), in cooperation with the Republic of Chile. The Joint ALMA Observatory is operated by ESO, AUI/NRAO and NAOJ.References
- Aikawa et al. (2020) Aikawa, Y., Furuya, K., Yamamoto, S., & Sakai, N. 2020, ApJ, 897, 110
- Allen et al. (2018) Allen, J. L., Schulz, N. S., Homan, J., et al. 2018, ApJ, 861, 26
- Andrew & Purton (1968) Andrew, B. H. & Purton, C. R. 1968, Nature, 218, 855
- Bandyopadhyay et al. (2002) Bandyopadhyay, R. M., Charles, P. A., Shahbaz, T., & Wagner, R. M. 2002, ApJ, 570, 793
- Bandyopadhyay et al. (1999) Bandyopadhyay, R. M., Shahbaz, T., Charles, P. A., & Naylor, T. 1999, MNRAS, 306, 417
- Begelman et al. (2006) Begelman, M. C., King, A. R., & Pringle, J. E. 2006, MNRAS, 370, 399
- Belloni et al. (2000) Belloni, T., Klein-Wolt, M., Méndez, M., van der Klis, M., & van Paradijs, J. 2000, A&A, 355, 271
- Bradshaw et al. (1999) Bradshaw, C. F., Fomalont, E. B., & Geldzahler, B. J. 1999, ApJ, 512, L121
- Brandt & Schulz (2000) Brandt, W. N. & Schulz, N. S. 2000, ApJ, 544, L123
- Calvelo et al. (2012a) Calvelo, D. E., Fender, R. P., Tzioumis, A. K., & Broderick, J. W. 2012a, MNRAS, 419, L54
- Calvelo et al. (2012b) Calvelo, D. E., Fender, R. P., Tzioumis, A. K., et al. 2012b, MNRAS, 419, 436
- Carey et al. (2009) Carey, S. J., Noriega-Crespo, A., Mizuno, D. R., et al. 2009, PASP, 121, 76
- Chaty et al. (2001) Chaty, S., Rodríguez, L. F., Mirabel, I. F., et al. 2001, A&A, 366, 1035
- Cho et al. (2016) Cho, S.-H., Yun, Y., Kim, J., et al. 2016, ApJ, 826, 157
- Churchwell et al. (2009) Churchwell, E., Babler, B. L., Meade, M. R., et al. 2009, PASP, 121, 213
- Clarkson et al. (2004) Clarkson, W. I., Charles, P. A., & Onyett, N. 2004, MNRAS, 348, 458
- Corbel et al. (2002) Corbel, S., Fender, R. P., Tzioumis, A. K., et al. 2002, Science, 298, 196
- Corbet (2003) Corbet, R. H. D. 2003, ApJ, 595, 1086
- Corbet et al. (2010) Corbet, R. H. D., Pearlman, A. B., Buxton, M., & Levine, A. M. 2010, ApJ, 719, 979
- Coriat et al. (2019) Coriat, M., Fender, R. P., Tasse, C., et al. 2019, MNRAS, 484, 1672
- Dhawan et al. (2000) Dhawan, V., Mirabel, I. F., & Rodríguez, L. F. 2000, ApJ, 543, 373
- Díaz Trigo & Boirin (2016) Díaz Trigo, M. & Boirin, L. 2016, Astronomische Nachrichten, 337, 368
- Díaz Trigo et al. (2012) Díaz Trigo, M., Sidoli, L., Boirin, L., & Parmar, A. N. 2012, A&A, 543, A50
- Dubner et al. (1998) Dubner, G. M., Holdaway, M., Goss, W. M., & Mirabel, I. F. 1998, AJ, 116, 1842
- Eikenberry et al. (1998) Eikenberry, S. S., Matthews, K., Murphy, T. W., J., et al. 1998, ApJ, 506, L31
- Emonts et al. (2019) Emonts, B., Raba, R., Moellenbrock, G., et al. 2019, arXiv e-prints, arXiv:1912.09437
- Fabian (2012) Fabian, A. C. 2012, ARA&A, 50, 455
- Fender & Muñoz-Darias (2016) Fender, R. & Muñoz-Darias, T. 2016, The Balance of Power: Accretion and Feedback in Stellar Mass Black Holes, ed. F. Haardt, V. Gorini, U. Moschella, A. Treves, & M. Colpi, Vol. 905, 65
- Fender et al. (1999) Fender, R. P., Garrington, S. T., McKay, D. J., et al. 1999, MNRAS, 304, 865
- Fender et al. (2000) Fender, R. P., Pooley, G. G., Durouchoux, P., Tilanus, R. P. J., & Brocksopp, C. 2000, MNRAS, 312, 853
- Fleischman (1985) Fleischman, J. R. 1985, A&A, 153, 106
- Fomalont et al. (2001) Fomalont, E. B., Geldzahler, B. J., & Bradshaw, C. F. 2001, ApJ, 558, 283
- Frank et al. (1992) Frank, J., King, A. R., & Raine, D. J. 1992, Accretion power in astrophysics (Cambridge and New York, Cambridge University Press)
- Gallo et al. (2005) Gallo, E., Fender, R., Kaiser, C., et al. 2005, Nature, 436, 819
- Garcia et al. (1988) Garcia, M. R., Grindlay, J. E., Molnar, L. A., et al. 1988, ApJ, 328, 552
- Gies et al. (2008) Gies, D. R., Bolton, C. T., Blake, R. M., et al. 2008, ApJ, 678, 1237
- Gies et al. (2003) Gies, D. R., Bolton, C. T., Thomson, J. R., et al. 2003, ApJ, 583, 424
- Gottlieb et al. (1975) Gottlieb, E. W., Wright, E. L., & Liller, W. 1975, ApJ, 195, L33
- Greiner et al. (2001a) Greiner, J., Cuby, J. G., & McCaughrean, M. J. 2001a, Nature, 414, 522
- Greiner et al. (2001b) Greiner, J., Cuby, J. G., McCaughrean, M. J., Castro-Tirado, A. J., & Mennickent, R. E. 2001b, A&A, 373, L37
- Grinberg et al. (2013) Grinberg, V., Hell, N., Pottschmidt, K., et al. 2013, A&A, 554, A88
- Grindlay & Seaquist (1986) Grindlay, J. E. & Seaquist, E. R. 1986, ApJ, 310, 172
- Haid et al. (2018) Haid, S., Walch, S., Seifried, D., et al. 2018, MNRAS, 478, 4799
- Hasinger & van der Klis (1989) Hasinger, G. & van der Klis, M. 1989, A&A, 225, 79
- Haynes et al. (1986) Haynes, R. F., Komesaroff, M. M., Little, A. G., et al. 1986, Nature, 324, 233
- Heinz (2002) Heinz, S. 2002, A&A, 388, L40
- Heinz et al. (2015) Heinz, S., Burton, M., Braiding, C., et al. 2015, ApJ, 806, 265
- Heinz et al. (2007) Heinz, S., Schulz, N. S., Brandt, W. N., & Galloway, D. K. 2007, ApJ, 663, L93
- Heinz et al. (2013) Heinz, S., Sell, P., Fender, R. P., et al. 2013, ApJ, 779, 171
- Hirsch et al. (2019) Hirsch, M., Hell, N., Grinberg, V., et al. 2019, A&A, 626, A64
- Hjellming et al. (1990) Hjellming, R. M., Stewart, R. T., White, G. L., et al. 1990, ApJ, 365, 681
- Holt et al. (1979) Holt, S. S., Kaluzienski, L. J., Boldt, E. A., & Serlemitsos, P. J. 1979, ApJ, 233, 344
- Homan et al. (2016) Homan, J., Neilsen, J., Allen, J. L., et al. 2016, ApJ, 830, L5
- Homan et al. (2004) Homan, J., Wijnands, R., Rupen, M. P., et al. 2004, A&A, 418, 255
- Humphreys et al. (2013) Humphreys, E. M. L., Reid, M. J., Moran, J. M., Greenhill, L. J., & Argon, A. L. 2013, ApJ, 775, 13
- Iaria et al. (2014) Iaria, R., Di Salvo, T., Burderi, L., et al. 2014, A&A, 561, A99
- Johnston et al. (2016) Johnston, H. M., Soria, R., & Gibson, J. 2016, MNRAS, 456, 347
- Jonker et al. (2007) Jonker, P. G., Nelemans, G., & Bassa, C. G. 2007, MNRAS, 374, 999
- Kaluzienski et al. (1976) Kaluzienski, L. J., Holt, S. S., Boldt, E. A., & Serlemitsos, P. J. 1976, ApJ, 208, L71
- King et al. (2013) King, A. L., Miller, J. M., Raymond, J., et al. 2013, ApJ, 762, 103
- Klein-Wolt et al. (2002) Klein-Wolt, M., Fender, R. P., Pooley, G. G., et al. 2002, MNRAS, 331, 745
- Kotani et al. (2000) Kotani, T., Ebisawa, K., Dotani, T., et al. 2000, ApJ, 539, 413
- Kubota et al. (2007) Kubota, A., Dotani, T., Cottam, J., et al. 2007, PASJ, 59, 185
- Lee et al. (2002) Lee, J. C., Reynolds, C. S., Remillard, R., et al. 2002, ApJ, 567, 1102
- Li et al. (2015) Li, J., Wang, J., Zhu, Q., Zhang, J., & Li, D. 2015, ApJ, 802, 40
- Linares et al. (2010) Linares, M., Watts, A., Altamirano, D., et al. 2010, ApJ, 719, L84
- Madej et al. (2014) Madej, O. K., Jonker, P. G., Díaz Trigo, M., & Miškovičová, I. 2014, MNRAS, 438, 145
- Maiolino et al. (2017) Maiolino, R., Russell, H. R., Fabian, A. C., et al. 2017, Nature, 544, 202
- Marton et al. (2019) Marton, G., Abraham, P., Szegedi-Elek, E., et al. 2019, VizieR Online Data Catalog, II/360
- Mata Sanchez et al. (2015) Mata Sanchez, D., Munoz-Darias, T., Casares, J., et al. 2015, MNRAS, 449, L1
- Matsuba et al. (1995) Matsuba, E., Dotani, T., Mitsuda, K., et al. 1995, PASJ, 47, 575
- McNamara & Nulsen (2007) McNamara, B. R. & Nulsen, P. E. J. 2007, ARA&A, 45, 117
- Miller et al. (2006) Miller, J. M., Raymond, J., Fabian, A., et al. 2006, Nature, 441, 953
- Miller-Jones et al. (2008) Miller-Jones, J., Kaiser, C., Maccarone, T., et al. 2008, in American Institute of Physics Conference Series, Vol. 1010, A Population Explosion: The Nature & Evolution of X-ray Binaries in Diverse Environments, ed. R. M. Bandyopadhyay, S. Wachter, D. Gelino, & C. R. Gelino, 50–56
- Miller-Jones et al. (2021) Miller-Jones, J. C. A., Bahramian, A., Orosz, J. A., et al. 2021, arXiv e-prints, arXiv:2102.09091
- Miller-Jones et al. (2012) Miller-Jones, J. C. A., Moin, A., Tingay, S. J., et al. 2012, MNRAS, 419, L49
- Miller-Jones et al. (2007) Miller-Jones, J. C. A., Rupen, M. P., Fender, R. P., et al. 2007, MNRAS, 375, 1087
- Mirabel & Rodrigues (2003) Mirabel, I. F. & Rodrigues, I. 2003, Science, 300, 1119
- Mirabel & Rodriguez (1994) Mirabel, I. F. & Rodriguez, L. F. 1994, Nature, 371, 46
- Motta & Fender (2019) Motta, S. E. & Fender, R. P. 2019, MNRAS, 483, 3686
- Muñoz-Darias et al. (2016) Muñoz-Darias, T., Casares, J., Mata Sánchez, D., et al. 2016, Nature, 534, 75
- Muller et al. (2008) Muller, S., Dinh-V-Trung, He, J.-H., & Lim, J. 2008, ApJ, 684, L33
- Muller et al. (2007) Muller, S., Dinh-V-Trung, Lim, J., et al. 2007, ApJ, 656, 1109
- Murdin et al. (1980) Murdin, P., Jauncey, D. L., Haynes, R. F., et al. 1980, A&A, 87, 292
- Neilsen & Lee (2009) Neilsen, J. & Lee, J. C. 2009, Nature, 458, 481
- Neilsen et al. (2011) Neilsen, J., Remillard, R. A., & Lee, J. C. 2011, ApJ, 737, 69
- Nicolson (2007) Nicolson, G. D. 2007, The Astronomer’s Telegram, 985, 1
- Nicolson et al. (1980) Nicolson, G. D., Glass, I. S., & Feast, M. W. 1980, MNRAS, 191, 293
- Nowak et al. (2011) Nowak, M. A., Hanke, M., Trowbridge, S. N., et al. 2011, ApJ, 728, 13
- Öberg et al. (2014) Öberg, K. I., Fayolle, E. C., Reiter, J. B., & Cyganowski, C. 2014, Faraday Discussions, 168, 81
- Orosz et al. (2011) Orosz, J. A., McClintock, J. E., Aufdenberg, J. P., et al. 2011, ApJ, 742, 84
- Pakull et al. (2010) Pakull, M. W., Soria, R., & Motch, C. 2010, Nature, 466, 209
- Peck et al. (2003) Peck, A. B., Henkel, C., Ulvestad, J. S., et al. 2003, ApJ, 590, 149
- Rahoui et al. (2011) Rahoui, F., Lee, J. C., Heinz, S., et al. 2011, ApJ, 736, 63
- Reid et al. (2014) Reid, M. J., McClintock, J. E., Steiner, J. F., et al. 2014, ApJ, 796, 2
- Rey-Raposo et al. (2017) Rey-Raposo, R., Dobbs, C., Agertz, O., & Alig, C. 2017, MNRAS, 464, 3536
- Richings & Faucher-Giguère (2018) Richings, A. J. & Faucher-Giguère, C.-A. 2018, MNRAS, 474, 3673
- Rodriguez & Mirabel (1998) Rodriguez, L. F. & Mirabel, I. F. 1998, A&A, 340, L47
- Russell et al. (2007) Russell, D. M., Fender, R. P., Gallo, E., & Kaiser, C. R. 2007, MNRAS, 376, 1341
- Schulz & Brandt (2002) Schulz, N. S. & Brandt, W. N. 2002, ApJ, 572, 971
- Schulz et al. (2020) Schulz, N. S., Kallman, T. E., Heinz, S., et al. 2020, ApJ, 891, 150
- Sell et al. (2010) Sell, P. H., Heinz, S., Calvelo, D. E., et al. 2010, ApJ, 719, L194
- Sell et al. (2015) Sell, P. H., Heinz, S., Richards, E., et al. 2015, MNRAS, 446, 3579
- Sidoli et al. (2002) Sidoli, L., Parmar, A. N., Oosterbroek, T., & Lumb, D. 2002, A&A, 385, 940
- Steeghs & Casares (2002) Steeghs, D. & Casares, J. 2002, ApJ, 568, 273
- Steeghs et al. (2013) Steeghs, D., McClintock, J. E., Parsons, S. G., et al. 2013, ApJ, 768, 185
- Stewart et al. (1993) Stewart, R. T., Caswell, J. L., Haynes, R. F., & Nelson, G. J. 1993, MNRAS, 261, 593
- Stirling et al. (2001) Stirling, A. M., Spencer, R. E., de la Force, C. J., et al. 2001, MNRAS, 327, 1273
- Tennant et al. (1986) Tennant, A. F., Fabian, A. C., & Shafer, R. A. 1986, MNRAS, 221, 27P
- Tetarenko et al. (2018) Tetarenko, A. J., Freeman, P., Rosolowsky, E. W., Miller-Jones, J. C. A., & Sivakoff, G. R. 2018, MNRAS, 475, 448
- Tetarenko et al. (2020) Tetarenko, A. J., Rosolowsky, E. W., Miller-Jones, J. C. A., & Sivakoff, G. R. 2020, MNRAS, 497, 3504
- Ueda et al. (2001) Ueda, Y., Asai, K., Yamaoka, K., Dotani, T., & Inoue, H. 2001, ApJ, 556, L87
- Ueda et al. (2004) Ueda, Y., Murakami, H., Yamaoka, K., Dotani, T., & Ebisawa, K. 2004, ApJ, 609, 325
- Ueda et al. (2009) Ueda, Y., Yamaoka, K., & Remillard, R. 2009, ApJ, 695, 888
- Vlemmings et al. (2011) Vlemmings, W. H. T., Humphreys, E. M. L., & Franco-Hernández, R. 2011, ApJ, 728, 149
- Walborn (1973) Walborn, N. R. 1973, ApJ, 179, L123
- Webster & Murdin (1972) Webster, B. L. & Murdin, P. 1972, Nature, 235, 37
- Zapata et al. (2009) Zapata, L. A., Menten, K., Reid, M., & Beuther, H. 2009, ApJ, 691, 332
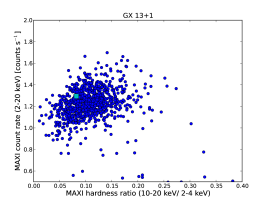
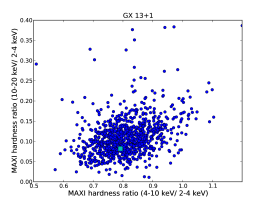
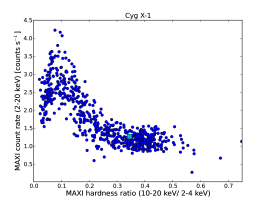
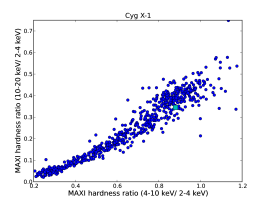
Appendix A Hardness-intensity diagrams
Figure 11 shows the hardness-intensity and colour-colour diagrams from MAXI data used to determine the accretion states of Sco X1, GRS 1915+105, and Cyg X1 at the time of the ALMA observations. Based on the colour-colour diagrams (and previous state classifications of Z sources based on these diagrams; e.g. Hasinger & van der Klis 1989), we infer that the Sco X1 observation was performed in the flaring branch. With only the MAXI data we cannot infer a state classification for GX 13+1 since no branches are distinguishable in the respective diagrams, as in, for example, Homan et al. (2016). For Cyg X1 we instead used the hardness-intensity diagram and followed the classification from Grinberg et al. (2013, see their Fig. 7) to infer that it was in a spectrally hard state. Finally, for GRS 1915+105 we used the colour-colour diagram and the classification from Belloni et al. (2000, see their Fig. 8) and classify the ALMA observation as occurring during the A or B states.