Drop impact on superheated surfaces: short-time dynamics and transition to contact
Abstract
When a volatile drop impacts on a superheated solid, air drainage and vapor generation conspire to create an intermediate gas layer that delays or even prevents contact between the liquid and the solid. In this article, we use high-speed synchronized reflection interference and total internal reflection imaging to measure the short-time dynamics of the intermediate gas film and to probe the transition between levitation and contact. We observe that the substrate temperature strongly affects the vertical position of the liquid-gas interface and that the dynamic Leidenfrost transition is influenced by both air and vapor drainage (i.e, gas drainage), and evaporation, the later giving rise to hitherto unreported vertical oscillations of the gas film that can trigger liquid-solid contact. We first derive scaling relations for the height of the gas film trapped under the drop’s centerline, called the dimple height, and the minimum film thickness at short times. The former is set by a competition between gas drainage and liquid inertia, similarly as for isothermal impacts, while the later strongly depends on the vapor production. The gas pressure, at the location where the minimum thickness is reached, is determined by liquid inertia and vapor production and ultimately balanced by the increasing interfacial curvature, determining the minimum thickness. We show that, in the low impact velocity limit, the transient stability of the draining gas film remarkably makes dynamic levitation less demanding than static levitation. We characterise the vertical gas film oscillations by measuring their frequency and monitoring their occurrence in the parameter space spanned by surface temperature and impact velocity. Finally, we model the occurrence of these oscillations and account for their frequency through an hydrodynamic mechanism.
keywords:
1 Introduction
The impact of a liquid drop on a solid target has been extensively studied (Yarin, 2006; Josserand & Thoroddsen, 2016; Yarin et al., 2017) since Worthington’s pioneering observations (Worthington, 1877). The dynamics of the spreading liquid can now be described using analytical expressions once the drop touches the substrate (Gordillo et al., 2019). The initial stage of spreading is governed by inertia so that the wetted radius follows Wagner’s theorem (Riboux & Gordillo, 2014). Later, viscous and capillary forces oppose the outwards motion and ultimately balance the initial inertia as the maximal radius is reached (Laan et al., 2014; Wildeman et al., 2016). Yet, before spreading starts, the air trapped between the falling drop and the substrate must drain for contact to occur. This phase, during which the drop levitates on an air cushion, can affect the outcome of impact as revealed by the dramatic influence of ambient pressure on splashing (Xu et al., 2005; Driscoll & Nagel, 2011). This levitation phase can even dominate and last during the whole impact for low impact velocities (Kolinski et al., 2014a). This holds even more when the substrate is heated far above the boiling point of the liquid, as then the impacting drop is separated from the substrate by a cushion of its own vapor, a situation called the dynamic Leidenfrost effect (Tran et al., 2012).
The Leidenfrost effect (Leidenfrost, 1756; Quéré, 2013) has received a lot of attention owing to its relevance in heat transfer applications such as spray cooling (Kim, 2007; Breitenbach et al., 2018), the cooling of fuel rods in case of a nuclear incident (Hamdan et al., 2015), or spray combustion (Moreira et al., 2010). As the presence of gas between the liquid and the solid dramatically reduces the heat flux, phase diagrams distinguishing levitation and contact behaviors have been obtained for many liquid-solid combinations based on side-view imaging (Yao & Cai, 1988; Bernardin & Mudawar, 2004) and, more recently, on the direct bottom-view observation of contact (Tran et al., 2012; Staat et al., 2015; Shirota et al., 2016). Understanding the dynamics of the air and vapor film (together referred to as gas from now on) trapped at impact on superheated substrates is thus key to predict the heat transfer.
When the liquid and the solid are both at ambient temperature, the drainage of the air film trapped between the falling drop and the substrate has been thoroughly investigated. In this situation, that we call an isothermal impact, the pressure buildup under the drop results in the formation of a dimple whose edge is marked by a localized region of high curvature, called the neck (Mandre et al., 2009; Hicks & Purvis, 2010; Mani et al., 2010; Bouwhuis et al., 2012). This region eventually moves downwards, leading either to the wetting of the substrate and the entrapment of an air bubble (Chandra & Avedisian, 1991; Thoroddsen et al., 2005), or, for low enough impact velocities and sufficiently smooth substrates, to the creation of a relatively flat air film that can enable drop bouncing (Kolinski et al., 2014a). In the later case, the dimple and neck have a fixed radial position and height as the liquid spreads (Kolinski et al., 2012, 2014b). For impacts on superheated substrates, however, it is yet unclear how evaporation contributes to the evolution of the gas film, although it is already known that the dimple and neck structure also appears (Shirota et al., 2016).
In this article, we aim to disentangle the effects of gas drainage and vapor generation on the short-time drop impact dynamics to provide insight into the transition from drop levitation to contact. In order to do so, we probed the dynamics of the gas layer squeezed between the liquid and the substrate at impact and monitored the failure of the gas film. We observed hitherto unreported vertical oscillations of the drop bottom interface, specific to superheated conditions, that can trigger contact events. We thus seek to understand the role of these oscillations on the transition towards the dynamic Leidenfrost effect. The experimental setup and procedure is detailed in §2. In §3, we discuss the evolution of the film shape at short-time and the influence of surface temperature on its characteristic features. We also report the measurements of the minimum thickness at short times and provide a model to account for them. In §4, the transition from levitation to contact is discussed, based on identifying the type of collapse of the gas layer in the parameter space spanned by the surface temperature and the impact velocity. Finally, we model the vertical oscillations of the drop’s base and discuss their role in the transition towards the dynamic Leidenfrost effect. The paper ends with conclusions and an outlook (§5).
2 Experimental setup and procedure
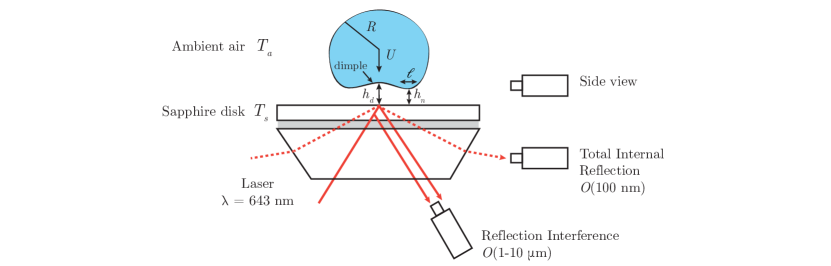
Our experiments, sketched in figure 1, consist in impacting ethanol drops on an optically smooth sapphire disk. We choose this liquid-solid combination as (i) it allows us to neglect vapor cooling effects during impact and (ii) the excellent thermal conductivity of sapphire ( W/K/m) approximates isothermal substrate conditions (Van Limbeek et al., 2016, 2017). The sapphire substrate is coupled to a glass dove prism using silicone oil and mounted in an aluminium heating block. The substrate temperature is set to a fixed value between ∘C and ∘C using a propoportional-integral-derivative controller, and measured with an external surface probe. From this, we deduce the superheat , where ∘C is the boiling temperature of ethanol. Drops with radius mm are released from a calibrated needle, whose height is adjusted to obtain impact velocities ranging from 0.3 m/s to 1.2 m/s. The chosen drop radii and impact velocities correspond to a Reynolds number and an Ohnesorge number , with typical values of 500 and 0.01, respectively, i.e initially viscous effects can be neglected compared to inertia and capillarity. The Weber number , ranging from 3 to 50, further indicates that experiments are conducted in the inertial regime. Table 1 gives an overview of the properties of the liquid and of the two components of the gas phase: air (with ambient temperature ) and ethanol vapor. Note that the material properties of the fluids are temperature dependant and the temperature at which they should be evaluated will be discussed throughout the manuscript.
| Description | Ethanol (l) | Ethanol (v) | Air | |
| Temperature (∘C) | 20 | 80 | 20 | |
| density (kg/m3) | 789 | 1.63 | 1.2 | |
| viscosity (mPa.s) | 1.2 | |||
| specific heat (kJ/kg/K) | 2.4 | 1.8 | 1.0 | |
| thermal conductivity (W/K/m) | 0.171 | 0.023 | 0.026 | |
| thermal diffusivity (m2/s) | ||||
| latent heat (kJ/kg) | 853 | |||
| surface tension (N/m) | 0.022 |
We study the impact dynamics using three synchronized high-speed cameras to obtain side views and interferometric measurements of the gas film (figure 1). We record side views at 20 000 frames per second (Photron Fastcam SA1.1) from which we determine the drop radius and the impact velocity . We measure the gas film thickness profile by coupling two interferometry techniques that have been successfully applied in the context of drop impact: single-wavelength reflection interference (Driscoll & Nagel, 2011; Li & Thoroddsen, 2015; Staat et al., 2015) and total internal reflection imaging (Kolinski et al., 2012; Shirota et al., 2016). Simultaneously using these two techniques allows us to realise the benefits of both of them: reflection interference (RI) enables relative thickness measurements of thin films up to tens of micrometers while total internal reflection imaging (TIR) provides an absolute information on the evanescent lengthscale on the order of 100 nm. The combination of both techniques gives access to the absolute thickness of the entire profile of the gas layer during drop impact.
We implement these two techniques simultaneously by expanding a diode laser spot with wavelength nm into a collimated beam that we split into two optical paths leading to the substrate. The beam used for RI imaging is introduced through the bottom face of the dove prism at a slight angle to only observe interferences generated by reflections at the top of the substrate and the bottom of the drop. The interference patterns are composed of dark and bright fringes that we image using a long distance microscope (Navitar telecentric 12x) mounted on a high-speed camera (Photron SA-Z) to obtain a typical resolution of 8 m/px at a frame rate of 700 kHz. The TIR beam is p-polarized and introduced through one of the sloped faces of the prism so that it undergoes total internal reflection at the top of the substrate. The interaction of the emitted evanescent wave and the impinging drop results in a decrease of the reflected intensity that enables the measurement of the film thickness. When the drop touches the surface, light transmits through the liquid creating a sharp change in grayscale intensity that allows to distinguish wetted from dry areas. The resulting images are recorded at 225000 frames per second (Photron Nova S12) with a long distance microscope with resolution m/px. The details of image processing and calibration of interferometric measurements are further discussed in appendix A.
3 Short-time dynamics of the gas film
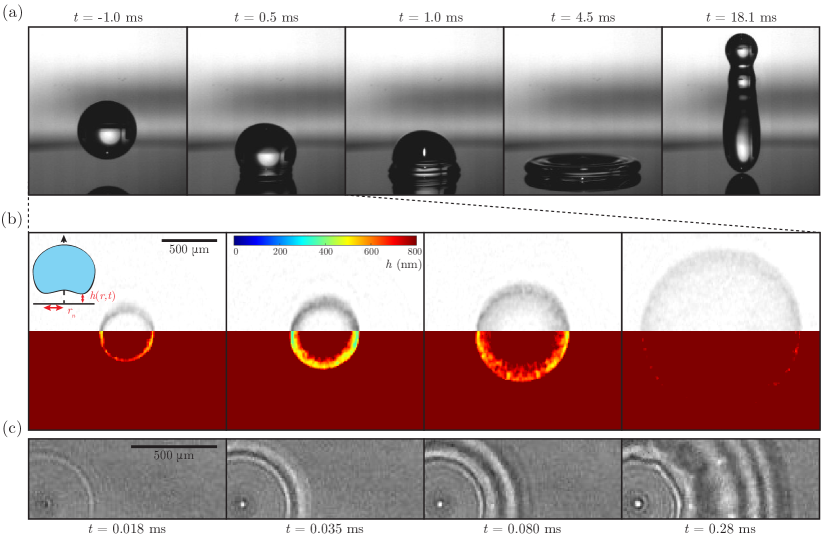
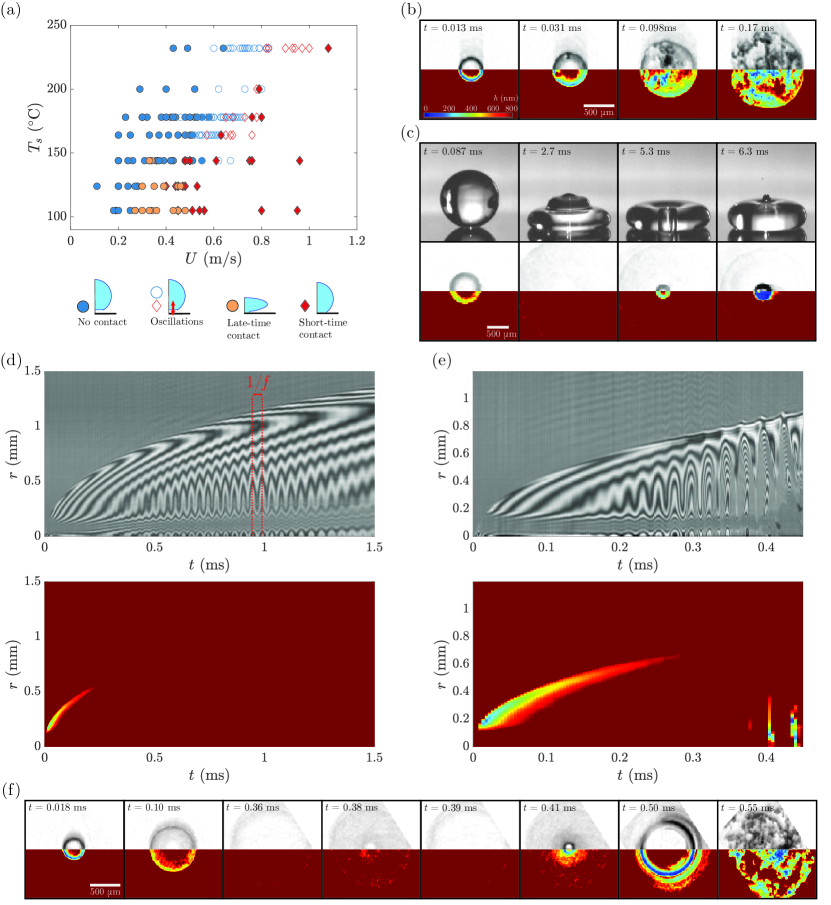
Side views of the impact event of an ethanol drop in the dynamic Leidenfrost regime are presented in figure 2a ( m/s, and ∘C). The impinging liquid spreads, recoils and finally detaches from the substrate after a time on the order of 10 ms. This time, that we call the rebound time, is set by the inertio-capillary timescale (Richard et al., 2002; Biance et al., 2006). Here we define the origin of time () as the time of the first frame where the drop enters within the evanescent lengthscale. We focus on the dynamics of the gas film squeezed between the liquid and the hot substrate at the first instant of impact, that is for where is the inertial timescale. For a drop with radius mm impacting at m/s, this inertial time is ms and therefore much shorter than the inertio-capillary time ms.
3.1 Phenomenology
3.1.1 Sequence of events
In figure 2b and c, we present synchronized TIR (figure 2b) and RI (figure 2c) images recorded during the first instants of the impact presented in figure 2a. The TIR snapshots combine the original grayscale image and the calculated height field colormap. The liquid first enters within the evanescent lengthscale as a faint ring ( ms). This ring expands as its height decreases, indicating that the liquid comes closer to the substrate as it starts spreading ( ms). The full film profile can be inferred by combining the information extracted from TIR with the axisymmetric interference patterns observed in RI images. The brightest fringes are localized at the same radial position as the TIR ring evidencing the region closest to the substrate which is called the neck. The liquid-air interface displays a dimple shape, sketched in the inset, as already observed in both isothermal and superheated conditions (Shirota et al., 2016). Eventually, the whole bottom interface of the drop moves away from the substrate and escapes from the TIR measurement range ( ms) while we continue to observe the spreading liquid as the RI fringe pattern remains visible.
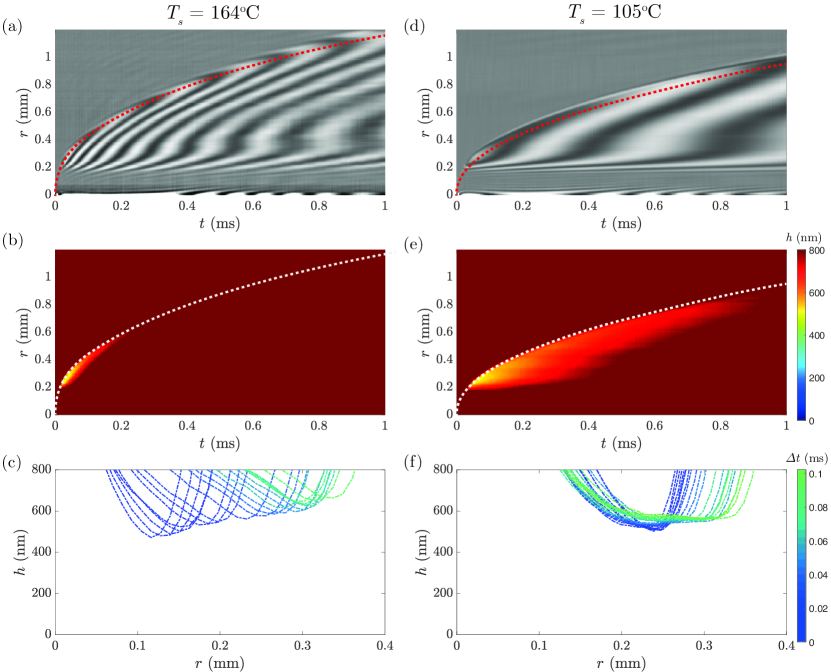
Combining TIR and RI, we are able to visualize the dynamics of the whole gas layer and to compare them with their isothermal counterpart. We azimuthally average each RI and TIR snapshot and stack the one-dimensional information obtained at each instant in space-time two-dimensional graphs (figures 3a and 3b). From this representation, we are able to distinguish three phases in the early evolution of the squeezed film:
-
•
The initial approach during which the liquid-gas interface first deforms, creating the central dimple bordered by a region of high curvature (see the first profile of the liquid-gas interface, ms, in figure 3c). This region, which is called the neck region, moves down and outwards until the minimum thickness is reached at the neck, here at ms, marking the end of this first phase. During this initial phase, the motion of the liquid-gas interface is qualitatively similar to that reported in the absence of substrate heating (Mandre et al., 2009; Hicks & Purvis, 2010; Mani et al., 2010; Bouwhuis et al., 2012).
-
•
A second phase, for ms ms, in which the center of the dimple and the neck have markedly different vertical motion. The thickness at the center () is constant while it increases at the neck, as shown by the TIR data (figure 3b) and by the multiple crossings between the dashed red line, materializing the neck location, and iso-height lines (i.e fringes) in figure 3a. Here, the radial and updwards motion of the neck allows to distinguish the superheated from the isothermal case where the neck has a fixed radial position and height (Kolinski et al., 2012, 2014b).
-
•
In the final phase ( ms), both the thickness at the center and at the neck increase as the liquid keeps spreading. This global film thickness increase, which occurs at different instants at the neck and at the dimple, further differentiates the hot and the cold case and is characteristic of the influence of vapor generation.
3.1.2 Recovering the isothermal behavior
We observe the transition from the superheated to the isothermal behavior by performing impacts on substrates heated just above the boiling temperature of ethanol. For similar impact parameters as in figure 2a ( m/s, ) but with ∘C, the liquid-gas interface transiently forms a wide flat region that is closer to the substrate (figure 3e), while the dimple shape remains frozen as shown by the horizontal fringes in figure 3d. The collapse of the successive height profiles at the neck region plotted in figure 3f illustrates the transition from a neck sweeping motion (figure 3c) to a quasi-invariant film shape with decreasing superheat. The growth of the thickness at the neck and, later, at the center indicates that vapor is still generated and distinguishes this case from the isothermal impact.
We now seek to quantitatively characterize the effect of the superheat on the gas layer. To do so, we describe the neck motion and measure the film thickness at the neck and at the center, when there is no liquid-solid contact at short-time, for different superheats and impact velocities.
3.2 Neck dynamics
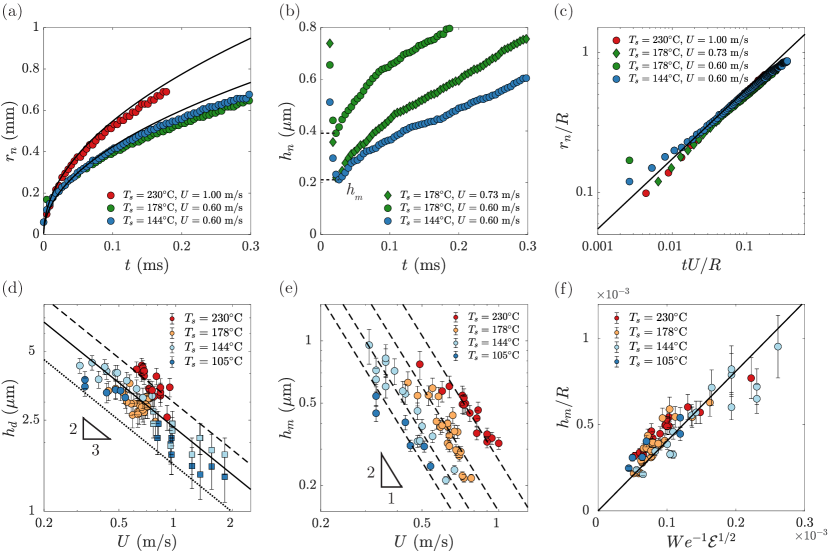
We track the azimuthally averaged neck radius (figure 4a) and distance to the substrate (i.e neck height) (figure 4b) for varying impact velocities and substrate temperatures at short times. As the neck spreads, its height decreases, with a velocity on the order of the impact velocity, until it reaches a minimum value that corresponds to the global minimum of the gas layer thickness. Later, the neck height grows at a slower rate. The evolution of seems to be only affected by the impact velocity. In contrast, the neck height is strongly influenced also by the substrate temperature . This behavior suggests that the Wagner prediction, , shown to be accurate for the radius of the liquid-solid contact by Riboux & Gordillo (2014); Gordillo et al. (2019) on cold surfaces and by Shirota et al. (2016) on superheated substrates, could also be relevant in the levitated regime. We indeed observe a good agreement of that prediction with the data by plotting the normalized neck radius as a function of the dimensionless time for three different impact velocities and superheats (figure 4c). The data collapse, in quantitative agreement with Wagner’s prediction represented by the solid line. We conclude that vapor generation strongly affects the vertical motion of the liquid-gas interface at the neck, but has negligible influence on its horizontal dynamics.
3.3 Thickness at the dimple and the neck
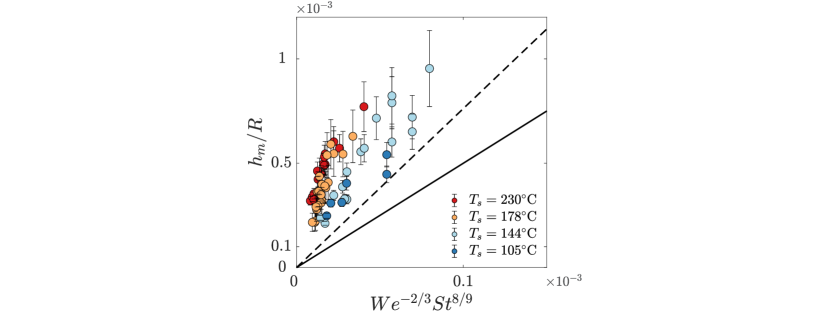
We now focus on the effect of on the thickness of the gas film. In figure 4d, we show the dimple height measured at the same instant as the minimum thickness is reached and, for the two lowest substrate temperatures, also at the instant when contact occurs at the neck (square markers), enabling us to probe velocities up to 2 m/s. The dimple height is on the order of 1 to 5 m, and it decreases with increasing impact velocity. We compare our measurements to the scaling relation for derived in the absence of heating, , where is the Stokes number (Mandre et al., 2009; Mani et al., 2010; Bouwhuis et al., 2012). The data are compatible with the isothermal scaling: for a fixed superheat and drop radius , the dimple height decrease with increasing impact velocity is consistent with a power-law behavior with an exponent . Yet, we observe a weak influence of the substrate temperature on that has a non-monotonic dependance with increasing superheat.
In figure 4e, we show the minimum distance separating the drop from the substrate as a function of the control parameters and . This minimum distance is on the order of a few hundred nanometers, and strongly increases with the superheat, in contrast to the weak non-monotonic influence observed for . For example, increasing from 178 to 230∘C leads to a doubling of the thickness at the neck for m/s. For a fixed substrate temperature and drop radius, the data suggest a power-law decrease of with the impact velocity with an exponent . This exponent is close to that predicted for the minimum thickness at the neck in the isothermal case (Mandre et al., 2009; Mani et al., 2010), but the strong influence of evidences the role of evaporation and distinguishes this case from an impact on a substrate at ambient temperature .
3.4 Model for the initial approach
We now seek to model the initial approach, i.e, the evolution of the gas film until the minimum thickness is reached at the neck. Typically, this phase lasts until , a time much shorter than that associated with the purely inertial spreading that is valid up to . We build on the work of Mani et al. (2010), who treated the case of isothermal impacts, and extend it to take into account the effect of vapor production. Indeed, our measurements of the dimple thickness in superheated conditions show the same scaling relation with the Stokes number as for isothermal impacts, indicating that liquid inertia and viscous drainage are still the relevant mechanisms when the substrate is heated. Yet, the thickness at the neck strongly depends on the superheat, suggesting that, to describe the movement of the liquid-gas interface, one also needs to capture the influence of vapor generation.
For completeness, we reproduce the equations of motion for the liquid and for the gas film in the incompressible regime as already derived by Mani et al. (2010). Following them, we consider a two-dimensional geometry and make further simplifications as in the isothermal case: in the liquid, we neglect viscosity and non-linear inertia owing to, respectively, the large Reynolds number ( for the impact of a millimeter-sized drop at m/s) and the absence of velocity gradients within the drop before it interacts with the substrate. We also neglect the influence of surface tension, as for a typical impact the Weber number, , is considerably larger than unity. With these assumptions, we have potential flow in the liquid and the equation of motion reads:
| (1) |
where are the liquid velocity components in the (replacing in this 2D model) and directions, respectively, and is the liquid pressure. Projecting equation (1) in the vertical direction and using the kinematic boundary condition at the liquid-gas interface , we obtain at :
| (2) |
where, in the spirit of the boundary layer approximation (Prandtl, 1904), the term on the right-hand side can be neglected. Then, the vertical pressure gradient at the interface can be expressed as the Hilbert transform of the horizontal pressure gradient by taking advantage of the two-dimensional nature of the problem and the harmonic pressure field (Smith et al., 2003):
| (3) |
We now come to the description of the gas flow between the drop and the substrate. Here, the viscous lubrication approximation is justified as the gas film is thin () and the typical value of the Reynolds number is low in the gas phase ( = 0.05 for air at 20∘C). This approximation is valid when considering heating as the value of the Reynolds number is not significantly altered by the presence of ethanol vapor ( = 0.15 for ethanol vapor at ), nor by the dependance of the gas viscosity and density on temperature. With these assumptions, we obtain the lubrication equation:
| (4) |
where is a numerical coefficient which accounts for the choice of boundary condition at the liquid-gas interface. If the no-slip condition holds at the interface, . In constrast, if a zero tangential stress condition is chosen, (Guyon et al., 2012).
We now introduce an additional term in the lubrication equation to take into account the effect of evaporation. We consider that heat is transferred through the gas layer by conduction, similarly as in the static Leidenfrost situation, as this mechanism acts on a relevant timescale for impact, s, much shorter than the initial approach time. The energy input from the heated solid is used to heat liquid at the bottom interface from the ambient temperature to the boiling temperature , creating a thermal boundary layer with thickness , and to vaporize it. The Jakob number , which compares the sensible heat with the latent heat , is so that we consider the energetic cost coming from the latent heat to be dominant. With this assumption, which overestimates the vapor production, the evaporation rate per unit area, , is given by balancing the heat flux with the released latent heat , yielding . We thus obtain a modified lubrication equation:
| (5) |
where the term on the right hand side takes into account evaporation (Biance et al., 2003; Sobac et al., 2014).
3.4.1 Dimple height
Having obtained the governing equations for the liquid and the gas, we recall the dimple height scaling derived for isothermal impacts (Mani et al., 2010; Bouwhuis et al., 2012). It is obtained by balancing liquid inertia with viscous drainage in the squeezed gas film. The pressure in the liquid can be estimated from equation (2) or (3):
| (6) |
where is the radial extent of the dimple computed as the radius of a spherical cap with height . The gas pressure is deduced from the two-dimensional incompressible lubrication equation (4):
| (7) |
The dimple height is set when the liquid-gas interface first deforms, that is when the pressure in the liquid and in the gas become comparable:
| (8) |
where is the Stokes number. The solid line (figure 4d) represents equation (8) with taken as the viscosity of air at 20∘C and a prefactor of 2.8 extracted from the results of Bouwhuis et al. (2012) for the impact of ethanol drops on a substrate at room temperature. The isothermal scaling gives a correct order of magnitude of and recovers the velocity dependance in superheated conditions, confirming that the viscous drainage of the gas layer dominates vapor generation as suggested by the weak influence of substrate temperature on the dimple height in our experiments.
We propose to explain the observed influence of also through equation (8), although it does not explicitly involve temperature. Indeed, depends on temperature in two ways. (i) The viscosity of the air squeezed between the drop and the surface increases with , and (ii) as ethanol vapor is generated, the squeezed layer becomes a - possibly non-homogeneous - mixture of warm air and ethanol vapor, whose viscosity is lower than that of air at the same temperature. The interplay between these two antagonistic effects could be the cause of the non-monotic behavior of with . In figure 4d, we plot the scalings associated with each effect by taking as the viscosity of air at 230∘C (dashed line) and as the viscosity of ethanol vapor at the boiling point (dotted line): all measurements lie in between the two bounds.
3.4.2 Neck thickness
We next focus on the subsequent formation of the neck. Here, we extend the calculation of Mani et al. (2010) to incorporate the effect of evaporation, as our experimental observations show a strong influence of the substrate temperature on the thickness at the neck. We non-dimensionalize the governing equations (3) and (5) with the scales involved in the dimple formation, namely with the transformations:
| (9) |
where is the atmospheric pressure. Then, the equations of motion of the liquid and gas respectively become:
| (10) |
| (11) |
Here we have introduced two extra dimensionless quantities:
-
•
the ratio of the atmospheric pressure to the pressure build-up below the drop,
(12) -
•
and the evaporation number defined by Sobac et al. (2014) in the study of static Leidenfrost drops,
(13)
The pressure buildup in the gas film below the drop is a small correction to the atmospheric pressure. We thus consider the limit , and assume the following pressure expansion which we introduce in the governing equation:
| (14) |
where we used the pressure continuity at the interface (i.e ). As the motion of the liquid-gas interface is similar in the isothermal and the superheated cases, we adopt the same self-similar ansatz as in Mani et al. (2010) and construct a self-similar solution for the behavior in the neck region. The height and the pressure are given by:
| (15) |
where is the self-similarity variable, the neck’s radial coordinate, the pressure at , and the horizontal length scale associated with the high-curvature region, i.e the neck region. The time derivatives of the height or pressure field have three contributions coming respectively from the height’s temporal variation, the change of horizontal extent, and the radial motion of the neck:
| (16) |
Mani et al. (2010) hypothesized that the advection term is dominant and proposed that the neck region has a wave-like behavior: where is the neck radial velocity that is considered to be constant during the initial approach. This hypothesis seems to be at odds with our description of the neck dynamics using Wagner theory where evolves as . This apparent contradiction can be resolved by comparing the timescales associated with the initial approach phase and the motion captured by Wagner’s theory. Typically, the minimum thickness is reached for while Wagner’s theory is valid up to dimensionless times on the order of . This separation of timescales validates the use of a linear approximation for the neck position during the initial approach. Introducing the self-similar fields in equations (14) and using the wave like nature of the solution we obtain:
| (17) |
| (18) |
This set of equations is identical to that obtained by Mani et al. (2010) in the isothermal case except for the additional term on the right hand side of equation (18) that incorporates the influence of evaporation in the viscous lubrication flow.
If the liquid’s latent heat tends towards infinity or no superheat is applied, the evaporation number tends towards zero and the terms on the left hand side balance as in the isothermal case (see Mani et al. (2010) and appendix B). On the contrary, if evaporation plays a dominant role as suggested by the strong influence of superheat on the minimum thickness at the neck, the evaporation term balances the downwards motion of the interface (the first term in equation (18)). Equation (18) then gives a relationship between the horizontal and the vertical lengthscales:
| (19) |
that we combine with the scaling extracted from equation (17), , to obtain a relation between the pressure and height at the neck:
| (20) |
As decreases, the initially neglected Laplace pressure at the neck , that scales as , diverges quicker than the gas pressure at the neck , that evolves as . The hypothesis to neglect surface tension is no longer valid as the drop approaches the solid, similarly as for isothermal impacts. The balance between and the Laplace pressure sets the minimum film thickness :
| (21) |
Equation (21) predicts a power-law decrease of the minimum thickness as a function of impact velocity with an exponent when fixing the drop radius and superheat, consistent with the experimental findings displayed in figure 4e, where the dashed lines are guides to the eye with a slope of . This power-law decrease, , is close to that numerically predicted in the isothermal case where the minimum thickness follows a power-law with exponent (Mani et al., 2010). In appendix B, we derive this isothermal scaling and show that it does not allow to capture the effect of substrate temperature contrary to equation (21) which explicitly involves superheat. Testing the effect of the substrate temperature requires to take into account the temperature-dependant values of the gas viscosity, density and thermal conductivity as well as the value of the liquid surface tension. The viscous effects are introduced by the gas drainage associated to dimple formation. We thus use the temperature-dependant gas viscosity extracted from our measurements of the dimple height. The gas density and thermal conductivity, on the contrary, are related to vapor generation at the neck. Given the conduction timescale s, we consider steady heat transfer in the lubrication layer. The temperature profile is linear between the substrate temperature and the temperature at the liquid-gas interface where evaporation occurs, that is . We then evaluate the gas density and thermal conductivity at , assuming that the gas phase in the neck region is constituted of ethanol vapor only, and taking the surface tension at temperature . In figure 4f, we compare the normalized minimum thickness to the prediction of equation (21). The data for different superheat and impact velocity collapse on a line with prefactor , a satisfactory agreement considering the complexity of the system.
4 Transition from levitation to contact
As the minimum film thickness decreases with the impact velocity, one expects that for large enough impact velocities the liquid wets the solid at short times; an event that indeed occurs. In this section, we report our observations of the collapse of the gas film and discuss the transition from levitation to contact. We first map this transition in the parameter space spanned by surface temperature and impact velocity (figure 5a). We report three distinct types of breakdowns, namely a short-time contact (filled red diamonds), a late-time contact (filled orange dots), and a contact induced by oscillations of the gas film (open red diamonds). We now discuss the phenomenology of these contacts, starting from large velocities in figure 5a, and then going to lower and lower ones.
4.1 Phenomenology
4.1.1 Short-time contact
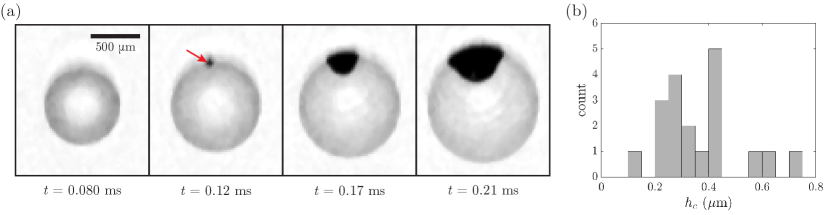
We begin by describing the prevalent mode of contact that occurs for all the probed substrate temperatures. Short-time contact is characterized by the occurrence of localized liquid-solid contact at the neck for (figure 5b, ms). After the contact nucleates, we observe partial wetting patterns typical of transition or contact boiling ( and ms), as previously described by Shirota et al. (2016). The impact velocity above which short-time contact is observed increases with the substrate temperature (filled red diamonds, figure 5a), as one would expect. As the impact velocity increases, the gas film thins and eventually contact occurs below a critical value given by defects present on the surface or by the attractive surface forces. For moderate impact velocities ( m/s), we have sufficient space and time resolution to determine the film height at the instant before the film collapses (see appendix C). The broad distribution of thicknesses at rupture with an average value of 0.36 m, much larger than the root mean square roughness of the sapphire substrate or the range of the attractive surface forces, suggests that defects or surface contamination play a dominant role in triggering liquid-solid contact, in agreement with data obtained for isothermal impact on glass substrates (De Ruiter et al., 2012; Kolinski et al., 2014a).
4.1.2 Late-time contact
Next, we discuss the late-time contact mode. It occurs for ∘C and at lower velocities than the short-time rupture discussed above (filled orange dots in figure 5a). In this situation, the drop spreads (figure 5c, and ms) and starts to recoil (figure 5c, ms) while floating on a gas cushion. Yet, at ms, we observe a decrease of the gas film thickness at the center of the drop that eventually results in wetting (figure 5c, ms). We deduce from the observation of synchronized side-views and TIR snapshots (figure 5c) that the rupture of the gas film coincides with the ejection of a liquid jet, originating from the collapse of the air cavity during the recoil stage of the rebound.
The formation of air cavities during impact is not specific to superheated substrates: their appearance has been linked to the oscillations of capillary waves excited at impact (Renardy et al., 2003). The collapse of these cavities produces the upwards ejection of a thin jet (Bartolo et al., 2006), reminiscent of the bursting of a bubble at a free surface (Boulton-Stone & Blake, 1993; Deike et al., 2018). Similarly, the ejection of a downwards jet during drop impact has been recently observed using x-ray imaging (Lee et al., 2020). Bartolo et al. (2006) showed that the jet ejection velocity can be one order of magnitude larger than the impact velocity, qualitatively explaining why the film rupture can occur at late times for lower impact speeds than at short times.
4.1.3 Contact induced by oscillations of the gas film
Finally, for ∘C, we observe vertical axisymmetric oscillations of the gas film squeezed below the impacting drop in the transitional regime between levitation and short-time contact (open symbols in figure 5a). Figure 5d shows a typical space-time RI plot of the initial gas layer dynamics for an impact ( m/s, , and ∘C) that lies in the transition region. Oscillations of the liquid-gas interface appear at the center of the gas film after the initial approach phase, when the dimple height starts to grow, and quickly perturb the whole bottom interface as their amplitude increase. The dynamics of the gas film after the minimum thickness is reached can be decomposed in two contributions that act on separate timescales. (i) A slow evolution, that corresponds to the dynamics of the gas film described in §3, with a characteristic time on the order of one millisecond and (ii) fast oscillations with a period on the order of a few tens of microseconds. The displacement of the iso-height lines associated with these fast oscillations occurs in phase: iso-height contours are crossed at the same time at every radial location (figure 5d). The oscillations of the drop bottom interface thus correspond to a vertical movement of the entire bottom interface and not to wave propagation. The amplitude of oscillations cannot grow indefinitely, but either saturates and decreases or finally induces film collapse. The former situation corresponds to the impact pictured in figure 5d, where the drop is in the levitated regime as further evidenced by the space-time TIR data (figure 5d) where the oscillations are invisible. The latter is illustrated in the space-time representations of figure 5e. As the amplitude increases, the fringe pattern disappears and the oscillating interface comes closer to the substrate and enters within the evanescent lengthscale once again (figure 5e). The TIR snapshots of figure 5f allow us to visualize the film collapse. Contact occurs along a ring (figure 5f, ms) of a much larger diameter than that of the dimple, and leads to the appearance of partial wetting patterns (figure 5f, ms).
4.2 A comment on the dynamic Leidenfrost temperature
Having described the phenomenology of the three collapse modes present in the phase diagram, we now discuss their influence on the dynamic Leidenfrost transition. Figure 5a contains two key pieces of information that give us new insight on the dynamic Leidenfrost temperature. (i) In the low-velocity limit, the static Leidenfrost temperature, that is approximately 150∘C for ethanol, does not act as a lower asymptote for the dynamic Leidenfrost temperature. The later can fall below the static value as a consequence of the transient stability of the gas cushion promoted by drainage. Thus, remarkably, dynamic levitation can be less demanding than static levitation. (ii) The gas film collapse can be driven by multiple mechanisms: namely short-time contact, late-time contact and contact induced by vertical oscillations of the gas film. Above 150∘C, the later collapse mechanism occurs for lower impact velocities than short-time contact, demonstrating that the transition towards the dynamic Leidenfrost effect is controlled by the presence of oscillations and not directly linked to a critical thickness reached during the initial approach phase. Predicting the dynamic Leidenfrost temperature thus requires a better understanding of each collapse mode, especially the oscillation induced contact mode, which we further investigate.
4.3 Oscillations: a minimal model
We now focus on understanding the appearance of oscillations in the squeezed gas layer, a feature specific to impacts on superheated surfaces unlike short or late-time contact. Our observations are reminiscent of the rapid vibrations that appear at the base of soft sublimable solids as contact occurs with a hot substrate during an impact (Waitukaitis et al., 2017, 2018). Oscillations can also spontaneously develop, without contact, at the bottom interface of drops in the static Leidenfrost state (Bouillant et al., 2020) or levitated by a steady airflow (Bouwhuis et al., 2013), and are responsible for the subsequent emergence of star shapes (Holter & Glasscock, 1952; Brunet & Snoeijer, 2011). For both levitation mechanisms, the appearance of vertical oscillations has been linked to the coupling of drop motion and flow in the thin gas film. Although the frequencies reported in these systems are on the order of Hz, two orders of magnitude smaller than those we measure at impact, our observations can be related to this hydrodynamic mechanism. (i) Oscillations grow as the dimple height starts to increase, that is when the vapor flow influences the whole liquid-gas interface. (ii) There is a temperature threshold below which vibrations do not appear, i.e, a sufficient gas flow is needed to make the interface unstable.
We thus build an hydrodynamic model that accounts for the motion of the bottom interface after the minimum thickness is reached at the neck by adapting the model of Bouillant et al. (2020) to the impact situation. We reproduce here for completeness the derivation of the equation coupling the drop motion and the lubrication flow created by vapor generation. We apply Newton’s second law to the vaporizing drop in the vertical direction. The momentum variation has two sources: the motion of the drop’s center of mass, , and the ejection of vapor, where is the drop mass, the vertical position of its center of mass and the vertical ejection velocity of vapor in the reference frame of the drop. We consider a simplified geometry, that of a gas layer with uniform thickness and constant radial extent , allowing us to derive the evaporation rate and the lubrication force analytically (Biance et al., 2003). Indeed, we obtain the evaporation rate by integrating the evaporation rate per unit area , derived in section 3.4, over the bottom interface of the drop assuming that evaporation predominantly occurs in the gas layer. The lubrication force is obtained by integrating the pressure , derived from the lubrication equation (5), over the gas layer: . We then write the momentum balance:
| (22) |
and express the ejection velocity as the sum of the absolute ejection velocity , derived from a mass balance, and of the interface velocity :
| (23) |
Equation (23) is identical to that obtained by Bouillant et al. (2020) in the static Leidenfrost situation. Relating the motion of the bottom interface of the drop with that of its center of mass is the critical step where the static and impact situations differ. At short times, i.e for , the drop is in the kinematic phase. The motion of the drop’s center of mass is approximately ballistic: , allowing to recover an equation for the vertical motion of the liquid-gas interface from equation (23) which we non-dimensionalize using the following transformations:
| (24) |
where we chose the dimple height as length scale as it gives the correct order of magnitude of the film thickness after the initial approach and denote as the characteristic time of the oscillations of the gas film. Plugging these non-dimensional variables in equation (23) allows us to identify the physical phenomena and time scales involved in the gas film dynamics:
| (25) |
where we introduced the damping coefficient , and the evaporation number already defined in equation (13). We further simplify equation (25) by noticing that the change of momentum linked to the absolute ejection velocity, that is proportional to , and the gravity term are orders of magnitude smaller than the contribution from the lubrication equation, that varies as . We can therefore approximate equation (25) by:
| (26) |
Equation (26) describes a nonlinear oscillator and allows us to identify the three time scales involved in the evolution of the gas film. We start by discussing the characteristic time linked to the term, that we denote . It is propoportional to , indicating that it can be understood as the characteristic time of a spring-mass system. This suggests that the lubrication force acts as a non-linear spring with time scale . Plugging in typical values, we obtain s, a value of the same order of magnitude as the period reported in figure 5d. Equation (26) thus gives us insight into the mechanism that can lead to vertical oscillations. If the bottom interface is perturbed towards the substrate, we compress the spring and the lubrication force increases. The interface is then repelled and it can either come back to its initial position or overshoot it. In the later situation, the lubrication pressure decreases and the interface moves down starting an oscillatory motion. The appearance of these vibrations is controlled by the damping term, whose time scale is proportional to . It is composed of a viscous damping term, with characteristic time , and an amplification term (i.e, negative damping), with timescale , associated to vapor ejection. Using typical numerical values at impact, we find that the viscous damping timescale s is one order of magnitude smaller than the oscillation period and that the amplification characteristic time s is larger than the inertio-capillary time . These findings are in contradiction with the observations reported in figure 5d where we observe fast oscillations modulated by a slower envelope that acts on a characteristic time on the order of 1 ms (figure 5d). Yet, the qualitative interplay of damping and amplification reproduces some of our observations. For a fixed thickness , viscous dissipation always dominates at low substrate temperatures, but, as the superheat increases (i.e, increases), the damping coefficient decreases, leading to the appearance of damped oscillations and finally to unbounded oscillations as the total damping term becomes negative. This behavior is in qualitative agreement with the existence of a temperature threshold, here ∘C, below which we do not observe oscillations (figure 5a). When fixing the superheat and investigating the role of the film thickness, viscous damping becomes dominant as decreases. This evolution contradicts our observations which show that with increasing impact velocity, that is decreasing film thickness, damped oscillations appear first, followed by unbounded ones (figure 5a). Our overestimation of viscous dissipation likely results from the assumption of a simplified, time-independent geometry. Similarly as for static Leidenfrost drops, we expect the detailed interplay of viscous dissipation and evaporation to depend on the film geometry (Sobac et al., 2014).
Although the minimal model does not correctly capture the detailed balance of viscous dissipation and evaporation, it provides a mechanism for oscillations that we can test against our observations. We assume in the following that damping and amplification act on a longer timescale than the fast oscillations, as observed experimentally. We introduce this hypothesis in equation (25) by choosing as characteristic time and taking the ratio as the fundamental small parameter of the problem:
| (27) |
We separate the fast oscillations from the slow envelope using a multiscale approach (Hinch, 1991). We define a fast time and a slow time and introduce the asymptotic expansion into equation (27). At leading order, we obtain an equation that describes the dynamics of the gas film on the fast timescale:
| (28) |
We now look for oscillations as a perturbation to the film thickness. We define a perturbation of the form where and is a solution of equation (28) that we assume to verify the initial conditions set at the end of the initial approach. At leading order, equation (28) becomes an harmonic oscillator:
| (29) |
which admits oscillatory solutions with pulsation . Physically, the film thickness after the initial approach varies between the constant dimple height and the increasing thickness at the neck . As the oscillations appear at the dimple, we choose as a typical scale for the initial film thickness. With this choice, we obtain the oscillation frequency:
| (30) |
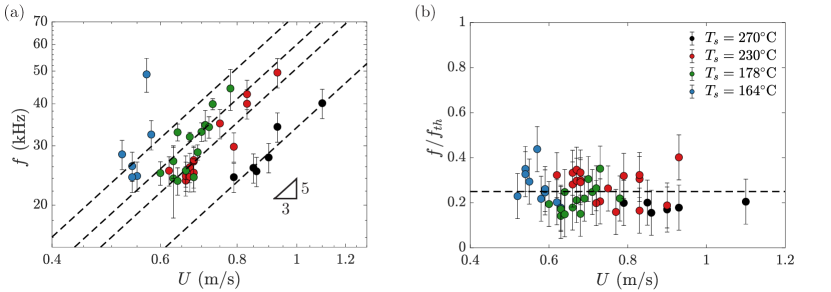
We now compare the observed value of to the prediction of equation (30). In figure 6a, we show the measured frequency , extracted from the space-time representation of the RI data (figure 5d), as a function of the impact velocity for various substrate temperatures . The frequency ranges from kHz to kHz. For a fixed superheat, increases with the impact velocity. This variation is in qualitative agreement with the prediction of equation (30) as, combining it with the scaling relation linking the dimple height to the Stokes number (equation (8)), we obtain a power-law relationship with exponent between and the impact velocity , or in dimensionless form, the Stokes number St:
| (31) |
This power-law behavior is consistent with the experimental variation displayed in figure 6a, where the dashed lines are drawn as guides to the eye with a slope . The effect of the substrate temperature is more subtle as it affects both the evaporation number and the dimple height . To quantitatively test the frequency prediction, we need to evaluate the temperature dependant gas properties. As the conduction timescale is on the order of s, we consider steady heat transfer in the vapor film. We evaluate the density, thermal conductivity and viscosity at and plot the measured frequency normalized by the prediction as a function of (figure 6b) where we measure and we use as the ratio of the liquid to the vapor viscosity is unusually low, , allowing slip at the liquid-gas interface. The data collapse on a constant when varying . The hydrodynamic model captures both the effect of superheat and impact velocity, but consistently overpredicts by a factor four the oscillation frequency. This discrepancy can be explained by the simplicity of the model that disregards the spatial variation of the gas film thickness and the temporal variation of its radial extent.
5 Conclusion and outlook
We have studied the impact of volatile drops on superheated substrates, revealing new features of the gas film dynamics and of the Leidenfrost transition. First, using high-speed interferometry, we disentangled the role of gas drainage and evaporation on the short-time dynamics of the gas layer. We found that the superheat noticeably affects the vertical position of the liquid-gas interface. The role of vapor production is dominant at the neck, close to the hot solid, where the gas pressure is set by a balance of inertia and evaporation. Ultimately, this pressure is balanced by the capillary pressure as the interfacial curvature increases, setting the minimum film thickness. On the contrary, the initial drop deformation, that is dimple formation, is determined by a balance of gas drainage and liquid inertia, similarly as for isothermal impacts. The subtle role of evaporation suggests limits to our description. Liquids with markedly different thermal properties could have different balances between drainage, evaporation and further effects. Particularly, liquids with low latent heat could extend the influence of vapor generation to dimple formation. Also, performing experiments in vacuum would provide insight into the limit where only evaporation contributes to levitation.
Second, we showed that the dynamic Leidenfrost transition is affected by both gas drainage and evaporation. (i) The transient stability of the draining gas film can enable drop rebound, remarkably resulting in a dynamic Leidenfrost temperature lower than its static value in the low impact velocity limit. (ii) We found a hitherto unreported collapse mode of the gas layer specific to impact on superheated substrates. For large superheat, contact at the transition to the dynamic Leidenfrost effect is induced by vertical axisymmetric oscillations of the drop’s bottom interface that are the result of the coupling of drop motion and of the gas flow generated by evaporation. The transition to contact cannot be understood by only accounting for the minimum film thickness: multiple mechanisms can trigger wetting during the different timescales associated with drop impact. The minimal hydrodynamic model we propose, while accounting for the influence of impact velocity and substrate temperature, does not allow to predict the transition to contact. We expect that predicting the threshold for the appearance of oscillations would require to take into account the shape of the gas film, a task that is beyond the scope of the present study.
Acknowledgments
We thank Ambre Bouillant, Pallav Kant, and José Manuel Gordillo for fruitful discussions and acknowledge funding from the ERC Advanced Grant DDD under grant-# 740479.
Appendix A TIR and RI image processing and calibration
A.1 Image analysis
A.1.1 TIR
TIR image processing has been described in details by Shirota et al. (2017), we recall here the main steps of the analysis. (i) First, we compensate for the optical transformation of the setup: a circular object becomes an ellipse with a principal axis ratio that is related to the angle of incidence of the laser beam. We report here the modified function linking to , a consequence of the presence of the optically coupled sapphire window:
| (32) |
where and are the optical indices of the sapphire window and of the glass prism respectively. (ii) The transformed images are then divided by the background image to obtain intensity normalized snapshots. (iii) Finally the grayscale images can be converted into absolute height fields using a lookup table relating the normalized intensity to the height.
A.1.2 RI
We process RI images by performing background substraction and azimuthal averaging, taking advantage of the axisymmetry of the problem, to improve the signal to noise ratio. The interference patterns obtained at each instant are then transformed into 1D intensity profiles that can be stacked in space-time diagrams that allow to visualize the impact dynamics. Each fringe is an iso-height line and adjacent bright (dark) fringes corresponds to a thickness variation . We use standard peak detection algorithms to detect the peaks in the 1D profiles and track their position in time using particle tracking. This representation enables to visualize height contours in space and time, a property that allows one to determine the absolute thickness at any time from its knowledge at a single instant.
A.2 Calibration
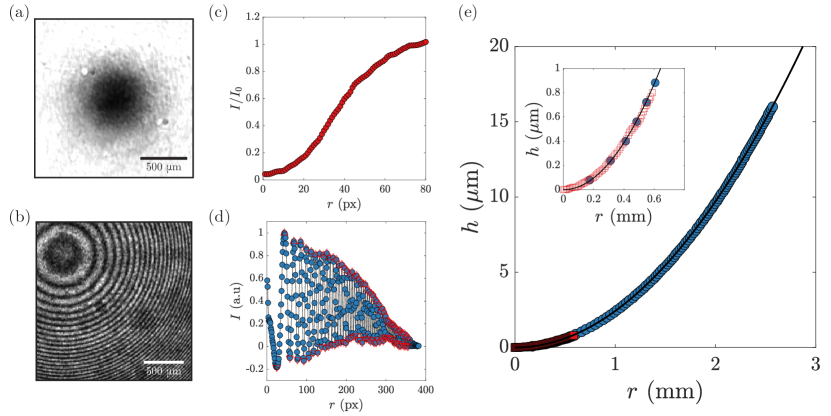
We calibrate the setup before each set of experiments by measuring the gap between a concave lens with known radius of curvature ( mm) and the sapphire disk. Figures 7a and b respectively show the TIR and RI images after data processing. From these, we extract azimuthally averaged intensity profiles (Figures 7c and d). In figure 7e, we plot the gap thickness between the lens and substrate as a function of as determined from TIR (red squares) and RI (blue dots) and compare it to the known lens profile (black solid line). The inset enables us to visualize the overlap between TIR and RI measurements that allows us to obtain the absolute film thickness from nm to m by matching the absolute information from TIR with the relative information of RI.
We estimate the error in TIR measurements from the calibration curve. The error is mainly caused by the uncertainty in the determination of the incidence angle and the steepness of the function relating large heights to intensity. The error is on the order of 10 nm for small heights and increases as we get close to the upper bound of the measurement range reaching typically 100 nm. For RI measurements, the main source of uncertainty comes from the limited resolution that could prevent to distinguish individual peaks in the dimple region. The error bars are an upper bound that corresponds to the blending of two successive black (white) fringes.
Appendix B Minimum thickness for isothermal impacts
We derive the scaling for the minimum thickness of the gas film in isothermal conditions, obtained by Mani et al. (2010). We start from the self-similar set of governing equations, (17) and (18), where the right hand side term of (18) is set to zero. In isothermal conditions, the viscous lubrication flow opposes the liquid inertia at the neck. Combining (17) and (18) gives the following scaling relations for the pressure and the lengthscale :
| (33) |
As decreases, the initially neglected Laplace pressure at the neck , which scales as , diverges faster than the gas pressure at the neck which scales as , indicating that the initial hypothesis to neglect surface tension is no longer valid as the drop approaches the solid. The balance between and the Laplace pressure thus sets the minimum film thickness :
| (34) |
In figure 8, we plot the measured minimum film thickness as a function of the scaling (34) where the surface tension is evaluated at and the gas viscosity is extracted from our measurements of the dimple height . Even if the isothermal and superheated scalings predict similar power-law decrease of with with exponents and , respectively, the data for different substrate temperatures do not collapse on a single line. The isothermal scaling does not capture the effect of substrate heating: the measured thicknesses are always larger than that predicted numerically (Mandre & Brenner (2012), solid line) or reported in experiments in the isothermal case (De Ruiter et al. (2012), dashed line), and the deviation increases with increasing superheat. This comparison confirms that for impacts on superheated surfaces, the liquid inertia at the neck is balanced by vapor generation.
Appendix C Short-time rupture of the gas film
We monitor the nucleation of point-like wetting spots that precede the collapse of the gas film. Figure 9a shows a sequence of TIR grayscale images associated to an impact with m/s (i.e ) and ∘C. The drop spreads on a gas cushion before a contact spot nucleates at ms (red arrow). We measure the time evolution of the thickness at the location where contact occurs to obtain the film height before rupture m, that is larger than the global minimum of the thickness at the same time instant, here m. We are able to resolve only for moderate impact velocities as sufficient time resolution is needed to distinguish the rupture from the thinning dynamics. In figure 9b, we plot the histogram of . The film rupture height is broadly distributed, with an average value of m, in agreement with data obtained for isothermal impacts on glass (De Ruiter et al., 2012; Kolinski et al., 2014a), suggesting that the presence of defects on the surface triggers liquid-solid contact. During impact on heated substrates, contact always occurs at the neck at short-time unlike what is observed for ambient temperature surfaces. The film shape promotes this location: there is no thin extended region bridging the dimple to the outer edge of the film.
After nucleation of contact, the wetting spot spreads ( ms and ms), preferentially in the azimuthal direction along the neck, binding the drop to the substrate similarly as during isothermal impacts. These wetting dynamics disappear when we increase as we observe the formation of boiling patterns immediately after contact (Figure 5b).
References
- Bartolo et al. (2006) Bartolo, D., Josserand, C. & Bonn, D. 2006 Singular jets and bubbles in drop impact. Physical Review Letters 96 (12), 124501.
- Bernardin & Mudawar (2004) Bernardin, J. D. & Mudawar, I. 2004 A Leidenfrost point model for impinging droplets and sprays. Journal of Heat Transfer 126 (2), 272–278.
- Biance et al. (2006) Biance, A-L., Chevy, F., Clanet, C., Lagubeau, G. & Quéré, D. 2006 On the elasticity of an inertial liquid shock. Journal of Fluid Mechanics 554, 47.
- Biance et al. (2003) Biance, A-L., Clanet, C. & Quéré, D. 2003 Leidenfrost drops. Physics of Fluids 15 (6), 1632–1637.
- Bouillant et al. (2020) Bouillant, A., Cohen, C., Clanet, C. & Quéré, D. 2020 Morphogenesis of Leidenfrost stars [submitted manuscript] .
- Boulton-Stone & Blake (1993) Boulton-Stone, J. M. & Blake, J. R. 1993 Gas bubbles bursting at a free surface. Journal of Fluid Mechanics 254, 437–466.
- Bouwhuis et al. (2012) Bouwhuis, W., van der Veen, R. CA., Tran, T., Keij, D. L., Winkels, K. G., Peters, I. R., van der Meer, D., Sun, C., Snoeijer, J. H. & Lohse, D. 2012 Maximal air bubble entrainment at liquid-drop impact. Physical Review Letters 109 (26), 264501.
- Bouwhuis et al. (2013) Bouwhuis, W., Winkels, K. G., Peters, I. R., Brunet, P., Van Der Meer, D. & Snoeijer, J. H. 2013 Oscillating and star-shaped drops levitated by an airflow. Physical Review E 88 (2), 023017.
- Breitenbach et al. (2018) Breitenbach, J., Roisman, I. V. & Tropea, C. 2018 From drop impact physics to spray cooling models: a critical review. Experiments in Fluids 59 (3), 55.
- Brunet & Snoeijer (2011) Brunet, P. & Snoeijer, J. H. 2011 Star-drops formed by periodic excitation and on an air cushion–a short review. The European Physical Journal Special Topics 192 (1), 207–226.
- Chandra & Avedisian (1991) Chandra, S. & Avedisian, CT. 1991 On the collision of a droplet with a solid surface. Proceedings of the Royal Society of London. Series A: Mathematical and Physical Sciences 432 (1884), 13–41.
- De Ruiter et al. (2012) De Ruiter, J., Oh, J. M., van den Ende, D. & Mugele, F. 2012 Dynamics of collapse of air films in drop impact. Physical Review Letters 108 (7), 074505.
- Deike et al. (2018) Deike, L., Ghabache, E., Liger-Belair, G., Das, A. K., Zaleski, S., Popinet, S. & Séon, T. 2018 Dynamics of jets produced by bursting bubbles. Physical Review Fluids 3 (1), 013603.
- Driscoll & Nagel (2011) Driscoll, M. M. & Nagel, S. R. 2011 Ultrafast interference imaging of air in splashing dynamics. Physical Review Letters 107 (15), 154502.
- Gordillo et al. (2019) Gordillo, JM., Riboux, G. & Quintero, ES. 2019 A theory on the spreading of impacting droplets. Journal of Fluid Mechanics 866, 298–315.
- Guyon et al. (2012) Guyon, E., Hulin, J-P. & Petit, L. 2012 Hydrodynamique physique. EDP Sciences.
- Hamdan et al. (2015) Hamdan, K. S., Kim, D-E. & Moon, S-K. 2015 Droplets behavior impacting on a hot surface above the Leidenfrost temperature. Annals of Nuclear Energy 80, 338–347.
- Hicks & Purvis (2010) Hicks, P. D. & Purvis, R. 2010 Air cushioning and bubble entrapment in three-dimensional droplet impacts. Journal of Fluid Mechanics 649, 135–163.
- Hinch (1991) Hinch, E. J. 1991 Perturbation Methods. Cambridge University Press.
- Holter & Glasscock (1952) Holter, N. J. & Glasscock, W. R. 1952 Vibrations of evaporating liquid drops. The Journal of the Acoustical Society of America 24 (6), 682–686.
- Josserand & Thoroddsen (2016) Josserand, C. & Thoroddsen, S. T. 2016 Drop impact on a solid surface. Annual Review of Fluid Mechanics 48, 365–391.
- Kim (2007) Kim, J. 2007 Spray cooling heat transfer: The state of the art. International Journal of Heat and Fluid Flow 28 (4), 753–767.
- Kolinski et al. (2014a) Kolinski, J. M., Mahadevan, L. & Rubinstein, S. M. 2014a Drops can bounce from perfectly hydrophilic surfaces. EPL (Europhysics Letters) 108 (2), 24001.
- Kolinski et al. (2014b) Kolinski, J. M., Mahadevan, L. & Rubinstein, S. M. 2014b Lift-off instability during the impact of a drop on a solid surface. Physical Review Letters 112 (13), 134501.
- Kolinski et al. (2012) Kolinski, J. M., Rubinstein, S. M., Mandre, S., Brenner, M. P., Weitz, D. A. & Mahadevan, L. 2012 Skating on a film of air: drops impacting on a surface. Physical Review Letters 108 (7), 074503.
- Laan et al. (2014) Laan, N., de Bruin, K. G., Bartolo, D., Josserand, C. & Bonn, D. 2014 Maximum diameter of impacting liquid droplets. Physical Review Applied 2 (4), 044018.
- Lee et al. (2020) Lee, S-H., Rump, M., Harth, K., Kim, M., Lohse, D., Fezzaa, K. & Je, J. H. 2020 Downward jetting of a dynamic Leidenfrost drop. Physical Review Fluids 5 (7), 074802.
- Leidenfrost (1756) Leidenfrost, J. G. 1756 De aquae communis nonnullis qualitatibus tractatus. Ovenius.
- Li & Thoroddsen (2015) Li, E. Q. & Thoroddsen, S. T. 2015 Time-resolved imaging of a compressible air disc under a drop impacting on a solid surface. Journal of Fluid Mechanics 780, 636–648.
- Mandre & Brenner (2012) Mandre, S. & Brenner, M. P. 2012 The mechanism of a splash on a dry solid surface. Journal of Fluid Mechanics 690, 148.
- Mandre et al. (2009) Mandre, S., Mani, M. & Brenner, M. P. 2009 Precursors to splashing of liquid droplets on a solid surface. Physical Review Letters 102 (13), 134502.
- Mani et al. (2010) Mani, M., Mandre, S. & Brenner, M. P. 2010 Events before droplet splashing on a solid surface. Journal of Fluid Mechanics 647 (1), 163–185.
- Moreira et al. (2010) Moreira, A. LN., Moita, A. S. & Panao, M. R. 2010 Advances and challenges in explaining fuel spray impingement: How much of single droplet impact research is useful? Progress in energy and combustion science 36 (5), 554–580.
- Prandtl (1904) Prandtl, L. 1904 Über flüssigkeitsbewegung bei sehr kleiner reibung. Math-Kongr, Heidelberg .
- Quéré (2013) Quéré, D. 2013 Leidenfrost dynamics. Annual Review of Fluid Mechanics 45, 197–215.
- Renardy et al. (2003) Renardy, Y., Popinet, S., Duchemin, L., Renardy, M., Zaleski, S., Josserand, C., Drumright-Clarke, M. A., Richard, D., Clanet, C. & Quéré, D. 2003 Pyramidal and toroidal water drops after impact on a solid surface. Journal of Fluid Mechanics 484, 69–83.
- Riboux & Gordillo (2014) Riboux, G. & Gordillo, J. M. 2014 Experiments of drops impacting a smooth solid surface: a model of the critical impact speed for drop splashing. Physical Review Letters 113 (2), 024507.
- Richard et al. (2002) Richard, D., Clanet, C. & Quéré, D. 2002 Contact time of a bouncing drop. Nature 417 (6891), 811–811.
- Shirota et al. (2017) Shirota, M., van Limbeek, M. AJ., Lohse, D. & Sun, C 2017 Measuring thin films using quantitative frustrated total internal reflection (ftir). The European Physical Journal E 40 (5), 54.
- Shirota et al. (2016) Shirota, M., van Limbeek, M. AJ., Sun, C., Prosperetti, A. & Lohse, D. 2016 Dynamic Leidenfrost effect: relevant time and length scales. Physical Review Letters 116 (6), 064501.
- Smith et al. (2003) Smith, F. T., Li, L. & Wu, G. X. 2003 Air cushioning with a lubrication/inviscid balance. Journal of Fluid Mechanics 482, 291–318.
- Sobac et al. (2014) Sobac, B., Rednikov, A., Dorbolo, S. & Colinet, P. 2014 Leidenfrost effect: Accurate drop shape modeling and refined scaling laws. Physical Review E 90 (5), 053011.
- Staat et al. (2015) Staat, H. JJ., Tran, T., Geerdink, B., Riboux, G., Sun, C., Gordillo, JM. & Lohse, D. 2015 Phase diagram for droplet impact on superheated surfaces. Journal of Fluid Mechanics 779, R1.
- Thoroddsen et al. (2005) Thoroddsen, S. T., Etoh, T. G., Takehara, K., Ootsuka., N & Hatsuki, Y. 2005 The air bubble entrapped under a drop impacting on a solid surface. Journal of Fluid Mechanics 545, 203–212.
- Tran et al. (2012) Tran, T., Staat, H. JJ., Prosperetti, A., Sun, C. & Lohse, D. 2012 Drop impact on superheated surfaces. Physical Review Letters 108 (3), 036101.
- Van Limbeek et al. (2017) Van Limbeek, M. AJ., Schaarsberg, M. HK., Sobac, B., Rednikov, A., Sun, C., Colinet, P. & Lohse, D. 2017 Leidenfrost drops cooling surfaces: theory and interferometric measurement. Journal of Fluid Mechanics 827, 614–639.
- Van Limbeek et al. (2016) Van Limbeek, M. AJ., Shirota, M., Sleutel, P., Sun, C., Prosperetti, A. & Lohse, D. 2016 Vapour cooling of poorly conducting hot substrates increases the dynamic Leidenfrost temperature. International Journal of Heat and Mass Transfer 97, 101–109.
- Waitukaitis et al. (2018) Waitukaitis, S. R., Harth, K. & Van Hecke, M. 2018 From bouncing to floating: the Leidenfrost effect with hydrogel spheres. Physical Review Letters 121 (4), 048001.
- Waitukaitis et al. (2017) Waitukaitis, S. R., Zuiderwij, A., Souslov, A., Coulais, C. & Van Hecke, M. 2017 Coupling the Leidenfrost effect and elastic deformations to power sustained bouncing. Nature Physics 13 (11), 1095–1099.
- Wildeman et al. (2016) Wildeman, S., Visser, CW., Sun, C. & Lohse, D. 2016 On the spreading of impacting drops. Journal of Fluid Mechanics 805, 636–655.
- Worthington (1877) Worthington, A. M. 1877 Xxviii. on the forms assumed by drops of liquids falling vertically on a horizontal plate. Proceedings of the Royal Society of London 25, 261–272.
- Xu et al. (2005) Xu, L., Zhang, W. W. & Nagel, S. R. 2005 Drop splashing on a dry smooth surface. Physical Review Letters 94 (18), 184505.
- Yao & Cai (1988) Yao, S-C. & Cai, K. Y. 1988 The dynamics and Leidenfrost temperature of drops impacting on a hot surface at small angles. Experimental Thermal and Fluid Science 1 (4), 363–371.
- Yarin (2006) Yarin, A. L. 2006 Drop impact dynamics: splashing, spreading, receding, bouncing. Annual Review of Fluid Mechanics 38, 159–192.
- Yarin et al. (2017) Yarin, A. L., Roisman, I. V. & Tropea, C. 2017 Collision Phenomena in Liquids and Solids. Cambridge University Press.