Fallback Accretion Model for the Years-to-Decades X-ray Counterpart to GW170817
Abstract
A new component was reported in the X-ray counterpart to the binary neutron-star merger and gravitational wave event GW170817, exceeding the afterglow emission from an off-axis structured jet. The afterglow emission from the kilonova/macronova ejecta may explain the X-ray excess but exceeds the radio observations if the spectrum is the same. We propose a fallback accretion model that a part of ejecta from the neutron star merger falls back and forms a disk around the central compact object. In the super-Eddington accretion phase, the X-ray luminosity stays near the Eddington limit of a few solar masses and the radio is weak, as observed. This will be followed by a power law decay. The duration of the constant luminosity phase conveys the initial fallback timescale in the past. The current multi-year duration requires – sec, suggesting that the disk wind rather than the dynamical ejecta falls back after the jet launch. Future observations in the next decades will probe the timescale of – sec, around the time of extended emission in short gamma-ray bursts. The fallback accretion has not been halted by the -process heating, implying that fission is weak on the year scale. We predict that the X-ray counterpart will disappear in a few decades due to the -process halting or the depletion of fallback matter.
1 Introduction
Gravitational waves from the first binary neutron star merger event (BNS merger) GW170817 were observed by the Laser Interferometer Gravitational-Wave Observatory (LIGO) and the Virgo Consortium (LVC) (Abbott et al., 2017a). This event was accompanied by a short-duration gamma-ray burst (sGRB) GRB 1780817A (Abbott et al., 2017b). The superluminal motion of the radio counterpart was detected, indicating that the relativistic jet was launched from the merged compact stars (Mooley et al., 2018; Ghirlanda et al., 2019) in the off-axis direction (e.g., Ioka & Nakamura, 2018, 2019). In addition, a kilonova/macronova is also associated with GW170817 (Arcavi et al., 2017; Chornock et al., 2017; Coulter et al., 2017; Cowperthwaite et al., 2017; Drout et al., 2017; Kasen et al., 2017; Kasliwal et al., 2017; Kilpatrick et al., 2017; McCully et al., 2017; Nicholl et al., 2017; Shappee et al., 2017; Smartt et al., 2017; Soares-Santos et al., 2017; Tanaka et al., 2017; Tanvir et al., 2017). From the modelling of the kilonova/macronova (e.g., Cowperthwaite et al., 2017; Kasen et al., 2017; Kasliwal et al., 2017; Villar et al., 2017; Kawaguchi et al., 2018), it is suggested that the merger ejecta consists of at least two components: the dynamical ejecta and the post-merger ejecta. The former is released promptly after coalescence in the dynamical timescale (e.g., Bauswein et al., 2013; Hotokezaka et al., 2013; Radice et al., 2016; Sekiguchi et al., 2015, 2016; Bovard et al., 2017; Dietrich et al., 2017), and the latter is released in the secular viscous timescale (e.g., Fernández & Metzger, 2013; Just et al., 2015; Fernández et al., 2019; Fujibayashi et al., 2020b).
In GRB 170817A, an off-axis afterglow where an off-axis relativistic jet interacts with circumstellar medium (CSM), has been observed (Haggard et al., 2017; Margutti et al., 2018; Troja et al., 2017). The temporal evolution of the afterglow shows a much slower brightening than seen in top-hat jet afterglows, which is understood to be an afterglow from a structured jet (e.g., Lamb et al., 2019; Ghirlanda et al., 2019; Troja et al., 2019; Beniamini et al., 2020; Takahashi & Ioka, 2020, 2021). The modeling of the afterglow has been successful, constraining not only the physical quantities of the jet (e.g., opening angle of the jet, jet luminosity, and structure), but also the density of CSM (e.g., Margutti et al., 2018; Alexander et al., 2018; Lamb et al., 2019; Troja et al., 2019; Takahashi & Ioka, 2021).
Recently, the X-ray flux was observed several years after the coalescence (Hajela et al., 2019, 2020a, 2020b, 2021a; Troja et al., 2020; Balasubramanian et al., 2021). It has been reported that a 2–3 excess component over the prediction of the jet afterglow model (Hajela et al., 2019; Balasubramanian et al., 2021; Hajela et al., 2021a). Hajela et al. (2019) argued that this is a kilonova/macronova afterglow, which is generated by the interaction of the merger ejecta with CSM (Nakar & Piran, 2011; Kyutoku et al., 2014; Takami et al., 2014; Asano & To, 2018; Hotokezaka et al., 2018; Kathirgamaraju et al., 2019; Nathanail et al., 2021). This model expects an increase of synchrotron emission also in the radio band. However, no such radio re-brightening has been observed (Hajela et al., 2019; Balasubramanian et al., 2021). This may imply a different spectral index.
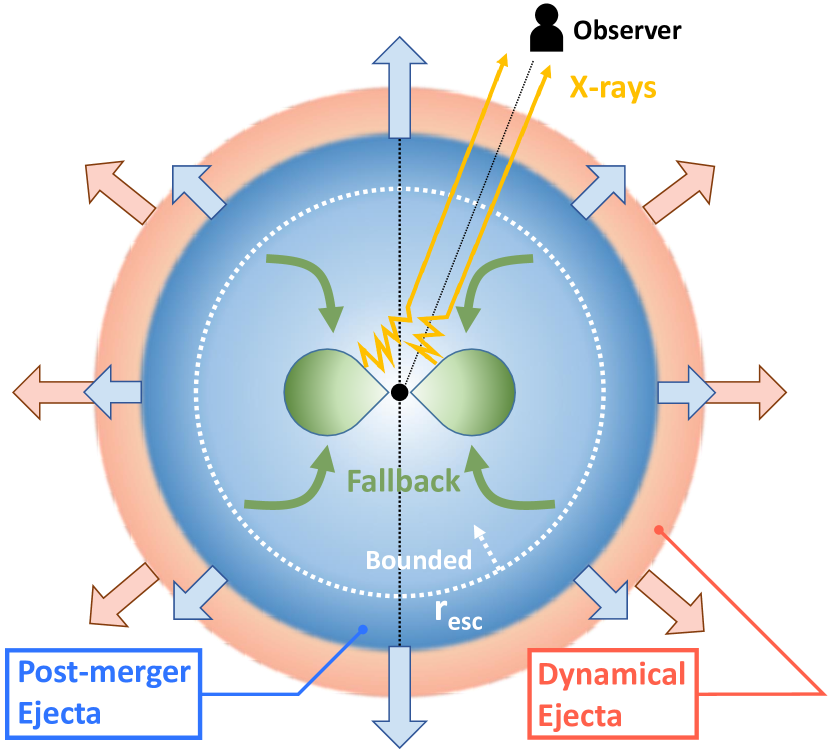
In this Letter, we present an alternative interpretation for the X-ray excess in GW170817 (see Figure 1). As shown by many theoretical studies, a part of the ejecta from the BNS merger is inevitably gravitationally bounded, regardless of whether they are dynamical or post-merger ejecta. Since the mass of the central object of GW170817 is estimated as (Abbott et al., 2017a), its Eddington luminosity is as follows:
| (1) |
where is the mass of the proton and is the Thomson scattering cross section. This is consistent with the X-ray excess luminosity within a factor, implying that the X-ray excess could come from an accretion disk near the central compact object. However, it is not clear whether the fallback accretion in the BNS merger can maintain a super-Eddington accretion for a few years or not111In fact, Margutti et al. (2018) applied the fallback accretion model to the early X-ray emission from the jet afterglow and concluded that the emission from the accretion flow never dominates the X-ray emission from GW170817. However, the parameter they adopted corresponds to the fallback of the dynamical ejecta (the mass acretion rate, ), which is not appropriate for considering light curves on an annual scale, as we will see later.. Thus, in this Letter, by constructing a X-ray light curve model from fallback accretion, we investigate whether the re-brightening is possible or not. We also constrain the -process heating rate from the X-ray light curve by applying the semi-analytic model of the mass accretion inhibited by radioactive heating due to the -process elements developed in Ishizaki et al. (2021).
2 Fallback rate of the ejecta
In this section, we estimate the fallback accretion rate for each of the two types of ejecta: the dynamical ejecta and the post-merger ejecta. The accretion rate of dynamical ejecta, which is released promptly in the dynamical timescale after the merger when neutron stars are destroyed by tidal forces or the impact of the collision, can be modeled based on the numerical simulations. On the other hand, the fallback rate of the post-merger ejecta, which is the subsequent disk wind launched mainly by viscous heating in the accretion disk in the secular timescale, is theoretically unclear, because the numerical relativity simulations of BNS mergers have not been calculated long enough to capture this fallback accretion (see Fujibayashi et al., 2020b, for the best effort). Therefore, for the post-merger ejecta, we estimate the mass accretion rate by constructing a simple model.
The fallback accretion rate decays in proportion to after some initial time (Rees, 1988; Michel, 1988). Thus we write the mass accretion rate as the following simple power-law form,
| (2) |
where is the initial fallback time when the fallback accretion starts, and is the total fallback mass of the ejecta, which satisfies
| (3) |
In Ishizaki et al. (2021), the accretion rate is calculated based on the profile of the dynamical ejecta derived from the numerical relativity simulation in Kiuchi et al. (2017). The fallback accretion rate of the dynamical ejecta with zero temperature calculated using the same method as in Ishizaki et al. (2021) is fitted by Equation (2) with and . We find that the simple power-law model describes well the expected accretion rate after .
As mentioned earlier, the fallback accretion rate for the post-merger ejecta is theoretically unclear. The state-of-the-art study by Fujibayashi et al. (2020b) showed that the post-merger ejecta mass is about – and its velocity is about –. Kawaguchi et al. (2020) calculated the long term evolution of the post-merger ejecta using the result of Fujibayashi et al. (2020b) as initial conditions. While the disk outflow is blowing ( sec), the resultant angle-averaged mass density profile of the ejecta is approximately proportional to the power-law of a radial distance for the ejecta with velocity less than about (Kawaguchi et al. (2020), private communication, see also Fujibayashi et al. (2020b)). Hence, we assume that the mass density distribution of the post-merger ejecta is proportional to .
In order to estimate the fallback mass for the post-merger ejecta, we calculate the boundary radius between the gravitationally bounded and unbounded parts. At this radius , the kinetic and gravitational energies are balanced. If the ejecta at moves under the energy conservation law, the radius evolves in time according to the following differential equation:
| (4) |
Integrating this over time and evaluating it at , we obtain
| (5) |
where we assume that at is sufficiently large relative to the initial position. At , the mass inside is the total mass to fall back . Given the mass density distribution , the ratio of the fallback mass to the total mass of the post-merger ejecta, , can be calculated as
| (6) |
where is the mass density at and is the velocity of the post-merger ejecta. Note that the mass that does not fall back radiates the kilonova/macronova. The numerical evaluation of the quantities in the post-merger ejecta is as follows:
| (7) |
| (8) |
| (9) |
The time at which the fallback starts in the post-merger ejecta is for example the time when the outflow from the central object stops blowing and the fallback cannot be supported by the ram pressure of the outflow. However, because the theoretical understanding of the fallback accretion of the post-merger ejecta is not enough as mentioned above, the exact value of is not known. Therefore we treat as a free parameter in this study. For the mass and velocity of the ejecta, we adopt the values that are consistent with the kilonova/macronova light curve used in Kawaguchi et al. (2020), who properly treat the radiation transfer across the different ejecta components.
3 X-ray light curve of the fallback accretion in BNS merger
The ejecta that falls back onto the central object forms an accretion disk, and emits mainly X-rays as will be discussed later. Here, we assume that the central object collapses to a black hole (BH) with mass at least at the time yr. These X-rays are only observable if they are not absorbed by the kilonova/macronova ejecta in the line of sight (Kisaka et al., 2016; Murase et al., 2018; Margutti et al., 2018). According to Murase et al. (2018), the time required for the dynamical ejecta to become optically thin is estimated as follows:
| (10) |
where is the typical opacity for a 10 keV X-ray photon. For lower energy X-ray photons, is much larger, and the expected bound-free opacity of neutral or singly ionized heavy -process nuclei is about (e.g., Metzger, 2017; Margutti et al., 2018). In Equation (10), the value is evaluated for the post-merger ejecta, because the dynamical ejecta has less mass and higher velocity than the post-merger ejecta. For the ejecta mass, we adopt , which is the mass of the wind component based on the Kawaguchi et al. (2020). This value is consistent with the observation-based phenomenological model of kilonova/macronova (e.g., Chornock et al., 2017; Cowperthwaite et al., 2017; Kasliwal et al., 2017; Villar et al., 2017), since a large fraction of the mass fallbacks and does not contribute to the kilonova/macronova (see Equation (6) and (8)). For the ejecta velocity, we adopt not to evaluate Equation (10). The geometric configuration of GW170817 is such that the line of sight direction is close to the axial direction (i.e., the viewing angle is about deg (Mooley et al., 2018)). According to Kawaguchi et al. (2020), ejecta on the polar direction are about twice as fast as those in the equatorial plane, so that we evaluate them with the parameter . On the other hand, if the viscous parameter , since the post-merger ejecta is expected to have a larger electron fraction (see Fujibayashi et al., 2020b) than that of the dynamical ejecta, heavy -process nuclei would be less formed and then the value of would be smaller (For details, see the mass energy-transfer coefficient data provided by NIST222https://www.nist.gov/pml/x-ray-mass-attenuation-coefficients). Then, after a year, the kilonova/macronova ejecta is expected to become optically thin to X-rays.
The fallback ejecta converts its gravitational energy into radiation by viscous heating in the accretion disk. Initially the mass accretion rate is much larger than the Eddington accretion rate. In this super-Eddington accretion phase, the luminosity is roughly limited by the Eddington luminosity . Many theoretical calculations of the radiative transport in super-Eddington accretion show that the isotropic bolometric luminosity seen by slightly off-axis observers (i.e., for GW170817, deg) is about twice that of (e.g., Ohsuga et al., 2005; Sądowski & Narayan, 2016; Ogawa et al., 2017; Abarca et al., 2018; Kitaki et al., 2021). Hence, we estimate the bolometric luminosity in the super-Eddington phase as follows:
| (11) |
where is a constant and we adopt . As the mass accretion rate becomes small, the radiative transfer effect becomes less effective and the radiative efficiency increases. For the mass accretion rate smaller than the Eddington accretion rate, the bolometric luminosity can be estimated as follows:
| (12) |
where is the radiative efficiency and we adopt (e.g., Ohsuga et al., 2005). Combining Equations (11) and (12), we estimate the luminosity with the following simple formula:
| (13) |
Note that the isotropic luminosity already accounts for the beaming effect.
In order to convert the bolometric luminosity to the observed X-ray luminosity in Chandra band (– keV), first of all, we make a rough estimate of the spectrum of the disk emission. By using equation (11), we can estimate the effective temperature at the innermost stable circular orbit as
| (14) |
where , is the Schwarzschild radius of the central object, and is the Stefan–Boltzmann constant. For the disk in the super-Eddington phase, the effective temperature depends on the radius as (Watarai et al., 2000). If we assume that the emission at each radius is the blackbody radiation at the effective temperature , the emission spectrum of the disk can be estimated as follows:
| (15) |
where is the outer radius of the disk, is the blackbody spectrum, and, here we used the fact that the peak of blackbody radiation is proportional to and Wien’s displacement law . Hence, the conversion factor can be calculated as follows:
| (16) |
where is the effective temperature at the outer radius. Evaluating the value of for gives . More precisely, in the super-Eddington accretion phase, the system is inevitably optically thick against absorption and scattering, so that we estimate based on numerical calculations that incorporate the effect of radiative transfer. According to the Monte-Carlo simulation based on hydrodynamic simulations of the super-Eddington flow, the spectrum with BH as a central source has a peak at a few keV, not depending largely on the accretion rate, and has approximately – (e.g., Kawashima et al., 2012; Schnittman et al., 2013; Narayan et al., 2017; Kitaki et al., 2017; Kawanaka & Mineshige, 2020). The spectral energy distributions (SEDs) obtained by these simulations show a flat frequency dependence centered at a few keV, corresponding to . Hajela et al. (2019) reported a photon index of for the X-ray emission two years after the merger, which is consistent with the X-ray from super-Eddington flow within the uncertainty. Kitaki et al. (2017) investigated the dependence of the spectrum on the BH mass with –, and found that the larger the BH mass, the broader the spectrum centered at a few keV. This implies that the smaller the BH mass, the larger tends to be. Therefore, extrapolating the result of Kitaki et al. (2017) to the case for the BH mass , we adopt . Furthermore, we should also take into account the X-ray absorption by ejecta. Since the mean density of ejecta evolves in time as , the temporal evolution of the optical depth can be evaluated as . At , the ejecta becomes optically thin (i.e. ), so that the observed X-ray luminosity is written as
| (17) |
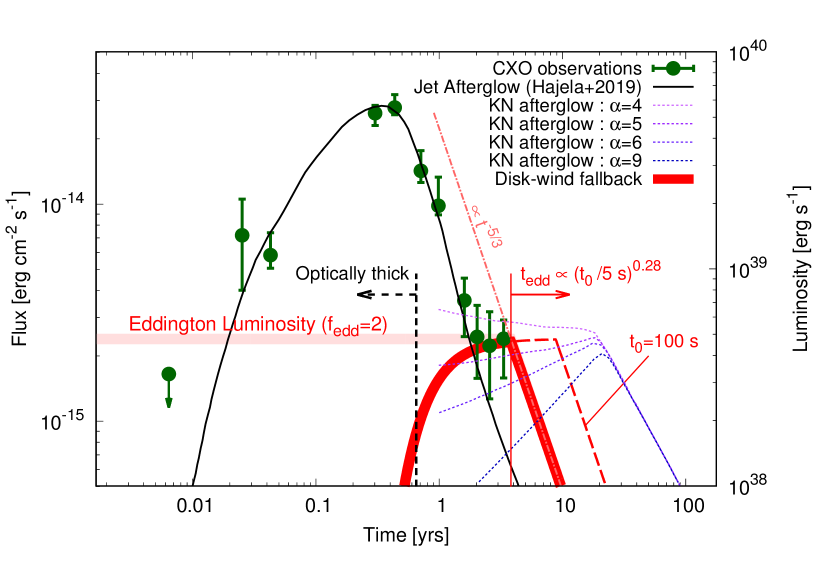
In Figure 2, the X-ray luminosity associated with the fallback accretion of the post-merger ejecta in Equation (13) is shown by the red curve. The dashed line indicates the time before which the kilonova/macronova ejecta is optically thick and the X-rays are absorbed. The X-ray light curve shows a constant luminosity up to a certain time , after which it declines in proportion to . The time corresponds to the time when Equations (11) and (12) are equal. For the dynamical ejecta, we have
| (18) |
For the post-merger ejecta, we calculate using Equations (2) and (9) as follows:
| (19) |
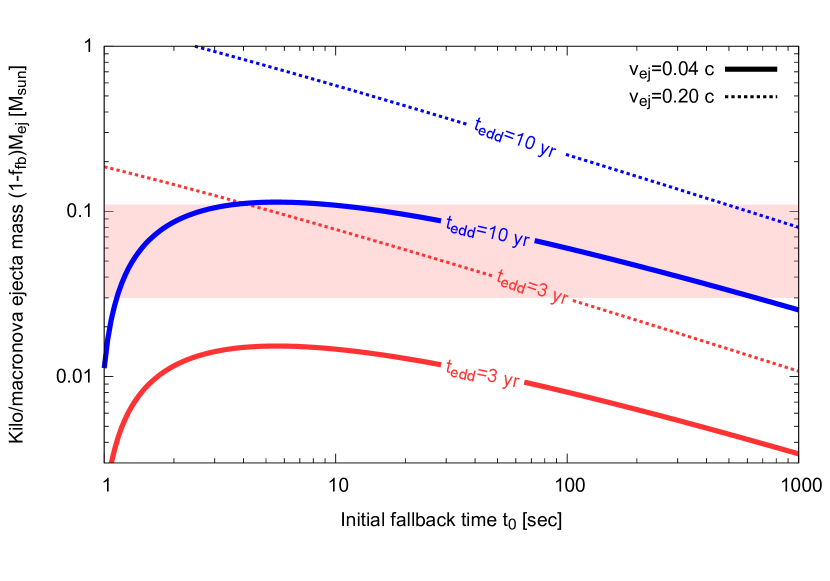
As can be seen from Equation (18), the X-rays from the fallback of the dynamical ejecta is absorbed by the ejecta on a timescale earlier than a year, and this cannot be the main component explaining the X-ray excess. On the other hand, the X-rays associated with the fallback of the post-merger ejecta can explain the X-ray excess. Figure 3 shows the relationship between the initial fallback time and the mass of the kilonova/macronova ejecta , for a given . The longer , the more kilonova/macronova ejecta mass is required for the same . Note that for , at , is roughly about unity, so that the mass of the kilonova/macronova ejecta is small, but the total ejecta mass itself is very large.
Our model assumes that the mass accretion rate evolves in time as , but there can be variations in the actual temporal evolution (e.g., Cannizzo et al., 1990; Ogilvie, 1999; Kumar et al., 2008; Metzger et al., 2008). For example, for the radiatively inefficient disk, the mass accretion rate decreases in proportion to . Generally, the temporal evolution of the light curve diminishing depends on the mass accretion rate and the mass of the accretion disk. Here, for simplicity, we assume and continue to use equations (2) and (13) in this letter. Furthermore, equation (19) suggests that the system continues to be in a super-Eddington phase until now, which implies that the outflow is ejected from the radiatively inefficient disk. The effect of the outflow on the radiative transfer has already been incorporated in the evaluation of and based on the results of numerical simulations. Some of the outflow can interact with the kilonova/macronova ejecta to form shock and release their kinetic energy. However, the outflow that is fast enough to catch up with the kilonova/macronova ejecta is limited to those that escape from the fairly inner edge of the disk.
4 Implication to r-process heating
Ishizaki et al. (2021) showed that the mass accretion in fallback is suppressed by the heating due to the decay of -process elements. According to Ishizaki et al. (2021), the mass accretion rate decreases to 10% compared to the usual power-law behavior (see Equation (2)) on a timescale called the halting time , which is determined as the solution to the following equation,
| (20) |
where is a constant obtained from numerical calculations (see Ishizaki et al., 2021, for details), and is the radioactive heating rate per unit mass. With the typical heating rate , which is suggested by the nucleosynthesis calculations and the kilonova/macronova modelings (e.g., Wanajo et al., 2014; Tanaka et al., 2017), the halting time can be estimated as
| (21) |
The halting time is sensitive to the uncertainty of the radioactive heating rate. As reported by Barnes et al. (2020), due to the uncertainty of nuclear physics, there is one order magnitude uncertainty of the heating rate at day. The corresponding uncertainty of the halting time is a factor of up and down together (see Equation (21)). Furthermore, after days of the coalescence, the gamma-rays emitted by radioactive decay can escape from the ejecta without ejecta heating. For example, for the heating rate calculated by Wanajo et al. (2014), the effective heating rate drops to about half after days. Note that the fraction of gamma-rays in radioactive heating is also affected by the uncertainty of nuclear physics. Combining the effects of the insufficient thermalization and the uncertainty of the heating rate (assuming digit up and down even at years), the uncertainty of the halting time ranges about – sec (see Ishizaki et al., 2021).
After the halting time , the mass accretion rate decreases more rapidly than . If the heating rate can be written as a simple power-law form , the temporal evolution of the mass accretion rate after the halting time can be written as
| (22) |
where is the mass accretion rate at and is about 10% of the value expected from the usual power-law behavior at , and , , are the parameters of the semi-analytical model of Ishizaki et al. (2021) calibrated using numerical simulations for a GW170817-like event. According to this formula, at –, the mass accretion rate decreases rapidly to about 1% for –. Therefore we predict that the X-ray light curve fades very steeply at least in a few decades, regardless of the duration of the super-Eddington phase.
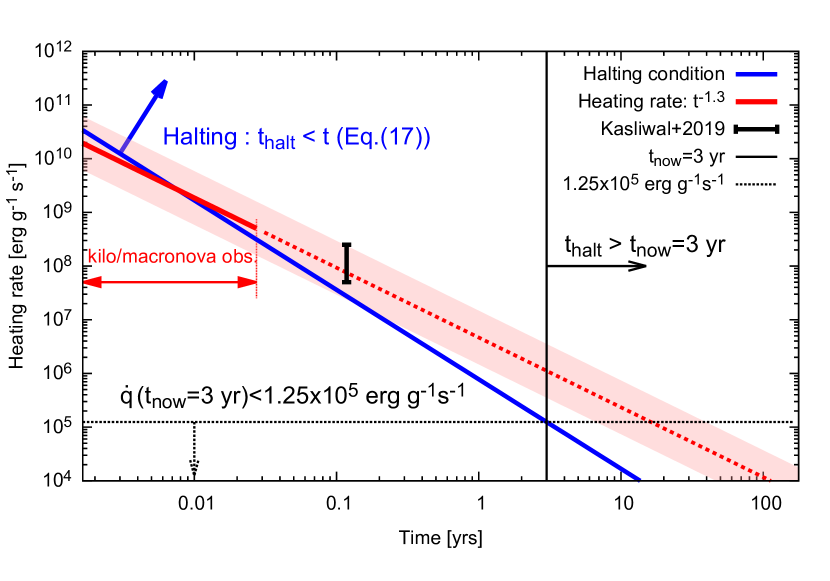
Figure 4 shows the heating rate and the conditions above which the accretion is halted. The red line shows the simple power-law heating and the red shaded area shows the uncertainty of the heating rate of the upper and lower digits (Barnes et al., 2020). Note that the uncertainty in the heating rate is shown for the day time scale in (Barnes et al., 2020), and that the range of uncertainties would be much broader for later times () (e.g., large uncertainties in the contribution of fission, which is the predominant process in the late stage, and compositional uncertainties, see also Barnes et al. (2020)). Furthermore, the effective heating rate applied to ejecta after days is several times smaller due to the decreasing thermalization efficiency of gamma rays (Hotokezaka et al., 2016; Barnes et al., 2016; Waxman et al., 2018; Kasen & Barnes, 2019; Hotokezaka & Nakar, 2020) (in contrast to the fact that charged particles such as beta decay still contribute as a heating source) (see discussion in Ishizaki et al. (2021)). The black dot with an error bar is the heating rate at day obtained by Kasliwal et al. (2019) using the mid-infrared observations by Spitzer, which are consistent with the heating rates shown by the red lines. Note that this data point is the intrinsic radioactive heating rate, which is corrected for the effects of thermalization efficiency. This heating rate is estimated from data obtained in a relatively narrow band, and does not include the spectral information of the emission lines expected from kilonova/macronova emission during the nebular phase, so that there is likely to be a large systematic error. Since the current X-ray light curve suggests the super-Eddington phase, the halting time has not likely been reached yet. This implies a heating rate profile where the heating rate at day is small in the range of the shaded region, and the heating of the ejecta by gamma rays becomes inefficient around days. Furthermore, it is suggested that the heating rate at a few years is , which is about times below the power-law extrapolation of the heating rate necessary for the kilonova/macronova emission. Note that this suppression factor is explained by the uncertainties of the heating rate and the gamma-ray escape as mentioned above. According to Barnes et al. (2020), when the fission contributes effectively, the heating rate becomes relatively large after days, so that our result supports a model in which the fission is not significant.
5 Discussion and Conclusion
We have found that the year-scale X-ray excess in GW170817 can be explained by the X-ray from the fallback accretion of the post-merger ejecta (most likely disk wind). The observed X-ray flux is consistent with that in the super-Eddington regime. In this model, the X-ray flux will remain constant or diminish, but never increase, in contrast to the kilonova/macronova afterglow. In general, although it depends on the temperature distribution of the accretion disk, the emission spectrum from the accretion flow is much harder than the broad non-thermal spectrum of the kilonova/macronova afterglow (see Narayan et al. (2017); Kitaki et al. (2017); Kawanaka & Mineshige (2020) for accretion flow, and see Hajela et al. (2019); Balasubramanian et al. (2021) for the kilonova/macronova afterglow). This is consistent with the fact that the radio emission of GRB 170817A does not show any re-brightening (Balasubramanian et al., 2021). In addition, by assuming that the accretion is still in the super-Eddington phase, we have obtained a constraint on the current radioactive heating rate. If the heating continues as suggested by the modeling of kilonova/macronova emission, the mass accretion rate will completely fade due to the halting process shown in Ishizaki et al. (2021), so that the super-Eddington regime can not maintain. This suggests that the thermalization of the gamma-ray due to the radioactive decay of -process elements becomes insufficient after day. Furthermore, our model favors models in which the heating rate is relatively small after days. According to Barnes et al. (2020), in such models, the fission is not significant after days. Future X-ray observations will further limit the uncertainty of nuclear physics.
As seen in Equation (19) and Figure 2, if we adopt the observation- and simulation-based value of parameters (i.e, , ), the time when the fallback accretion starts is about sec or more. According to Fujibayashi et al. (2020b), for the BH torus system with the viscosity parameter , the duration of the viscously driven wind is about sec. This is characterized by the viscous timescale, which varies inversely with the viscosity parameter . If sec corresponds to this viscous timescale, our result implies . Furthermore, Fujibayashi et al. (2020a) showed that for an accretion disk with , the disk material with a mass of about at the inner edge of the disk accretes to the central object in about sec after coalescence. Since this also corresponds to the viscous timescale, a similar value makes the accretion last for – sec. This is consistent with the activity time of the jet driving the sGRB (e.g., Hamidani et al., 2020).
Assuming that the super-Eddington phase is still ongoing, we can estimate the initial fallback timescale by using Equation (19), namely
| (23) |
If we adopt phenomenological ejecta parameters and – which are directly derived from the kilonova/macronova light curve (e.g., Chornock et al., 2017; Cowperthwaite et al., 2017; Kasliwal et al., 2017; Villar et al., 2017) rather than simulations that take ejecta morphology into account, such as in Kawaguchi et al. (2020), the initial fallback time is required to be greater than about sec. Furthermore, as can be seen from Equation (23), future X-ray observations will give us the opportunity to explore the properties of the accretion system on longer time scales (e.g., – sec in years of observation). It is interesting to note that the initial fallback timescale of – sec approximately coincides to the typical timescale of extended emission seen in sGRB (Rowlinson et al., 2013; Kisaka et al., 2017; Kagawa et al., 2019). More work is needed to find the connection of the post-merger ejecta in the BNS merger and sGRB (e.g., Rosswog, 2007; Lee & Ramirez-Ruiz, 2007; Rossi & Begelman, 2009; Metzger et al., 2010; Kisaka & Ioka, 2015; Kisaka et al., 2017; Desai et al., 2019).
Note added: As this Letter was being completed, we learned of an independent study by Hajela et al. (2021b), which comes to a similar theoretical conclusion. The excess also becomes –.
References
- Abarca et al. (2018) Abarca, D., Kluźniak, W., & Sądowski, A. 2018, MNRAS, 479, 3936, doi: 10.1093/mnras/sty1602
- Abbott et al. (2017a) Abbott, B. P., et al. 2017a, Phys. Rev. Lett., 119, 161101, doi: 10.1103/PhysRevLett.119.161101
- Abbott et al. (2017b) —. 2017b, ApJ, 848, L13, doi: 10.3847/2041-8213/aa920c
- Alexander et al. (2018) Alexander, K. D., Margutti, R., Blanchard, P. K., et al. 2018, ApJ, 863, L18, doi: 10.3847/2041-8213/aad637
- Arcavi et al. (2017) Arcavi, I., Hosseinzadeh, G., Howell, D. A., et al. 2017, Nature, 551, 64, doi: 10.1038/nature24291
- Asano & To (2018) Asano, K., & To, S. 2018, ApJ, 852, 105, doi: 10.3847/1538-4357/aaa3f5
- Balasubramanian et al. (2021) Balasubramanian, A., Corsi, A., Mooley, K. P., et al. 2021, arXiv e-prints, arXiv:2103.04821. https://arxiv.org/abs/2103.04821
- Barnes et al. (2016) Barnes, J., Kasen, D., Wu, M.-R., & Martínez-Pinedo, G. 2016, ApJ, 829, 110, doi: 10.3847/0004-637X/829/2/110
- Barnes et al. (2020) Barnes, J., Zhu, Y. L., Lund, K. A., et al. 2020, arXiv e-prints, arXiv:2010.11182. https://arxiv.org/abs/2010.11182
- Bauswein et al. (2013) Bauswein, A., Goriely, S., & Janka, H. T. 2013, ApJ, 773, 78, doi: 10.1088/0004-637X/773/1/78
- Beniamini et al. (2020) Beniamini, P., Granot, J., & Gill, R. 2020, MNRAS, 493, 3521, doi: 10.1093/mnras/staa538
- Bovard et al. (2017) Bovard, L., Martin, D., Guercilena, F., et al. 2017, Phys. Rev. D, 96, 124005, doi: 10.1103/PhysRevD.96.124005
- Cannizzo et al. (1990) Cannizzo, J. K., Lee, H. M., & Goodman, J. 1990, ApJ, 351, 38, doi: 10.1086/168442
- Chornock et al. (2017) Chornock, R., Berger, E., Kasen, D., et al. 2017, ApJ, 848, L19, doi: 10.3847/2041-8213/aa905c
- Coulter et al. (2017) Coulter, D. A., Foley, R. J., Kilpatrick, C. D., et al. 2017, Science, 358, 1556, doi: 10.1126/science.aap9811
- Cowperthwaite et al. (2017) Cowperthwaite, P. S., Berger, E., Villar, V. A., et al. 2017, ApJ, 848, L17, doi: 10.3847/2041-8213/aa8fc7
- Desai et al. (2019) Desai, D., Metzger, B. D., & Foucart, F. 2019, MNRAS, 485, 4404, doi: 10.1093/mnras/stz644
- Dietrich et al. (2017) Dietrich, T., Ujevic, M., Tichy, W., Bernuzzi, S., & Brügmann, B. 2017, Phys. Rev. D, 95, 024029, doi: 10.1103/PhysRevD.95.024029
- Drout et al. (2017) Drout, M. R., Piro, A. L., Shappee, B. J., et al. 2017, Science, 358, 1570, doi: 10.1126/science.aaq0049
- Fernández & Metzger (2013) Fernández, R., & Metzger, B. D. 2013, MNRAS, 435, 502, doi: 10.1093/mnras/stt1312
- Fernández et al. (2019) Fernández, R., Tchekhovskoy, A., Quataert, E., Foucart, F., & Kasen, D. 2019, MNRAS, 482, 3373, doi: 10.1093/mnras/sty2932
- Fujibayashi et al. (2020a) Fujibayashi, S., Shibata, M., Wanajo, S., et al. 2020a, Phys. Rev. D, 101, 083029, doi: 10.1103/PhysRevD.101.083029
- Fujibayashi et al. (2020b) Fujibayashi, S., Wanajo, S., Kiuchi, K., et al. 2020b, ApJ, 901, 122, doi: 10.3847/1538-4357/abafc2
- Ghirlanda et al. (2019) Ghirlanda, G., Salafia, O. S., Paragi, Z., et al. 2019, Science, 363, 968, doi: 10.1126/science.aau8815
- Haggard et al. (2017) Haggard, D., Nynka, M., Ruan, J. J., et al. 2017, ApJ, 848, L25, doi: 10.3847/2041-8213/aa8ede
- Hajela et al. (2019) Hajela, A., Margutti, R., Alexander, K. D., et al. 2019, ApJ, 886, L17, doi: 10.3847/2041-8213/ab5226
- Hajela et al. (2020a) Hajela, A., Margutti, R., Kathirgamaraju, A., et al. 2020a, Research Notes of the American Astronomical Society, 4, 68, doi: 10.3847/2515-5172/ab9229
- Hajela et al. (2020b) Hajela, A., Margutti, R., Alexander, K. D., et al. 2020b, GRB Coordinates Network, 29055, 1
- Hajela et al. (2021a) Hajela, A., Margutti, R., Bright, J., et al. 2021a, GRB Coordinates Network, 29375, 1
- Hajela et al. (2021b) Hajela, A., Margutti, R., Bright, J. S., et al. 2021b, arXiv e-prints, arXiv:2104.02070. https://arxiv.org/abs/2104.02070
- Hamidani et al. (2020) Hamidani, H., Kiuchi, K., & Ioka, K. 2020, MNRAS, 491, 3192, doi: 10.1093/mnras/stz3231
- Hotokezaka et al. (2013) Hotokezaka, K., Kiuchi, K., Kyutoku, K., et al. 2013, Phys. Rev. D, 87, 024001, doi: 10.1103/PhysRevD.87.024001
- Hotokezaka et al. (2018) Hotokezaka, K., Kiuchi, K., Shibata, M., Nakar, E., & Piran, T. 2018, ApJ, 867, 95, doi: 10.3847/1538-4357/aadf92
- Hotokezaka & Nakar (2020) Hotokezaka, K., & Nakar, E. 2020, ApJ, 891, 152, doi: 10.3847/1538-4357/ab6a98
- Hotokezaka et al. (2016) Hotokezaka, K., Wanajo, S., Tanaka, M., et al. 2016, MNRAS, 459, 35, doi: 10.1093/mnras/stw404
- Ioka & Nakamura (2018) Ioka, K., & Nakamura, T. 2018, Progress of Theoretical and Experimental Physics, 2018, 043E02, doi: 10.1093/ptep/pty036
- Ioka & Nakamura (2019) —. 2019, MNRAS, 487, 4884, doi: 10.1093/mnras/stz1650
- Ishizaki et al. (2021) Ishizaki, W., Kiuchi, K., Ioka, K., & Wanajo, S. 2021, arXiv e-prints, arXiv:2104.04708. https://arxiv.org/abs/2104.04708
- Just et al. (2015) Just, O., Bauswein, A., Ardevol Pulpillo, R., Goriely, S., & Janka, H. T. 2015, MNRAS, 448, 541, doi: 10.1093/mnras/stv009
- Kagawa et al. (2019) Kagawa, Y., Yonetoku, D., Sawano, T., et al. 2019, ApJ, 877, 147, doi: 10.3847/1538-4357/ab1bd6
- Kasen & Barnes (2019) Kasen, D., & Barnes, J. 2019, ApJ, 876, 128, doi: 10.3847/1538-4357/ab06c2
- Kasen et al. (2017) Kasen, D., Metzger, B., Barnes, J., Quataert, E., & Ramirez-Ruiz, E. 2017, Nature, 551, 80, doi: 10.1038/nature24453
- Kasliwal et al. (2017) Kasliwal, M. M., Nakar, E., Singer, L. P., et al. 2017, Science, 358, 1559, doi: 10.1126/science.aap9455
- Kasliwal et al. (2019) Kasliwal, M. M., Kasen, D., Lau, R. M., et al. 2019, MNRAS, doi: 10.1093/mnrasl/slz007
- Kathirgamaraju et al. (2019) Kathirgamaraju, A., Giannios, D., & Beniamini, P. 2019, MNRAS, 487, 3914, doi: 10.1093/mnras/stz1564
- Kawaguchi et al. (2020) Kawaguchi, K., Fujibayashi, S., Shibata, M., Tanaka, M., & Wanajo, S. 2020, arXiv e-prints, arXiv:2012.14711. https://arxiv.org/abs/2012.14711
- Kawaguchi et al. (2018) Kawaguchi, K., Shibata, M., & Tanaka, M. 2018, ApJ, 865, L21, doi: 10.3847/2041-8213/aade02
- Kawanaka & Mineshige (2020) Kawanaka, N., & Mineshige, S. 2020, arXiv e-prints, arXiv:2012.05386. https://arxiv.org/abs/2012.05386
- Kawashima et al. (2012) Kawashima, T., Ohsuga, K., Mineshige, S., et al. 2012, ApJ, 752, 18, doi: 10.1088/0004-637X/752/1/18
- Kilpatrick et al. (2017) Kilpatrick, C. D., Foley, R. J., Kasen, D., et al. 2017, Science, 358, 1583, doi: 10.1126/science.aaq0073
- Kisaka & Ioka (2015) Kisaka, S., & Ioka, K. 2015, ApJ, 804, L16, doi: 10.1088/2041-8205/804/1/L16
- Kisaka et al. (2016) Kisaka, S., Ioka, K., & Nakar, E. 2016, ApJ, 818, 104, doi: 10.3847/0004-637X/818/2/104
- Kisaka et al. (2017) Kisaka, S., Ioka, K., & Sakamoto, T. 2017, ApJ, 846, 142, doi: 10.3847/1538-4357/aa8775
- Kitaki et al. (2017) Kitaki, T., Mineshige, S., Ohsuga, K., & Kawashima, T. 2017, PASJ, 69, 92, doi: 10.1093/pasj/psx101
- Kitaki et al. (2021) —. 2021, arXiv e-prints, arXiv:2101.11028. https://arxiv.org/abs/2101.11028
- Kiuchi et al. (2017) Kiuchi, K., Kawaguchi, K., Kyutoku, K., et al. 2017, Phys. Rev. D, 96, 084060, doi: 10.1103/PhysRevD.96.084060
- Kumar et al. (2008) Kumar, P., Narayan, R., & Johnson, J. L. 2008, MNRAS, 388, 1729, doi: 10.1111/j.1365-2966.2008.13493.x
- Kyutoku et al. (2014) Kyutoku, K., Ioka, K., & Shibata, M. 2014, MNRAS, 437, L6, doi: 10.1093/mnrasl/slt128
- Lamb et al. (2019) Lamb, G. P., Lyman, J. D., Levan, A. J., et al. 2019, ApJ, 870, L15, doi: 10.3847/2041-8213/aaf96b
- Lee & Ramirez-Ruiz (2007) Lee, W. H., & Ramirez-Ruiz, E. 2007, New Journal of Physics, 9, 17, doi: 10.1088/1367-2630/9/1/017
- Margutti et al. (2018) Margutti, R., Alexander, K. D., Xie, X., et al. 2018, ApJ, 856, L18, doi: 10.3847/2041-8213/aab2ad
- McCully et al. (2017) McCully, C., Hiramatsu, D., Howell, D. A., et al. 2017, ApJ, 848, L32, doi: 10.3847/2041-8213/aa9111
- Metzger (2017) Metzger, B. D. 2017, Living Reviews in Relativity, 20, 3, doi: 10.1007/s41114-017-0006-z
- Metzger et al. (2008) Metzger, B. D., Piro, A. L., & Quataert, E. 2008, MNRAS, 390, 781, doi: 10.1111/j.1365-2966.2008.13789.x
- Metzger et al. (2010) Metzger, B. D., Martínez-Pinedo, G., Darbha, S., et al. 2010, MNRAS, 406, 2650, doi: 10.1111/j.1365-2966.2010.16864.x
- Michel (1988) Michel, F. C. 1988, Nature, 333, 644, doi: 10.1038/333644a0
- Mooley et al. (2018) Mooley, K. P., Deller, A. T., Gottlieb, O., et al. 2018, Nature, 561, 355, doi: 10.1038/s41586-018-0486-3
- Murase et al. (2018) Murase, K., Toomey, M. W., Fang, K., et al. 2018, ApJ, 854, 60, doi: 10.3847/1538-4357/aaa48a
- Nakar & Piran (2011) Nakar, E., & Piran, T. 2011, Nature, 478, 82, doi: 10.1038/nature10365
- Narayan et al. (2017) Narayan, R., Sa̧dowski, A., & Soria, R. 2017, MNRAS, 469, 2997, doi: 10.1093/mnras/stx1027
- Nathanail et al. (2021) Nathanail, A., Gill, R., Porth, O., Fromm, C. M., & Rezzolla, L. 2021, MNRAS, 502, 1843, doi: 10.1093/mnras/stab115
- Nicholl et al. (2017) Nicholl, M., Berger, E., Kasen, D., et al. 2017, ApJ, 848, L18, doi: 10.3847/2041-8213/aa9029
- Ogawa et al. (2017) Ogawa, T., Mineshige, S., Kawashima, T., Ohsuga, K., & Hashizume, K. 2017, PASJ, 69, 33, doi: 10.1093/pasj/psx006
- Ogilvie (1999) Ogilvie, G. I. 1999, MNRAS, 306, L9, doi: 10.1046/j.1365-8711.1999.02637.x
- Ohsuga et al. (2005) Ohsuga, K., Mori, M., Nakamoto, T., & Mineshige, S. 2005, ApJ, 628, 368, doi: 10.1086/430728
- Radice et al. (2016) Radice, D., Galeazzi, F., Lippuner, J., et al. 2016, MNRAS, 460, 3255, doi: 10.1093/mnras/stw1227
- Rees (1988) Rees, M. J. 1988, Nature, 333, 523, doi: 10.1038/333523a0
- Rossi & Begelman (2009) Rossi, E. M., & Begelman, M. C. 2009, MNRAS, 392, 1451, doi: 10.1111/j.1365-2966.2008.14139.x
- Rosswog (2007) Rosswog, S. 2007, MNRAS, 376, L48, doi: 10.1111/j.1745-3933.2007.00284.x
- Rowlinson et al. (2013) Rowlinson, A., O’Brien, P. T., Metzger, B. D., Tanvir, N. R., & Levan, A. J. 2013, MNRAS, 430, 1061, doi: 10.1093/mnras/sts683
- Schnittman et al. (2013) Schnittman, J. D., Krolik, J. H., & Noble, S. C. 2013, ApJ, 769, 156, doi: 10.1088/0004-637X/769/2/156
- Sekiguchi et al. (2015) Sekiguchi, Y., Kiuchi, K., Kyutoku, K., & Shibata, M. 2015, Phys. Rev. D, 91, 064059, doi: 10.1103/PhysRevD.91.064059
- Sekiguchi et al. (2016) Sekiguchi, Y., Kiuchi, K., Kyutoku, K., Shibata, M., & Taniguchi, K. 2016, Phys. Rev. D, 93, 124046, doi: 10.1103/PhysRevD.93.124046
- Shappee et al. (2017) Shappee, B. J., Simon, J. D., Drout, M. R., et al. 2017, Science, 358, 1574, doi: 10.1126/science.aaq0186
- Sądowski & Narayan (2016) Sądowski, A., & Narayan, R. 2016, MNRAS, 456, 3929, doi: 10.1093/mnras/stv2941
- Smartt et al. (2017) Smartt, S. J., Chen, T. W., Jerkstrand, A., et al. 2017, Nature, 551, 75, doi: 10.1038/nature24303
- Soares-Santos et al. (2017) Soares-Santos, M., Holz, D. E., Annis, J., et al. 2017, ApJ, 848, L16, doi: 10.3847/2041-8213/aa9059
- Takahashi & Ioka (2020) Takahashi, K., & Ioka, K. 2020, MNRAS, 497, 1217, doi: 10.1093/mnras/staa1984
- Takahashi & Ioka (2021) —. 2021, MNRAS, 501, 5746, doi: 10.1093/mnras/stab032
- Takami et al. (2014) Takami, H., Kyutoku, K., & Ioka, K. 2014, Phys. Rev. D, 89, 063006, doi: 10.1103/PhysRevD.89.063006
- Tanaka et al. (2017) Tanaka, M., Utsumi, Y., Mazzali, P. A., et al. 2017, PASJ, 69, 102, doi: 10.1093/pasj/psx121
- Tanvir et al. (2017) Tanvir, N. R., Levan, A. J., González-Fernández, C., et al. 2017, ApJ, 848, L27, doi: 10.3847/2041-8213/aa90b6
- Troja et al. (2017) Troja, E., Piro, L., van Eerten, H., et al. 2017, Nature, 551, 71, doi: 10.1038/nature24290
- Troja et al. (2019) Troja, E., van Eerten, H., Ryan, G., et al. 2019, MNRAS, 489, 1919, doi: 10.1093/mnras/stz2248
- Troja et al. (2020) Troja, E., van Eerten, H., Zhang, B., et al. 2020, MNRAS, 498, 5643, doi: 10.1093/mnras/staa2626
- Villar et al. (2017) Villar, V. A., Guillochon, J., Berger, E., et al. 2017, ApJ, 851, L21, doi: 10.3847/2041-8213/aa9c84
- Wanajo et al. (2014) Wanajo, S., Sekiguchi, Y., Nishimura, N., et al. 2014, ApJ, 789, L39, doi: 10.1088/2041-8205/789/2/L39
- Watarai et al. (2000) Watarai, K.-y., Fukue, J., Takeuchi, M., & Mineshige, S. 2000, PASJ, 52, 133, doi: 10.1093/pasj/52.1.133
- Waxman et al. (2018) Waxman, E., Ofek, E. O., Kushnir, D., & Gal-Yam, A. 2018, MNRAS, 481, 3423, doi: 10.1093/mnras/sty2441