Raman Sideband Thermometry of Single Carbyne Chains
Abstract
We demonstrate Raman sideband thermometry of single carbyne chains confined in double-walled carbon nanotubes. Our results show that carbyne’s record-high Raman scattering cross section enables anti-Stokes Raman measurements at the single chain level. Using laser irradiation as a heating source, we exploit the temperature dependence of the anti-Stokes/Stokes ratio for local temperature sensing. Due to its molecular size and its large Raman cross section carbyne is an efficient probe for local temperature monitoring, with applications ranging from nanoelectronics to biology.
I Introduction
Raman spectroscopy is a versatile non-destructive characterization method that is widely used in nanomaterials research owing to its sensitivity to structural, electronic, optical, and chemical information Thomsen and Reich (2007); Jorio et al. (2011); Saito et al. (2016); Cong et al. (2020). At the heart of Raman spectroscopy lies the inelastic scattering of light by quantized lattice vibrations (phonons) Raman and Krishnan (1928). In the Raman process, an incoming photon can either create (Stokes) or annihilate (anti-Stokes) a phonon. The anti-Stokes process, being related to the annihilation of a phonon, can only occur if a phonon is already present in the system. The anti-Stokes scattering intensity is therefore proportional to the phonon population , which is governed by the local temperature. Stokes Raman scattering, on the other hand, can also occur in the absence of a phonon. As a result, the Stokes Raman scattering intensity is proportional to and thus the powers scattered into the anti-Stokes and the Stokes sideband differ. This sideband asymmetry provides direct access to the local temperature of the scattering material Cardona (1982); Jorio et al. (2011). However, for phonon energies larger than the thermal energy, phonon population numbers are very small (). Consequently, anti-Stokes signals of high-energy ( ) Raman modes are several orders of magnitude weaker than their Stokes counterparts. This discrepancy explains why for nanoscale systems, anti-Stokes spectra of high-energy Raman modes are only accessible for bulk quantities Brown et al. (2000), in solution Gordeev et al. (2017), or under exotic conditions such as surface-enhanced Raman scattering Maher et al. (2006), bias-induced hot phonon generation Oron-Carl and Krupke (2008), or correlated Stokes–anti-Stokes scattering Jorio et al. (2014). Raman sideband thermometry using a high-energy mode of an isolated system of molecular size has, to the best of our knowledge, not been demonstrated yet.
A promising candidate to close this gap is carbyne, the paradigmatic sp-hybridized and truly one-dimensional allotrope of carbon Heimann et al. (1999); Hirsch (2010). Carbyne has a resonant Raman scattering cross section per atom exceeding that of any other known material or molecule by at least two orders of magnitude Tschannen et al. (2020). This record-high Raman cross section suggests that the temperature dependence of carbyne’s C-mode optical phonon population can be exploited for local temperature measurements, despite the low occupation number associated with the high energy of the C-mode ( at room temperature). Carbyne-based Raman sideband thermometry could therefore provide for a practical method for in situ temperature monitoring on the nanoscale.
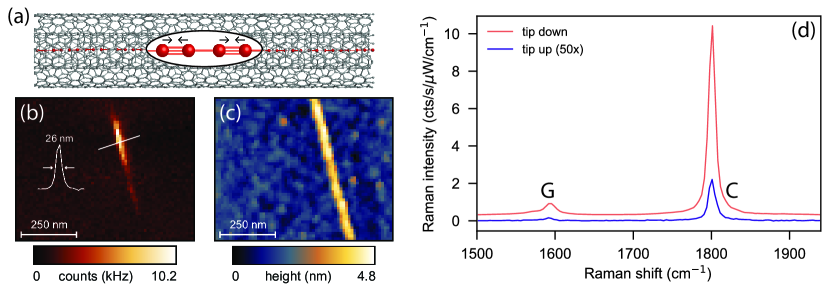
Carbyne has attracted significant interest due to its anticipated outstanding mechanical Liu et al. (2019), thermal Wang and Lin (2015), and electronic Tongay et al. (2004) properties. In particular, carbyne possesses a band gap that is sensitive to external perturbations Shi et al. (2017); Heeg et al. (2018a, b); Yang et al. (2020); Sharma et al. (2020) and can possibly be switched externally from a semiconducting to a metallic state Rusznyák et al. (2005); Wanko et al. (2016), which points out the potential of carbyne for nanoelectronic devices. While the synthesis of carbyne has long been challenging Gibtner et al. (2002); Chalifoux and Tykwinski (2010); Casari and Milani (2018), large progress has been made in recent years using carbon nanotubes as nanoreactors and protective nanocontainers Zhao et al. (2003); Fantini et al. (2006); Shi et al. (2011); Andrade et al. (2015); Shi et al. (2016); Zhang et al. (2018); Toma et al. (2019); Shi et al. (2021), as illustrated in Figure 1a. Raman studies have played an important role in the investigation of carbyne, but have so far been restricted to Stokes scattering Heeg et al. (2018b, a); Shi et al. (2017); Fantini et al. (2006); Andrade et al. (2015). Extending this scope to the anti-Stokes side of the spectrum is not only of practical relevance for sideband thermometry, but can aid in assessing fundamental material properties such as phonon lifetimes Song et al. (2008) and optical transition energies Souza Filho et al. (2004), as well as extending the mechanistic understanding of the Raman process Gordeev et al. (2017).
In this Letter, we demonstrate that carbyne’s unrivaled Raman scattering cross section enables anti-Stokes measurements at the single chain level. Using laser irradiation as a heating source, we investigate the temperature dependence of the anti-Stokes/Stokes ratio and demonstrate the applicability of carbyne as a nanoscale temperature sensor.
II Experimental
Carbyne chains are synthesized inside double-walled carbon nanotubes (DWCNTs) by high-temperature annealing according to the procedure described by Shi et al. Shi et al. (2016). The tubes are then dispersed on a thin glass coverslip following Ref. 19.
Our work makes use of both near-field and far-field measurements, each carried out on a separate Raman setup. The first step is to identify an isolated, continuous carbyne chain confined in a DWCNT. To this end, we make use of the nanoscale resolution provided by tip-enhanced Raman scattering (TERS). The TERS measurements are performed in a back-scattering configuration using a home-built setup Hartschuh et al. (2003); Lapin et al. (2015). As optical probe we use a plasmon-tunable tip pyramid designed to support localized surface plasmon resonances at the excitation energy of our laser (1.96 eV), which gives rise to particularly strong Raman scattering enhancement Vasconcelos et al. (2018); Oliveira et al. (2020); Miranda et al. (2020). Raman scattered photons are sent through a narrow band-pass filter that transmits only the spectral region of carbyne’s C-mode and then detected with an avalanche photodiode (APD). Optical and topographic images are formed simultaneously by raster-scanning [see Figure 1(b–c)]. Full spectra are recorded using a CCD-equipped spectrometer [Figure 1(d)].
In the second experimental step, we perform power-dependent far-field Raman measurements of the previously identified carbyne chain. The measurements are carried out in a backscattering geometry with a 100x air objective (NA 0.9). We align both the polarization of the excitation laser and the direction of polarized detection with the chain’s main axis, as detailed in Ref. Heeg et al. (2018a). A tunable dye laser serves as excitation source. To profit from resonant Raman scattering enhancement, we choose the photon energy of the laser to coincide with the band gap of the investigated carbyne chain (1.88 eV). We infer the band gap energy by exploiting its linear scaling with the measured C-mode Raman shift [1801 cm-1 according to Figure 1(d)] Shi et al. (2017); Heeg et al. (2018a, b). We point out that the band gap energy and Raman peak position of confined carbyne are both affected by the noncovalent interaction with the encasing host nanotube, which in turn depends on the nanotube chirality. Therefore, carbyne chains encapsulated in nanotubes of different chirality differ in their vibrational and electronic properties Shi et al. (2017); Heeg et al. (2018a, b).
For all power-dependent far-field measurements, we continuously monitor the power during signal acquisition. All power values reported in this work refer to mean values (averaged over the integration time) as measured before the back aperture of the objective. Also, instead of linearly varying the laser power, we alternate between higher and lower power values. This counteracts any systematic effects introduced by possible drifts of the sample with respect to the laser focus. The integration time for all Stokes (anti-Stokes) measurements is ().
III Results and Discussion
We first analyze anti-Stokes and Stokes spectra of a single confined carbyne chain, then discuss the power dependence of the anti-Stokes and Stokes Raman signals, and finally quantify the laser-induced heating using Raman sideband thermometry.
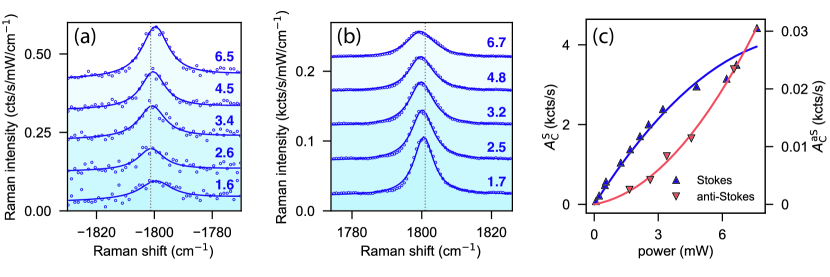
Figure 2 shows our power-dependent far-field Stokes and anti-Stokes measurements. A series of anti-Stokes spectra, measured at five different values of laser power, are displayed in Figure 2(a). We fit each spectrum with a Lorentzian lineshape on top of a linear background. In Figure 2(b) we display the corresponding series of Stokes spectra. We find equal Raman shifts for the Stokes and anti-Stokes peaks, as expected for a first-order single-resonance Raman process Cardona (1982); Jorio et al. (2011). Moreover, we observe a softening of the C-mode Raman shift with increasing laser power. Such frequency downshifts have been observed in temperature- and power-dependent Raman studies of a wide variety of materials Calizo et al. (2007); Sahoo et al. (2013); Late et al. (2014); Liu et al. (2019); Viana et al. (2020) and can be attributed to anharmonic terms of the lattice potential energy Jorio et al. (2011). We provide a brief discussion of this effect in the Supporting Information.
To shed light on the power dependence of the Raman signals, we extract the integrated C-peak anti-Stokes intensities from the fits in Figure 2(a), and the Stokes intensities from the fits in Figure 2(b). We plot these Stokes and anti-Stokes signals in Figure 2(c) as a function of excitation power. To illustrate the power-dependent behavior of the Stokes and anti-Stokes signals, we fit both sets of data with a second order polynomial, plotted in Figure 2(c) as solid lines. Inspection of Figure 2(c) demonstrates that the anti-Stokes and Stokes Raman signals show opposing trends with increasing excitation power. The anti-Stokes signal increases supra-linearly, which can be ascribed to the temperature dependence of the C-mode phonon population given by the Bose-Einstein distribution, , where is the phonon energy, is the Boltzmann constant, and the temperature. Laser-induced heating increases the phonon occupation number , which in turn gives rise to stronger anti-Stokes scattering. The Stokes signal , on the other hand, grows sub-linearly with laser power. We attribute this behavior to changes of the underlying Raman resonance due to laser heating. These changes can include a shift of the optical transition energy as well as an enhanced non-radiative damping of the photoexcited state. Models including such effects have been frequently employed in power- and temperature-dependent Raman studies of low-dimensional semiconductors Livneh and Sterer (2010); Fan et al. (2014); Zobeiri et al. (2020). Moreover, this explanation is in line with the strong C-mode Raman intensity increase observed by Shi et al. at cryogenic temperatures in bulk measurements Shi et al. (2016). We emphasise that while the exact mechanism behind the saturation of the Stokes Raman signal towards high excitation powers in Figure 2(c) requires further investigation, it has no relevant implications for Raman sideband thermometry. This robustness of the anti-Stokes/Stokes ratio of carbyne against changes of the electronic structure is a consequence of the large C-mode phonon energy, as elaborated in the final part of this section.
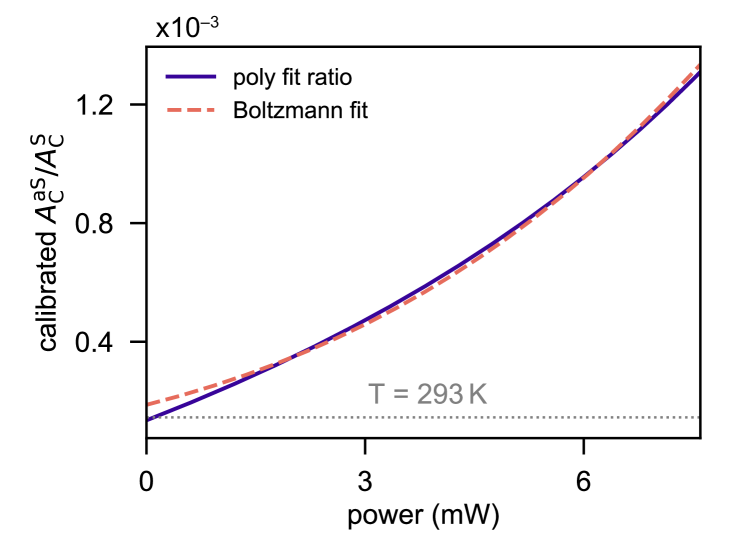
After having discussed the power-dependence of the anti-Stokes and Stokes signals separately, we now focus on their ratio and its power dependence. In Figure 3 we plot the ratio of the two polynomial fits from Figure 2(c) as a solid line. This curve represents our experimental anti-Stokes/Stokes ratio as a function of laser power. Note that going from Figure 2(c) to Figure 3, we have applied corrections of the anti-Stokes/Stokes ratio for the dependence of Raman scattering Cardona (1982); Jorio et al. (2011); Novotny and Hecht (2012) as well as for the frequency dependence of the instrument.
With this calibration, we expect the anti-Stokes/Stokes ratio to match the Boltzmann factor Cardona (1982); Jorio et al. (2011). Indeed, as shown in Figure 3, we find that laser irradiation increases the anti-Stokes/Stokes ratio and the associated phonon equilibrium temperature . Assuming that the temperature scales linearly with excitation power , we can extract the rate of laser-induced heating from fitting a modified Boltzmann factor, . The fit is shown as the red dashed line in Figure 3 and yields a heating rate of (2.4/1.8) . The free parameter , for which we obtain a value of 1.29, accounts for uncertainties of the calibration procedure. When extrapolated to zero power, both the anti-Stokes/Stokes ratio and the Boltzmann fit in Figure 3 closely coincide with the room-temperature Boltzmann factor (grey dotted line). This finding supports the accuracy of our calibration and corroborates that we excite the carbyne chain near its electronic resonance Heeg et al. (2018a); Brown et al. (2000); Fantini et al. (2004). Moreover, from the agreement of the two curves in Figure 3, we conclude that heating is the main contribution to the anti-Stokes/Stokes ratio as the laser power is increased. Thus, correlated Stokes–anti-Stokes scattering (a nonlinear process) does not play a sizeable role Jorio et al. (2014); Parra-Murillo et al. (2016). Based on our estimate of the heating rate , the power range depicted in Figure 3 corresponds to a temperature increase of roughly , which leads to the observed increase of the anti-Stokes/Stokes ratio by one order of magnitude.
In the Supporting Information we provide two separate consistency checks for our results. First, we correlate the laser-heating induced C-mode shifts with temperature-dependent measurements, which allows us to validate the heating rate estimate derived from the power-dependent anti-Stokes and Stokes measurements. Second, we reproduce Figures 2(c) and 3 with another carbyne chain of similar C-mode frequency and find excellent agreement between the two carbyne chains.
Let us discuss the prospects of single carbyne chains for nanoscale temperature sensing. In our work, we use resonant Raman scattering, that is, our excitation frequency is resonant with the carbyne band gap. As discussed above, we argue that the temperature dependence of this resonance with respect to energetic position and width explains the sub-linear dependence of the Stokes Raman signal on excitation power [see Figure 2(c)]. Importantly, a change in resonance influences the Stokes and anti-Stokes signals of carbyne to the same extent, thus rendering their ratio immune to changes of the resonance’s position and width. This robustness persists as long as the resonance shift remains small compared to the phonon energy. In this regime, only the resonance condition for the excitation laser plays a role (incoming resonance) Heeg et al. (2018a). However, too large of a temperature-induced resonance shift will bring the Stokes or anti-Stokes emission into resonance (outgoing resonance). In that regime, the sideband ratio starts to deviate from the Boltzmann factor Brown et al. (2000); Fantini et al. (2004), which complicates the extraction of a temperature.
From our measurements, we extract a heating-induced shift of the C-mode Raman peak of around [see Figure 2(b) and Supporting Information], corresponding to a thermal shift of the band gap energy of Shi et al. (2017); Heeg et al. (2018b). We underline that the direct correlation between Raman frequency and optical transition energy is an inherent property of confined carbyne Shi et al. (2017); Heeg et al. (2018a); Casari and Milani (2018) that sets carbyne apart from other nanomaterials for which the influence of temperature on electronic structure is more difficult to assess Zobeiri et al. (2020); Fan et al. (2014); Livneh and Sterer (2010); Zhou et al. (2006); Zhang et al. (2007). Given the much larger C-mode phonon energy of more than , the measured temperature-induced downshift of the band gap by has no relevant effect on the anti-Stokes/Stokes ratio of carbyne. Hence, in the context of Raman sideband thermometry, large phonon energies allow for reliable and robust temperature extraction from the anti-Stokes/Stokes ratio, regardless of changes of the electronic structure due to temperature variations. While anti-Stokes signals of high-energy phonons are in general challening to obtain due to low phonon occupation numbers, carbyne overcomes this difficulty by virtue of its record-high Raman scattering cross-section Tschannen et al. (2020), allowing for anti-Stokes measurements—and thus, robust sideband thermometry—at the single chain level.
IV Conclusion and Outlook
In conclusion, we have experimentally shown that the unparalleled Raman scattering cross section of carbyne Tschannen et al. (2020) enables anti-Stokes spectroscopy at the single chain level. Using laser irradiation as a heating source, we have investigated the temperature dependence of the Stokes and anti-Stokes Raman peaks. Finally, we have demonstrated that the anti-Stokes/Stokes ratio of carbyne provides a means for nanoscale temperature sensing. Our work therefore establishes a practical method for all-optical probing of temperature variations on the nanoscale, with potential applications in many areas of modern science and technology.
For instance, carbyne-based Raman sideband thermometry offers a promising perspective for thermal management on the length scale of emerging ultracompact device architectures, which is a key requirement for their functioning and control Balandin (2002); Cahill et al. (2003); van Erp et al. (2020). This prospect bears particular relevance in light of the recent progress in the synthesis of carbyne chains with tailored properties, which puts the integration of carbyne into the next generation of nanoelectronic devices firmly within reach Shi et al. (2018); Chimborazo et al. (2019); Shi et al. (2021).
The integration of carbyne within a living system offers further intriguing possibilities, ranging from tuning gene expression by simultaneously monitoring and controlling subcellular thermal gradients Kamei et al. (2009); Xu et al. (2012); Kumar and Wigge (2010) to investigating local tumor activity by mapping atypical thermogenesis at the single-cell level Lemos et al. (2019). On top, the demonstrated robustness of carbyne towards large-power continuous-wave laser irradiation for prolonged integration times adds to the list of advantages that would make it a powerful marker for use in biological imaging Tschannen et al. (2020).
Finally, our measurements constitute a starting point for the further investigation of anti-Stokes scattering in carbyne. In particular, exploring the outgoing anti-Stokes resonance might not only increase the absolute anti-Stokes signal, as shown for carbon nanotubes Gordeev et al. (2017), but also shed more light on the exact nature of optical transitions in carbyne Thomsen and Reich (2007); Tran et al. (2016); Heeg et al. (2018b).
Acknowledgements.
We thank Ben Weintrub for help with the temperature stage. This work has been supported by the Swiss National Science Foundation (Grant 200020_192362/1). T.L.V acknowledges financial support from CNPq (305881/2019-1 and 436381/2018-4) and MCTI (SibratecNano 21040*16). L.S. acknowledges the financial support from the National Natural Science Foundation of China (Grant 51902353) and Natural Science Foundation of Guangdong Province (Grant 2019A1515011227). S.H. gratefully acknowledges funding from the Deutsche Forschungsgemeinschaft through the Emmy Noether Programme (HE 8642/1-1).References
- Thomsen and Reich (2007) C. Thomsen and S. Reich, in Light Scattering in Solids IX: Novel Materials and Techniques, Top. Appl. Phys., Vol. 108, edited by M. Cardona and R. Merlin (Springer-Verlag Berlin Heidelberg, Berlin, Heidelberg, 2007) pp. 115–232.
- Jorio et al. (2011) A. Jorio, M. S. Dresselhaus, R. Saito, and G. Dresselhaus, Raman Spectroscopy in Graphene Related Systems (John Wiley & Sons, Weinheim, 2011).
- Saito et al. (2016) R. Saito, Y. Tatsumi, S. Huang, X. Ling, and M. S. Dresselhaus, J. Phys. Condens. Matter 28, 353002 (2016).
- Cong et al. (2020) X. Cong, X.-L. Liu, M.-L. Lin, and P.-H. Tan, npj 2D Materials and Applications 4, 13 (2020).
- Raman and Krishnan (1928) C. V. Raman and K. S. Krishnan, Nature 121, 501 (1928).
- Cardona (1982) M. Cardona, in Light Scattering in Solids II: Basic Concepts and Instrumentation, edited by M. Cardona and G. Güntherodt (Springer Berlin Heidelberg, Berlin, Heidelberg, 1982) pp. 19–178.
- Brown et al. (2000) S. D. M. Brown, P. Corio, A. Marucci, M. S. Dresselhaus, M. A. Pimenta, and K. Kneipp, Phys. Rev. B Condens. Matter 61, R5137 (2000).
- Gordeev et al. (2017) G. Gordeev, A. Jorio, P. Kusch, B. G. M. Vieira, B. Flavel, R. Krupke, E. B. Barros, and S. Reich, Phys. Rev. B Condens. Matter 96, 245415 (2017).
- Maher et al. (2006) R. C. Maher, L. F. Cohen, J. C. Gallop, E. C. Le Ru, and P. G. Etchegoin, The Journal of Physical Chemistry B 110, 6797 (2006).
- Oron-Carl and Krupke (2008) M. Oron-Carl and R. Krupke, Phys. Rev. Lett. 100, 127401 (2008).
- Jorio et al. (2014) A. Jorio, M. Kasperczyk, N. Clark, E. Neu, P. Maletinsky, A. Vijayaraghavan, and L. Novotny, Nano Lett. 14, 5687 (2014).
- Heimann et al. (1999) R. B. Heimann, S. E. Evsyukov, and L. Kavan, Carbyne and Carbynoid Structures (Springer Science & Business Media, Dordrecht, 1999).
- Hirsch (2010) A. Hirsch, Nat. Mater. 9, 868 (2010).
- Tschannen et al. (2020) C. D. Tschannen, G. Gordeev, S. Reich, L. Shi, T. Pichler, M. Frimmer, L. Novotny, and S. Heeg, Nano Letters 20, 6750 (2020).
- Liu et al. (2019) H.-N. Liu, X. Cong, M.-L. Lin, and P.-H. Tan, Carbon N. Y. 152, 451 (2019).
- Wang and Lin (2015) M. Wang and S. Lin, Sci. Rep. 5, 18122 (2015).
- Tongay et al. (2004) S. Tongay, R. T. Senger, S. Dag, and S. Ciraci, Phys. Rev. Lett. 93, 136404 (2004).
- Shi et al. (2017) L. Shi, P. Rohringer, M. Wanko, A. Rubio, S. Waßerroth, S. Reich, S. Cambré, W. Wenseleers, P. Ayala, and T. Pichler, Phys. Rev. Materials 1, 075601 (2017).
- Heeg et al. (2018a) S. Heeg, L. Shi, T. Pichler, and L. Novotny, Carbon N. Y. 139, 581 (2018a).
- Heeg et al. (2018b) S. Heeg, L. Shi, L. V. Poulikakos, T. Pichler, and L. Novotny, Nano Lett. 18, 5426 (2018b).
- Yang et al. (2020) X. Yang, C. Lv, Z. Yao, M. Yao, J. Qin, X. Li, L. Shi, M. Du, B. Liu, and C.-X. Shan, Carbon 159, 266 (2020).
- Sharma et al. (2020) K. Sharma, N. L. Costa, Y. A. Kim, H. Muramatsu, N. M. Barbosa Neto, L. G. P. Martins, J. Kong, A. R. Paschoal, and P. T. Araujo, Phys. Rev. Lett. 125, 105501 (2020).
- Rusznyák et al. (2005) A. Rusznyák, V. Zólyomi, J. Kürti, S. Yang, and M. Kertesz, Phys. Rev. B 72, 155420 (2005).
- Wanko et al. (2016) M. Wanko, S. Cahangirov, L. Shi, P. Rohringer, Z. J. Lapin, L. Novotny, P. Ayala, T. Pichler, and A. Rubio, Phys. Rev. B 94, 195422 (2016).
- Gibtner et al. (2002) T. Gibtner, F. Hampel, J.-P. Gisselbrecht, and A. Hirsch, Chem. Eur. J. 8, 408 (2002).
- Chalifoux and Tykwinski (2010) W. A. Chalifoux and R. R. Tykwinski, Nat. Chem. 2, 967 (2010).
- Casari and Milani (2018) C. S. Casari and A. Milani, MRS Communications 8, 207 (2018).
- Zhao et al. (2003) X. Zhao, Y. Ando, Y. Liu, M. Jinno, and T. Suzuki, Phys. Rev. Lett. 90, 187401 (2003).
- Fantini et al. (2006) C. Fantini, E. Cruz, A. Jorio, M. Terrones, H. Terrones, G. Van Lier, J.-C. Charlier, M. S. Dresselhaus, R. Saito, Y. A. Kim, T. Hayashi, H. Muramatsu, M. Endo, and M. A. Pimenta, Phys. Rev. B Condens. Matter 73, 193408 (2006).
- Shi et al. (2011) L. Shi, L. Sheng, L. Yu, K. An, Y. Ando, and X. Zhao, Nano Res. 4, 759 (2011).
- Andrade et al. (2015) N. F. Andrade, T. L. Vasconcelos, C. P. Gouvea, B. S. Archanjo, C. A. Achete, Y. A. Kim, M. Endo, C. Fantini, M. S. Dresselhaus, and A. G. Souza Filho, Carbon 90, 172 (2015).
- Shi et al. (2016) L. Shi, P. Rohringer, K. Suenaga, Y. Niimi, J. Kotakoski, J. C. Meyer, H. Peterlik, M. Wanko, S. Cahangirov, A. Rubio, Z. J. Lapin, L. Novotny, P. Ayala, and T. Pichler, Nat. Mater. 15, 634 (2016).
- Zhang et al. (2018) Y. Zhang, J. Zhao, Y. Fang, Y. Liu, and X. Zhao, Nanoscale 10, 17824 (2018).
- Toma et al. (2019) S. Toma, K. Asaka, M. Irita, and Y. Saito, Surf. Interface Anal. 51, 131 (2019).
- Shi et al. (2021) L. Shi, R. Senga, K. Suenaga, H. Kataura, T. Saito, A. P. Paz, A. Rubio, P. Ayala, and T. Pichler, Nano Lett. (2021), 10.1021/acs.nanolett.0c04482.
- Song et al. (2008) D. Song, F. Wang, G. Dukovic, M. Zheng, E. D. Semke, L. E. Brus, and T. F. Heinz, Phys. Rev. Lett. 100, 225503 (2008).
- Souza Filho et al. (2004) A. G. Souza Filho, S. G. Chou, G. G. Samsonidze, G. Dresselhaus, M. S. Dresselhaus, L. An, J. Liu, A. K. Swan, M. S. Ünlü, B. B. Goldberg, A. Jorio, A. Grüneis, and R. Saito, Phys. Rev. B Condens. Matter 69, 115428 (2004).
- Hartschuh et al. (2003) A. Hartschuh, E. J. Sánchez, X. S. Xie, and L. Novotny, Phys. Rev. Lett. 90, 095503 (2003).
- Lapin et al. (2015) Z. J. Lapin, R. Beams, L. G. Cançado, and L. Novotny, Faraday Discuss. 184, 193 (2015).
- Vasconcelos et al. (2018) T. L. Vasconcelos, B. S. Archanjo, B. S. Oliveira, R. Valaski, R. C. Cordeiro, H. G. Medeiros, C. Rabelo, A. Ribeiro, P. Ercius, C. A. Achete, A. Jorio, and L. G. Cançado, Advanced Optical Materials 6, 1800528 (2018).
- Oliveira et al. (2020) B. S. Oliveira, B. S. Archanjo, R. Valaski, C. A. Achete, L. G. Cançado, A. Jorio, and T. L. Vasconcelos, J. Chem. Phys. 153, 114201 (2020).
- Miranda et al. (2020) H. Miranda, C. Rabelo, T. L. Vasconcelos, L. G. Cançado, and A. Jorio, Phys. Status Solidi RRL 14, 2000212 (2020).
- Calizo et al. (2007) I. Calizo, A. A. Balandin, W. Bao, F. Miao, and C. N. Lau, Nano Lett. 7, 2645 (2007).
- Sahoo et al. (2013) S. Sahoo, A. P. S. Gaur, M. Ahmadi, M. J.-F. Guinel, and R. S. Katiyar, J. Phys. Chem. C 117, 9042 (2013).
- Late et al. (2014) D. J. Late, S. N. Shirodkar, U. V. Waghmare, V. P. Dravid, and C. N. R. Rao, Chemphyschem 15, 1592 (2014).
- Viana et al. (2020) B. C. Viana, R. S. Alencar, A. G. Vieira, V. Carozo, A. G. Souza Filho, J. Wang, C. da Luz-Lima, S. Feng, N. Perea-López, J. Zhu, and M. Terrones, Vibrational Spectroscopy 111, 103169 (2020).
- Livneh and Sterer (2010) T. Livneh and E. Sterer, Phys. Rev. B Condens. Matter 81, 195209 (2010).
- Fan et al. (2014) J.-H. Fan, P. Gao, A.-M. Zhang, B.-R. Zhu, H.-L. Zeng, X.-D. Cui, R. He, and Q.-M. Zhang, J. Appl. Phys. 115, 053527 (2014).
- Zobeiri et al. (2020) H. Zobeiri, S. Xu, Y. Yue, Q. Zhang, Y. Xie, and X. Wang, Nanoscale 12, 6064 (2020).
- Novotny and Hecht (2012) L. Novotny and B. Hecht, Principles of Nano-Optics (Cambridge University Press, Cambridge, 2012).
- Fantini et al. (2004) C. Fantini, A. Jorio, M. Souza, M. S. Strano, M. S. Dresselhaus, and M. A. Pimenta, Phys. Rev. Lett. 93, 147406 (2004).
- Parra-Murillo et al. (2016) C. A. Parra-Murillo, M. F. Santos, C. H. Monken, and A. Jorio, Phys. Rev. B 93, 125141 (2016).
- Zhou et al. (2006) Z. Zhou, X. Dou, L. Ci, L. Song, D. Liu, Y. Gao, J. Wang, L. Liu, W. Zhou, S. Xie, and D. Wan, J. Phys. Chem. B 110, 1206 (2006).
- Zhang et al. (2007) Y. Zhang, H. Son, J. Zhang, J. Kong, and Z. Liu, J. Phys. Chem. C 111, 1988 (2007).
- Balandin (2002) A. A. Balandin, IEEE Potentials 21, 11 (2002).
- Cahill et al. (2003) D. G. Cahill, W. K. Ford, K. E. Goodson, G. D. Mahan, A. Majumdar, H. J. Maris, R. Merlin, and S. R. Phillpot, J. Appl. Phys. 93, 793 (2003).
- van Erp et al. (2020) R. van Erp, R. Soleimanzadeh, L. Nela, G. Kampitsis, and E. Matioli, Nature 585, 211 (2020).
- Shi et al. (2018) L. Shi, K. Yanagi, K. Cao, U. Kaiser, P. Ayala, and T. Pichler, ACS Nano 12, 8477 (2018).
- Chimborazo et al. (2019) J. Chimborazo, T. Saito, T. Pichler, L. Shi, and P. Ayala, Appl. Phys. Lett. 115, 103102 (2019).
- Kamei et al. (2009) Y. Kamei, M. Suzuki, K. Watanabe, K. Fujimori, T. Kawasaki, T. Deguchi, Y. Yoneda, T. Todo, S. Takagi, T. Funatsu, and S. Yuba, Nat. Methods 6, 79 (2009).
- Xu et al. (2012) G. Xu, S. M. Stevens, Jr, F. Kobeissy, H. Brown, S. McClung, M. S. Gold, and D. R. Borchelt, PLoS One 7, e49021 (2012).
- Kumar and Wigge (2010) S. V. Kumar and P. A. Wigge, Cell 140, 136 (2010).
- Lemos et al. (2019) D. Lemos, T. Oliveira, L. Martins, V. R. de Azevedo, M. F. Rodrigues, L. A. Ketzer, and F. D. Rumjanek, Front. Oncol. 9, 1430 (2019).
- Tran et al. (2016) H. N. Tran, J.-C. Blancon, J.-R. Huntzinger, R. Arenal, V. N. Popov, A. A. Zahab, A. Ayari, A. San-Miguel, F. Vallée, N. Del Fatti, J.-L. Sauvajol, and M. Paillet, Phys. Rev. B Condens. Matter 94, 075430 (2016).