A comparative study of the strength of flickering in cataclysmic variables
Abstract
Flickering is a universal phenomenon in accreting astronomical systems which still defies detailed physical understanding. It is particularly evident in cataclysmic variables (CVs). Attempting to define boundary conditions for models, the strength of the flickering is measured in several thousand light curves of more than 100 CVs. The flickering amplitude is parameterized by the FWHM of a Gaussian fit to the magnitude distribution of data points in a light curve. This quantity requires several corrections before a comparison between different sources can be made. While no correlations of the flickering strength with simple parameters such as component masses, orbital inclination or period were detected, a dependence on the absolute magnitude of the primary component and on the CV subtype is found. In particular, flickering in VY Scl tpye novalike variables is systematically stronger than in UX UMa type novalikes. The broadband spectrum of the flickering light source can be fit by simple models but shows excess in the band. When the data permitted to investigate the flickering strength as a function of orbital phase in eclipsing CVs, such a dependence was found, but it is different for different systems. Surprisingly, there are also indications for variations of the flickering strength with the superhump phase in novalike variables with permanent superhumps. In dwarf novae, the flickering amplitude is high during quiescence, drops quickly at an intermediate magnitude when the system enters into (or returns from) an outburst and, on average, remains constant above a given brightness threshold.
keywords:
stars: activity – (stars:) binaries: close – (stars:) novae, cataclysmic variablesRemark on the text
The main body of this paper is identical to MNRAS 503, 953 (2021). However, I present here extended versions of Appendices A and B. Appendix D is not part of the MNRAS article.
1 Introduction
Flickering is a phenomenon normally associated to the accretion of mass onto a central object. It occurs to a more or less obvious degree in astronomical systems as diverse as Active Galactic Nuclei (Garcia et al., 1999, and references therein), certain stages of star formation such as T Tau stars (Herbst & Shevchenko, 1999; Kenyon et al., 2000, and references therein), X-ray binaries (van der Klis, 2004) or some (but not all) symbiotic stars (Dobrzycka et al., 1996; Sokoloski et al., 2001). In the optical range flickering is by far most conspicuous in cataclysmic variables (CVs) which thus provide the most suitable test bed for studies of the properties and the origin of this phenomenon.
CVs are close binary stars where a late type companion – the secondary – which is in most cases on or close to the main sequence fills its Roche lobe and transfers matter to a white dwarf primary. In general, conservation of angular momentum forces this material to form an accretion disk around the white dwarf where viscosity causes it to slowly move inwards and to finally settle on the surface of the compact star. In optical light this disk is almost always the most luminous part of the system. If, however, the white dwarf possesses a strong magnetic field, the disk may be truncated in its inner part or its formation may be inhibited altogether, and the matter is guided along the field lines to regions close to the magnetic poles of the white dwarf. For a comprehensive description of most aspects of CVs and their classification into subgroups, see, e.g., Warner (1995).
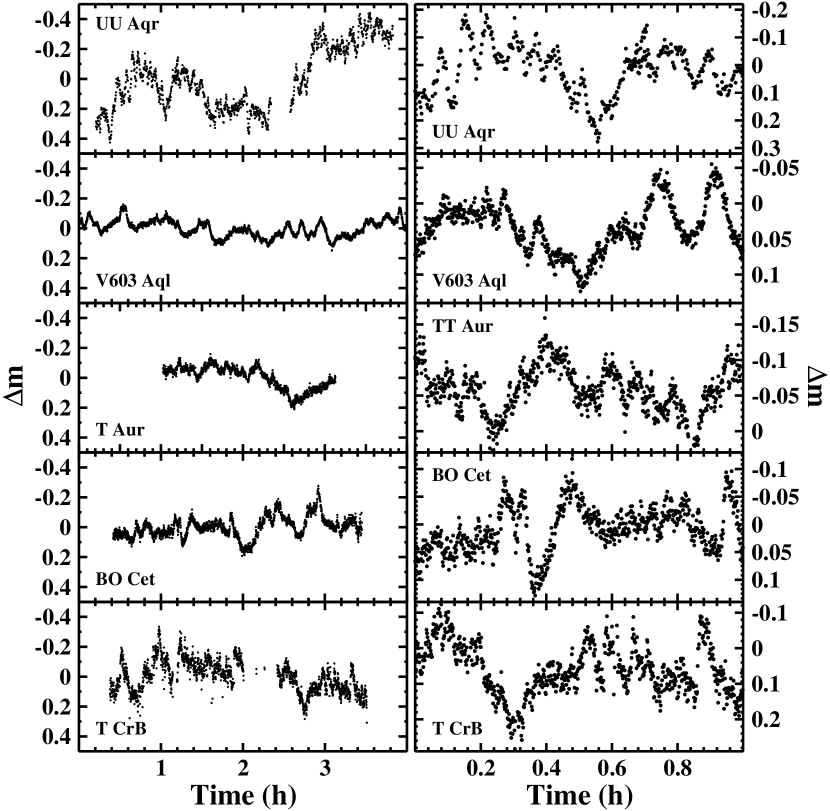
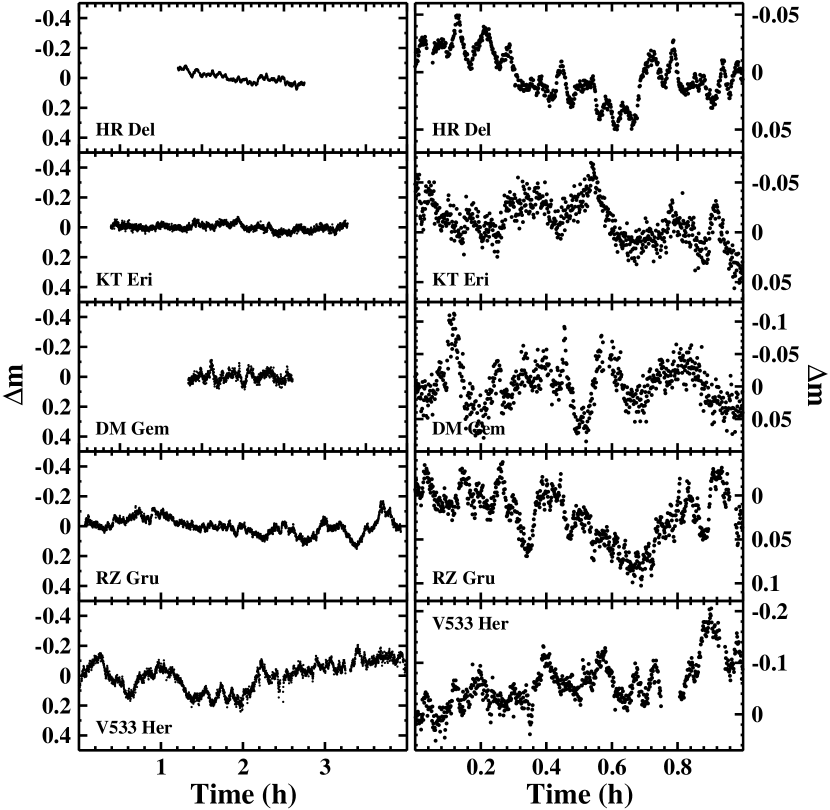
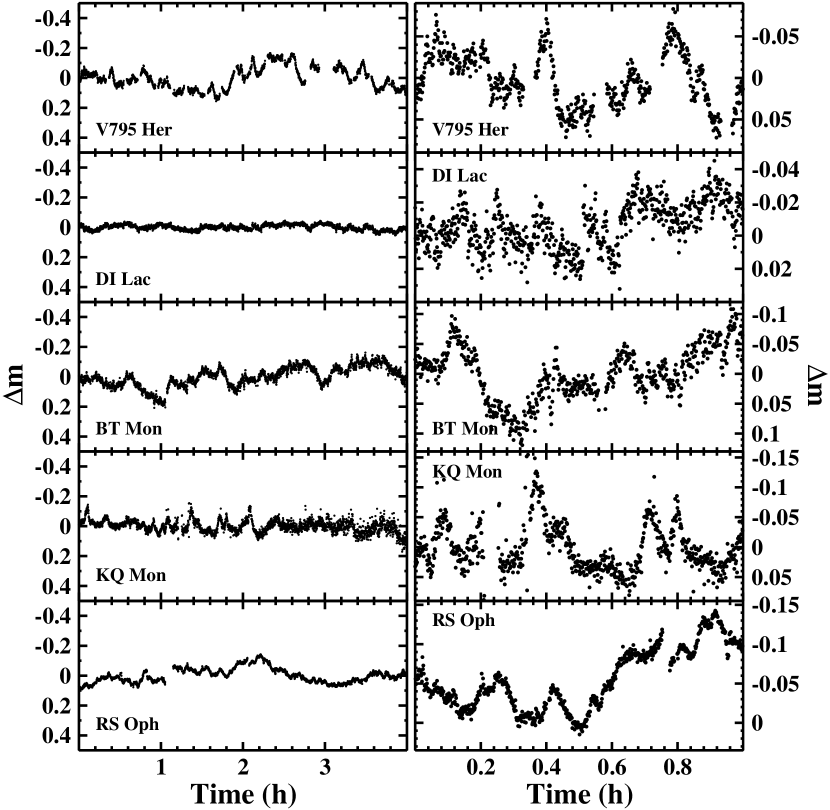
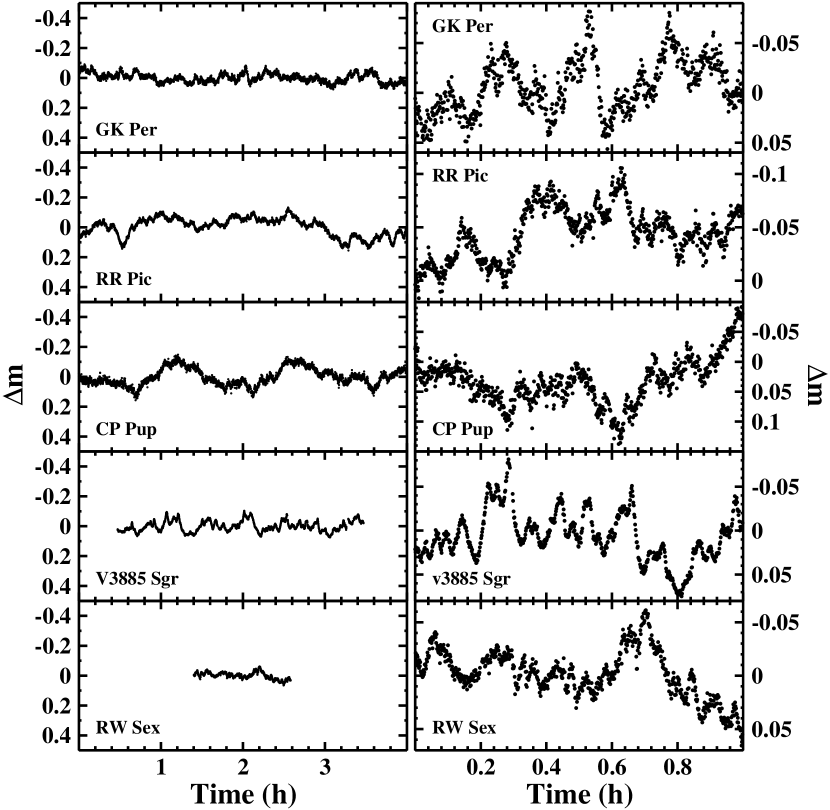
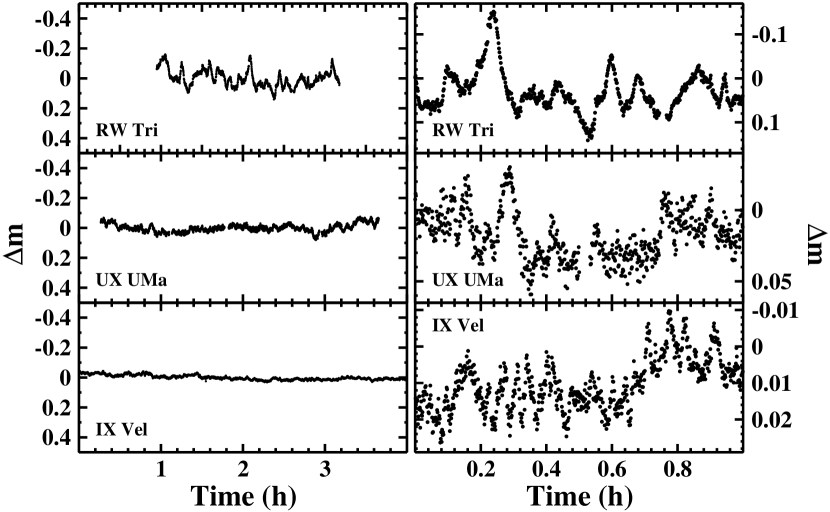
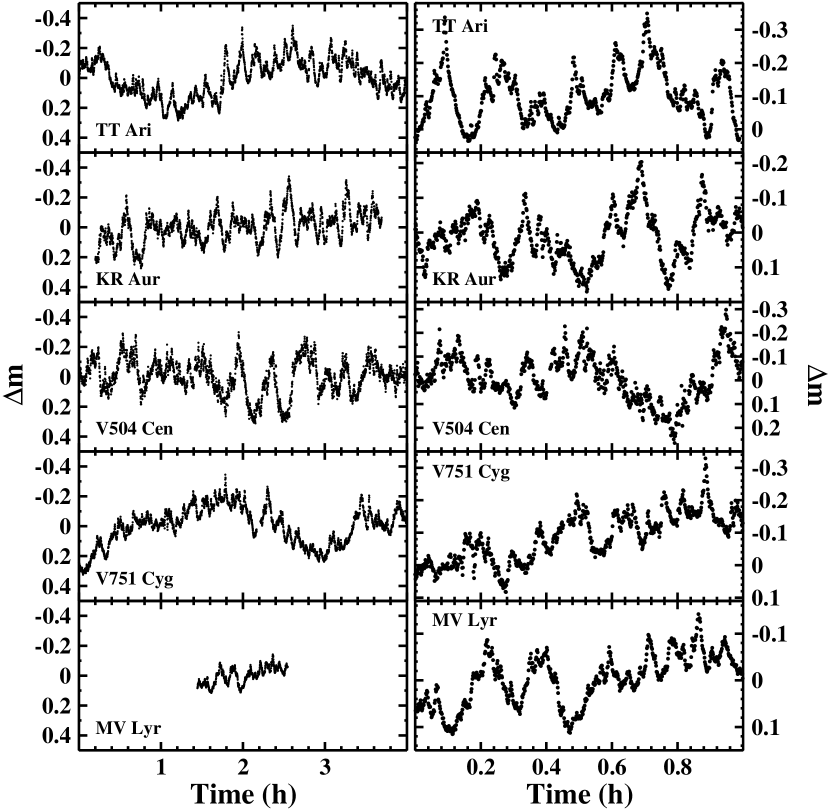
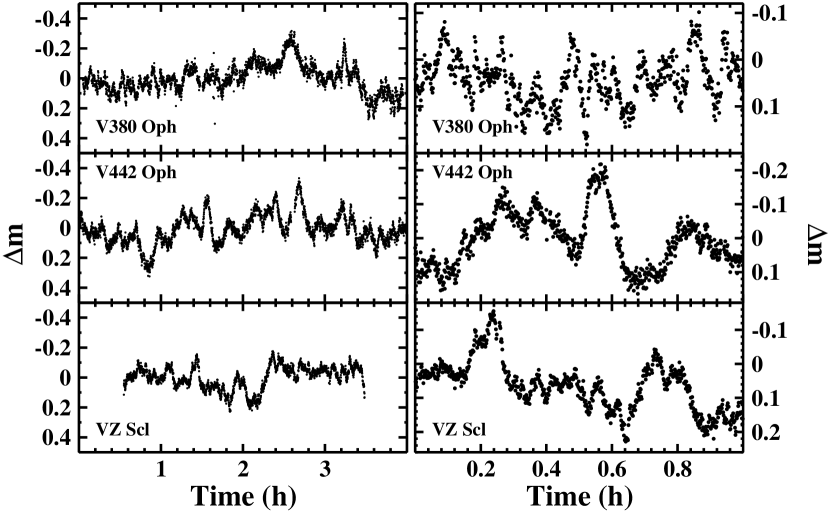
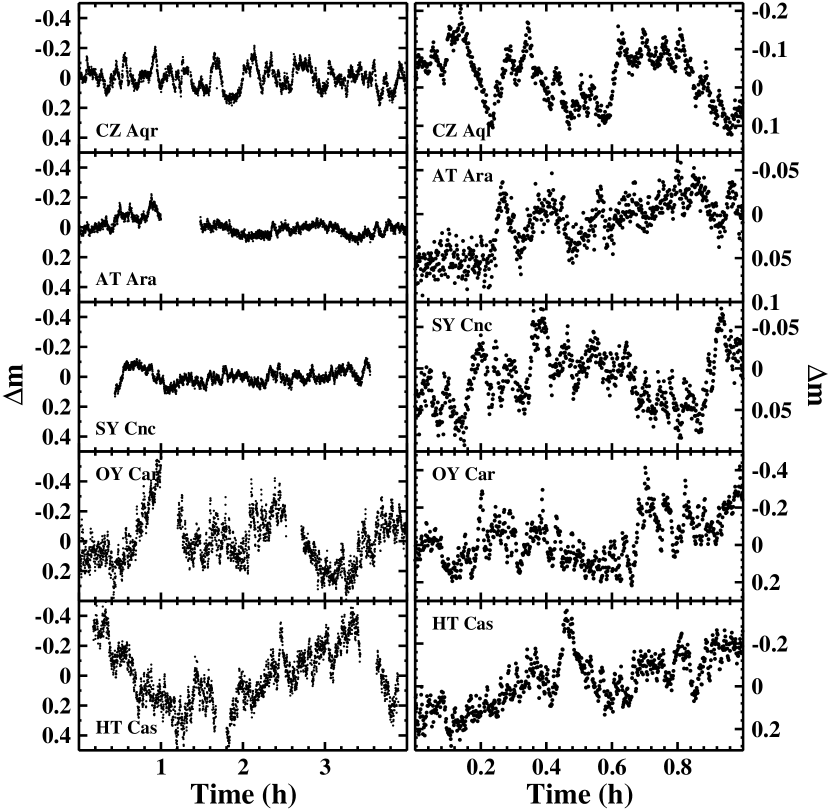
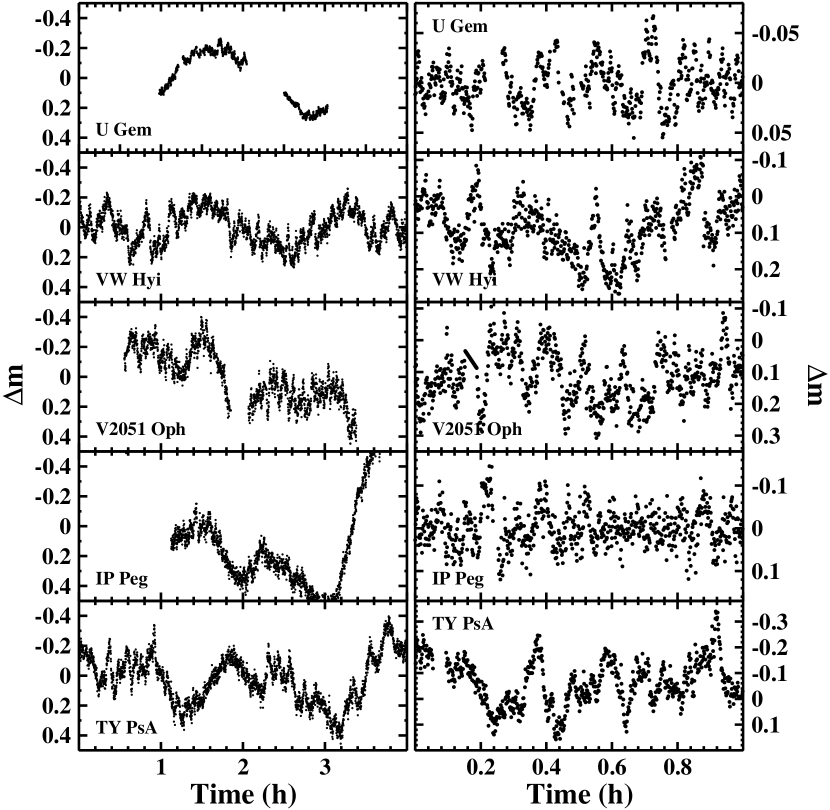
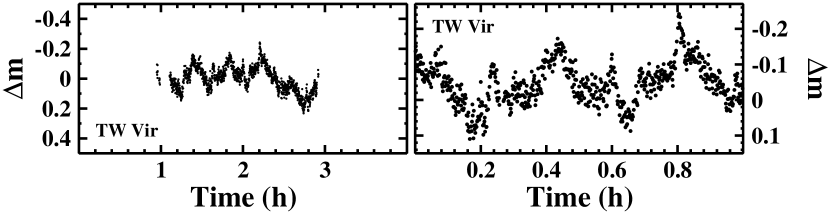
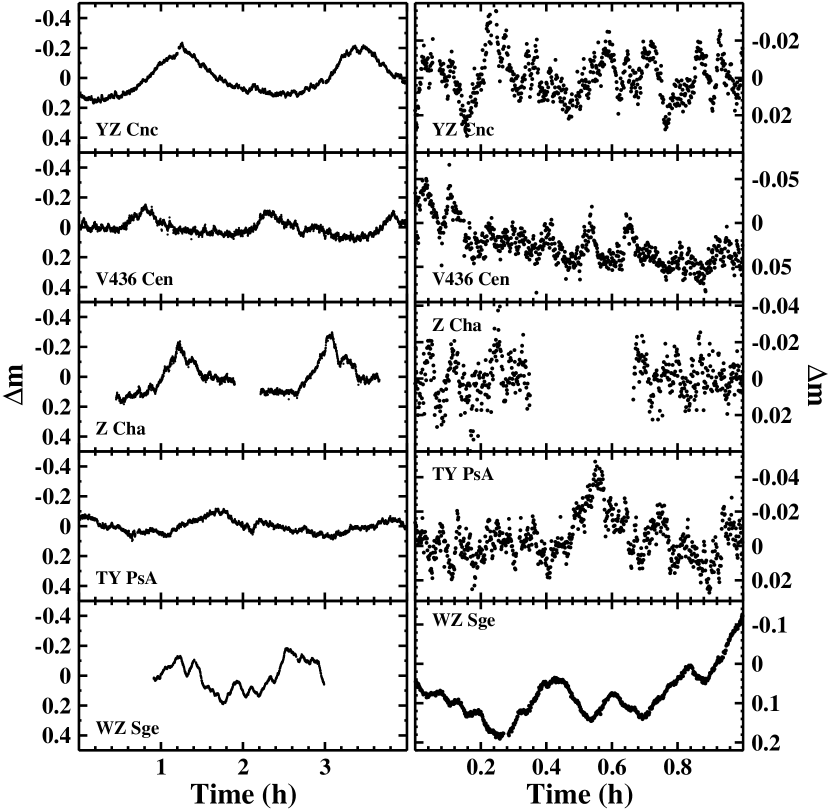
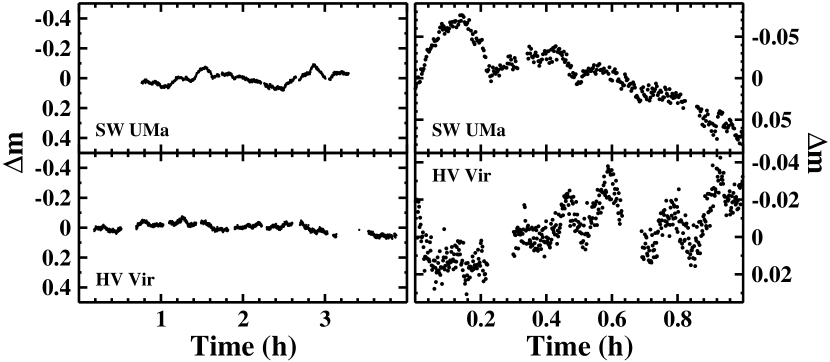
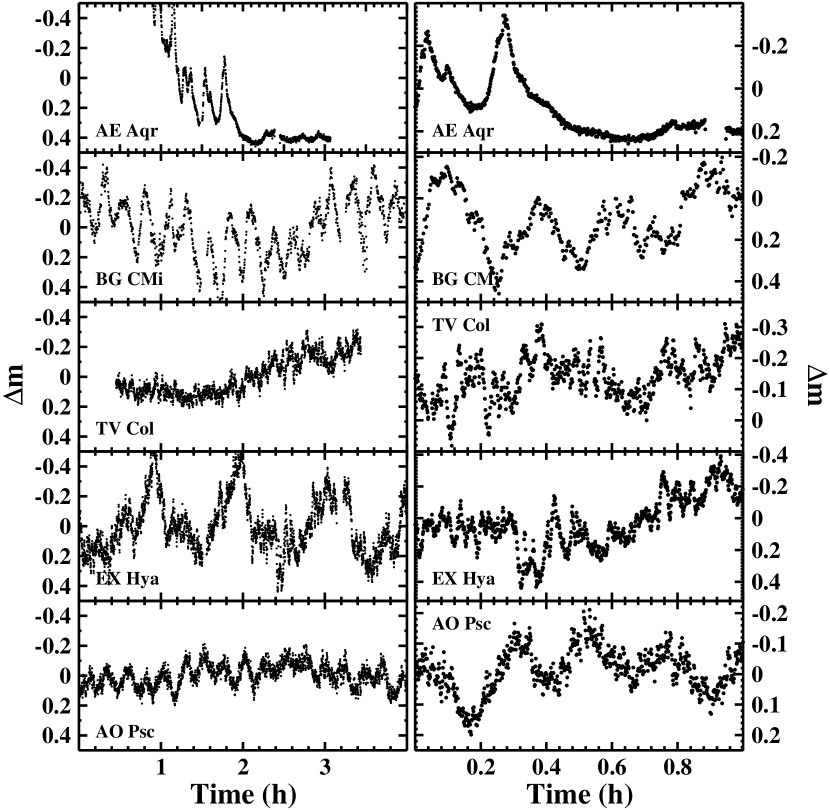
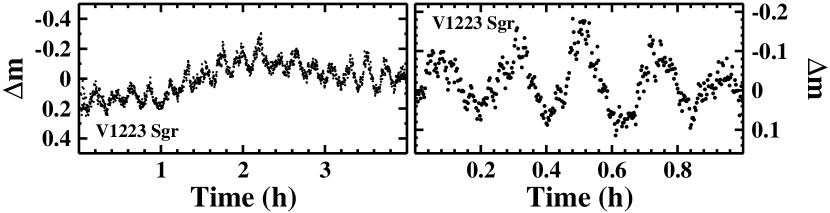
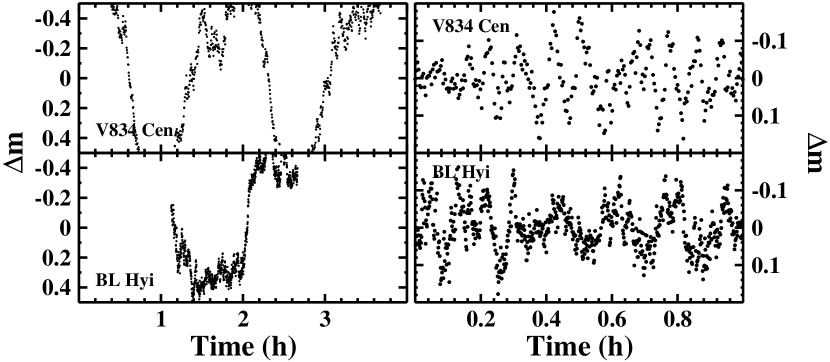
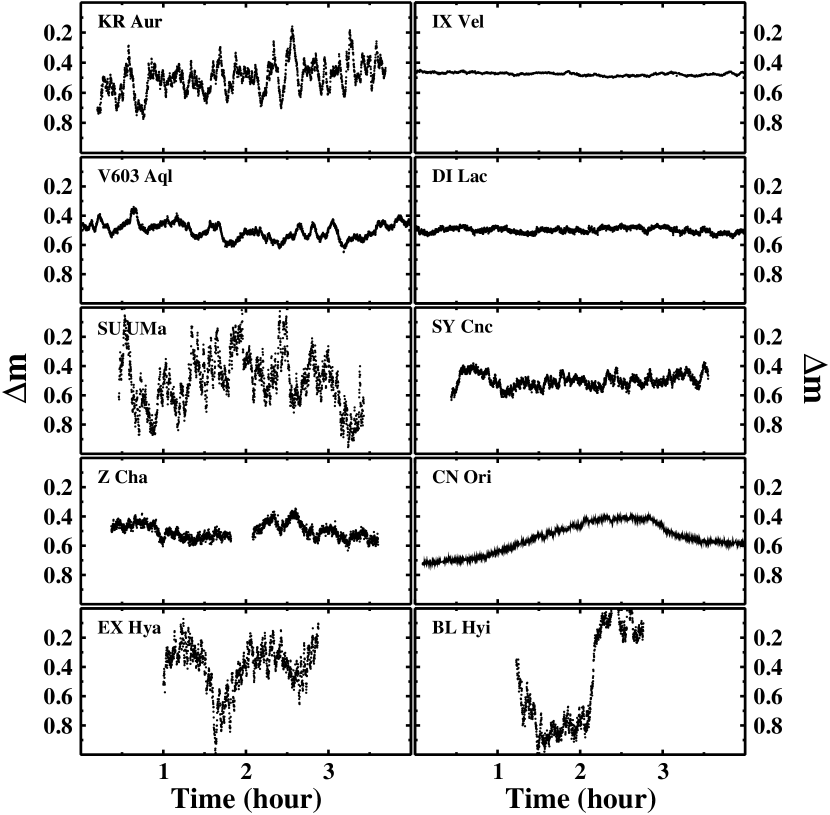
Flickering manifests itself most obviously as a continuous series of apparently stochastically distributed overlapping flares which, in CVs, occur on time scales of the order of minutes (often superposed upon variations on longer time scales and of different origin). Their amplitudes depend heavily on the individual system and its momentary photometric state, and can range from a few millimagnitudes to more than an entire magnitude. A few examples, giving an impression of its diversity, are shown in Fig. 1, drawn all on the same time and magnitude scale. From top to bottom each row shows two light curves of novalike variables, old novae, dwarf novae in quiescence and in outburst, and magnetic CVs [an intermediate polar (left) and a AM Her star (right)]. Many more examples are shown in D which contains an atlas of flickering light curves
Following the pioneering study of Bruch (1992a) an increasing number of papers dealing with phenomenological aspects of flickering have been published. An overview of the different topics covered by these efforts is given in the introduction of Bruch (2015) to which the reader is referred for more details and further references.
All the divers objects which exhibit flickering have in common some kind of mass accretion onto a central object. Most often, albeit not always, it occurs by means of an accretion disk around a central star. Models aimed to explain the origin of flickering in disk dominated CVs have been put forward repeatedly (Kley & Papaloizou, 1997; Lyubarskii, 1997; Yonehara et al., 1997; Pavlidou et al., 2001; Pearson et al., 2005; Dobrotka et al., 2012; Scaringi et al., 2014). Many of them are conceptually similar, interpreting the flickering frequency spectrum in terms of the propagation of disturbances within the accretion disk. However, the origin and the nature of the supposed disturbances are not identified, and neither do we have a good insight in the emission mechanism which leads to the observed flickering.
Although the efforts of the past decades have widely enlarged our knowledge about flickering, a deep understanding has still not been achieved. Many of the publications of the past deal with the temporal (frequency) behaviour of the flickering. While this is an important approach, another dimension characterizing flickering has by far not as thoroughly been explored, i.e., its strength as given by its amplitude, which can be drastically different from one system to the next as is evident from Fig. 1. An exception is the wavelet study of Fritz & Bruch (1998) which constitutes an attempt to indirectly quantify simultaneously the temporal behaviour of the flickering and its strength by analyzing the scalegram (Scargle et al., 1993) properties of light curves. Here, a new approach is introduced to measure objectively the flickering amplitude in a variety of light curves with divers characteristics and to search for systematic properties in a large number of CVs.
The present study is based on several thousand light curves of more than 100 systems of most kinds of cataclysmic variables and deals exclusively with optical data. Since it is not trivial to measure the strength of the flickering in an objective manner I first address this question in Sect. 2 before briefly describing the vast observational material used in this investigation in Sect. 3. Results are then presented and analysed in Sect. 4, and an assessment is attempted in Sect. 5. Finally, the main findings of this study are summarized in Sect. 6.
2 How to measure the flickering amplitude?
There may be many ways to define what exactly is to be understood under the term “flickering amplitude”. The simplest approach, taking it to be the difference between the maximum and the minimum in a flickering light curve is not appropriate even in the absence of some disturbing effects which will be enumerated below, because it depends strongly on individual data points which mark the extremes. A more suitable way is an analysis of the distribution of data points in a flickering light curve which considers all data.
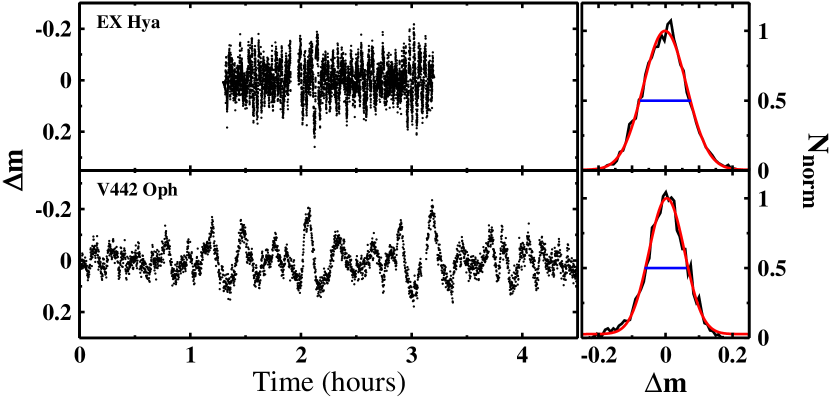
As an example, Fig. 2 shows in the left frames the observed light curves of the intermediate polar EX Hya and the novalike variable V442 Oph. Variations on orbital (V442 Oph) and white dwarf rotation time scales (EX Hya) have been subtracted. The flickering characteristics in the two systems are markedly different: while EX Hya exhibits a rapid succession of flares of similar amplitude and time scales, the flare amplitudes in V442 Oph encompass a much wider range and their time scales increase with growing amplitude111This underlines the importance of the temporal dimension of the flickering behaviour – not to be investigated in this study – in addition to the flickering strength. It should be noted, however, that EX Hya is a rather extreme case, the difference of the temporal characteristics are much less expressed in the light curves of the large majority of CVs. Unlike the bulk of objects regarded here, it is a magenetic systems in which flickering is likely caused by reprocessing of X-rays generated at the footpoint of accretion columns (Semena et al., 2014). EX Hya was chosen here in order to illustrate the important point that adopting as flickering amplitude the simple difference between the highest and lowest data points can be misleading.. The right frames of the figure contain the normalized distribution function of the magnitude points in the light curves (black) and the best fit Gauss function (red). The latter excellently follows the observed distribution, indicating that the width of the Gaussian is a good and robust measure of the flickering strength. To be definite, I will regard the FWHM (full width at half maximum) of a Gaussian fit to the distribution of magnitude points in a flickering light curve, i.e., the blue bars in the examples shown in the figure, as the parameter describing the flickering amplitude. I will hitherto denote this quantity as , and it is expressed in magnitudes. It must be stressed that is, of course, not the true difference between the brightest and the faintest magnitude in the light curve but rather a proxy. Indeed, is significantly smaller for V442 Oph (0.12) than for EX Hya (0.15), although the difference between the highest and lowest data points in the light curve are about the same in both cases. While is significantly smaller than the true difference, it is a much more robust value.
Simple as the measurement of might appear at first glance, there are some pitfalls which introduce errors or uncertainties into the results. Therefore, some precautions have to be taken which will now be addressed in turn.
2.1 The time base of the flickering light curve
Due to the finite length of an observed light curve one can never be sure that the measured amplitude is not only a lower limit to the real amplitude since the star may exhibit stronger flares which just were not seen in the sampled time interval. Similarly, may be overestimated if by chance some unusually strong flares happen to fall within the observing window. This effect can be avoided if only light curves are selected which have a time base sufficiently long for the flickering within this interval to be representative.
Extensive tests with artificial light curves simulating flickering along the lines detailed in section 2 of Bruch (2015) show that using a time base of the order of 1 hour or longer is sufficient to avoid a systematic error of due to the currently discussed effect. This is the reason why only light curves longer than this limit were chosen for this study (see Sect. 3).
2.2 Separating variations unrelated to flickering
Apart from variations due to flickering, a CV light curve often contains modulations caused by other effects. This may be the bright spot (or accretion columns in magnetic systems) rotating into view, superhumps in SU UMa stars in superoutburst or in permanent superhumpers, ellipsoidal variations in systems where the secondary star contributes significantly to the total light, variations due to transition phases at the onset or the decline from outbursts or low states, etc. Such effects must be separated from flickering before its amplitude can be measured.
As long as the time scale of such unrelated modulations are longer than the flickering time scale, they can be removed by subtracting a low pass filtered version of a light curve from the original one. A suitable filter should be able to follow strong and sometimes steep variations such as superhumps in SU UMa type dwarf novae, or variations caused by the rotation into and out of view of particular system components, but it should leave the flickering flares untouched.
After tests with different filters I found that for the present purpose a Savitzky-Golay filter (Savitzky & Golay, 1964) is most appropriate. It has basically two free parameters, which is the cutoff time scale and the degree of the smoothing polynomial used by the algorithm. The higher the degree of the latter, the more details are preserved in the smoothed light curve. I found that a 4th degree polynomial yields satisfactory results. It is thus used throughout.
The performance of the Savitzky-Golay filter is demonstrated on four examples in Fig. 3. The frames show a 3 h section of the light curves of four CVs of different types and photometric states, together with their filtered versions, using min (blue), 60 min (red) and 120 min (green). The light curve of the SU UMa type dwarf nova V436 Cen was taken during superoutburst and contains two superhumps. The polar AM Her has a pronounced hump caused by the varying aspect of the accretion pole on the white dwarf. The short period eclipsing dwarf nova V893 Sco (eclipses have been removed from the light curve) shows erratic variations on longer time scales superposed on rapid flickering. Finally, the novalike variable TT Ari exhibits strong flickering flares on a comparatively long time scale, apart from a clear modulation due to the permanent superhump observed in this system. The 30 min cut-off filter (blue) follows the variations occurring on longer time scales satisfactorily in most light curves, but in TT Ari it also follows some stronger flickering flares. The 120 min cut-off filter (green), while appearing to be satisfactory in the cases of AM Her and TT Ari demonstrates some deficiencies in the case of V893 Sco, and completely fails to follow the superhumps in V436 Cen. On the other hand the 60 min cut-off filter (red) appears to be a good compromise. It is able to satisfactorily follow the variations apparently not caused by flickering, but leaves the flickering largely untouched.

The same behaviour is observed in the light curves of other CVs included in this study. Thus, I will adopt min as the standard, and will henceforth denominate the flickering amplitude as in order to indicate that it only refers to variations on time scales shorter than 60 min. It must therefore be kept in mind that only flickering on time scales below this limit will be seen.
2.3 Data noise correction
Data noise represents a serious problem. It will increase the measured amplitude because on the statistical mean it leads to an apparent increase of the brightness of at least some of the data points in the vicinity of a flare maximum beyond its true value. Similarly, noise will decrease the magnitude of some of the data points close to the minima between flickering flares below the true minima. Thus, the apparent total amplitude is overestimated.
Assuming data noise to be distributed normally with a standard deviation , a correction is easy. Since flickering can also be approximated by a Gaussian distribution, the standard deviation of the data points due to flickering and add in quadrature to the observed standard deviation . Thus, the noise-corrected value of is:
| (1) |
where is the ratio between the FWHM and the standard deviation of a Gaussian.
The problem is, of course, the determination of the noise level which, in general, is composed of different components such as Poisson noise, detector readout noise, atmospheric perturbations, etc. In particular at low flickering levels its amplitude may be comparable to random noise and a corresponding correction to is important.
For the large majority of light curves used here no direct information about the noise level is available. However, the well known red noise properties of flickering offer a way to solve this problem. Since the pioneering studies of Elsworth & James (1982, 1986) it is common knowledge that at high frequencies the power spectra of cataclysmic variable light curves are in most cases characterized by red noise caused by flickering, meaning that , where is the power, the frequency and the spectral index. At very high frequencies white noise due to (approximately) Gaussian measurement errors takes over. On the double logarithmic scale, red noise causes a linear drop of the power with increasing frequency with a slope of , and white noise results in a constant power level. Thus, the power spectrum of a simulated pure noise light curve, sampled in the same way as the real one, and adjusting the noise amplitude such that the power matches the white noise part of the power spectrum of the real data, provides the noise amplitude of the latter.
As an example, Fig. 4 shows the power spectrum of the KR Aur light curve (upper left frame of Fig. 1) on a double logarithmic scale as black dots, calculated using a constant (linear) step width in frequency. It shows the expected red noise – white noise properties mentioned above, but is seen to scatter over several orders of magnitude in power. Therefore, binning the data in constant intervals of is appropriate. The results are shown as red dots (vertically offset from the original power spectrum for clarity). While at low frequencies the scatter remains quite large, the higher frequency red noise part now becomes more obvious, as does the white noise part at very high frequencies. The blue dots represent the average of several power spectra of light curves containing pure Gaussian noise, sampled in the same way as the original data. The standard deviation of the noise has been chosen such that the power spectrum matches the white noise part of the KR Aur power spectrum. can thus be identified with the noise level in the real data.
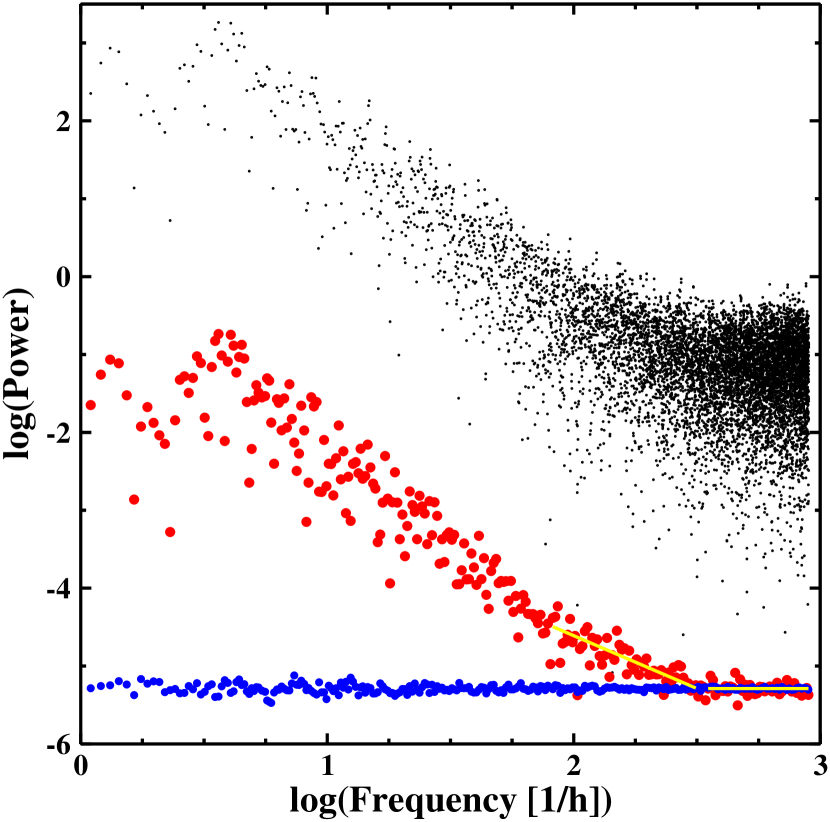
For this to work, the power spectra must not be normalized. Therefore, the often used Lomb-Scargle algorithm (Lomb, 1976; Scargle, 1982) with the normalization of Horne & Baliunas (1986) is not appropriate. Instead, the power spectra are calculated following Deeming (1975).
For light curves with a comparatively low time resolution and a low noise level the Nyquist frequency may be lower than the frequency where white noise starts to dominate in the power spectra. Then, the level of the high frequency end of the power spectra provides only an upper limit for the noise. Using this limit to correct (Eq. 1) leads to a systematic underestimation of the flickering amplitude. It is found that on average derived from different light curves of the same object in the same photometric state is reduced by 5% when an upper limit instead of the true noise level is adopted. This is much less than the natural scatter of between light curves. In order to take this systematic effect into account at least on the statistical mean, if not individually, a corresponding correction is applied to the final values of the flickering amplitude in these cases.
2.4 Time resolution correction
The time resolution of a light curve may also influence the measured flickering amplitude. If the integration time for the data points in a light curve is not short compared to the time scale of rapid flickering variations, the finite length of the integration will act as a low pass filter, smoothing the light curve, reducing the apparent magnitude of flickering peaks and diminishing the depth of the valleys between them. Thus, the apparent amplitude of flickering gets smaller. Therefore, in order to compare the amplitude measured in light curves taken with different time resolutions, a correction must be applied in order to reduce the amplitude to a standard time resolution. I arbitrarily choose this to be 5 s because many of the highest quality light curves used in this study were sampled with this cadence.
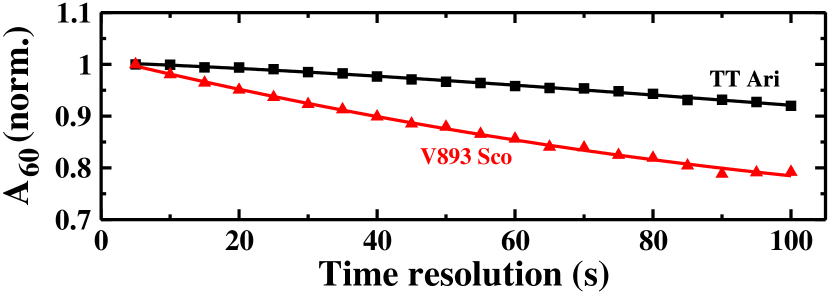
The dependence of the measured flickering amplitude on the time resolution of the investigated light curves is not simply a function of but depends also on the temporal behaviour of the flickering which can be different for different objects. This is demonstrated in Fig. 5. Here, the residual light curves (i.e., after subtraction of their filtered version) of TT Ari and V893 Sco (Fig. 3) were binned in time intervals , thus degrading their time resolution. , normalized to its value at s, is plotted as black squares (TT Ari) and red triangles (V893 Sco) as a function of in the figure. The solid lines are cubic polynomials fitted to the data points. The dependence of on is much stronger for V893 Sco because the dominant flickering variations occur on shorter time scales than in TT Ari (see Fig. 3).
The reduction of to the standard time resolution is performed as follows: For each object and photometric state a representative light curve (ideally: long, low noise, high time resolution) is selected. Binned versions of this light curve are then used to calculate as a function of . This relationship then provides the reduction factor for a light curve with time resolution which must be multiplied with the measured flickering amplitude.
2.5 Secondary star correction
Flickering arises in the primary component of a CV, considered here to consist of anything within the Roche lobe of the white dwarf. Thus, any contribution of the secondary star to the total light of the system dilutes the flickering and the measured amplitude is smaller that it would be in the absence of the secondary. Therefore, in order to be able to compare the flickering amplitude in different systems it makes sense to remove the diluting effect of the secondary if its contribution to the total light is significant.
In order to reduce to the value that it would have in the absence of the secondary, let us transform the light of the system from magnitudes into flux units (on an arbitrary scale). Let be the average flux observed in a light curve, and the flux difference of the flickering light source at two instances in time. Let be the magnitude difference of the system at these instances. Without loss of generality we may choose . Then,
| (2) |
After some arithmetics this yields
| (3) |
where
| (4) |
The flickering amplitude in the absence of the secondary star, , is given by Eq. 2 after substitution of by , i.e., the average flux of the primary component. Let be the flux of the secondary star and its fractional contribution to the total light (i.e., ). Then . Since the flux unit is arbitrary, let . The corrected flickering amplitude is then
| (5) |
where can be calculated from Eq. 4.
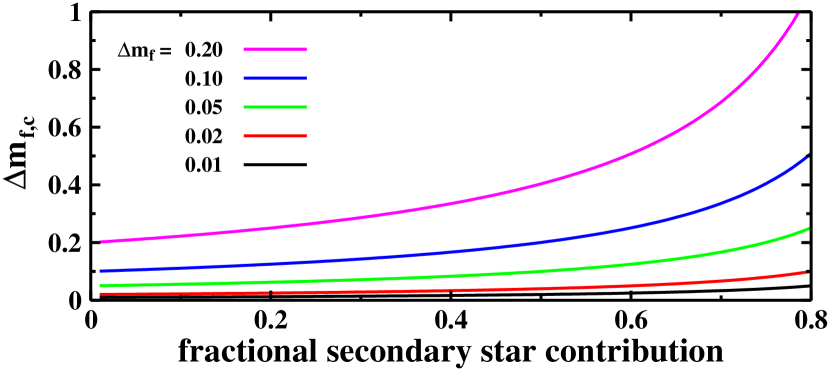
To illustrate the effect, Fig. 6 shows as a function of the fractional contribution of the secondary star to the total light of the system for various values of .
In most CVs this contribution is negligibly. However, if the orbital period exceeds a few hours this may not be true any more. In order to perform the correction in these cases the literature was searched for quantitative statements about the contribution of the secondary star. If available, these refer to a wavelength and a system magnitude which are normally different from those of the light curves employed in this study. Therefore a reduction to the wavelength and the magnitude level of the data used here is required.
A corresponding correction for different magnitude levels is straight forward if the magnitude of the secondary star is assumed to be constant. Brightness modulations of the secondary due to ellipsoidal variations or illumination effects are neglected. Correcting for wavelength differences is more complicated because it involves knowledge or assumptions about the spectra of both, secondary and primary components. An assessment of the involved uncertainties is made in Appendix A.
In principle, just as for the secondary star contribution, a correction for the light of the white dwarf should also be applied. However, in almost all cases the white dwarf does not contribute much to the optical light of a CV. This may be different in very short orbital period systems, but even then quantitative estimates are rarely available. Therefore, this correction is not considered here.
3 The observational data
The data used in the present study consist of more than 3600 light curves referring to 107 different CVs. They were collected from a variety of sources. As a general rule only light curves extending over a time interval of at least 60 minutes and having a time resolution of better then 100 seconds were selected. Eclipses occurring in the light curves of eclipsing systems were masked. Almost all CV subtypes are represented. However, the investigated systems do not include intermediate polars with white dwarf rotation periods of the order of 10 min because of difficulties to separate flickering from rotation induced variations on such time scales. But systems with short rotation periods (and with low amplitudes of the related variability) such as DQ Her and long periods (where the flickering can be well separated) such as EX Hya are considered. Although many light curves of AE Aqr are available this system is disregarded because it exhibits a very peculiar type of flickering (Bruch, 1991a).
A large quantity of high quality light curves were provided by B. Warner, collected by himself and his collaborators at SAAO. With few exceptions they were observed in white light. Their time resolution ranges from 1 s to 10 s, with the bulk of them observed at 5 s resolution. Likewise, many light curves of superb quality were put at the author’s disposal by R.E. Nather. They were mostly observed at McDonald Observatory and at Wise Observatory and were also obtained in white light. Their time resolution is similar to that of the SAAO data. E. Robinson provided many light curves observed in the Stiening photometric system (Horne & Stiening, 1985)222The asterisk () is used here to distinguish this (uncalibrated) system from the better defined Johnson or Cousins system. at McDonald Observatory. They consist of simultaneously observed data in four passbands and have a very high time resolution between 0.2 s and 2 s.
Numerous other light curves were observed by the author and his collaborators at the Wise Observatory in the system, using a time resolution of 15.5 s, at the Observatory do Pico dos Dias (OPD) in the system and later in white light, employing time resolutions in general of the order of 5 s, and at La Silla in the Walraven system (Walraven & Walraven, 1960). Light curves in the latter system were also provided by A. Hollander. All observations taken in this system have a time resolution of 21 s. Since the data in the and passbands proofed to be too noisy for the present purpose, they were ignored.
Many more light curves were provided by researchers worldwide or were retrieved from various data archives, in particular from the OPD data bank333https://www.gov.br/mcti/pt-br/rede-mcti/lna/composicao/coast/obs/opd and from the American Association of Variable Star Observers (AAVSO) International Database444https://www.aavso.org. They refer to various photometric systems or passbands and encompass a variety of time resolutions (in most cases not as short as the data described above). A substantial part of the data has been published previously, however, almost always emphasizing aspects not related to flickering.
In order to compare the white light observations with others obtained in a specific photometric band, it will be assumed that they are roughly equivalent to observations in the band if they were taken with a photoelectric multiplier (i.e., essentially the observations taken by B. Warner and his group and by R.E. Nather in the 1970ies and 1980ies). In contrast, white light observations taken with CCD cameras appear to be closer to band observations (Bruch, 2018).
In order to assess differences in flickering behaviour depending on the brightness of a system (i.e., around the outburst cycle of dwarf novae) it is important to know the average magnitude at the epoch of the light curve. This is no particular problem in the case of observations in a calibrated photometric system {for light curves in the Walraven system a transformation into Johnson magnitudes was performed using (J. Lub, private communication), where the index W indicates values in Walraven system}. In the other cases a rough estimate was obtained from the visual AAVSO long term light curves whenever possible, or – as a final refuge – from visual observations of the observer as recorded in the observation logs. Even so, for a part of the light curves it was not possible to get an estimate of the brightness of the system at the time of the observations.
4 Results and analysis
The flickering amplitude was measured in all light curves of the 107 different CVs. The results are summarized in Table 1. The photometric type and the subtype, adopting the standard nomenclature, are indicated in the second and third column (SU = SU UMa type includes the WZ Sge stars) of the table. In the case of dwarf novae two photometric states are distinguished: O = outburst, including superoutbursts of SU UMa stars and Q = quiescence (forth column). If both were observed, the magnitude separating the two states is also given, recognizing that the separation is somewhat arbitrary and that both, outburst and quiescent states, encompass a range of magnitudes. Regarding VY Scl stars and some magnetic variables which also exhibit low states, always refers to the high state. The subsequent columns of the table contain the average values of the flickering amplitude, expressed in magnitudes, observed in the individual light curves of the various stars and photometric states for different photometric bands. The small differences of the effective wavelengths of similar bands in the different photometric systems are ignored. Numbers in brackets are the standard deviation of and the number of light curves upon which the average is based.
| Name | Type | ph. state | ||||||
|---|---|---|---|---|---|---|---|---|
| RX And | DN | Z | (m<13.0) | 0.043 (1) | 0.029 (0.003) (3) | 0.018 (0.013) (9) | 0.017 (0.001) (3) | |
| RX And | DN | Z | (m>13.0) | 0.093 (0.044) (19) | ||||
| AR And | DN | UG | (m<14.4) | 0.011 (1) | 0.009 (1) | |||
| AR And | DN | UG | (m>14.4) | 0.139 (0.088) (3) | ||||
| DX And | DN | UG | 0.027 (0.008) (2) | |||||
| V455 And | DN | SU | (m<14.0) | 0.066 (0.042) (3) | ||||
| V455 And | DN | SU | (m>14.0) | 0.088 (0.027) (61) | 0.073 (0.039) (7) | |||
| V704 And | NL | VY | 0.103 (0.064) (51) | |||||
| UU Aqr | NL | UX | 0.151 (0.023) (16) | 0.136 (0.027) (14) | ||||
| VY Aqr | DN | UG | (m<14.0) | 0.023 (0.012) (4) | ||||
| VY Aqr | DN | UG | (m>14.0) | 0.115 (1) | 0.067 (1) | |||
| HL Aqr | NL | UX | 0.063 (0.047) (5) | 0.050 (0.026) (4) | 0.025 (0.026) (2) | |||
| CZ Aql | DN | 0.110 (0.024) (13) | ||||||
| DH Aql | DN | SU | 0.026 (1) | |||||
| V603 Aql | N | 0.080 (0.031) (18) | 0.062 (0.026) (22) | 0.058 (0.025) (58) | 0.063 (0.020) (9) | 0.085 (0.045) (4) | ||
| V725 Aql | DN | SU | 0.031 (0.007) (4) | |||||
| V794 Aql | NL | VY | 0.076 (0.036) (3) | |||||
| V1315 Aql | NL | UX | 0.075 (0.013) (2) | |||||
| AT Ara | DN | UG | 0.171 (0.042) (3) | 0.228 (0.018) (3) | ||||
| TT Ari | NL | VY | 0.124 (0.044) (25) | 0.090 (0.034) (36) | 0.086 (0.039) (245) | 0.090 (0.039) (62) | 0.086 (0.052) (5) | |
| T Aur | N | 0.054 (0.003) (2) | 0.042 (0.021) (6) | 0.071 (1) | ||||
| KR Aur | NL | VY | 0.175 (0.027) (2) | |||||
| V363 Aur | NL | UX | 0.036 (0.003) (2) | 0.034 (1) | ||||
| SY Cnc | DN | Z | (m<12.2) | 0.012 (0.006) (6) | 0.000 (0.000) (0) | |||
| SY Cnc | DN | Z | (m>12.2) | 0.062 (0.029) (4) | 0.127 (1) | |||
| YZ Cnc | DN | SU | (m<13.3) | 0.028 (0.009) (10) | 0.019 (0.012) (19) | |||
| YZ Cnc | DN | SU | (m>13.3) | 0.108 (0.058) (2) | 0.106 (0.038) (37) | |||
| AC Cnc | NL | UX | 0.098 (0.011) (4) | |||||
| OY Car | DN | SU | (m<14.8) | 0.072 (0.312) (2) | 0.055 (0.012) (7) | 0.044 (0.011) (5) | ||
| OY Car | DN | SU | (m>14.8) | 0.146 (0.048) (5) | 0.084 (0.036) (7) | |||
| QU Car | NL | 0.053 (0.054) (2) | 0.037 (0.022) (2) | 0.033 (0.014) (33) | ||||
| HT Cas | DN | SU | (m<15.4) | 0.092 (0.012) (2) | 0.051 (0.019) (2) | 0.035 (0.017) (27) | ||
| HT Cas | DN | SU | (m>15.4) | 0.164 (0.040) (13) | 0.126 (0.045) (45) | 0.142 (1) | ||
| WX Cen | NL | 0.031 (0.006) (9) | ||||||
| BV Cen | DN | UG | (m<12.0) | 0.018 (0.003) (2) | 0.012 (0.004) (4) | |||
| BV Cen | DN | UG | (m>12.0) | 0.236 (0.046) (5) | 0.165 (0.012) (4) | 0.124 (0.052) (6) | ||
| MU Cen | DN | UG | 0.181 (0.030) (6) | |||||
| V436 Cen | DN | SU | (m<14.0) | 0.036 (0.010) (11) | ||||
| V436 Cen | DN | SU | (m>14.0) | 0.168 (0.068) (6) | ||||
| V442 Cen | DN | UG | (m<13.5) | 0.010 (0.004) (9) | ||||
| V442 Cen | DN | UG | (m>13.5) | 0.175 (0.046) (5) | ||||
| V504 Cen | NL | VY | 0.198 (0.036) (12) | |||||
| V834 Cen | NL | AM | 0.160 (0.055) (10) | |||||
| V1033 Cen | NL | AM | 0.083 (0.008) (3) | |||||
| WW Cet | DN | Z | (m<14.5) | 0.135 (0.042) (3) | 0.101 (0.070) (5) | 0.095 (0.045) (4) | 0.147 (1) | 0.144 (1) |
| WW Cet | DN | Z | (m>14.5) | 0.135 (0.080) (3) | 0.289 (0.165) (3) | 0.207 (0.047) (3) | ||
| WX Cet | DN | SU | 0.025 (0.005) (5) | |||||
| BO Cet | NL | UX | 0.077 (0.018) (13) | |||||
| Z Cha | DN | SU | (m<15.0) | 0.051 (0.018) (26) | 0.036 (0.020) (26) | |||
| Z Cha | DN | SU | (m>15.0) | 0.082 (0.040) (18) | 0.052 (0.020) (24) | 0.140 (1) | ||
| ST Cha | DN | SU | 0.090 (1) | |||||
| TV Col | NL | IP | 0.092 (0.034) (35) | 0.064 (0.025) (7) | ||||
| T CrB | RN | 0.126 (0.057) (12) | ||||||
| SS Cyg | DN | UG | (m<10.4) | 0.022 (0.007) (3) | 0.019 (0.005) (3) | 0.013 (0.008) (14) | ||
| SS Cyg | DN | UG | (m>10.4) | 0.140 (0.046) (5) | 0.137 (0.073) (5) | 0.086 (0.042) (67) | ||
| EM Cyg | DN | Z | (m<13.0) | 0.038 (0.018) (2) | 0.050 (0.000) (2) | |||
| EM Cyg | DN | Z | (m>13.0) | 0.032 (1) | 0.029 (1) | 0.105 (0.012) (2) | ||
| V751 Cyg | NL | VY | 0.099 (0.004) (2) | 0.059 (0.031) (5) | ||||
Table 1 (continued)
| Name | Type | ph. state | ||||||
|---|---|---|---|---|---|---|---|---|
| HR Del | N | 0.031 (0.016) (16) | 0.023 (0.009) (20) | 0.019 (0.018) (18) | 0.020 (0.007) (4) | 0.020 (0.009) (2) | ||
| DO Dra | DN | SU | (m<13.0) | 0.066 (0.012) (4) | 0.090 (0.015) (2) | |||
| DO Dra | DN | SU | (m>13.0) | 0.075 (0.042) (2) | 0.135 (0.053) (6) | 0.251 (0.243) (58) | 0.147 (0.052) (9) | |
| AQ Eri | DN | SU | 0.031 (0.014) (7) | |||||
| KT Eri | N | 0.026 (0.001) (2) | ||||||
| U Gem | DN | UG | (m<12.5) | 0.020 (0.013) (6) | 0.024 (0.012) (18) | |||
| U Gem | DN | UG | (m>12.5) | 0.022 (0.007) (6) | 0.117 (0.047) (58) | |||
| DM Gem | N | 0.047 (1) | ||||||
| IR Gem | DN | SU | (m<14.0) | 0.018 (0.013) (4) | ||||
| IR Gem | DN | SU | (m>14.0) | 0.265 (1) | 0.224 (0.130) (2) | |||
| RZ Gru | NL | UX | 0.067 (0.011) (4) | |||||
| AH Her | DN | Z | (m<12.5) | 0.015 (0.001) (3) | 0.022 (0.004) (3) | |||
| AH Her | DN | Z | (m>12.5) | 0.029 (1) | 0.069 (0.028) (3) | 0.063 (1) | ||
| AM Her | NL | AM | 0.147 (0.050) (54) | 0.146 (0.051) (2) | ||||
| DQ Her | N | IP | 0.040 (0.018) (165) | 0.042 (1) | ||||
| V533 Her | N | IP | 0.085 (1) | 0.068 (1) | 0.083 (0.038) (13) | 0.046 (1) | ||
| V795 Her | NL | 0.136 (1) | 0.068 (0.015) (9) | 0.063 (0.027) (53) | ||||
| EX Hya | DN | IP | 0.108 (1) | 0.205 (0.026) (47) | 0.198 (0.052) (59) | |||
| VW Hyi | DN | SU | (m<10.9) | 0.082 (0.033) (31) | 0.023 (0.002) (2) | |||
| VW Hyi | DN | SU | (m>10.9) | 0.013 (0.008) (16) | 0.053 (0.026) (23) | |||
| WX Hyi | DN | SU | (m<13.6) | 0.094 (0.057) (5) | 0.057 (0.019) (14) | 0.036 (0.018) (5) | 0.053 (1) | 0.073 (1) |
| WX Hyi | DN | SU | (m>13.6) | 0.184 (0.076) (10) | 0.248 (0.117) (14) | 0.191 (0.055) (9) | ||
| BL Hyi | NL | AM | 0.201 (0.069) (10) | |||||
| DI Lac | N | 0.022 (1) | ||||||
| X Leo | DN | UG | (m<14.0) | 0.025 (1) | ||||
| X Leo | DN | UG | (m>14.0) | 0.075 (1) | ||||
| GW Lib | DN | SU | (m<12.0) | 0.021 (1) | 0.017 (0.010) (15) | 0.012 (0.003) (3) | ||
| GW Lib | DN | SU | (m>12.0) | 0.037 (0.025) (3) | ||||
| BR Lup | DN | SU | 0.046 (0.040) (6) | 0.024 (1) | ||||
| AY Lyr | DN | SU | (m<15.0) | 0.016 (0.007) (3) | 0.015 (1) | |||
| AY Lyr | DN | SU | (m>15.0) | 0.111 (1) | ||||
| MV Lyr | NL | VY | 0.216 (0.198) (2) | 0.086 (0.003) (2) | 0.089 (0.054) (56) | |||
| AQ Men | NL | UX | 0.052 (0.020) (7) | |||||
| BT Mon | N | 0.075 (0.030) (4) | 0.044 (0.014) (10) | |||||
| KQ Mon | NL | UX | 0.053 (0.008) (3) | |||||
| RS Oph | RN | 0.114 (0.046) (8) | 0.109 (0.049) (12) | 0.139 (0.055) (16) | 0.269 (0.225) (2) | |||
| V380 Oph | NL | VY | 0.141 (0.050) (6) | |||||
| V426 Oph | DN | Z | (m<11.9) | 0.080 (0.025) (2) | 0.045 (0.001) (2) | 0.044 (0.013) (4) | ||
| V426 Oph | DN | Z | (m>11.9) | 0.219 (1) | 0.194 (1) | 0.140 (0.050) (24) | ||
| V442 Oph | NL | VY | 0.128 (0.055) (8) | 0.080 (0.027) (6) | ||||
| V841 Oph | N | 0.018 (0.008) (9) | ||||||
| V2051 Oph | DN | SU | (m<14.5) | 0.089 (0.034) (7) | 0.093 (0.031) (7) | |||
| V2051 Oph | DN | SU | (m>14.5) | 0.342 (0.047) (2) | 0.184 (0.087) (39) | 0.234 (0.129) (5) | ||
| CN Ori | DN | UG | (m<13.8) | 0.012 (0.006) (15) | 0.013 (0.006) (22) | |||
| CN Ori | DN | UG | (m>13.8) | 0.027 (1) | 0.040 (0.018) (19) | |||
| CZ Ori | DN | UG | 0.037 (1) | |||||
| V1193 Ori | NL | UX | 0.105 (0.034) (21) | |||||
| GS Pav | NL | UX | 0.032 (0.025) (5) | |||||
| V345 Pav | NL | UX | 0.049 (0.010) (9) | |||||
| IP Peg | DN | UG | (m<14.3) | 0.056 (0.020) (13) | 0.084 (0.054) (7) | |||
| IP Peg | DN | UG | (m>14.3) | 0.323 (1) | 0.126 (0.026) (4) | 0.154 (0.059) (24) | 0.362 (0.219) (3) | |
| LQ Peg | NL | VY | 0.028 (0.009) (31) | 0.022 (0.017) (2) | ||||
| TZ Per | DN | Z | 0.013 (0.005) (2) | |||||
| GK Per | N | UG | 0.161 (0.055) (14) | 0.095 (0.031) (17) | 0.079 (0.028) (53) | 0.059 (0.022) (32) | 0.095 (1) | |
| KT Per | DN | SU | 0.018 (0.016) (9) | 0.028 (0.011) (4) | ||||
| RR Pic | N | 0.043 (0.010) (21) | 0.030 (0.011) (15) | |||||
| TY PsA | DN | SU | (m<14.3) | 0.036 (0.010) (7) | ||||
| TY PsA | DN | SU | (m>14.3) | 0.151 (0.034) (9) | ||||
| VV Pup | NL | AM | 0.112 (1) | 0.193 (0.107) (2) | ||||
| CP Pup | N | 0.048 (0.012) (21) | 0.052 (0.011) (41) | |||||
| V348 Pup | NL | UX | 0.088 (0.013) (4) | |||||
Table 1 (continued)
| Name | Type | ph. state | ||||||
| T Pyx | RN | 0.052 (0.008) (3) | 0.033 (0.016) (67) | |||||
| WZ Sge | DN | SU | 0.056 (0.024) (33) | |||||
| V3885 Sgr | NL | UX | 0.019 (0.011) (8) | 0.011 (0.006) (26) | 0.019 (0.010) (7) | 0.031 (1) | 0.043 (1) | |
| V4140 Sgr | DN | SU | 0.123 (0.064) (33) | |||||
| V893 Sco | DN | SU | (m<13.4) | 0.068 (0.021) (7) | ||||
| V893 Sco | DN | SU | (m>13.4) | 0.157 (0.044) (58) | 0.190 (1) | |||
| VY Scl | NL | VY | 0.118 (0.024) (4) | 0.080 (0.011) (4) | 0.075 (0.019) (4) | |||
| VZ Scl | NL | VY | 0.107 (0.052) (12) | 0.106 (0.025) (24) | ||||
| LX Ser | NL | VY | 0.082 (0.030) (50) | |||||
| RW Sex | NL | UX | 0.057 (0.024) (4) | 0.034 (0.017) (8) | 0.042 (0.021) (4) | 0.028 (1) | 0.062 (1) | |
| KK Tel | DN | SU | 0.019 (1) | |||||
| RW Tri | NL | UX | 0.101 (0.027) (3) | 0.069 (0.036) (8) | 0.034 (0.027) (58) | 0.049 (0.008) (3) | ||
| EF Tuc | DN | UG | (m<13.2) | 0.058 (0.017) (3) | ||||
| EF Tuc | DN | UG | (m>13.2) | 0.112 (0.024) (22) | ||||
| SU UMa | DN | SU | (m<12.7) | 0.059 (1) | 0.020 (0.012) (3) | |||
| SU UMa | DN | SU | (m>12.7) | 0.186 (0.061) (3) | 0.105 (1) | 0.125 (0.002) (2) | ||
| SW UMa | DN | SU | 0.022 (0.006) (4) | 0.028 (0.015) (9) | ||||
| UX UMa | NL | UX | 0.046 (1) | 0.035 (0.025) (10) | 0.052 (0.023) (188) | 0.036 (0.006) (2) | ||
| IX Vel | NL | UX | 0.027 (0.007) (5) | 0.014 (0.006) (38) | 0.013 (0.003) (5) | 0.021 (1) | ||
| HV Vir | DN | SU | 0.020 (0.003) (2) | 0.027 (0.019) (6) | 0.026 (0.001) (2) | |||
| CTCV 2056-3014 | NL | IP | 0.255 (0.051) (5) | |||||
| EC 21178-5417 | NL | UX | 0.038 (0.004) (5) | |||||
| LS IV -08o 3 | NL | UX | 0.020 (0.009) (9) | |||||
4.1 Correlations with system parameters
Starting the analysis of the results summarized in Table 1, I investigate possible correlations of with dynamical, geometrical and photometrical system parameters in order to look for a systematic behaviour of the flickering strength depending on these quantities. In particular, I study the dependence of the flickering on the absolute magnitude, the orbital period, component masses and the orbital inclination. Appendix B contains a table with relevant numerical values.
In brief, the absolute magnitude is calculated from the apparent magnitude as measured at the epoch of observations and the distance of the star as quoted by Bailer-Jones et al. (2018), based on its Gaia parallax, considering the interstellar extinction quoted in numerous references (Table B1). Concerns about systematic errors of the distances (see, e.g., Tappert et al., 2020) are not an issue because they only apply if the fractional parallax error is much larger than encountered in the present sample of stars. Component masses and system inclinations are also taken from the literature, many times requiring a possibly subjective choice between contradicting numerical values cited by different authors. The latter problem does not apply to the orbital period which in most cases is known to a much higher precision than necessary in the present context. In order to take into account the dependence of the magnitude on the orbital inclination, in disk dominated systems has been reduced to a standard inclination of 567 using the correction formula given by Paczynksi & Schwarzenberg-Czerny (1980). No such correction has been applied if the inclination is not known. This is equivalent to assuming the average inclination of a statistical sample of binaries. Moreover, for systems with a significant contribution of the secondary star to the total light, a correction yielding the magnitude of only the primary component has been applied.
In no case – even delimiting the analysis to specific CV subtypes, photometric states, or combinations thereof – a trustworthy correlation of with the orbital period, the inclination, the primary star mass or the mass ratio could be detected. There is, however, a correlation with the absolute magnitude of the primary component.
This is shown in Fig. 7, where is shown as a function of the absolute magnitude . In order not to give exaggerated weight to systems with a large number of light curves the average values of were first calculated for each individual system, and the results were then binned in intervals of . The red error bars in the figure represent the standard deviation, while the black bars (often hardly larger than the plot symbols) are the standard errors of the mean. The latter is a more meaningful measure for the precision of the ensemble average compared to the true mean of the population. However, a small number of systems or light curve contributing to the average may lead to a subestimation of the true error of some points in the graphs.
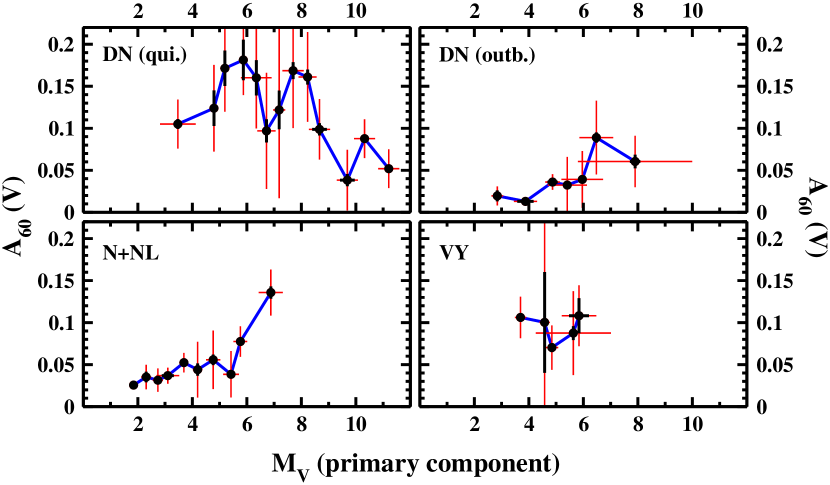
Four different populations are regarded, all drawn on the same scale in Fig. 7 in order to facilitate a comparison. Results for dwarf novae in quiescence are shown in the upper left frame. At the faint end, DO Dra (average values: ; ) has been ignored since the flickering amplitude is extremely high and unreliable, possibly because of an overestimation of the contribution of the secondary star. These data will therefore not be used henceforth. The upper right frame contains the results for dwarf novae in outburst. In the lower left frame novae (including recurrent novae) and UX UMa type novalike variables are regarded. Two long period systems are excluded as untypical, namely the symbiotic recurrent nova RS Oph ( d; Brandi et al., 2009) and the old nova GK Per ( d; Morales-Rueda et al., 2002). The latter also exhibits dwarf nova outburst, making its classification ambiguous. Both systems have also the highest absolute magnitude of all stars regarded here. Novae and UX UMa type novalike variables are lumped together because no systemantic differences in their flickering behaviour could be detected. I include in this group also novalike variables which, for lack of sufficient observations, are not firmly established as being of the UX UMa subtype. However, a Kolmogorov-Smirnow tests shows with a probability of 0.994 that these, as well as the confirmed UX UMa stars and the quiescent novae all belong to the same populations when it comes to the distribution of . Finally, the lower right frame of Fig. 7 contains the results for the VY Scl type novalike variables, i.e., those novalikes which in contrast to the UX UMa stars are observed to sometimes go into a low state, significantly fainter than normal.
There is a tendency for a decline of the flickering amplitude of dwarf novae in quiescence at very faint magnitudes (but note that statistics are not good in this range). Dwarf novae in outburst have a significant trend to increase their flickering amplitude with diminishing brightness of the primary component. The strong difference of the average level of between quiescence and outburst reflects the long known fact that flickering in dwarf novae diminishes strongly during outburst. This will be investigated in more detail in Sect. 4.3. The novae and UX UMa stars exhibit, at a slightly higher level, a similar trend of with as the outbursting dwarf novae. In contrast, the VY Scl type novalike variables do not show such a tendency over the limited range in where they are observed. But it is striking that their flickering is systematically stronger than in systems which are not observed to have low states (see also Sect. 4.2). A systematic difference of the flickering properties of VY Scl and UX UMa type novalike variables was also noted by Fritz & Bruch (1998) in parameters based on a wavelet analysis.
4.2 Distribution functions
In the previous section the existence of different populations of CV with respect to the flickering strength already became obvious. This can be substantiated by investigating the distribution function of . In Fig. 8 histograms of the average values of in individual systems are shown (from top to bottom) for dwarf novae in outburst and in quiescence, novae plus UX UMa stars, and VY Scl stars.
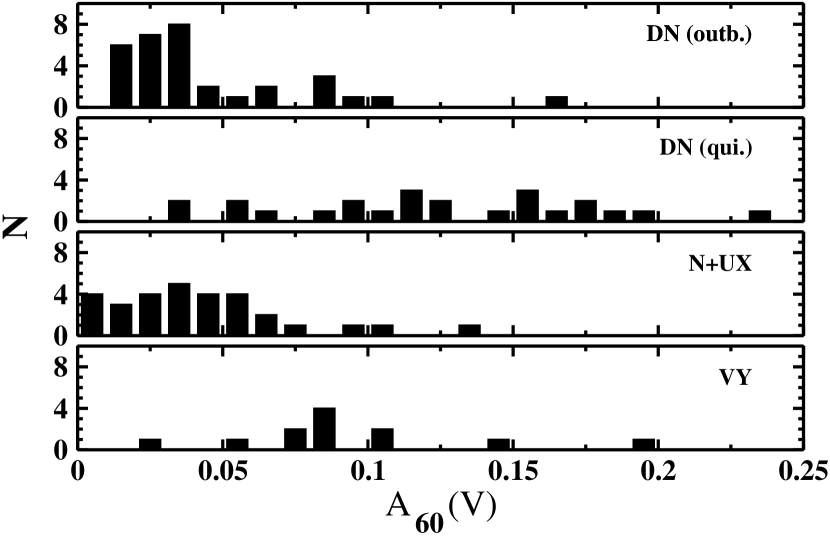
On the statistical mean the flickering strength is quite similar in outbursting dwarf novae and in novae and UX UMa systems on the one side, and quiescent dwarf novae and VY Scl stars on the other. Moreover, the distribution functions of the latter are much broader than those of the former. This cannot, however, be explained assuming that VY Scl stars are just like quiescent dwarf novae but for some reason never experience outbursts because, as Fig. 7 shows, their absolute magnitude is systematically higher than that of the dwarf novae. This holds even true when limiting this comparison to dwarf novae above the period gap (considering that short period dwarf novae are intrinsically much fainter than their long period brethren). In this case the present sample of dwarf novae has an average quiescent magnitude of versus for the VY Scl stars.
4.3 Flickering evolution around the dwarf nova outburst cycle
In most dwarf novae a tendency is observed in the sense that the flickering amplitude decreases when the brightness of the system in the outburst cycle increases above the quiescent magnitude, but attains a plateau when it approaches the maximum. An example is shown in the upper frame of Fig. 9 where, for RX And, is shown as a function of apparent magnitude in the band. The same is seen in other dwarf novae, although uncertainties in the measurement of and an insufficient number of available light curves makes it often more difficult to recognize this tendency. Therefore, it is worthwhile to characterize this behaviour by averaging the relation over the ensemble of all dwarf novae.

This is not quite straight forward because the outburst amplitudes differ greatly from one system to the other, as do, of course, their observed magnitudes. The latter problem is not resolved by transforming the apparent into absolute magnitudes because the systematic brightness differences as a function of orbital period would still not allow to determine the average dependence. In order to overcome these difficulties I introduce normalized magnitudes such that the average magnitudes in quiescence and at outburst maximum are 1 and 0, respectively.
This requires the specification of quiescent () and maximum () magnitudes for all dwarf novae included in the average. Both quantities are not well defined, introducing some uncertainty which, however, cannot mask the main findings. In most cases and could be estimated with sufficient accuracy from the distribution of data points in the AAVSO long term light curves. In some cases (in particular eclipsing systems) the distribution of the out-of-eclipse magnitudes of the light curves used in this study and information taken from Ritter & Kolb (2003) was also considered. In the case of SU UMa stars is taken to be the average maximum magnitude during normal outbursts.
Having thus transformed the observed into normalized magnitudes the relations of all dwarf novae can be averaged. The result is shown in the lower frame of Fig. 9 where is plotted against . The data points have been binned into intervals of 0.05 in . The error bars are the standard errors of the mean of all points within an interval. The solid red line represents a spline fit to the data.
The graph confirms with much more clarity the trend seen in individual systems. Whenever the dwarf nova is brighter than halfway (in magnitudes) between quiescence and outburst maximum, remains on a constant low level. A steep increase occurs between , and at still fainter magnitudes the amplitude continues to increase at a much lower rate (or remains constant on a high level, considering the scatter of the data). The exact values of the break points may be somewhat uncertain in view of the scatter in the data and the vagaries involved in the determination of the . However, the general shape of the – relation is clear.
4.4 The wavelength dependence of the flickering
A part of the light curves were observed simultaneously in different passbands. This opens the path for an assessment of the wavelength dependence of the flickering amplitude. For this purpose, the dependence of in the , , and band is plotted in Fig. 10 as a function of . Red dots refer to light curves for which the noise level could be determined, smaller black ones to those where only an upper limit was measured. The latter are generally based on light curves of inferior quality, leading thus to less reliable flickering amplitudes. Note that some data points representing high flickering amplitudes fall beyond the limits of the diagrams.
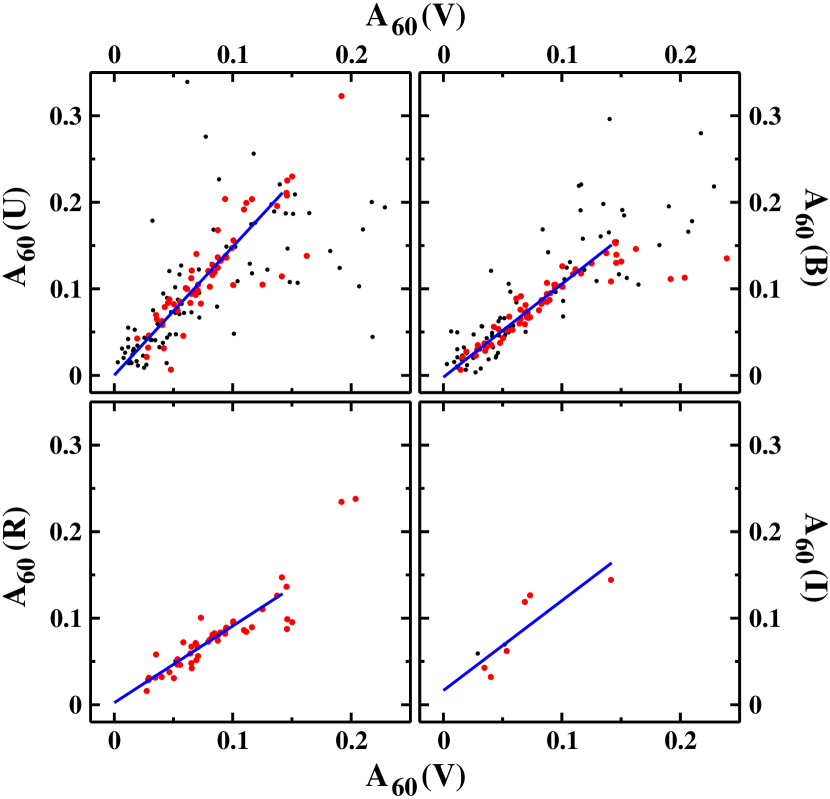
Up to a certain limit of a rather well defined linear relationship between the amplitude in the band and in all other bands is observed. This is particularly so if only the more reliable measurements (red dots) are regarded. At higher the scatter of the data points increases. A linear fit restricted to the better data (red dots) and to (blue lines in Fig. 10) yields the average amplitude ratios quoted in the second column of Table 2. The results confirm the canonical wisdom that the flickering increases in strength towards the blue. It may, however, come as a surprise that the flickering in the band is stronger than in and . Although there are only a few data points in there is no strong reason to mistrust their reliability. But, as will be shown below, this does not mean that the flickering spectrum rises in the band.
| Passband | ||
|---|---|---|
| 1.49 0.12 | 2.66 0.29 | |
| 1.08 0.04 | 1.69 0.10 | |
| 0.89 0.05 | 0.63 0.03 | |
| 1.04 0.25 | 0.36 0.42 |
In order to estimate the broad band spectrum of the flickering light source it is assumed that the total flux of a CV can be thought to be composed of two components (neglecting the contribution of the white dwarf and remembering that the light of the secondary has already been removed when the corresponding correction to the flickering amplitude was made). The first one, , is constant, being emitted by the quiet (i.e., non flickering) part of the accretion disk. The second part, , represents the flickering light source. Since, in general, it cannot be assumed that the latter is 100% modulated (i.e., that at the minimum of the flickering activity ) it can be expressed as consisting of a base level, , and a part (the latter being that part which is really seen as flickering). Let describe the spectrum of the flickering light source, normalized at the wavelength of a reference passband R. Then
| (6) |
where is the magnitude difference due to flickering at two instances of time. Without loss of generality can be identified with . and are the spectra of the quiet accretion disk and the flickering light source, respectively, normalized at the wavelength of R. For the passbands, is given in Table 2. For the derivation of Eq. 6 and , see Appendix C.
Calculating for different comparison passbands yields the broad band spectrum of the flickering light source. However, Eq. 6 still contains as an unknown quantity. Thus, the flickering spectrum can only be determined as a function of the not modulated fraction of the flickering light source. Table 3 lists obtained using , , , and as comparison passband for various values of (expressed in units of the flux of the quiet accretion disk in the band). The errors were propagated from the formal errors of and .
| Passband | |||||
|---|---|---|---|---|---|
| 4.04 0.55 | 4.64 0.78 | 5.45 1.12 | 6.61 1.78 | 8.39 3.13 | |
| 1.82 0.13 | 1.86 0.14 | 1.90 0.15 | 1.94 0.17 | 1.99 0.19 | |
| 0.57 0.04 | 0.54 0.05 | 0.53 0.05 | 0.51 0.06 | 0.50 0.06 | |
| 0.38 0.10 | 0.38 0.13 | 0.38 0.15 | 0.39 0.18 | 0.39 0.21 |
The main frame of Fig. 11 shows (black dots) as a function of wavelength for a fully modulated flickering light source. Error bars are also drawn, but only in the band they are larger than the plot symbol. By definition, in the band ( 5510 Å) . Thus, this is the spectrum of the flickering light source. The insert of the figure contains the flickering spectra for different degrees of modulation. Only in the band the differences with respect to the fully modulated case surpass the size of the plot symbols. From bottom to top , 0.5, 0.75 and 1.0. Concentrating on , the spectrum can be equally well described by a black body (black graph) and by a power law of the form . The latter is shown as a dashed blue graph in the figure for a power law index . It is indistinguishable within the resolution of the figure from the spectrum of a black body with a temperature of K. In both cases only the point representing the band falls slightly above the curves. Using different parameters ( and K) the spectra (dashed red and lower black graphs) fit well the point but fall short in . It is now also seen that the flickering spectrum does not rise in the near infrared in spite of in the band.

Of course, in the real world a simple black body or power law can well be an oversimplification for the flickering spectrum. Qualitatively, the rise being steeper between and than can be modelled with one of these laws (and which becomes more acute if the flickering light source is not fully modulated), may be explained by an enhanced contribution in of emission from higher Balmer lines and/or continuum emission at wavelengths shorter than the Balmer limit.
4.5 Relative flux of the flickering light source
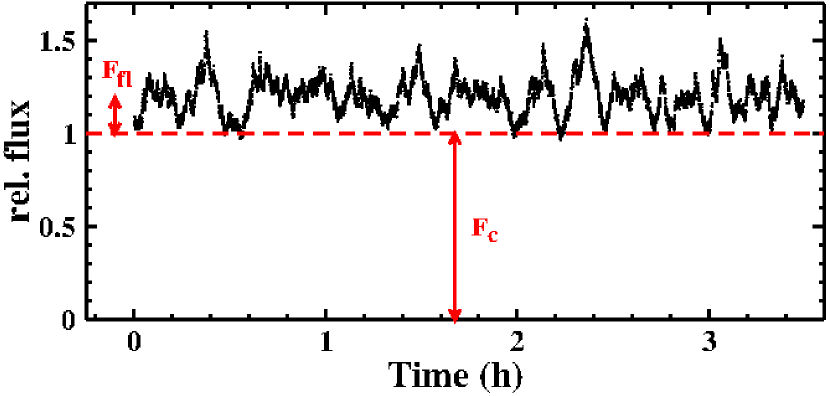
The flickering amplitude is a measure of the flux of the flickering light source relative to the flux of the other components of the system contributing to the total light. However, since , taken to be measured at the wavelength , does not measure the full amplitude of the flickering but rather the FWHM of the distribution of data points in a flickering light curve, it will be explored here how the flux ratio can be estimated from . Here is taken to be the average flickering flux in a light curves and is the non-flickering flux. I will assume the flickering light source to be 100% modulated, leading to a lower limit for if this is not the case.
As an example, Fig. 12 shows a light curve of KR Aur (see Fig. 1), transformed from magnitudes into relative fluxes. The slight linear trend has been subtracted before the transformation. The flux scale has been defined such that the broken horizontal line, which approximately delimits the lower limit of the flickering, corresponds to a flux level of 1. Thus, . The average flux above the level of the non-flickering light, i.e., the average flux of the flickering light source, is then in this example, leading to a magnitude difference between the constant and the average flickering light of
| (7) |
In the same light curve was measured to be 0.194. Thus, substituting by in Eq. 7 and solving for permits to calculate a satisfactory approximation of the relative contribution of the flickering flux to the total light of the system at the wavelength at which was measured. Since no assumptions about the specific example light curve have been made, this result holds for all light curves. Note that it refers to the light of only the primary component because the contribution of the secondary star is implicitely taken into account by the corresponding correction to .
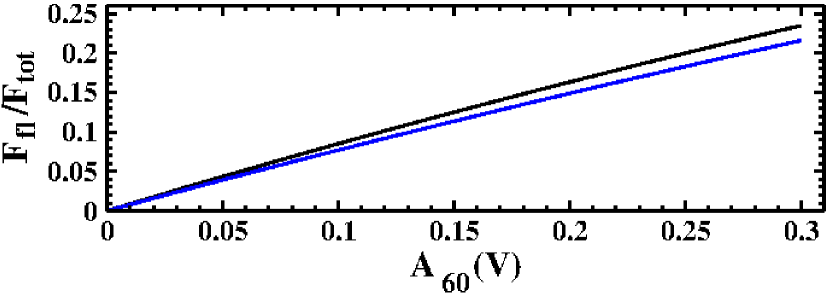
Moving from the monochromatic to the polychromatic case requires knowledge of the spectral energy distribution of both, the non-flickering and the flickering light source. Here, I draw on the approximations derived in Sect. 4.4. Specifically, I adopt a power law spectrum with index (from a fit to the values of in Table 2) for the non-flickering, and a black body spectrum with a temperature of 17 000 K for the flickering light source. Scaling both spectra such that their ratio at the wavelength is equal to , the average of their ratio over the optical range (which is here taken to be ) yields the ratio of the total optical flux of the flickering light source in units of the flux of the non-flickering light.
Since in the optical range both spectra are quite similar does not change much with . Therefore the ratio of the fluxes integrated over the entire optical range is similar to the monochromatic flux ratio. Fig. 13 show the contribution of the flickering flux to the total flux as a function of , measured in the (black) and (blue) band. Thus, for a system with strong flickering (say, ), the flickering light source can easily contribute on average 15% of the total flux and twice that during particular strong flares. These contributions can even be higher if the flickering light source is less than 100% modulated.
Obviously, any physical model for the origin of the flickering must be able to explain the magnitude of the contribution of the flickering flux to the total light of a given system. Excepting the paper of Dobrotka et al. (2020) (see Sect. 5) I am not aware of a more thorough assessment of this question in any of the publications which put forward such models.
4.6 The phase dependence of the flickering
In this section I investigate if the strength of the flickering depends on the binary phase or, in some cases, the superhump phase. I restrict this study to a limited number of systems for which high quality, high time resolution light curves are available.
In particular, three eclipsing CVs (the novalike variable UX UMa, and the dwarf novae U Gem and V893 Sco in quiescence) are regarded in order to verify if the variable aspect of the system around the orbit results in changes of the observed flickering activity. Moreover, in two CVs above the period gap which exhibit permanent superhumps (V795 Her and TT Ari), a possible dependence of flickering on the superhump phase is studied. Finally the polar V834 Cen is regarded where the varying aspect of the accretion site on the white dwarf may suggests a change of the observed flickering activity depending on the rotational phase of the white dwarf if its source is associated to the accretion site on the stellar surface.
As usual, the long term variations are removed by subtracting a Savitzky-Golay filtered version from the original data, here using a cut-off time scale of 30 and 60 min for systems below and above the period gap, respectively. The variance of all data points within a sliding window of width =10 min (below the period gap) or 20 min (above the gap) is then calculated555The variance is used here because the number of data points in this window is in general not sufficient to permit a reliable determination of the FWHM of a Gaussian fit to the distribution., using a step width of 1.5 min. After a correction for the average data noise in each light curve the resulting relationship between variance and time is folded on the (orbital or superhump) period, yielding the variance vs. phase relationship. Combining and binning the result from all examined light curves into suitable phase bins of width 0.02 yields the final result (hereafter denominated “variance curve”). Since in the present context only the phase dependence of the variance matters while the absolute values are irrelevant, and in order to facilitate a comparison between the considered systems, the mean of the variance over all phases is first subtracted and it is then normalized to its maximum. In the case of the eclipsing systems a phase range corresponding to before the start of the eclipse ingress and after the end of egress is ignored in order to avoid any bias caused by the eclipse. The results are shown in Fig 14. The upper frame of each row shows a representative phase folded light curve of the considered object as black dots and the average of all light curves in red (shifted vertically for clarity). The lower frame contains the respective variance curves where the error bars represent the standard error of the mean in each phase bin. Note that structures smaller than the width of the sliding window (in all cases of the order of 0.1 in phase) are not independent. In order to verify if the structure of the variance curves may be dominated by individual light curves with peculiar flickering behaviour, the variance curve was re-calculated many times, selecting at random only half of the contributing light curves. In all cases, the overall shape of the variance curve was recovered.
4.6.1 The eclipsing systems
The left column of Fig. 14 contains the results for the eclipsing systems. No coherent picture arises, the variance curves being quite dissimilar for the individual systems.
UX UMa: The average out of eclipse light curve is quite flat with at most a slight indication of a hot spot just before the eclipse. The variance curve (based on 245 cycles) has a quasi sinusoidal shape with a broad maximum centred on the eclipse and a pronounce minimum at phase 0.5, clearly indicating a non azimuthally symmetric distribution of the flickering light source which appears to be the concentrated on the side of the accretion disk facing the secondary star.
U Gem is well known to contain a strong orbital hump spanning over almost half the orbital cycle, as seen here in both, the individual and the average light curves. Particularly strong flickering seen during the hump phase in two light curves by Warner & Nather (1971) made these authors to suspect that unstable mass transfer from the secondary star and, in consequence, variable release of kinetic energy at the hot spot is the mechanism responsible for flickering; a notion that prevailed during the subsequent two decades but which was overcome later. Here, the shape of the variance curve (based on 65 cycles) shows that on average flickering does not increase at the hump phase. Instead, it is flat just after eclipse, rises quite suddenly to a maximum at phase 0.4 and then steadily declines until the start of the subsequent eclipse. This rather surprising behaviour is a challenge for any interpretation which I will no endeavour to attempt.
V893 Sco exhibits by far the strongest flickering activity of the three eclipsing systems regarded here. In spite of considerable variations seen in individual light curves at any phase, on average, the light curve is flat during the first two thirds of the orbital cycle and then shows a hump similar to, but not as strongly expressed as in U Gem. The variance curve (based on 120 cycles) starts high just after eclipse and then declines slowly but accelerates the decline when the orbital hump becomes visible. As in UX UMa there appears to be a dependence on azimuth of the visibility of the flickering light source, however, in a different sense.
4.6.2 The permanent superhump systems
Superhumps in cataclysmic variables are thought to arise as the consequence of variable tidal stress in the outer parts of an elliptical accretion disk. The stress and thus the brightness attains a maximum when the elongated part of the disk extends towards the secondary star. This effect may or may not enhance or diminish the flickering activity. This issue is investigated in the upper and middle frames of the right column of Fig. 14.
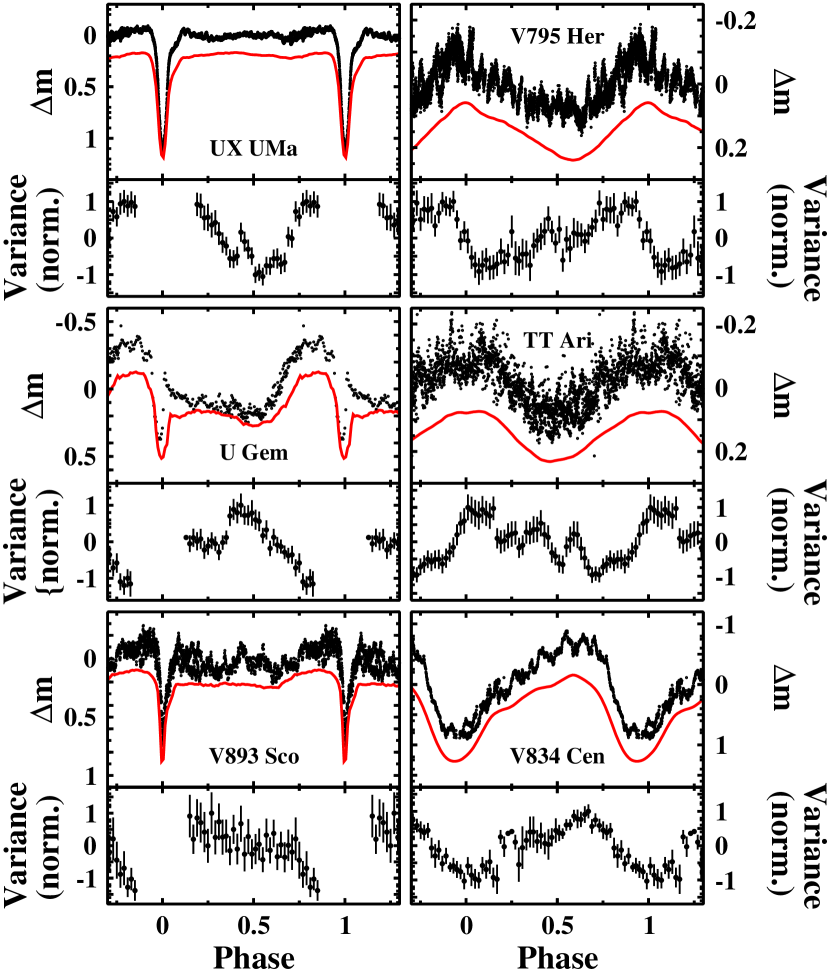
V795 Her: The superhump properties of V795 Her have been investigated by various authors (e.g. Kalużny, 1989; Patterson & Skillman, 1994; Papdaki et al., 2006; Šimon et al., 2012). 37 suitable light curves (spanning 57 cycles) were used here. They yield a decidedly saw tooth shaped average superhump waveform with a steep rise, a pointed maximum (arbitrarily chosen to represent phase 0) and a more gradual decline. The variance curve does not follow the light curve shape. It rather appears as a mirror image of the latter, mirrored at the vertical axis. While the maxima approximately coincide, the variance drops rapidly after the maximum and then recovers slowly. This is just the opposite of the phase dependence of the magnitude. There appears to be a secondary maximum centred on phase 0.45, i.e. shortly before the end of the decline from superhump maximum. Based on a smaller light curve sample, Šimon et al. (2012) came to a similar conclusion. As is the case here, they see an enhancement during superhump maxima of a parameter which measures the relative intensity scatter. They draw particular attention to a maximum observed on 2009, April 28 at superhump phase 0.4. This enhances the credibility that the feature seen here at phase 0.45 is real, although it is by no means obvious what is so special at this phase to lead to a strengthening of the flickering.
TT Ari: The behaviour of the permanent superhump in this system has been studied many times in the past, most recently by Bruch (2019) who characterized the photometric behaviour of TT Ari over about 40 years. The (positive) superhump was always observed, except for a couple of years around the turn of the millennium when it was replaced by a negative superhump and during two VY Scl type low states. Of the vast quantity of available photometry of TT Ari I selected 184 suitable light curves, spanning 247 cycles. The average superhump wave form is very nearly sinusoidal. The variance curve has a maximum coinciding with the light curve maximum. The secondary maxima, in particular the one close to phase 0.6, may not be permanent features because they are not always seen when subsets of all light curves are used to calculate the variance curve.
These two examples appear to point at a general correlation between the superhump phenomenon and the flickering activity in the sense that flickering grows in strength when the superhump attains its maximum. However, the detailed picture seems to be somewhat more complicated. It may be noteworthy that Bruch (1996) observed during superoutbursts of the SU UMa type dwarf nova Z Cha that flickering originates in an extended region of the accretion disk when the superhump light source is on, but is restricted to the inner disk (and to an extended range along the disk rim possibly associated to the hot spot) when it is off.
4.6.3 The AM Her stars
Much of the optical light of polars arises as reprocessed X-rays or as cyclotron radiation at the bottom of the accretion column close to the magnetic pole(s) of the white dwarf primary. Thus, if this region is the source of flickering in these systems, its strength is expected to be correlated with the magnitude which changes as the visibility of the accretion region changes during the white dwarf rotation cycle. In polars this is, of course, equal to the orbital cycle.
V834 Cen: The data available here only permit the study of the flickering strength on orbital phase for a single polar, namely V834 Cen. Phase resolved light curves of this system are presented by various authors (e.g. Cropper et al., 1986; Middleditch et al., 1991; Imamura et al., 2000). In all cases flickering is quite strong, the amplitude being higher during the maxima than during the minima, as also seen in Fig. 14 (lower right frames). For the present exercise 11 light curves were used. Phases were calculated using the ephemeris of Schwope et al. (1993). Thus, phase 0 corresponds to the blue-to-red crossing of the radial velocity of V834 Cen. The light curves are characterized by a hump with a gradual rise and a more rapid decline. The variance curve indeed confirms that flickering is stronger during the bright phase of V834 Cen. The geometry (orbital inclination, co-latitude of accretion region) of V834 Cen is such that the accretion column is always in the hemisphere facing the observer and that at the phase of optical minimum the line of sight is almost parallel to the magnetic field lines (Bailey et al., 1983; Potter et al., 2004; Costa & Rodrigues, 2009). The dominant light source is cyclotron radiation from the post shock region, while the light variations are due to the combined effect of the projected area of the emitting region and cycloton beaming (Ferrario & Wickramasinghe, 1990). The variance being maximal during the phases of best visibility of the dominant light source clearly indicates that the cyclotron light source is also responsible for the flickering. Its shape follows rather faithfully the brightness of the system.
4.7 Long term trends
In order to investigate whether the flickering activity suffers systematic variations over time scales of years a decent coverage with data over a long time is required. Moreover, short term brightness variations such as outbursts of dwarf novae and accompanying systematic variations of interfere with any reliable detection of such long term modulations. Thus, only a few CVs remain for which a respective study is viable. In order to improve statistics, measured in the and band are lumped together, after having applied a correction factor to the band data in order to take into account their systematically higher flickering amplitude (Sect. 4.4).
In DQ Her, MV Lyr, GK Per, CP Pup, LX Ser, RW Tri and IX Vel no evidence for long term variations of the flickering activity was detected. In V603 Aql and EX Hya it cannot be excluded that some existing indications for such variations are merely the reflection of systematic effects in the data. They are therefore not considered real. The results for three remaining system, TT Ari, T Pyx and UX UMa, are shown in Fig. 15. Here, is plotted as a function of time. The small black and blue dots represent as measured in individual light curves in the and band, respectively, while the larger red dots are values averaged in time bins of 100 days.
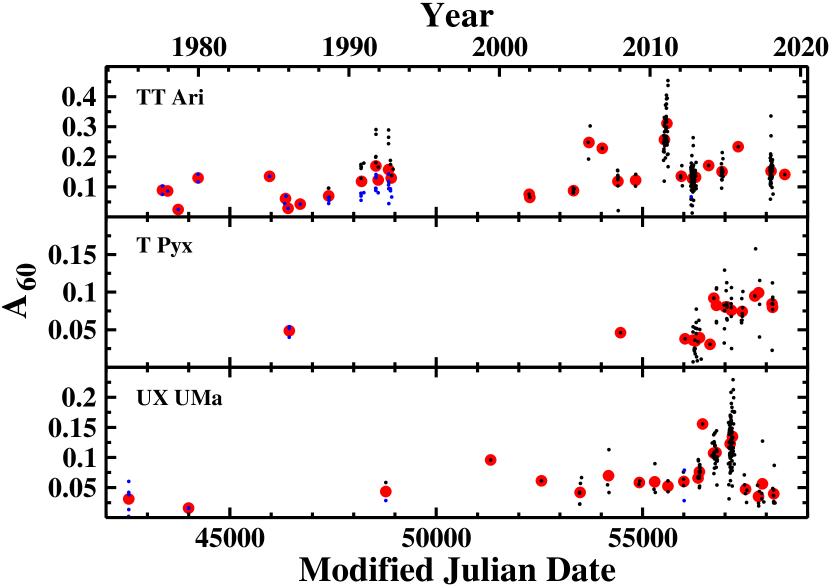
TT Ari: The long term flickering behaviour of TT Ari was already discussed by Bruch (2019). An epoch of enhanced activity is observed in 2010, coincident with the very last phases of the emergence from the 2009–2010 low state when the system was, on average, still about one magnitude below its high state magnitude. Note, however, that there is no linear relationship between and magnitude within the corresponding time interval (see fig. 10 of Bruch, 2019).
T Pyx: With only two exceptions all light curves were observed after the 2011 outburst of this recurrent nova. increases systematically during this period while the brightness of the system still declined towards quiescence. Transforming from magnitude into flux units (Sect. 4.3) reveals that the flux of the flickering light source did not undergo systematic changes during this period. Although possibly not statistically significant, it is interesting to note that the two observations before the outburst yield values for which are similar to those seen just after the outburst when the magnitude was still 1 mag brighter than after returning to quiescent. Considering that the AAVSO long term light curve shows that the quiescent light of T Pyx before the 2011 outburst was about 0.7 mag brighter than afterwards, this means that the flux of the flickering light curve was about the same long before and just after the outburst.
UX UMa: After having remained on an approximately constant level for many years, the flickering activity of this prototypical novalike variable started to increase significantly around 2013, culminated in 2015 and then dropped to the previous level one year later. While otherwise the photometric behaviour of the star remained inconspicuous (Bruch, 2020), the maximum in 2015 coincided with an unprecedented change: UX UMa exhibited a well developed negative superhump (de Miguel et al., 2016; Bruch, 2020) which was not seen in previous or subsequent observing seasons. Since the average out-of-eclipse brightness of the system did not change appreciably the rise of really reflects an increase of the flux of the flickering light source. While it is close at hand to associate the high values of in 2015 to the emergence of the negative superhump, it is not as obvious why the rise already started in previous years without a change of the overall photometric behaviour of UX UMa.
5 Assessment of the results
The phenomenology of flickering is quite broad, and the focus of this study, its strength, is certainly not the only characteristic property. Few attempts have been performed in the past to systematically study the properties of flickering in a larger ensemble of CVs. When it comes to the flickering strength, only the investigation of Fritz & Bruch (1998) (hereafter referred to as FB98), although based on different techniques and significantly fewer data, has a similar breadth. Based on scalegrams derived from a wavelet analysis of CV light curves they define a parameter as a proxy for the flickering strength. Thus, whenever suitable, I will subsequently compare the systematic properties of found here with those of derived by FB98.
When initiating the study I hoped that a comparison of the strength of the flickering activity, based on a great number of light curves in many CVs would shed light on the system parameters which define some basic characteristics of this phenomenon in these interacting binary stars. While some systematic trends could be found, and while it was possible to better quantify some properties of the flickering in CVs than has been done before, to a large degree the initial expectations were frustrated. There is no simple correlation of the flickering strength with parameters such as component masses, orbital inclination, or the like. If any such correlations exist, they are masked by other and stronger dependences which could not clearly be identified.
FB98 found a loose correlation between their parameter and the orbital periods in systems with accretion disks in the bright state (i.e., old nova, novalike variables and dwarf novae in outburst). They interpret this as an indication of a decrease of the flickering strength with the mass accretion rate which, while being difficult to measure individually, is expected to increase on average with the orbital period. Here, I find that the relationship between and period is even less well defined. However, this changes if the period is substituted by the absolute magnitude of the primary component (a quantity not well known for most systems in the pre-Gaia era), recognizing that, again on average, systems with longer periods are brighter and their mass accretion rate grows with the orbital period. Fig. 7 shows that this dependence is a function of the specific CV type, indicating that the mass transfer rate cannot be the only parameter determining the relation. Thus, relating the flickering strength to the absolute magnitude, made possible by the accurate distances provided by the Gaia mission, enables a much more destinct view of the flickering strength in different types of CVs than was hitherto possible.
Most obvious is the striking difference of the flickering strength in UX UMa type novalike variables (and quiescent novae), and in VY Scl stars, as already pointed out by FB98. While in the former flickering occurs on a low level and increases slightly with decreasing system brightness, it is much stonger in the latter (in this case the range of magnitudes covered by the data is not sufficient to reveal a dependence on the system brightness). Since it is not securely known what makes VY Scl exhibit occasional low states and what inhibits low states in UX UMa stars, one can only speculate that the different flickering behaviour is somehow related to the reason for the different long-term photometric properties of the two classes.
Another dependence of flickering strength on magnitude concerns dwarf novae in outburst and quiescence. This is not a new insight, but is better documented here than ever before. While during outburst a dependence of the flickering strength on the magnitude is indicated, such a correlation is not obvious in quiescence, considering the large observed scatter of . Moreover, there is no continuous transition of the average values of between outburst and quiescence, but rather a dichotomy see Fig. 7.
Not only is the dependence the flickering strength on the magnitude of the primary component different for different CV subtypes, but there are also striking exceptions. These refer in particular to CVs with exceptionally bright primaries (and long orbital periods) such as GK Per and RS Oph. For no obvious reason flickering in these systems is much stronger than in intrinsically fainter novae and UX UMa stars.
The evolution of the flickering strength through the dwarf nova outburst cycle suggests a dependence on the state of the accretion disk. During outburst phases , expressed in magnitudes, remains constant over a wide brightness range. At a higher level, the same is as least approximately true during quiescence. Independency of on magnitude means, of course, that the flux of the flickering light source increases or decreases in the same proportion as the total light of the system. Thus, adopting the disk instability model for dwarf nova outbursts, the relative contribution of the flickering light source is much reduced when the accretion disk is on the upper branch of the S curve. If it is also reduced on an absolute scale depends on the outburst amplitude. To show this, in Fig. 16 (black graph) the spline fit to the vs. relation (Fig. 9) has been transformed into a relation between the total band flux and the integrated optical flux of the flickering light source, using the relation shown in Fig. 13 (here it is assumed that the band flux is proportional to the total optical flux). It is characterized by a linear rise of the flickering flux at high total brightness (outburst) and another (almost) linear rise at low brightness (quiescence), connected by a transition phase. During both, quiescence and outburst, the flickering flux is of the same order of magnitude. The definition of implies an outburst amplitude of 1 mag. Of course, in real dwarf nova systems the amplitudes are in general larger. To simulated this, the magnitude axis in Fig. 9 was stretched by a factor of 2 and 3, corresponding thus to outburst amplitudes of 2 and 3 mag. In Fig. 16 this translates into the blue and red curves, respectively. It is then seen that in a realistic case (amplitude of 3 mag or more) the total optical flux of the flickering light source is smaller during quiescence than during outburst, even if is much larger. Thus, not surprisingly, the changing disk structure during the dwarf nova outburst cycle is not only reflected in the total brightness of the system, but also affects the flickering light source.
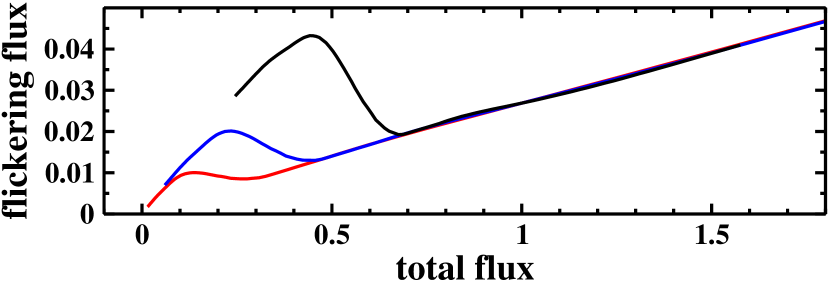
At first glance, the evolution of the flickering strength in dwarf novae as a function of outburst phase found here appears to contradict the earlier results of FB98 which are based on data restricted to only 5 systems (not counting Z Cha which FB98 identify as an exceptional case). They concluded that during the outburst cycle the intrinsic flickering amplitude changes as the square root of the mean light of the system, but also raise doubts about the universal validity of such a simple law. However, this contradiction may merely be a matter of interpretation of their Fig. 16 which is, to a certain degree, the equivalent of Fig. 9 of the present paper. FB98 fit the relation between their m and , i.e, the variation of magnitude and over the outburst cycle, by a straight line. In view of the scatter of data points, this is justified. However, a close look at their figure (disregarding the exceptional behaviour of Z Cha) shows that the distribution of far above quiescence can equally well be considered as being independent from m. This is particularly clear regarding only V436 Cen, V442 Cen and VW Hyi which have similar outburst amplitudes such that a transformation to normalized magniudes is not necessary. This becomes even clearer regarding Fig. 17. Here, he insert shows the relationship between and for all light curves for which both quantities have been measured. The red curve is a third order least squares fit to these data. This has been used to transform the values of the three CVs mentioned above into which are plotted in the main frame of Fig. 17 as a function of the magnitude above the average quiescence. It is quite similar to Fig. 9. Thus, no contradiction between FB98 and the present results exists.
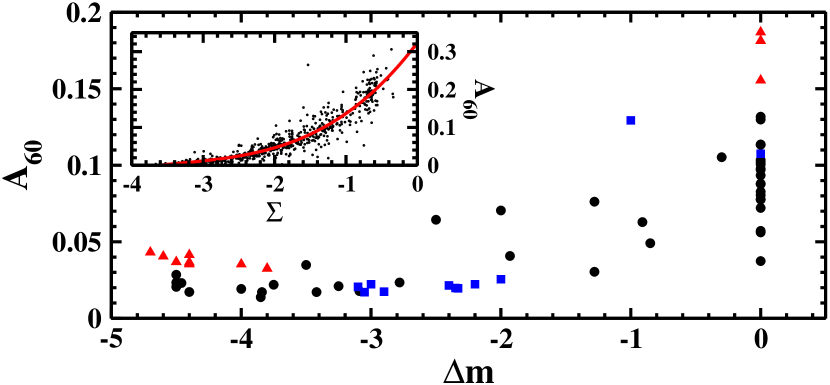
The wavelength dependence of the flickering strength or its colours have occasionally been measured in individual systems (e.g., Middleditch & Córdova, 1982; Horne & Stiening, 1985; Hoard et al., 1997; Zamanov et al., 2015) and, more rarely, in small ensembles of CVs (e.g. Bruch, 1992a). It is always found that at optical wavelengths the flickering amplitude increases with decreasing wavelength. Moreover, FB98 found some evidence for shorter flickering flares to be at least on the average somewhat bluer than longer ones. FB98 also pointed out that – as has not generally been realized – the wavelength dependence of the flickering does not directly reflect the spectrum of the flickering light source. In order to quantify the latter, it is necessary to correct for the wavelength dependent contribution(s) of the non-flickering sources(s) to the total light. While this may be difficult to do for individual systems, a statistical approach is adopted here. It is then found that on the mean over most of the optical range the flickering spectrum can equally well be approximated by a power law with a spectral index of and a back body with a temperature of 17 000 K. Only in the band an excess over these simple laws is observed which increases if the flickering light source is less than 100% modulated. Qualitatively, this excess can be explained by enhanced emission in the Balmer continuum and/or from higher Balmer lines. Confirmation for this idea must await more detailed model calculations for the spectrum, or – observationally – detailed and statistically sound spectrophotometry of the flickering light source.
The range of brightness modulations of flickering in many CV light curves immediately suggests that an appreciable fraction of the total optical radiation is due to the flickering light source. This is quantified here. In particular in quiescent dwarf novae and VY Scl stars the elevated values of imply that on the temporal average easily 15 % or more of the total energy emitted in the optical range is due to flickering. This reinforces my opinion, expressed many years ago (Bruch, 1992b, 1995), that we cannot claim to really understand CVs as long as the origin of flickering remains unknown. The only attempt that I am aware of to reconcile the amount of energy radiated by the flickering light source in a disk dominated system with predictions derived from models was recently performed by Dobrotka et al. (2020). They try to explain optical flickering in MV Lyr as reprocessed unstable X-ray radiation from a corona above the inner disk and find that the available X-ray energy is only sufficient to explain a small fraction of the optical flickering.
It is not surprising that flickering in polars is stronger when the accretion foot point on the surface of the white draws is viewed favourably, as evidenced in the case of V834 Cen (Sect. 4.6.3), suggesting that this is its place of origin. More surprising is a dependence of the flickering strength on the superhump phase in the permanent superhump systems TT Ari and V795 Her as indicated by the respective variance curves. But these only reflect the shape of the light curve in general terms, not in detail. Remembering that the superhump phenomenon is thought to arise due to the extra stress exerted on an elliptically deformed accretion disk when the secondary star passes close to the elongated part of the disk, it might be conjectured that this additional pertubation leads to enhanced disturbances and, in consequence, to stronger flickering. Being aware that this is only a speculative explanation, I will refrain from pondering further about details of the structure of the variance curves.
A dependence of the visibility of structures in the accretion disk on orbital phase in high inclination CVs may also lead to a phase dependence of flickering if its light source is distributed asymmetrically. Indeed, in the three systems investigated in this respect the variance due to flickering is clearly a function of phase. But this finding does not lead to a systematic picture, since the phase dependence is neither the same nor does the variance seem to follow systematic brightness variations around the orbit (e.g., hot spots).
Even for a given object in a well defined photometric state , measured in different light curves, can assume significantly different values, as evidenced by the standard deviations quoted in Table 1 which sometimes assume the same order of magnitude as the mean values themselves. This scatter is certainly in part due to the inherent uncertainties in the determination of in particular in light curves which are not of the best quality (S/R, time resolution). In the face of difficulties to quantify these uncertainties, assessing if the short term variations of the flickering strength are at least partly real, is not easily possible. Regarding dwarf novae in quiescence, the mean values quoted in Table 1 are, in general, based on light curves encompassing a range of average magnitudes. In these cases variations of are not surprising and are likely real to a certain degree. During outburst, when the ensemble of all present data indicates no dependence of the flickering strength on magnitude, the numerical values of are small, enhancing the contribution of measurement errors to their scatter. But also in non-outbursting systems the standard deviation of the average of can be quite high, suggesting real changes of the flickering strength over time.
As detailed in Sect. 4.7 the available data permit only in a small number of CVs an assessment of systematic long term variations of . In only 3 out of 12 systems apparently systematic deviations of from an otherwise more or less constant value have been seen. The few identified events may all be associated to changes in the structure of the systems. This confirms the findings of FB98, but extends the investigated time base by more than a factor of 2.
6 Summary and outlook
Flickering is an elusive phenomenon. In spite of its general presence in accreting systems I am not aware of any model which can really explain the underlying physics. The models promoted in the literature (see references in Sect. 1), referring to disk dominated CVs, mostly invoke turbulences and the ensuing propagation of mass transfer fluctuations. Others (e.g. Scaringi, 2014; Dobrotka et al., 2017) additionally conjecture reprocessing of variable X-ray emission to explain optical flickering. X-ray reprocessing is also invoked as the origin of optical flickering in magnetic systems (e.g. Semena et al., 2014).
Concentrating on disk dominated CVs, the models are mostly heuristic, without a solid phyiscal base. They have deficiencies at both ends: At the beginning, since they do not specify the physical origins of such turbulences. Consequently, any assumptions about the frequency, amplitude or place of origin of such turbulences are ad hoc and not based on physical principles. At the other end, quantities such a the power spectra of the propagated turbulences (density fluctuations) are derived from the models and compared to flickering power spectra. But it remains an open question how the presumed density fluctuations are transformed into brightness variations. Few attempts to solve this question have come to my knowledge (and they are not necessarily related to models of propagating turbulences). The theoretical study of Kley & Papaloizou (1997), investigating instabilities in the boundary layer may be seen as a step in this direction. They find burst-like variations of the luminosity which, as they say, could have important observational consequences. In a different approach Pearson et al. (2005) model the time dependent emission of fireballs. The results are compatible with the properties of individual flares in flickering light curves (see also Bruch, 2015). I also mention Williams & Maletesta (2002) who carried out hydrodynamical simulations of flares in CV disks. Moreover, it has never been shown that any of the models is able to explain the observed flickering amplitude, i.e., the often considerable fractional contribution of the flickering light source to the total optical luminosity of the systems. While I recognize that the idea of propagating disturbances in accretion disks may well be part of the solution of the flickering enigma, I am afraid that the undoubted progress achieved during the past two or three decades only refers to the simpler part of the problem, disregarding the physics at the two ends mentioned above.
The situation appears to be somewhat more favourable when it comes to magnetic CVs. Here, more detailed models of the time dependent structure and emission from accretion shocks and the post-shock region above the white dwarf surface have been developed. For a brief overview and further references, see the introductory section of Semena et al. (2014).
Having said this, I emphasize that it has not been the purpose of this study to address the issues raised above. Instead, investigating a single property of flickering, namely its strength relative to the total brightness of the underlying object, parameterized by as a proxy of the average amplitude, it was attempted to find systematic features in its behaviour, such as correlations with other properties, which may shed light on its origins, and in order to identify boundary conditions for physical models.
To do so, many more data of numerous CVs have been investigated than ever before in any single observational study of flickering. Tools and reduction procedures for a rigorous determination of the flickering strength, rendering possible a comparison of measured in light curves of diverse characteristics, have been developed. This enabled to (i) identify patterns in the flickering properties depending on the absolute magnitude of the primary component, (ii) the quantification of the average broad band spectrum of the flickering light source and its contribution to the overall optical flux, (iii) a dependence of the flickering strength on the orbital phase in some systems and (iv) a remarkable systematic behaviour of the flickering around the outburst cycle of dwarf novae.
Concluding, and as a personal remark, I wonder if, in spite of all the detailed knowledge about flickering gained during the past and possibly in the future, we will ever really understand it. Or will the focus of science shift, and flickering be left as an interesting phenomenon the understanding of which is not essential for further progress in astrophysics?
Acknowledgements
This work is partly based on observations taken at the Observatório do Pico dos Diaz operated by the Laboratório Nacional de Astrofísica, Brazil. Many observers worldwide have generously put their data at my disposal. A great amount of archival data were downloaded from the AAVSO International Database and other data banks. I thank the numerous dedicated AAVSO and other observers for their contributions, and the AAVSO staff for maintaining their valuable database. Without their efforts this work would not have been possible. I am also grateful to Claudia V. Rodrigues for a critical reading of the manuscript and for the helpful comments on an anonymous referee. This research made use of the VizieR catalogue access tool, CDS, France (DOI: 10.26093/cds/vizier).
Data availability
The majority of the data used in this article are available in the AAVSO International Database (https://www.aavso.org), the OPD databank (https://www.gov.br/mcti/pt-br/rede-mcti/lna/composicao/coast/obs/opd) and the MEDUZA archive (http://var2.astro.cz/EN/meduza/index.php). Data not to be found in these archives will be shared on reasonable request to the author.
References
- Bailer-Jones et al. (2018) Bailer-Jones C.A.L., Rybizki J., Fouesneau M., Mantelet G., Andrae R., 2018, AJ, 156, 58
- Bailey et al. (1983) Bailey J., Axon D.J., Hough J.H. et al., 1983, MNRAS, 205, 1p
- Brandi et al. (2009) Brandi E., Quiroga C., Mikolajewska J., Ferrer O.E., García, L.G., 2009, A&A, 497, 815
- Bruch (1991a) Bruch A., 1991, A&A, 251, 59
- Bruch (1992a) Bruch A., 1992a, A&A, 266, 237
- Bruch (1992b) Bruch A., 1992b, in Vogt N., ed., ASP Conf. Series, Vol. 29, Viña del Mar Workshop on Cataclysmic Variable Stars, p. 47
- Bruch (1992b, 1995) Bruch A., 1995, in Greiner J., Duerbeck H.W., Gershberg R.E., eds, Proc. IAU Coll. 151, Flares and Flashes, p. 288
- Bruch (1996) Bruch A., 1996, A&A, 312, 97
- Bruch (2015) Bruch A., 2015, A&A, 579, A50
- Bruch (2018) Bruch A., 2018, New Astr., 58, 53
- Bruch (2019) Bruch A., 2019, MNRAS, 489, 2961
- Bruch (2020) Bruch A., 2020, New Astr., 78, 101369
- Buckley et al. (1992) Buckley D.A.H., O’Donoghue D., Kilkenny D., Stobie S.R., & Remillard R.A., 1992, MNRAS, 258,285
- Cropper et al. (1986) Cropper M., Menzies J.W., Tapia S., 1986, MNRAS, 218, 201
- Costa & Rodrigues (2009) Costa J.E.R., Rodrigues C.V., 2009, MNRAS, 398, 240
- Dai et al. (2013) Dai Z.B., Qian S.B., Li L., 2013, ApJ, 774, 153
- Deeming (1975) Deeming T.J., 1975, Ap&SS, 39, 137
- de Miguel et al. (2016) de Miguel E., Patterson J., Cejudo D. et al., 2016, MNRAS, 457, 1447
- Dobrotka et al. (2012) Dobrotka A., Mineshige S., Casares J., 2012, MNRAS, 420, 2467
- Dobrotka et al. (2017) Dobrotka A., Ness J.-U., Mineshige S., Nucita A.A., 2017, MNRAS, 468, 1183
- Dobrotka et al. (2020) Dobrotka A., Nogoro H., Konopka P., 2020, A&A, 640, A55
- Dobrzycka et al. (1996) Dobrzycka D., Kenyon S.J., Milone A.A.E., 1996, AJ, 111,414
- Elsworth & James (1982, 1986) Elsworth Y.P., James J.F., 1982, MNRAS, 198, 889
- Elsworth & James (1986) Elsworth Y.P., James J.F., 1986, MNRAS, 220, 895
- Fritz & Bruch (1998) Fritz T., Bruch A., 2015, A&A, 332, 586
- Ferrario & Wickramasinghe (1990) Ferrario L., Wickramasinghe D.T., 1990, ApJ, 357, 582
- Gänsicke et al. (2009) Gänsicke B.T., Dhillon M., Southworth J. et al., 2009, MNRAS, 397, 2170
- Garcia et al. (1999) Garcia A., Sodré Jr. L., Jablonski F.J., & Terlevich R.J., 1999, MNRAS, 309, 803
- Greiner et al. (2010) Greiner J., Schwarz R., Tappert C. et al., 2010, Astron. Nachr., 331, 227
- Herbst & Shevchenko (1999) Herbst W., Shevchenko V.S., 1999, AJ, 118, 1043
- Hoard et al. (1997) Hoard D.W., Baptista R., Eracleous M. et al., 1997, MNRAS, 288, 691
- Horne & Baliunas (1986) Horne J.H., Baliunas S.L., 1986, ApJ, 302, 757
- Horne & Stiening (1985) Horne K., Stiening R.F., 1985, MNRAS, 216, 933
- Imamura et al. (2000) Imamura J.N., Steiman-Cameron T.Y., Wolff M.T., 2000, PASP, 112, 18
- Kalużny (1989) Kalużny J., 1989, Acta Astron., 39, 235
- Kenyon et al. (2000) Kenyon S.J., Kolotilov E.A., Ibragimos M.A., Mattei, J.A., 2000, ApJ, 531, 1028
- Kley & Papaloizou (1997) Kley W., Papaloizou J.C.B., 1997, MNRAS, 285, 239
- Lomb (1976) Lomb N.R., 1976, Ap&SS, 39, 447
- Lyubarskii (1997) Lyubarskii Yu.E., 1997, MNRAS 292, 679
- Middleditch & Córdova (1982) Middleditch J., Córdova F.A., 1982, ApJ, 255, 585 1991, ApJ, 382, 315
- Middleditch et al. (1991) Middleditch J., Imamura J.N., Wolff M.T., Steiman-Cameron T.Y., 1991, ApJ, 382, 315
- Morales-Rueda et al. (2002) Morales-Rueda L., Still M.D., Roche R., Wood J.H., Lockley J.J., 2002, MNRAS, 329, 597
- Papdaki et al. (2006) Papadaki C., Boffin H.M.J., Sterken C. et al., 2006, A&A, 456, 599
- Paczynksi & Schwarzenberg-Czerny (1980) Paczynski B. Schwarzenberg-Czerny A., 1980, Acta Astron., 30, 127
- Patterson & Skillman (1994) Patterson J., Skillman D.R., 1994, PASP, 106, 1141
- Pavlidou et al. (2001) Pavlidou V., Kuijpers J., Vlahos L., Isliker H., 2001, A&A, 372, 326
- Pearson et al. (2005) Pearson K.J., Horne K., Skidmore W., 2005, ApJ, 619, 999
- Potter et al. (2004) Potter S.B., Romero-Colmenero E., Watson C.A., Buckley D.A.H., Phillips A., 2004, MNRAS, 348, 316
- Ritter & Kolb (2003) Ritter H., Kolb U., 2003, A&A, 404, 301
- Savitzky & Golay (1964) Savitzky A., Golay M.J.E., 1964, Analytical Chemistry, 36, 1627
- Scargle (1982) Scargle J.D., 1982, ApJ, 263, 853
- Scargle et al. (1993) Scargle J.D., Steiman-Cameron T.Y., Young K., et al., 1993, ApJ, 411, L91
- Scaringi (2014) Scaringi S., 2014, MNRAS, 438, 1233
- Scaringi et al. (2014) Scaringi S., Maccarone T.J., Middleton S., 2014, MNRAS, 445, 1031
- Schaefer (2018) Schaefer B.E., 2018, MNRAS, 481, 3033
- Schoembs & Stolz (1981) Schoembs R., Stolz B., 1981, IBVS, 1986
- Schwope et al. (1993) Schwope A.D., Thomas H.-C., Beuermann K., Reinsch K., 1993, A&A, 267, 103
- Šimon et al. (2012) Šimon V., Polášek C., Štrobl J., Hudec R., Blažek M., 2012, A&A, 540, A15
- Semena et al. (2014) Semena A.N., Revnivtsev M.G., Buckley D.A.H. et al., 2014, MNRAS 442, 1123.
- Sokoloski et al. (2001) Sokoloski J.L., Bildsten L., Ho W.C.G., 2001, MNRAS, 236, 553
- Tappert et al. (2020) Tappert C., Vogt N., Ederoclite A., 2020, A&A, 641, A122
- van der Klis (2004) van der Klis M., 2004, arXiv e-prints [arXiv:astro-ph/0410551]
- Walraven & Walraven (1960) Walraven T., Walraven J.H., 1960, Bull. Astron. Inst. Neth., 15, 67
- Warner (1995) Warner B., 1995, Cataclysmic Variable Stars, Cambridge University Press, Cambridge
- Warner & Nather (1971) Warner B., Nather R.E., 1971, MNRAS, 152, 219
- Williams & Maletesta (2002) Williams G., Maletesta K., 2000, AJ, 123, 1095
- Yonehara et al. (1997) Yonehara A., Mineshige S., Welsh W.F., 1997, ApJ, 486, 388
- Zamanov et al. (2015) Zamanov R.K., Boeva S., Latev G., Stoyanov K.A., Tsvetkova S.V., 2015, AN, 336, 189
Appendix A The secondary star contribution
The contribution of the secondary star to the light of a CV can have a substantial bearing on the observed flickering amplitude. In order to apply a correction, it must be known how much light is due to the secondary at the observed wavelength. Numerical values for this contribution taken from the literature often refer to a different wavelength. Then, a reduction to the observed wavelength is required, involving numerous assumptions which will be outlined here together with an assessment of the resulting uncertainties.
The approach used here assumes that the secondary star radiates like a black body. Sometimes the temperature is quoted in the literature. However, more often, information on its spectral type is available. Then, the corresponding temperature is interpolated in the relevant tables (e.g. Schmidt-Kaler, 1982). The primary spectrum is assumed to be that of a standard steady state accretion disk (Lynden-Bell & Pringle, 1974, being aware that his is only a rough approximation in the case of quiescent dwarf novae). It is defined by the inner and outer disk radii, the mass of the central star, and the mass transfer rate in the disk. If available, the white dwarf mass is taken from the literature. Otherwise the average mass (Zorotovic et al., 2011) is adopted. Its radius, calculated using Nauenberg’s (1972) mass-radius relation for white dwarfs, is taken to be the inner disk radius. The outer radius is assumed to be equal to 40% of the component separation, calculated from Kepler’s third law, using literature values for the mass of the secondary star, or an estimate based on its spectral type (this is not a critical parameter), and the orbital period. Unless more specific values are found in the literature for the mass accretion rate, a standard value of is used if the accretion disk is in a bright state (e.g., in novalike variables or old novae), and if it is in a faint state. Any effect that emission lines may have on the spectrum are not taken into account. Knowing thus the spectra of the two components the contribution of the secondary star to the total light at a wavelength can be calculated if it is known at another wavelength .
The procedure involves 5 independent parameters, namely the primary star mass (which also determines the inner disk radius via the mass-radius relation for white dwarfs), the secondary star mass (or, equivalently, the mass ratio , if is given), the orbital period which together with the component masses determines the component separation, the outer disk radius expressed in units of the component separation , and the mass transfer rate in the disk.
In order to get a feeling for the dependence of the secondary star contribution at a given wavelength on these parameters, I investigate a typical case of a CVs contributing 20% to the total light at 7000 Å. What is its contribution at the isophotal wavelength of the band (5468 Å)? The answer is given in Fig. 18 where is shown as a function of . In all four frames the black graph refers to what may be considered a standard case: , , , and . The coloured graphs in the different frames then explore the situation when one of the parameters is modified, fixing all the others. Note that not all parameter combinations may be realized in nature.
In the upper left frame, the mass ratio is changed. Of all parameters this has the greatest bearing on , in particular at high primary star masses: A higher mass ratio implies a larger mass for the secondary, and thus a higher temperature and a bluer spectrum. It will thus contribute relatively more at short wavelengths. The upper right frame shows that the influence of the orbital period is quite small. The same is true for the outer disk radius (lower left frame). Finally, the lower right frame shows that the mass transfer rate is of intermediate importance. But note, that at very high mass transfer rates a secondary star contribution of as much as 20% at 7000 Å is not very likely.

This little exercise shows that the secondary star contribution in the band can be estimated within tolerable errors (considering the numerous other error sources involved in determining the flickering amplitude) if it is known at some other wavelength (noting that any such estimate has, in general, also considerable uncertainties). At shorter wavelengths the contribution will be smaller, meaning that errors in its determination will have a smaller impact on the corrected amplitude.
The secondary star contribution to the total light was determined for the 25 CVs listed in In Table4. The specific information required to derive these numbers comes from numerous literature sources. The fractional contribution is given only for those passbands for which light curves of the respective system are available. is the reference magnitude to which these values refer.
| Name | ||||||
|---|---|---|---|---|---|---|
| RX And | 14.00 | 0.04 | 0.25 | 0.30 | 0.42 | |
| DX And | 15.05 | 0.86 | ||||
| AT Ara | 14.90 | 0.58 | 0.66 | |||
| V363 Aur | 14.50 | 0.19 | 0.35 | |||
| SY Cnc | 12.20 | 0.24 | 0.35 | |||
| AC Cnc | 14.30 | 0.19 | 0.30 | 0.40 | ||
| BV Cen | 13.05 | 0.23 | 0.35 | 0.50 | ||
| MU Cen | 14.95 | 0.73 | ||||
| V442 Cen | 15.00 | 0.35 | ||||
| ST Cha | 16.46 | 0.30 | ||||
| T CrB | 11.65 | 0.10 | ||||
| SS Cyg | 12.10 | 0.17 | 0.35 | 0.43 | ||
| EM Cyg | 12.90 | 0.04 | 0.09 | 0.19 | ||
| DO Dra | 15.90 | 0.02 | 0.08 | 0.24 | 0.38 | |
| U Gem | 14.25 | 0.13 | 0.23 | |||
| AH Her | 14.30 | 0.06 | 0.13 | 0.19 | ||
| BT Mon | 15.50 | 0.02 | ||||
| RS Oph | 11.50 | 0.07 | 0.25 | 0.55 | 0.72 | 0.85 |
| V426 Oph | 12.80 | 0.07 | 0.16 | 0.33 | ||
| V345 Pav | 13.71 | 0.23 | 0.36 | |||
| IP Peg | 15.25 | 0.04 | 0.11 | 0.28 | 0.44 | |
| GK Per | 13.10 | 0.27 | 0.34 | 0.38 | 0.40 | 0.40 |
| RW Sex | 11.66 | 0.01 | 0.02 | 0.04 | 0.07 | 0.11 |
| RW Tri | 13.23 | 0.01 | 0.03 | 0.05 | ||
| UX UMa | 12.90 | 0.01 | 0.03 | 0.06 |
Hereafter, a brief discussion follows of those systems of this study with a noticeable contribution of the secondary star to the total light.
RX And: Hutchings & Thomas (1982) observed absorption lines in the blue spectrum of RX And and remark that “compared with SS Cyg, the late-type spectrum appears similar, but less intense by a factor of about two”. In the same spectral range Stover (1979) estimate the late type star contribution in SS Cyg to be 45%. Bitner et al. (2007) come to a similar conclusion. Thus, it should be of the order of 20% – 30% in RX And. To be definite, I will adopt a contribution of 25% in , assuming that this holds for the average quiescent magnitude of 14 mag. With a primary star mass of (Sion et al., 2001) and a secondary corresponding to a main sequence star with a spectral type K4.75 (Knigge, 2006) the contribution in other band as listed in Table 4 results.
DX And: Bruch et al. (1997) determined the veiling factor due to the dilution of the primary star light by the dominating secondary. This translates into a fractional contribution of the secondary to the total light of 86% in the band. I assume that this value refers to the average quiescent magnitude of DX And, i.e., 15.05 mag according to the AAVSO long term light curve. Although the veiling is quite strong, considering that the data used in the present study were all obtained close to outburst maximum, the contribution of the secondary star is very much reduced and the corresponding correction is small.
AT Ara: The secondary contributes a significant fraction of the total light of AT Ara. The veiling factor derived by Bruch (2003) yields a secondary contribution of 65% in the wavelength range centred on 6300 Å. Using the standard assumptions, this leads to a contribution of 58% in the band and 66% in the band. The exact magnitude of AT Ara at the time of the spectroscopic observations is not known. I take it to be the average quiescent magnitude of 14.9 mag (Bruch & Engel, 1994).
V363 Aur: Thoroughgood et al. (2004) estimate that of the blue light and of the red light originates from the secondary. I assume that this hold for the average out-of-eclipse magnitude of 14.5 mag.
SY Cnc: According to Casares et al. (2009) the mass ratio of SY Cnc is and the spectral type of the secondary is G82 V. They estimate its contribution to the total light of the system to be at H, while Vande Putte et al. (2003) find a smaller contribution of only 20% at 8000 Å. This apparent contradiction is resolved considering that according to the long-term AAVSO light curve the stronger contribution was measured in spectroscopic data when SZ Cnc was at the very end of the decline from an outburst at an average visual magnitude of 13.2 mag, while the system just started the decline from maximum at an average magnitude of 11.8 mag in the other case. Then, the secondary contribution should be 12% at H in the brighter state and somewhat more than that at 8000 Å. This is of the observed order of magnitude. Assuming the secondary to contribute 42% of the light at H, it is supposed to contribute 24% and 35%, respectively, at the isophotal wavelength of the and bands at 13.2 mag.
AC Cnc: Thoroughgood et al. (2004) estimate that of the blue light and of the red light originates from the secondary. Its contribution in the band should then be approximately 30%. I assume that this holds for the average out-of-eclipse magnitude of 14.3 mag.
BV Cen: Vogt & Breysacher (1980) classify the secondary star as G5-8 IV-V and estimate its contribution to the total light in the band as about 50%. A similar value can be derived from fig. 4 of Gilliland (1982). This holds for quiescence at a magnitude of 13.05 mag averaged over the orbital cycle. Using a mass transfer rate of (Sion et al., 2007) then yields a contribution of 35% at and 23% at .
MU Cen: The light curves of MU Cen are dominated by ellipsoidal variation of the secondary star. Model fits of Bruch (2016) indicate that it contributes 73% in the band at the average magnitude of 14.95 mag.
V442 Cen: There is no information in the literature about the contribution of the scondary star to the total optical light of the system. However, at the long orbital period of about 11 h (Marino & Walker, 1984) and the early spectral type of the secondary (G62; Harrison et al., 2004) it is expected to contribute a considerable fraction. The spectral type being similar to that of the BV Cen secondary and the orbital period also being comparable, I will assume – somewhat arbitrarily – that the secondary contribution to the total light in the band in V442 Cen is the same as in BV Cen, i.e., 35%. This holds true for the quiescent magnitude which I take to be 15.0 mag.
ST Cha: At the orbital period of about 5.5 mag (Bruch & Diaz, 2017) it should be expected that the secondary star contributes non-negligibly to the total system light. However, no specific information relative to this question is available in the literature. Therefore, I (rather arbitrarily) assume a contribution of 30% (at , the average magnitude of the observed light curve), slightly less than the contribution of 42.5% derived for SS Cyg which has a one hour longer period.
T CrB: The secondary star strongly dominates the total light of T CrB in . Zamanov & Bruch (1998) estimate that it can contribute 90%. However, this number is uncertain. Correcting the amplitude of the flickering in the visual for the contribution of the secondary star may therefore lead to huge errors. Therefore, I prefer to use only data obtained in the band for this study. Here, the secondary contributes much less and any results are therefore more reliable. Zamanov & Bruch (1998) calculated that 10% of the total light comes from the red component at these wavelengths. This hold for the average magnitude of their sample, which is 11.65 mag.
SS Cyg: Based on spectroscopic observations at an epoch when SS Cyg had a visual brightness of mag according to the AAVSO long-term light curve, Bitner et al. (2007) measured a contribution of the primary component to the total light at 5500 Å (i.e., very close to the isophotal wavelength of the band) of . The secondary is then responsible for 42.5%. With the temperature appropriate for its spectral type of K4V – K5V (Stover et al., 1980; Cowley et al., 1980; Bailey, 1981; Friend et al., 1990; Harrison et al., 2000; North et al., 2002) the contribution in other bands can be calculated.
EM Cyg: The analysis of EM Cyg is complicated by an unrelated star of spectral type K2-5 V along the line of sight, discovered by North et al. (2000) who find that it contributes 16% to the observed light. Moreover, the secondary star, which is of a very similar spectral type of K3, contributes % to the remaining light. Then, the combined light of the late type stars constitutes 35% of the total. This holds true at an average wavelength of 6450 Å and at an epoch, when EM Cyg was at an approximate visual magnitude of 12.9 mag according the the AAVSO long time light curve. The usual assumptions then lead to a combined contribution of the K stars to the total light of about 4% in the band, 9% in and 19% in .
DO Dra: According to Mateo et al. (1991) the secondary star contributes 55% of the total light of DO Dra at 8200 Å. A mass transfer rate of the order of (Patterson et al., 1992) together with the usual assumptions lead to contributions of 2% in , 8% in , 24% in and 38% in . The flux level of the spectra used by Mateo et al. (1991) correspond roughly to an average magnitude of . Again using the assumption about the spectral behaviour of the components defined above, this translates into a magnitude in the band of 15.90 mag.
U Gem: The model calculations of Zhang & Robinson (1987) yield an average contribution of the secondary of 23% to the total light in the band at a visual magnitude of mag. Wade (1979) also observed an appreciable secondary star contribution, but in this case the error margins are too wide to reliably infer a numerical value. Using the contribution of 23% derived by Zhang & Robinson (1987), the usual assumptions yield a contribution of 13% in the band.
AH Her: Absorption features of the secondary star were seen in the optical spectrum of AH Her by Horne et al. (1986) and Bruch (1987). The latter author restricted the spectral type to be in the range . He also determined the distance as a function of the spectral type. It is consistent with the GAIA distance of pc if . Then, the contribution of the secondary star to the total light at 5900 Å is about 15% at a visual magnitude of 14.3 mag. This agrees well with a contribution of 10% – 15% at 5200 Å (and 30% – 40% at 6500 Å) found by Horne et al. (1986). Using the usual assumptions yields a secondary contribution of 6% in , 13% in and 19% in .
BT Mon: Smith et al. (1998) detected weak late type absorption lines in the spectrum of BT Mon. They classified the secondary as being of type G8 and found that while its contribution out-of-eclipse is of the order of 8% in the red, it is virtually zero in the blue (4570 – 5370 Å; see their Fig. 14). Interpolation in the same figure indicates that the contribution in the band should be of the order of 2%. This is assumed to hold for the average out-of-eclipse magnitude of 15.5 mag.
RS Oph: The secondary star being a red giant, its contribution to the total optical light of RS Oph is expected to be substantial. Kelly et al. (2014) estimated that the giant star should be 0.65 mag fainter in than the total magnitude of 11.5 mag of the binary system. This corresponds to a secondary star contribution of 55%. Anupama & Mikolajewska (1999) classify the cool component of RS Oph as M0 III and find that the hot component mimics a B9-A4 star. Adopting A0 for the latter, and using the colours derived from synthetic photometry listed by Pickles (1998), I find secondary star contributions of 7% in , 25% in , 72% in and 85% in .
V426 Oph: Hessman (1988) estimates that the secondary star of V426 Oph contributes 1/3 of total light in the band when the system had a band brightness of 13.2 mag. With the average quiescent colours taken from Bruch & Engel (1994) this corresponds to . Adopting a spectral type of K3 for the secondary (Hessman, 1988) the usual assumptions leads to contribution of 7% in U, 16% in , 33% and .
V345 Pav: The spectrum of V345 Pav is peculiar in the sense that it exhibits metallic absorption lines typical of a G8 dwarf star which cannot be attributed to the secondary of the CV system. Instead, Buckley et al. (1992) conjectured the presence of a third star which contributes 235% to the band light. The usual assumptions then lead to a contribution of 36% in . I take this to hold true for the average magnitude of 13.71 mag of the present data.
IP Peg: The secondary star of IP Peg contributes appreciably to the optical light. However, it is only quantified in the near infrared passbands (Ribeiro et al., 2007; Froning et al., 1999; Szkody & Mateo, 1986; Littlefair et al., 2001). The usual assumptions then yield to a rough estimate of this contribution of 4% in , 11% in , 28% in and 44% in . I assume that this refers of an average quiescent magnitude of 15.25 mag.
GK Per: The optical spectrum is strongly affected by absorption lines of a slightly evolved late type star of type K2 (Kraft, 1964; Gallagher & Oinas, 1974; Crampton et al., 1986; Garlick et al., 1994; Reinsch, 1994). Gallagher & Oinas (1974) estimate the contribution of the secondary star to the total light in September 1973 to be approximately one-third at the wavelength of the Ca II 4227 Å absorption line. At the time of their observations GK Per had a visual magnitude of 13.1 mag (Bianchini & Sabbadin, 1983). Similarly, Crampton et al. (1986) estimate a contribution of 33% at 4200 Å during their 1984 observations. They do not specify the magnitude of the system, but from the AAVSO long term light curve an average magnitude of mag is derived. Finally, Reinsch (1994) also quotes a contribution of 1/3 in the spectral range between 4200 Å and 5000 Å, when the average magnitude of the system according to the AAVSO long term light curve was at the same level. The disk spectrum resulting from the usual assumptions depends most strongly on the unknown inner disk radius which is expected to be truncated in this intermediate polar. I rather arbitrarily take it to be the co-rotation radius of the white dwarf. I then find fractional contributions of the secondary star in the , , , and bands of 27%, 34%, 38%, 40% and 40%, respectively, at a visual magnitude of 13.1 mag.
RW Sex: Beuermann et al. (1992) suggest that the late type star, being of spectral type M0, contributes about 10% to the light at 8000 Å. With the usual assumptions and adopting a mass accretion rate of (Bolick et al., 1987) the fractional contributions of the secondary star to the total light in the , , , and bands are, respectively, 0.6%, 1.6%; 4.1%, 6.7% and 11.1%. This holds for the average magnitude of (Bolick et al., 1987).
RW Tri: Poole et al. (2003) estimate the contribution of the secondary star of RW Tri to be 10% in the band. Adopting a spectral type of M0 (Dhillon et al., 2000) and the usual assumptions it is found to be negligible in the band (0.2%), and 1%, 3% and 5% in , and , respectively. These numbers are taken to hold for the average magnitude of 13.23 mag.
UX UMa: Vande Putte et al. (2003) estimate that the secondary star of UX UMa contributes about 20% to the total light in the region of 8000 Å. Similarly, Rutten et al. (1994) estimate a contribution of 6% at 6000 Å; and 15% at 9000%. The exact system magnitude at the respective observing epochs is not known. However, according to the AAVSO long term light curve, in a broad interval around these dates UX UMa remained at a mean magnitude of 12.9 mag. With the spectral type of M4+ (Vande Putte et al., 2003) and the usual assumptions the secondary star contributions are negligible in and amount to 1%, 3% and 6% in the , and bands, respectively.
References
- Anupama & Mikolajewska (1999) Anupama G.C., Mikolajewska J., 1999, A&A, 344, 177
- Bailey (1981) Bailey J., 1981, MNRAS, 197, 31
- Beuermann et al. (1992) Beuermann K., Stasiewski U., Schwope A.D., 1992, A&A, 256, 334
- Bianchini & Sabbadin (1983) Bianchini A., Sabbadin F., 1983, A&A Suppl., 54, 393
- Bitner et al. (2007) Bitner M.A., Robinson E.L., Behr B.B., 2007, ApJ, 662, 564
- Bolick et al. (1987) Bolick K., Beuermann K., Bruch A., Lenzen R., 1987, Ap&SS, 130, 175
- Bruch (1987) Bruch A., 1987, A&A, 172, 187
- Bruch (2003) Bruch A., 2003, A&A, 409, 647
- Bruch (2016) Bruch A., 2016, New Astr., 46, 60
- Bruch & Diaz (2017) Bruch A., Diaz M.P., 2017, New Astr., 50, 109
- Bruch & Engel (1994) Bruch A., Engel A., 1994, A&AS, 104, 79
- Bruch et al. (1997) Bruch A., Vrielmann S., Hessman F.V., Kochsiek A., Schimpke T., 1997, A&A, 237, 1107
- Buckley et al. (1992) Buckley D.A.H., O’Donoghue D., Kilkenny D., Stobie S.R., & Remillard R.A., 1992, MNRAS, 258,285
- Crampton et al. (1986) Crampton D., Cowley A.P., Fisher W.A., 1986, ApJ, 300, 788
- Casares et al. (2009) Casares J., Martínez-Pais I.G., Rodríguez-Gil P., 2009 MNRAS, 399, 1534
- Cowley et al. (1980) Cowley A.P., Crampton D., Hutchings J.B., 1980, ApJ, 241, 269
- Dhillon et al. (2000) Dhillon V.S., Littlefair S.P., Howell S.B. et al., 2000, MNRAS, 314, 826
- Friend et al. (1990) Friend M.T., Martin J.S., Smith R.C., Jones D.H.P., 1990, MNRAS, 246, 654
- Froning et al. (1999) Froning C.S., Robinson E.L., Welsh W.F., Wood J.H., 1999, ApJ, 523, 399
- Gallagher & Oinas (1974) Gallagher J.S., Oinas V., 1974, PASP, 86, 952
- Garlick et al. (1994) Garlick M.A., Mittaz J.P.G., Rosen S.R., Mason K.O., 1994, MNRAS, 269, 517
- Gilliland (1982) Gilliland R.L., 1982, ApJ, 263, 302
- Harrison et al. (2004) Harrison T.E., Osborne H.L, Howell S.B., 2004, AJ, 127, 3493
- Harrison et al. (2000) Harrison T.E., McNamara B.J., Szkokdy P., Gilliland R.L., 2000, AJ, 120, 2649
- Hessman (1988) Hessman F.V., 1988, A&AS, 72, 512
- Horne et al. (1986) Horne K., Wade, R. A., Szkody P., 1986, MNRAS, 219, 791
- Hutchings & Thomas (1982) Hutchings J.B., Thomas B., 1982, PASP, 94, 102
- Kelly et al. (2014) Kelly P.L., Fox O.D., Filippenko A.V. et al., 2014, ApJ, 790, 3
- Knigge (2006) Knigge C., 2006, MNRAS, 373, 484
- Kraft (1964) Kraft R.P., 1964, ApJ 139, 457
- Littlefair et al. (2001) Littlefair S.P., Dhillon V.S., Marsh T.R., Harlaftis E.T., 2001, MNRAS, 327, 475
- Lynden-Bell & Pringle (1974) Lynden-Bell D., Pringle J.E., 1974, MNRAS, 168, 603
- Marino & Walker (1984) Marino B.F., Walker W.S.G., 1984, Southern Stars, 30, 389
- Mateo et al. (1991) Mateo M., Szkody P., Garnavich P., 1991, ApJ, 370, 370
- Nauenberg’s (1972) Nauenberg M., 1972, ApJ, 175, 417
- North et al. (2002) North R.C., Marsh T.R., Kolb U., Dhillon V.S., Moran C.K.K., 2002, MNRAS, 337, 1215
- North et al. (2000) North R.D., Marsh T.R., Moran C.K.J et al., 2000, MNRAS, 313, 383
- Patterson et al. (1992) Patterson J., Schwartz D.A., Pye J.P. et al., 1992, ApJ, 393, 233
- Pickles (1998) Pickles A.J., 1998, PASP, 110, 863
- Poole et al. (2003) Poole T., Mason K.O., Ramsay G., Drew J.H. Smith R.C., 2003, MNRAS, 340, 499
- Reinsch (1994) Reinsch K., 1994, A&A, 281, 108
- Ribeiro et al. (2007) Ribeiro T., Baptista R., Harlaftis E.T., Dhillon V.S, Rutten R.G.M., 2007, A&A, 474, 213
- Rutten et al. (1994) Rutten R.G.M., Dhillon V.S., Horne K., Kuulkers E., 1994, A&A, 283, 441
- Schmidt-Kaler (1982) Schmidt-Kaler Th., 1982, in Schaifers K., Voigt H.H., eds, Landolt Börnstein, Numerical Data and Functional Relationships in Science and Technology, New Series, Group VI, Vol. 2, Subvol. b, Springer Verlag, Heidelberg, p. 1
- Sion et al. (2007) Sion E.M., Godon P., Cheng F. Szkody P., 2007, AJ, 134, 886
- Sion et al. (2001) Sion E.M., Szkody P., Gänsicke B.T. et al., 2001, ApJ, 555, 834
- Smith et al. (1998) Smith D.A., Dhillon V.S., Marsh T.R., 1998, MNRAS, 296, 465
- Stover (1979) Stover R.J., 1979, in van Horn H.M., Weidemann V., eds, Proc. IAU Coll. 53, White Dwarfs and Variable Degenerate Stars, p. 489
- Stover et al. (1980) Stover R.J., Robinson E.L., Nather R.E., Montemayor T.J., 1980, ApJ, 20, 597
- Szkody & Mateo (1986) Szkody P., Mateo M., 1986, AJ, 92, 483
- Thoroughgood et al. (2004) Thoroughgood T.D., Dhillon V.S., Watson C.A. et al., 2004, MNRAS, 253, 1135
- Vande Putte et al. (2003) Vande Putte D., Smith R.D., Hawkings N.A., Martin J.S., 2003, MNRAS, 342, 151
- Vogt & Breysacher (1980) Vogt N., Breysacher J., 1980, ApJ, 235, 945
- Wade (1979) Wade R.A., 1979, AJ, 84, 562
- Zamanov & Bruch (1998) Zamanov R.K., Bruch A., 1998, A&A, 338, 988
- Zhang & Robinson (1987) Zhang E.-H., Robinson E.L., 1987, ApJ 321, 813
- Zorotovic et al. (2011) Zorotovic M., Schreiber M.R., Gänsicke B.T., 2011, A&A, 536, A42
Appendix B System parameters
The search for correlations between the flickering amplitude and other characteristics of the investigated objects makes it necessary to define some important parameters of these systems. This requires often a decision between sometimes contradicting numerical values found in the literature. In many cases there is no objective way to do this, making subjective and even arbitrary choices unavoidable. While this undoubtedly introduces uncertainties into the results, it may be hoped that these will statistically cancel each other to a certain degree. The parameters finally used in this study are summarized in Table B.
Table B1: Object parameters adopted in the flickering analysis
| Star | Type | (Ref) | d | (Ref) | (Ref) | (Ref) | (Ref) | |||||
|---|---|---|---|---|---|---|---|---|---|---|---|---|
| (h) | (pc) | () | (o) | |||||||||
| RX And | DN Z | 5.037 | (81) | 198 2 | 0.00 | (84,92,196, | 1.14 | (133) | 0.42 | (133) | 51 | (133) |
| 197,204) | ||||||||||||
| AR And | DN UG | 3.91248 | (181) | 436 33 | 0.02 | (84,92,175) | ||||||
| DX And | DN UG | 10.57205 | (27) | 589 9 | 0.20 | (44) | 0.66 | (27) | 45 | (44) | ||
| V455 And | DN IP | 1.35142 | (24) | 75.4 0.3 | 0.01 | (145) | 75 | (1) | ||||
| V704 And | NL VY | 3.69898 | (211) | 401 10 | 0.09 | (145) | ||||||
| UU Aqr | NL UX | 3.97930 | (5) | 254 5 | 0.06 | (145) | 0.67 | (5) | 0.30 | (5) | 78 | (5) |
| VY Aqr | DN SU | 1.5142 | (187) | 138 3 | 0.00 | (92) | 0.54 | (109,190) | 0.11 | (109) | 35 | (3) |
| HL Aqr | NL UX | 3.25368 | (138) | 585 17 | 0.00 | (92) | 23 | (138) | ||||
| CZ Aql | DN? | 4.812 | (160) | 612 17 | 0.09 | (145) | ||||||
| DH Aql | DN SU | 1.855 | (54) | 281 16 | 0.15 | (145) | ||||||
| V603 Aql | N | 3.31682 | (127) | 311 7 | 0.07 | (47,52,55,88, | 1.20 | (2) | 0.24 | (2) | 13 | (2) |
| 106,132,151, | ||||||||||||
| 152,189,210) | ||||||||||||
| V725 Aql | DN SU | 2.276 | (189) | 0.27 | (145) | |||||||
| V794 Aql | NL VY | 3.672 | (73) | 641 21 | 0.00 | (92,196) | 0.90 | (59) | 60 | (59) | ||
| V1315 Aql | NL UX | 3.35256 | (124) | 443 7 | 0.73 | (40) | 0.41 | (40) | 82 | (40) | ||
| AT Ara | DN UG | 8.9976 | (19) | 958 49 | 0.13 | (145) | 0.53 | (19) | 0.79 | (19) | 38 | (19) |
| TT Ari | NL VY | 3.30121 | (218) | 256 5 | 0.04 | (88,89,92,197 | 1.24 | (218) | 0.19 | (218) | 29 | (218) |
| 203,205) | ||||||||||||
| T Aur | N | 4.90508 | (35) | 711 26 | 0.39 | (106,151,152, | 0.68 | (13) | 0.93 | (13) | 57 | (13) |
| 204,210) | ||||||||||||
| KR Aur | NL VY | 3.9058 | (79) | 451 93 | 0.05 | (92,196) | 0.70 | (154) | 0.66 | (154) | ||
| V363 Aur | NL UX | 7.70980 | (182) | 858 23 | 0.30 | (176,204) | 0.90 | (182) | 1.17 | (182) | 70 | (182) |
| SY Cnc | DN Z | 9.17701 | (29) | 443 9 | 0.00 | (92,196) | 1.18 | (29) | 26 | (153) | ||
| YZ Cnc | DN SU | 2.08618 | (193) | 238 3 | 0.00 | (92,196) | 0.80 | (156) | 0.22 | (86,156) | 41 | (156) |
| AC Cnc | NL | 7.21146 | (182) | 660 17 | 0.00 | (92) | 0.76 | (182) | 1.02 | (182) | 76 | (182) |
| OY Car | DN SU | 1.51490 | (216) | 90.6 0.2 | 0.00 | (92) | 0.88 | (105) | 0.11 | (105) | 83 | (105) |
| QU Car | NL UX | 10.896 | (120) | 580 13 | 0.12 | (144,196,203, | 50 | (97) | ||||
| 204) | ||||||||||||
| HT Cas | DN SU | 1.76753 | (51) | 141 1 | 0.03 | (204) | 0.61 | (97) | 0.15 | (97) | 81 | (75) |
| WX Cen | NL UX | 10.00704 | (128) | 2699 11 | 0.05 | (92) | 0.90 | (119) | ||||
| BV Cen | DN UG | 14.64278 | (58) | 363 5 | 0.15 | (213) | 1.18 | (208) | 0.89 | (208) | 53 | (208) |
| MU Cen | DN UG | 8.20512 | (21) | 513 9 | 0.07 | (145) | 58 | (21) | ||||
| V436 Cen | DN SU | 1.50 | (57) | 157 2 | 0.13 | (203,204) | 0.80 | (115) | 75 | (115) | ||
| V442 Cen | DN UG | 11.0 | (101) | 336 5 | 0.15 | (203) | ||||||
| V504 Cen | NL VY | 4.21360 | (62) | 600 120 | 0.05 | (145) | ||||||
| V834 Cen | AM | 1.69194 | (150) | 112 3 | 0.00 | (92) | 0.66 | (150) | 0.24 | (141) | 44 | (33) |
| V1033 Cen | AM | 3.15643 | (135) | 244 9 | 0.25 | (145) | 70 | (28) | ||||
| WW Cet | DN Z | 4.21941 | (180) | 217 2 | 0.04 | (85,92,196, | 1.05 | (180) | 0.37 | (180) | 48 | (180) |
| 203,204) | ||||||||||||
| WX Cet | DN SU | 1.39824 | (172) | 262 11 | 0.00 | (43) | 0.55 | (139) | 0.09 | (139) | 40 | (139) |
| BO Cet | NL UX | 3.3343 | (138) | 513 10 | 0.03 | (145) | ||||||
| Z Cha | DN SU | 1.78793 | (37) | 115 2 | 0.00 | (65,92,204) | 0.80 | (105) | 0.19 | (105) | 80 | (105) |
| ST Cha | DN Z | 5.496 | (25) | 701 12 | 0.21 | (145) | ||||||
| TV Col | NL IP | 5.48641 | (68) | 505 5 | 0.02 | (92,104,113,196) | 70 | (69) | ||||
| T CrB | NR | 5464 | (95) | 806 32 | 0.15 | (30,210) | 1.37 | (171) | 0.82 | (171) | 67 | (171) |
| SS Cyg | DN UG | 6.03114 | (71) | 114 1 | 0.03 | (92,196,203) | 0.94 | (72) | 0.63 | (72) | 45 | (72) |
| EM Cyg | DN Z | 6.98182 | (36) | 564 113 | 0.04 | (92,174,196) | 1.00 | (212) | 0.77 | (212) | 67 | (116) |
| V751 Cyg | NL VY | 3.46992 | (48) | 758 13 | 0.25 | (61) | 30 | (61) | ||||
| HR Del | N | 5.13996 | (90) | 932 31 | 0.17 | (47,132,151,152, | 0.75 | (90) | 0.77 | (90) | 41 | (17) |
| 196,204,210) | ||||||||||||
| DO Dra | DN IP | 3.96898 | (67) | 197 1 | 0.02 | (145) | 0.83 | (67) | 0.45 | (67) | 45 | (67) |
| AQ Eri | DN SU | 1.4626 | (185) | 373 17 | 0.03 | (145) | ||||||
| KT Eri | N | 4.685 | (23) | 3688 476 | 0.04 | (145) | ||||||
| U Gem | DN UG | 4.24575 | (102) | 93.1 0.3 | 0.03 | (92,121,196,204) | 1.12 | (220) | 0.47 | (220) | 70 | (220) |
| DM Gem | N | 3097 903 | 0.11 | (145) | ||||||||
| IR Gem | DN SU | 1.64 | (179) | 264 6 | 0.00 | (92,196,204) | ||||||
| RZ Gru | NL UX | 535 17 | 0.00 | (92) | ||||||||
| AH Her | DN Z | 6.19478 | (74) | 321 3 | 0.03 | (66,92,174,196, | 0.95 | (74) | 0.80 | (74) | 46 | (74) |
| 197,204) | ||||||||||||
Table B1 (continued)
| Star | Type | (Ref) | d | (Ref) | (Ref) | (Ref) | (Ref) | |||||
|---|---|---|---|---|---|---|---|---|---|---|---|---|
| (h) | (pc) | () | (o) | |||||||||
| AM Her | AM | 3.09425 | (38) | 87.5 0.1 | 0.00 | (92) | 0.58 | (39) | 0.50 | (169,207) | 60 | (207) |
| DQ Her | N IP | 4.64690 | (34) | 494 6 | 0.07 | (92,106,132,152, | 0.60 | (76) | 0.66 | (76) | 87 | (76) |
| 196,294,210) | ||||||||||||
| V533 Her | N | 5.328 | (183) | 1165 44 | 0.03 | (110,151,152,196) | 0.95 | (136) | 0.35 | (136) | 62 | (136) |
| V795 Her | NL UX | 2.59830 | (158) | 580 13 | 0.03 | (145) | 0.80 | (111) | 41 | (136) | ||
| EX Hya | DN IP | 1.63761 | (50) | 56.9 0.1 | 0.00 | (92,196,204) | 0.78 | (50) | 0.13 | (50) | 78 | (205) |
| VW Hyi | DN SU | 1.78251 | (83) | 53.9 0.1 | 0.00 | (92,196,204) | 0.71 | (167) | 0.15 | (167) | 60 | (149) |
| WX Hyi | DN SU | 1.79552 | (149) | 232 2 | 0.00 | (92,196) | 0.90 | (149) | 0.18 | (149) | 40 | (149) |
| BL Hyi | AM | 1.89396 | (108) | 130 1 | 0.00 | (92) | 0.60 | (215) | 0.50 | (80) | 40 | (10) |
| DI Lac | N | 13.0505 | (133) | 1570 51 | 0.35 | (45,132,152, | 0.70 | (114) | 18 | (114) | ||
| 152,210) | ||||||||||||
| X Leo | DN UG | 3.9456 | (155) | 393 14 | 0.00 | (66,92,204) | 1.03 | (191) | 41 | (191) | ||
| GW Lib | DN WZ | 1.2768 | (186) | 112 1 | 0.02 | (145) | 0.84 | (194) | 0.06 | (194) | 11 | (194) |
| BR Lup | DN SU | 1.908 | (107) | 627 76 | 0.11 | (145) | 0.98 | (107) | 0.15 | (107) | 48 | (107) |
| AY Lyr | DN SU | 1.769 | (188) | 448 27 | 0.00 | (92,196) | 18 | (200) | ||||
| MV Lyr | NL VY | 3.190 | (164) | 493 12 | 0.00 | (196) | 0.88 | (199) | 0.42 | (148,164) | 12 | (164) |
| AQ Men | 552 8 | 0.08 | (145) | |||||||||
| BT Mon | N | 8.01153 | (166) | 1413 97 | 0.21 | (151,152,204) | 1.04 | (166) | 0.84 | (166) | 82 | (166) |
| KQ Mon | NL | 3.08 | (146) | 618 11 | 0.00 | (92) | 0.60 | (214) | 60 | (214) | ||
| RS Oph | RN | 10886 | (16) | 2137 252 | 0.76 | (31,46,168,173, | 1.35 | (64) | 51 | (16) | ||
| 204,209,210) | ||||||||||||
| V380 Oph | NL VY | 3.69857 | (138) | 667 33 | 0.18 | (145) | ||||||
| V426 Oph | DN Z | 6.84754 | (70) | 191 2 | 0.05 | (92,177,204) | 0.90 | (70) | 0.79 | (70) | 59 | (70) |
| V442 Oph | NL VY | 2.98392 | (41) | 492 7 | 0.01 | (92,178) | ||||||
| V841 Oph | N | 14.43130 | (127) | 805 18 | 0.45 | (45,132,151,152, | 0.90 | (127) | 1.00 | (42) | 30 | (127) |
| 201,204) | ||||||||||||
| V2051 Oph | DN SU | 1.49827 | (8) | 112 1 | 0.00 | (92,196) | 0.78 | (7) | 0.19 | (7) | 83 | (7) |
| CN Ori | DN UG | 3.91656 | (9) | 348 5 | 0.00 | (92,196) | 0.74 | (53) | 0.49 | (53) | 67 | (99) |
| CZ Ori | DN UG | 5.2536 | (170) | 490 27 | 0.00 | (92) | 0.67 | (170) | 0.79 | (170) | 24 | (170) |
| V1193 Ori | NL UX | 3.96002 | (124) | 797 26 | 0.07 | (145) | 79 | (63) | ||||
| GS Pav | NL UX | 3.72648 | (22) | 544 16 | 0.04 | (145) | ||||||
| V345 Pav | NL UX | 4.75431 | (22) | 600 120 | 0.05 | (145) | ||||||
| IP Peg | DN UG | 3.79695 | (32) | 141 1 | 0.00 | (92,204) | 1.16 | (32) | 0.48 | (32) | 84 | (32) |
| LQ Peg | NL VY | 2.99393 | (122) | 1052 60 | 0.05 | (145) | ||||||
| TZ Per | DN Z | 6.30975 | (49) | 472 6 | 0.27 | (66,85,92,93) | ||||||
| GK Per | N IP | 47.923 | (112) | 437 8 | 0.29 | (132,152,204,217) | 0.87 | (201) | 0.55 | (112) | 68 | (201) |
| KT Per | DN UG | 3.90388 | (49) | 241 3 | 0.18 | (66,92) | ||||||
| RR Pic | N | 3.48062 | (198) | 504 8 | 0.01 | (55,151,152, | 1.00 | (130) | 0.10 | (130) | 65 | (130) |
| 196,204) | ||||||||||||
| TY PsA | DN SU | 2.02 | (206) | 183 2 | 0.00 | (175) | 63 | (117) | ||||
| VV Pup | AM VY | 1.67390 | (202) | 137 1 | 0.00 | (92) | 0.73 | (78) | 0.14 | (78) | 73 | (162) |
| CP Pup | N | 1.47034 | (14) | 795 13 | 0.23 | (151,15,204) | ||||||
| V348 Pup | NL UX | 2.44413 | (140) | 790 21 | 0.12 | (145) | 0.75 | (137) | 0.31 | (140) | 81 | (137) |
| T Pyx | RN | 1.82945 | (192) | 2926 364 | 0.32 | (26,60,152) | 1.25 | (143,159) | 0.10 | (87,192) | 15 | (125) |
| WZ Sge | DN WZ | 1.36050 | (126) | 45.1 0.1 | 0.00 | (92,196,209) | 76 | (163) | ||||
| V3885 Sgr | NL UX | 4.97186 | (131) | 132 1 | 0.02 | (92,195,203,204) | 0.70 | (98) | 0.68 | (98) | 65 | (98) |
| V4140 Sgr | DN SU | 1.47431 | (8) | 599 62 | 0.11 | (145) | 0.73 | (15) | 0.13 | (15) | 80 | (15) |
| V893 Sco | DN SU | 1.82398 | (20) | 124 1 | 0.02 | (145) | 0.89 | (103) | 0.20 | (103) | 73 | (103) |
| VY Scl | NL VY | 3.84 | (147) | 630 24 | 0.04 | (92,203,204) | 15 | (147) | ||||
| VZ Scl | NL VY | 3.47 | (91) | 552 18 | 0.00 | (92) | 87 | (118,161) | ||||
| LX Ser | NL VY | 3.80238 | (94) | 486 10 | 0.00 | (92,142) | 0.41 | (100) | 0.50 | (219) | 79 | (100) |
| RW Sex | NL UX | 5.8810 | (12) | 235 5 | 0.00 | (92,196) | 0.74 | (12) | 34 | (12) | ||
| KK Tel | DN SU | 2.02 | (77) | 611 180 | 0.03 | (145) | ||||||
| RW Tri | NL UX | 5.56520 | (134) | 312 5 | 0.10 | (92,142,196) | 0.70 | (142) | 0.86 | (142) | 75 | (142) |
| EF Tuc | DN UG | 1336 41 | 0.02 | (145) | ||||||||
| SU UMa | DN SU | 1.8327 | (184) | 219 1 | 0.00 | (92,174,196,204) | ||||||
| SW UMa | DN SU | 1.3634 | (157) | 162 2 | 0.00 | (92) | ||||||
| UX UMa | NL UX | 4.72011 | (6) | 295 2 | 0.00 | (92,142,196) | 0.78 | (195) | 0.60 | (195) | 73 | (165) |
| IX Vel | NL UX | 4.65420 | (11) | 90.3 0.2 | 0.01 | (56,92,196,204) | 0.80 | (11) | 0.65 | (11) | 57 | (96) |
Table B1 (continued)
| Star | Type | (Ref) | d | (Ref) | (Ref) | (Ref) | (Ref) | |||||
|---|---|---|---|---|---|---|---|---|---|---|---|---|
| (h) | (pc) | () | (o) | |||||||||
| HV Vir | DN WZ | 1.37004 | (82) | 351 57 | 0.02 | (145) | ||||||
| CTCV J2056-3014 | NL IP | 1.75 | (4) | 261 7 | 0.01 | (145) | ||||||
| EC 21178-5417 | NL | 3.70262 | (22) | 529 9 | 0.02 | (145) | 83 | (221) | ||||
| LS IV -08 3 | NL UX | 4.68699 | (25) | 210 3 | 0.30 | (145) | ||||||
References: (1) Araujo-Betancon et al. (2005); (2) Arenas et al. (2000); (3) Augusteijn (1994); (4) Agusteijn et al. (2010); (5) Baptista et al. (1994); (6) Baptista et al. (1995); (7) Baptista et al. (1998); (8) Baptista et al. (2003); (9) Barrera & Vogt (1989b); (10) Beuermann & Schope (1989); (11) Beuermann & Thomas (1990); (12) Beuermann et al. (1992); (13) Bianchini (1980); (14) Bianchini et al. (2012); (15) Borges & Baptista (2005); (16) Brandi et al. (2009); (17) Bruch (1982b); (18) Bruch (2000); (19) Bruch (2003); (20) Bruch (2014); (21) Bruch (2016); (22) Bruch (2017b); (23) Bruch (2018); (24) Bruch (2020); (25) Bruch & Diaz (2017); (26) Bruch et al. (1981); (27) Bruch et al. (1997); (28) Buckley et al. (2000); (29) Casares et al. (2009); (30) Cassatella et al. (1982); (31) Cassatella et al. (1985); (32) Copperwheat et al. (2010); (33) Costa & Rodrigues (2009); (34) Dai & Qian (2009); (35) Dai & Qian (2010a); (36) Dai & Qian (2010b); (37) Dai et al. (2009a); (38) Dai et al. (2013); (39) Davey & Smith (1996); (40) Dhillon et al. (1991); (41) Diaz (2001); (42) Diaz & Ribeiro (2003); (43) Downes (1990); (44) Drew et al. (1993); (45) Duerbeck (1980); (46) Duerbeck (1981); (47) Dulcin-Hacyan et al. (1980); (48) Echevarría et al. (2002); (49) Echevarría et al. (1999); (50) Echevarría et al. (2016); (51) Feline et al. (2005); (52) Ferland et al. (1982); (53) Friend et al. (1990); (54) Gänsicke et al. (2009); (55) Gallagher & Holm (1974); (56) Garrison et al. (1984); (57) Gilliland (1982a); (58) Gilliland (1982b)); (59) Godon et al. (2007); (60) Godon et al. (2014); (61) Greiner et al. (1999); (62) Greiner et al. (2010); (63) Groot et al. (1998); (64) Hachisu & Kato (2018); (65) Harlaftis et al. (1992); (66) Hassall (1985); (67) Haswell et al. (1997); (68) Hellier (1993); (69) Hellier et al. (1991); (70) Hessman (1988); (71) Hessman et al. (1984); (72) Hill et al. (2017); (73) Honeycutt & Robertson (1998); (74) Horne et al. (1986); (75) Horne et al. (1991); (76) Horne et al. (1993); (77) Howell et al. (1991); (78) Howell et al. (2006); (79) Hutchings et al. (1983); (80) Hutchings et al. (1985); (81) Kaitchuck (1989); (82) Kato et al. (2001); (83) Kato et al. (2014); (84) Klare et al. (1982); (85) Klare et al. (1982); (86) Knigge (2006); (87) Knigge et al. (2000); (88) Krautter et al. (1981a); (89) Krautter et al. (1981b); (90) Kürster & Barwig (1988); (91) Krzeminski (1966); (92) la Dous (1991); (93) la Dous et al. (1985); (94) Li et al. (2017); (95) Lines et al. (1987); (96) Linnell et al. (2007); (97) Linnell et al. (2008b); (98) Linnell et al. (2009); (99) Mantel et al. (1987); (100) Marin et al. (2007); (101) Marino & Walker (1984); (102) Marsh et al. (1990); (103) Mason et al. (2001); (104) Mateo et al. (1985); (105) McAllister et al. (2019); (106) McLaughlin (1960); (107) Mennickent & Sterken (1998); (108) Mennickent et al. (1999); (109) Mennickent et al. (2006); (110) Miroshnichenko (1988); (111) Mizusawa e al. (2010); (112) Moreales-Rueda et al. (2002); (113) Mouchet et al. (1981); (114) Moyer et al. (2003); (115) Nadalin & Sion (2001); (116) North et al. (2000); (117) O’Donoghue & Soltynski (1992); (118) O’Donoghue et al. (1987); (119) Oliveira & Steiner (2004); (120) Oliveira et al. (2014); (121) Panek & Holm (1984); (122) Papadaki et al. (2006); (123) Papadaki et al. (2006); (124) Papadaki et al. (2009); (125) Patterson et al. (1998); (126) Patterson et al. (2018); (127) Peters & Thorstensen (2006); (128) Qian et al. (2013); (129) Rayne & Whelan (1981); (130) Ribeiro & Diaz (2006); (131) Ribeiro & Diaz (2007); (132) Ringwald et al. (1996); (133) Ritter & Kolb (2003); (134) Robinson et al. (1991); (135) Rodrigues et al. (1998); (136) (2002); (137) Rodríguez-Gil et al. (2001); (138) Rodríguez-Gil et al. (2007); (139) Rogoziecki & Schwarzenberg-Czerny (2001); (140) Rolfe et al. (2000); (141) Rosen et al. (1987); (142) Rutten et al. (1992); (143) Schaefer et al. (2010); (144) Schild (1969); (145) Capitano et al. (2017); (146) Schmidtobreick et al. (2005); (147) Schmidtobreick et al. (2018); (148) Schneider et al. (1981); (149) Schoembs & Vogt (1981); (150) Schwope et al. (1993); (151) Selvelli (2004); (152) Selvelli & Gilmozzi (2013); (153) Shafter (1983a); (154) Shafter (1983b); (155) Shafter & Harkness (1986); (156) Shafter & Hessman ; (157) Shafter et al. (1986); (158) Shafter et al. (1990); (159) Shara et al. (2018); (160) Sheets et al. (2007); (161) Sherrington et al. (1984); (162) Sirk & Howell (1998); (163) Skidmore et al (2002); (164) Skillman et al. (1995); (165) Smak (1994); (166) Smith et al. (1998); (167) Smith et al. (2006); (168) Snijders (1987); (169) Southwell et al. (1995); (170) Spogli & Claudi (1994); (171) Stanishev et al. (2004); (172) Sterken et al. (2007); (173) Svolopoulos (1966); (174) Szkody (1981); (175) Szkody (1985); (176) Szkody Crosa (1981); (177) Szkody & Mateo (1988); (178) Szkody & Shafter (1983); (179) Szkody et al. (1984); (180) Tappert et al. (1997); (181) Taylor & Thorstensen (1996); (182) Thoroughgood et al. (2004); (183) Thorstensen & Taylor (2000); (184) Thorstensen et al. (1986); (185) Thorstensen et al. (1996); (186) Thorstensen et al. (2002); (187) Thorstensen & Taylor (1997); (188) Udalksi & Szymanski (1988); (189) Uemura et al. (2001); (190) Urban & Sion (2006); (191) Urban & Sion (2006); (192) Uthas et al. (2010); (193) van Paradijs et al. (1994); (194) van Spaandonk et al. (2010); (195) Vande Putte et al. (2003); (196) Verbunt (1987); (197) Verbunt et al. (1984); (198) Vogt et al. (2017); (199) Voikhanskaya (1988); (200) Voikhanskaya (1996); (201) Wada et al. (2018); (202) Walker (1965); (203) Warner (1976a); (204) Warner (1987); (205) Warner (1995); (206) Warner et al. (1989); (207) Watson et al. (2003); (208) Watson et al. (2007); (209) Webbink (1978); (210) Weight et al. (1994); (211) Weil et al. (2018); (212) Welsh et al. (2007); (213) Williger et al. (1988); (214) Wolfe et al. (2013); (215) Wolff et al. (1999); (216) Wood et al. (1989); (217) Wu et al. (1989); (218) Wu et al. (2002); (219) Young et al. (1981); (220) Zhang & Robinson (1987); (221) Khangale et al. (2020).
The classification of a CV into types and subtypes is sometimes ambiguous. Here I restrict myself to assign a principal type and at most one subtype to each object, using the usual nomenclature: N = nova, NR = recurrent nova, NL = novalike variable (subtypes: UX = UX UMa star, VY = VY Scl star), DN = dwarf nova (subtypes: UG = U Gem star, Z = Z Cam star, SU = SU UMa star, WZ = WZ Sge star) and the magnetic types AM = AM Her star (or polar) and IP = intermediate polar.
The orbital period is often known to a high accuracy. Here, I restrict myself to a maximum of five decimals. More accurate values can be found in the quoted references. But there are still systems for which this most fundamental of all binary parameters is only known with a much lower precision or not at all. In two cases (V725 Aql and AY Lyr) the period given here is implied from the measured superhump period, using the Schoembs-Stolz relation (Schoembs & Stolz, 1981) as updated by Gänsicke et al. (2009), noting that for the purpose of the present study the period needs not be known with a high accuracy.
One of the greatest problems when it comes to system parameters, namely the distance of the objects which is essential to calculate properties such as absolute magnitudes and luminosities, is largely resolved since the 2nd Gaia data release became available. The distances quoted in Table B are in most cases taken from Bailer-Jones et al. (2018), based on the Gaia parallaxes. Three objects have no Gaia parallax: V725 Aql, V504 Cen and V345 Pav. For V725 Aql no independent distance estimate is available. Greiner et al. (2010) quote a distance of 600 pc for V504 Cen. The same distance is estimated for V345 Pav by Buckley et al. (1992). A Gaia parallax is available for T Aur, but this star is not in the list of Bailer-Jones et al. (2018). For simplicity, the inverse of the parallax is adopted here for its distance. As pointed out by Schaefer (2018) the Gaia parallaxes of recurrent novae with a giant companion are unreliable because the wobble induced by the motion of the stellar components around their centre of mass cannot correctly be accounted for in Gaia DR2. Here, this effects T CrB and RS Oph. Even so, the Gaia distances are quoted in Table B, noting that these values are not used in the analysis of flickering in these systems.
The interstellar extinction, parameterized by the reddening parameter has been determined by various authors for many of the systems investigated here. The adopted values are listed in Table B1 were taken from the references quoted in parenthesis. If more than one extinction determination is available the average is taken666Note that the values used to calculate the average may not always constitute independent measurements., rejecting, however, strongly deviating values (and thus possibly introducing a personal bias). For a considerable number of objects no specific extinction measurements could be found. In those cases it was estimated using the three-dimensional extinction maps of Capitano et al. (2017), adopting the distances as derived from the Gaia parallaxes.
Mass estimates for CVs are difficult, and frequently contradicting values are published in the literature. The same is true for the orbital inclination. This makes a choice among the quoted values often ambiguous and subjective. The primary star mass , the mass ratio and the inclination listed in the table are therefore not free from a certain personal bias of the present author. Moreover, they are sometimes not taken directly form the mentioned references but inferred from other information taken from these.
Only for the distance errors are given in the table, defined here as the average of the differences between the nominal distance value and the upper and lower limits of the confidence intervals quoted by Bailer-Jones et al. (2018). For the orbital period the errors are in most cases much too small to be of any consequence in the context of this study (and often smaller than the limited accuracy of the table entries). The errors of the dynamical and geometrical system parameters are probably only to a small degree random, but are dominated by systematic effects caused by the multiple assumption normally involved in their derivation. Therefore, quoting formal errors may be misleading. The reader should exercise the necessary caution when using the table values.
Subsequently, a brief description of each of the stars is given, focussing on the observational history in the optical and providing references in particular on basic dynamical and geometrical system parameters (orbital period, component masses and orbital inclination) without trying to discuss in depth conflicting values quoted in the literature. Whenever flickering properties of a particular system have been investigated in the past, these are also mentioned [refraining, however, from mentioning explicitely the work of Fritz & Bruch (1998) on wavelet properties of the flickering in a large ensemble of CVs, most of which are also studied here]. Finally, the observations used in the present study are also briefly summarized for each star.
RX And is a Z Cam type dwarf nova. The orbital period has been measured by Kaitchuck (1989), while Shafter (1983a) derived the inclination. The system is very active, and never remains for a long time in quiescence (Glasby, 1970, see also the AAVSO long term light curve). Consequently, the available light curves cover apart from quiescence a wide range of outburst phases, including maxima, rise and decline phases, and a standstill. They consist of two high time resolution white light curves, one run in (also used in the flickering study of Bruch, 1992a), and a number of lower time resolution light curves found in the AAVSO International Database777https://www.aavso.org. The white light data were already analysed with respect to rapid oscillations by Patterson (1981).
AR And is a little studied dwarf nova with an orbital period measured spectroscopically by Taylor & Thorstensen (1996). That paper, together with the spectroscopic study of Shafter et al. (1995) appears to be the only somewhat detailed optical investigations of this system. Thus, not much is known about AR And. In particular, the component masses and the orbital inclination remain unknown. Since no light curves spanning the entire orbital period are available, it cannot even be said if AR And is eclipsing or not. However, as the AAVSO long term light curve reveals, it is a very active systems with frequent outbursts in fairly regular intervals of approximately 20 days. Not many data are available for the present study. They consist of a single high time resolution unfiltered light curve provided by R.E. Nather, complemented by some band light curves retrieved from the AAVSO International Database.
DX And, discovered by Romano (1958), is another little studied dwarf nova. The long term light curve was investigated by Šimon (2000) who noted a long recurrence time between the outburst. The first optical spectrum was observed by Bruch (1989). The red continuum and traces of absorption lines suggested a strong contribution of the secondary star and a long orbital period. This was confirmed by two more detailed studies of the optical spectrum by Drew et al. (1993) and Bruch et al. (1997). The former authors measured the mass ratio, restricted the range of possible orbital inclinations and found an upper limit for the the secondary star mass. Bruch et al. (1997) derived the orbital period and quantified the significant veiling factor due to the secondary star (see Appendix B). The data of DX And available for the current study are quite scarce. They consist of only three band light curves retrieved from the MEDUZA archive 888http://var2.astro.cz/EN/meduza/index.php.
V455 And was discovered in the context of the Hamburg Quasar Survey (Hagen et al., 1995) as HS2331+3905. It is a DQ Her type intermediate polar with a short orbital period (Araujo-Betancon et al., 2005; Bruch, 2020). It is also a dwarf nova of WZ Sge subtype with only one outburst having been observed so far (Nogami et al., 2009; Matsui et al., 2009). The orbital light curve is double humped, reflecting probably the presence of two accreting magnetic poles on the white dwarf and contains a shallow grazing eclipse. Moreover, V455 And exhibits a permanent negative superhump (Kozhevnikov, 2015; Bruch, 2020). A puzzling feature is a 3.5 h spectroscopic period detected by Araujo-Betancon et al. (2005) which is in no way related to the orbital period. Dynamical and geometrical parameters such as the component masses and the orbital inclinations have not yet been determined. In the high frequency regime several periods were first observed by Araujo-Betancon et al. (2005) and later studied in more detail by other authors. Signals on time scales of 5 – 6 min which change slightly from night to night are interpreted as non-radial pulsations of the white dwarf. A coherent 1.12 min signal is thought to be the rotation period of the primary star. A precise spin period has been measured by Mukadam et al. (2016). Closely related is another, slightly shorter and drifting period, first mentioned by Gänsicke (2007) who interpreted it as being due to the illumination by the rotating white dwarf of a warped inner accretion disk which precesses retrogradely. The observational data used for this study were all retrieved from the MEDUZA archive and the AAVSO International Database.
V704 And (= LD 317) was discovered as a blue variable star by Dahlmark (1999). It appears in the Downes et al. (2001) catalogue as a possible CV. The first more detailed observations were published by Papadaki et al. (2006) who, based on different brightness levels seen in different epochs, classified the star as a novalike variable of the VY Scl type. This was confirmed by Weil et al. (2018) spectroscopically and through an analysis of the long term light curve. Weil et al. (2018) also measured the orbital period. For this study I used the (unfiltered) light curves of Papadaki et al. (2006). There are complemented by many band light curves retrieve from the AAVSO International Database. All these data refer to the high state or at most slightly below.
UU Aqr is an eclipsing novalike variable. Although known as a variable star for a long time (Beljawsky, 1926) it was identified as a CV only in 1986 by Volkov et al. (1986). The most accurate values for the orbital period was measured by Baptista et al. (1994). Using measurements of the eclipse contact phases these authors also derived geometrical and dynamical system parameters. Alternative values, based on spectroscopy, were derived by Diaz & Steiner (1991a). Other detailed spectroscopic studies include Kaitchuck et al. (1998) [who found a significantly different mass ratio compared to that of Baptista et al. (1994); a discrepancy explained by Baptista & Bortoletto (2008)], Hoard et al. (1998) and Baptista et al. (2000). The photometric variability of UU Aqr is not restricted to eclipses. On the time scale of years variations of some tenths of a magnitudes are observed (Baptista et al., 1994), interpreted as being caused by variations of the mass transfer rate from the secondary. Short outbursts with an amplitude of 1 mag (“stunted” dwarf nova outbursts) occur on time scales of days (Honeycutt et al., 1998). Superhumps were observed by Patterson et al. (2005) but were absent in extensive photometry of Bruch (2019a). Flickering is quite strong in UU Aqr and has been the subject of dedicated studies. Dobrotka et al. (2012) performed a comparison of the observed power spectrum with the predictions of a statistical model simulating flickering caused by turbulent angular momentum transport in the accretion disk (Dobrotka et al., 2010). While the flickering observed in KR Aur is consistent with this model this is not so for UU Aqr. The authors speculate that spiral waves in the accretion disk (Baptista & Bortoletto, 2008) are the culprit. The present study is based on light curves retrieved from the OPD data bank999https://lnapadrao.lna.br/OPD/databank/databank and the AAVSO International Database, complemented by the white light light curves already used by Bruch (2019a) in a different context.
VY Aqr is a dwarf nova of SU UMa type and has thus a short orbital period, measured spectroscopically by Thorstensen & Taylor (1997). It may have evolved beyond the orbital period limit (“period bouncer”, Mennickent & Diaz, 2002). The early history of the system is summarized by Patterson et al. (1993). The system parameters are quite uncertain. The values listed in Table C1 were taken from Augusteijn (1994), Mennickent et al. (2006) and Urban & Sion (2006). Properties of the secondary star are discussed by Mennickent & Diaz (2002), Harrison et al. (2009) and Littlefair et al. (2000). The amount of data available for the present study is quite limited and not of high quality. They were all retrieved from the OPD data bank, the AAVSO International Database and the MEDUZA archive.
HL Aqr (= PHL 227) was identified as a novalike variable by Hunger et al. (1985). Despite its high apparent magnitude of 13.5 mag it remained comparatively little studied. The orbital period, measured spectroscopically and originally determined by Haefner & Schoembs (1987) was later refined by Rodríguez-Gil et al. (2007). It lies in the range of the SW Sex stars and HL Aqr is indeed identified as such. The system is seen almost face-on. Rodríguez-Gil et al. (2007) determined an orbital inclination in the range . Component masses are not known. The observational data available for this study consist of 5 Walraven light curves obtained by Hollander et al. (1993).
CZ Aql was discovered as a variable star by Reinmuth (1925) who did not provide a classification. Based on spectroscopic evidence Cieslinski et al. (1998) considered the star to be a dwarf nova. Sheets et al. (2007) measured a spectroscopic orbital period of 4.812 h but cannot exclude the true period to be an alias of this value. They also speculate about a magnetic nature of the system. Bruch (2017a) discusses photometry of CZ Aql and found in the power spectra of his light curves indications of a photometric period 8% longer than the orbital period. This might be due to a superhump in the system. Indeed, choosing a close-by alias (nearly as strong in the power spectrum), the Schoembs-Stolz relation between orbital and superhump periods as revised by Gänsicke et al. (2009) is obeyed to within . No information about geometrical and dynamical system parameters exists. The data available for the present study consist of the unfiltered high time resolution light curves taken from Bruch (2017a) and several more data sets with lower time resolution retrieved from the OPD data bank.
DH Aql was identified as a dwarf nova by Tsessevich (1969) and found to be of SU UMa subtype by Nogami & Kato (1995). Its nature was confirmed spectoscopically by Mason & Howell (2003). Apart from long-term monitoring by Bateson (1982a, 1982b, 1984) it remains little studied. The orbital period used here is deduced from the superhump period (Kato et al., 2009, 2014) together with the revised Schoembs-Stolz relation of Gänsicke et al. (2009). System masses are unknown, as is the orbital inclination. The absence of eclipses in the light curve excludes a high inclination. All data used in the present study were taken during the July-August 2002 superoutburst of DH Aql and were retrieve from the AAVSO International Database.
V603 Aql: Among all known classical novae V603 Aql has the highest apparent magnitude in quiescence. As such, it is very well studied and the amount of literature on the object is vast. V603 Aql erupted in 1918 and reached quiescence in 1937 (Strope et al., 2010). From then on it exhibited a slight secular fading to a mean quiescent magnitude of 11.8 mag in recent years (Johnson et al., 2014). The orbital period was first determined spectroscopically by Kraft (1964a) and later verified by other authors. Peters & Thorstensen (2006) were able to combine their own radial velocity measurements with results from previous studies to derive long term ephemeries. Arenas et al. (2000) measured the component masses and the orbital inclination. V603 Aql exhibits a puzzling multitude of photometric periods none of which is identical to the orbital period (Haefner & Metz, 1985; Drechsel et al., 1983; Udalski & Schwarzenberg-Czerny, 1989; Schwarzenberg-Czerny et al., 1992; Bruch, 1991a). The only consistent modulation present in the light curve has a slightly variable period close to 3.5 h, about 6% longer than the orbital period. It has first been detected by Haefner (1981) and then be confirmed by many authors (see Bruch & Cook, 2018). Additionally, Patterson et al. (1998) observed a modulation with a period being about 3% less than the orbital period. Today, the longer of these variations is interpreted as a permanent superhump in V603 Aql, while the shorter one is considered to be an occasionally visible negative superhump. An analysis of the flickering in a very limited sample of light curves of V603 Aql has been performed by Bruch (1992). His data are part of the vastly larger sample data investigated here which, apart from many light curves retrieved from the AAVSO International Database include multicolour light curves obtained by the author and his collaborators, Walraven light curves observed by Hollander et al. (1993), and extremely high time resolution UBVR* light curves provided by E. Robinson. The latter were used by Bruch (2015) in a study of time lags of the flickering as a function of wavelength. Flickering flares in V603 Aql clearly occur slightly earlier at shorter optical wavelength compared to longer wavelength. This time lag amounts to sec/Å.
V725 Aql: After some confusion about the identity of V725 Aql, Nogami et al. (1995) identified the system unambiguously and classified it as a dwarf nova. Based on superoutburst observations, Uemura et al. (2001) revealed its nature as a SU UMa star. The superhump period suggests it to be located within the 2 – 3 h period gap of CVs. In fact, the superhump period implies an orbital period of 2.2757 h, applying the Schoembs-Stolz relation revised by Gänsicke et al. (2009). Nothing is known about the component masses and the orbital inclination. The absence of eclipses in the light curve indicates that the latter is not high. The distance of V725 Aql is also unknown. The system has no parallax measured by Gaia DR2. The data used in the present study were retrieved from the AAVSO International Database.
V794 Aql is a novalike variable of the VY Scl subtype. The long term light curve has been monitored for many years (Honeycutt & Schlegel, 1985; Honeycutt et al., 1994, 2014; Honeycutt & Robertson, 1998; Honeycutt & Kafka, 2004). The orbital period was determined spectroscopically by Honeycutt & Robertson (1998). Dynamical and geometrical system parameters are only known from modelling of the far UV spectrum by Godon et al. (2007). The system was included in a specific study of the flickering in some accreting white dwarf systems by Zamanov et al. (2016). They found that the amplitude (measured as the flux difference between the maximum and the minimum in a light curve) as well as the rms of all investigated systems follows a common linear relationship with the average system brightness, when plotted on a logarithmic scale. The present study includes only one unfiltered light curve, observed with high time resolution by the author, plus two light curves retrieved from the AAVSO International Database.
V1315 Aql was first detected as a suspected variable star by Metik (1981) and classified as an eclipsing CV by Downes et al. (1986). It is now considered to be a novalike variable of the SW Sex subtype (Szkody & Piché, 1990). Detailed studies have also been performed by Smith et al. (1993), Dhillon et al. (1991) and Hellier (1996). Recently, Sahman et al. (2018) discovered a shell around the system, pointing at a nova outburst roughly 1000 years ago. The orbital period has last been updated by Papadaki et al. (2009). The few data available for the present study were retrieve from the OPD data bank.
AT Ara: This dwarf nova was originally suspected to be a SU UMa star (Warner, 1976b) and as such would have a short orbital period. However, the long-term photometric behaviour studied by Bateson (1978) does not support this hypothesis since the system does not show the typical dichotomy of normal and superoutburst which characterize the SU UMa stars. Moreover, the meager spectroscopic information available about AT Ara points at a long orbital period: Vogt (1976) mentions possible G-band absorption, and a low resolution spectrum of Bruch (1982a) clearly shows the Mg I 5167–5184 Å triplet and Ca I 5262–5270 Å in absorption, indicating a considerable contribution of the secondary star to the optical light which is further detailed in Appendix B. This is confirmed by the so far only detailed study of AT Ara, presented by Bruch (2003). It clearly shows the system to be a double lined spectroscopic binary. It has a long orbital period of 8.9976 h. Bruch (2003) also determined dynamcial and geometrical system parameters. The data available for this study consist of the light curves taken by Bruch (2003), complemented by unpublished data.
TT Ari is a well known VY Scl-type novalike variable and one of the brightest CVs in the sky. As such, it has been extensively studied spectroscopically and photometrically from infra-red to X-ray wavelengths. The orbital period was originally measured by Cowley et al. (1975) and later refined, last by Wu et al. (2002), who also determined the dynamical and geometrical properties used here. Many photometric investigations have been published about TT Ari. The light curve shows modulations which, however, are notoriously unstable. They may be somewhat longer or shorter than the orbital period and can be interpreted as positive an negative superhumps. Additionally, numerous authors report variations on the time scales of some tens of minutes (see Bruch, 2019b, for a thorough discussion and further references). Some papers dealing with flickering properties of TT Ari are relevant in the present context. Kraicheva et al. (1999b) observed variations in the flickering activity on the time scale of a year. They also relate the 20 min variations consistently present in the light curves to flickering and perform an investigation of the flickering power spectrum. This was also done by Belova et al. (2013). Just as V603 Aql, TT Ari exhibits a clear time lag of the flickering activity as a function of wavelength, albeit at a smaller level of sec/Å (Bruch, 2015). For the current study I use a vast number of light curves from many different sources. They were already investigated in another context by Bruch (2019b). I restrict myself to observations performed during the high state of TT Ari.
T Aur is a classical nova the outburst of which ocurred in 1891. Walker (1963) detected shallow partial eclipses in its light curve and first measured the orbital period, which was last refined by Dai & Qian (2010a). Surprisingly little work has been published on the detailed optical characteristics of the central binary star in the system. The only attempt to determine masses and the orbital inclination was performed by Bianchini (1980). The presently available data consist of some high time resolution light curves provided by R.E. Nather, supplemented by several light curves retrieved from the AAVSO International Database.
KR Aur is a well known novalike variable of the VY Scl subtype. The long term behaviour has been extensively monitored in the literature (see, e.g., Honeycutt & Kafka, 2004). The early history of the system was summarized by Kato et al. (2002). The orbital period has been measured spectroscopically by Hutchings et al. (1983) and Shafter (1983b) and photometrically by Rodríguez-Gil et al. (2020). The latter authors also provide a geometrical and dynamical model of the system, quantifying respective parameters. Apart from the frequent low states which characterize KR Aur as a VY Scl star, the system exhibits strong variability also on short time scales. While no variability on the orbital period has been reported, Kozhevnikov (2007) claims the presence of negative superhumps which, however, were not detected by Kato et al. (2002). Significant signals with unstable periods on the time scale of several hundred seconds have been seen by Singh et al. (1993) et al. (1993) and Kato et al. (2002). Biryukov & Borisov (1990) claim the presence of 25 min variations, but these are quite unstable and can at most be classified as QPOs (Quasi Periodic Oscillations). Flickering is strong in KR Aur and has been subject of several studies. Kato et al. (2002) investigate the power spectrum of their light curves. A more detailed study has been performed by Zamanov et al. (2016) who included KR Aur in their study of the amplitude-flux relation (see V794 Aql). Dobrotka et al. (2012), performed a comparison of the observed power spectrum with the predictions of a statistical model simulating flickering caused by turbulent angular momentum transport in the accretion disk (Dobrotka et al., 2010) and found agreement. They concluded that flickering is concentrated in the inner disk regions. The present study includes only two unfiltered high state light curves of KR Aur, provided by R.E. Nather, which are, however, of very high quality.
V363 Aur was detected as Lanning 10 in a survey of UV bright objects (Lanning, 1973). It was suggested to be a CV by Margon & Downes (1981), and eclipses were detected by Lanning et al. (1981). Today, it is classified as a novalike variable of the SW Sex subclass. The orbital period, last updated by Thoroughgood et al. (2004), is comparatively long for a CV. It is therefore not surprising that the spectral features of the secondary star are readily visible in the optical spectrum and V363 Aur thus constitutes one of the few eclipsing double-lined variables among CVs. This enable to derive masses with a minimum of assumptions. These, and the orbital inclination were measured by Schlegel et al. (1986) and Thoroughgood et al. (2004). Flickering in V363 Aur has been commented on by Horne et al. (1982). The present study draws on light curves provided by R.E. Nather.
SY Cnc is a very active dwarf nova which hardly remains in quiescence for more than a handful of days. It is also classified by Simonsen et al. (2014b) as a bona-fide Z Cam star. Its orbital period, based on spectroscopic observations taken over several years (Casares et al., 2009), is quite long compared to most CVs. Dynamical and geometric system parameters are discussed by Vande Putte et al. (2003), Smith et al. (2005) and Shafter (1983a). At the long orbital period the secondary star leaves considerable traces in the optical spectrum (for more details, see Appendix B). Flickering in SY Cnc was studied by Middleditch & Córdova (1982) during outburst in three photometric bands between the UV and the red spectral range. They find that the spectrum of the flickering rises too rapidly towards shorter wavelength to be consistent with any simple thermal model. Moreover, they did not find a time lag larger than a fraction of a second between flickering in different passbands. The data used for the present study consist of 14 unfiltered high time resolution light curves provided by R.E. Nather, encompassing all outburst stages. They were already analysed in a different context by Patterson (1981). These data are complemented by further light curves retrieved from the AAVSO International Database.
YZ Cnc is a SU UMa type dwarf nova with an orbital period of just over 2 h, first measured by Shafter & Hessman and later refined by van Paradijs et al. (1994). Component masses were discussed by Shafter & Hessman and Knigge (2006). Early on it was perceived that YZ Cnc exhibits very strong flickering during quiescence. Moffett & Barnes (1974) observed a typical peak-to-peak amplitude of 0.75 mag, sometimes even reaching 1.1 mag. However, this is not borne out by the presently studied data, where the peak-to-peak amplitude is more of the order of 0.5 mag. The system was one of the first CVs to be subjected to a dedicated study of its flickering activity. Elsworth & James (1986) observed the star with subsecond time resolution and calculated power spectra of the light curves. Some of these exhibit the typical behaviour of red noise, where is the power, the frequency and a parameter which describes the power distribution between high and low frequencies. The majority, however, has a shape which Elsworth & James (1986) interpret as being due to diffusion in a scattering cloud of an immersed flickering light source. For the present study I used a dozen high time resolution light curves provided by R.E. Nather, observed in various outburst and superoutburst stages, and many more light curves retrieved from the AAVSO data base covering all phases of the outburst cycle.
AC Cnc: This novalike variable was detected as a variable star by Kurochkin (1960). Kurochkin & Shugarov (1980) first saw eclipses in the system and determined the orbital period, which was last refined by Thoroughgood et al. (2004). The system belongs to the long period CVs. Slight period changes have been analysed by Qian et al. (2007). Soon after the detection of eclipses the nature of AC Cnc as a CV was discovered in spectroscopic observations by Okazaki et al. (1982), and in the same year Downes (1982) detected the secondary star in the spectrum, making AC Cnc one of the few eclipsing double-lined variable among CVs and thus enabling to measure the masses with a minimum of assumptions (see Schlegel et al., 1986; Thoroughgood et al., 2004). The present study draws on light curves of AC Cnc retrieved from the AAVSO International Database.
OY Car: This eclipsing system is one of the best studied SU UMa type dwarf novae. Discovered by Hoffmeister (1963), it has been the object of intensived photometric and spectroscopic studies from the infrared to X-rays in particular in the last two decades of the 20th century. Its orbital period was measured by Cook (1985), Schoembs et al. (1987) and Wood et al. (1989). Greenhill et al. (2006) found slight deviations from purely linear ephemeris due either secular or cyclic period variations. Basic dynamical and geometrical properties were derived on the basis of a detailed analysis of the eclipse properties by Schoembs et al. (1987), Wood et al. (1989) and McAllister et al. (2019). The data analysed in the present study consist of the and white light observations of Bruch et al. (1986), some unpublished light curves (courtesy B. Borges), light curves of Schlindwein (2017) and light curves retrieved from the AAVSO International Database.
QU Car was discovered as an irregular variable by Stephenson et al. (1968) and classified as a cataclysmic variable by Schild (1969). At an average magnitude slightly fainter than 11 mag it is one of the brightest CVs in the sky. Currently considered to be a novalike variable, Kafka et al. (2008) also proposed a classification as V Sge star, i.e., a system with characteristics similar to supersoft X-ray sources (Steiner & Diaz, 1998). The system parameters of QU Car are not well known. The orbital period was first determined spectroscopically by Gilliland & Phillips (1982) as 10.9 h. This period was later confirmed by Oliveira et al. (2014) who also find a photometric modulation with the same period, but only when the flickering activity is reduced and the system hovers at a slightly lower magnitude level than normal. Modelling the ultraviolet spectrum Linnell et al. (2008a) put limits on the mass of the primary star and the orbital inclination. The failure of Gilliland & Phillips (1982) to detect absorption lines of the secondary star (expected at the long orbital period) may be due to the exceptional high luminosity of the system (Drew et al., 2003). The data of QU Car used here consist of light curves taken from Bruch (1991b) and others retrieved from the AAVSO International Database and the OPD data bank.
HT Cas was detected and classified as a dwarf nova by Hoffmeister (1943). The short orbital period, most precisely measured by Feline et al. (2005), places the system below the period gap of cataclysmic variables and thus in the realm of the SU UMa subclass of dwarf novae. HT Cas is an eclipsing system. Basic dynamical parameters have be determined by Horne et al. (1991). In contrast to many other eclipsing dwarf novae HT Cas does not exhibit an orbital hump in its light curve. Thus, the contribution of the hot spot to the total light appears not the be significant and no hot spot flickering is expected. This is confirmed by Bruch (2000) who found that the flickering in HT Cas is restricted to the region on or in the immediate vicinity of the white dwarf. Here, I analyse high time resolution light curves provided by R.E. Nather [some of which have also been investigated by Patterson (1981)] observed during quiescence and superoutburst. These are complemented by numerous light curves observed during all photometric states, retrieved from the AAVSO International Data Base.
WX Cen resembles in many aspects the bright novalike variable QU Car. It was originally detected as a variable star by H. Leavitt (Pickering, 1906) and acquired interest when Eggen et al. (1968) identified it as the optical counterpart of the X-ray source Cen XR-2. Steiner & Diaz (1998) counted WX Cen among their original list of V Sge stars. The orbital period was first determined spectroscopically by Diaz & Steiner (1995) and later confirmed photometrically by Oliveira & Steiner (2004) and Qian et al. (2013). At just over 10 h it is rather long for a CV. Even so, just as QU Car, WX Cen does not exhibit absorption line features in it optical spectrum (Diaz & Steiner, 1995), in agreement with the high luminosity found in V Sge stars. The orbital light curve studied by Oliveira & Steiner (2004) exhibits a well defined orbital modulation which, however, deviates somewhat from a simple sine-wave. Oliveira & Steiner (2004) also determined a tentative primary star mass. No further information about dynamical and geometrical system parameters is available. The present study draws on light curves found in the OPD data bank and others retrieved from the AAVSO International Database.
BV Cen has one of the longest orbital periods of all dwarf novae. First measured by Vogt & Breysacher (1980), it was improved by R.F. Webbink (see note added in proof to Gilliland, 1982b). Dynamical and geometrical system parameters have been determined by Gilliland (1982b), Vogt & Breysacher (1980) and Watson et al. (2007). At the long orbital period the secondary star should be somewhat evolved and contributes a significant fraction to the total optical light of the system (see Appendix B). The data used for the present study consist of some unfiltered light curves provided by B. Warner, complemented by several light curves observed in the Walraven system by Bruch (1992) (used in his original flickering study) and Hollander et al. (1993), and band light curves retrieved from the AAVSO International Database.
MU Cen is a little studied long period dwarf nova. Friend et al. (1990), using radial velocity measurements of absorption features of the secondary star observed in near infrared spectra, first derived an orbital period which is in agreement with the more accurate photometric period measured by Bruch (2016). Both, Friend et al. (1990) and Bruch (2016), discuss component masses. The latter author also delimits the orbital inclination. At the long orbital period the secondary star contributes a substantial fraction of the optical light (see Appendix B for details). The data used in this study are those already analysed by Bruch (2016).
V436 Cen is a SU UMa type dwarf nova and as such has a small orbital period (Gilliland, 1982a). Not much is known about the system parameters. From model fits to the ultraviolet spectrum Nadalin & Sion (2001) estimated the primary star mass and the orbital inclination. The data used in the present study consist of unfiltered light curves provided by B. Warner (see also Warner, 1975b) and of band data taken from Semeniuk (1980).
V442 Cen: Very few details are known about this dwarf nova. Even the orbital period, determined by Marino & Walker (1984) to be 11.0 h has never been confirmed. However, the period must be long, considering the early spectral type of the secondary star, classified by Harrison et al. (2004) as G62, based on infrared spectra (see also Appendix B). Other system parameters have never been measured to any degree of reliability. The data available for this study were all provided by B. Warner.
V504 Cen is classified in the General Catalogue of Variable Stars as a possible R CrB star (Kholopov et al., 1985). However, based on its spectrum Kilkenny & Lloyd Evans (1989) identify it as a cataclysmic variable, and the photometric behaviour made them suspect that V504 Cen belongs to the VZ Scl class. This was confirmed by Kato & Stubbings (2003) and Greiner et al. (2010). The latter authors, observing the star during a low state, also detected photometric variations in optical light, as well as in X-rays, and radial velocity variations which permitted them to determine the orbital period. 12 unpublished light curves observed by the author in unfiltered light are available for the present study.
V834 Cen (= E1405-401) is a well observed polar. It was first discovered as an X-ray source by Jensen et al. (1982). The optical counterpart was identified by Mason et al. (1983) who also suggested the system to be of AM Her type. This is corroborated by its optical polarization first observed by Tapia (1982) and soon thereafter confirmed by Visvanathan & Tuohy (1983) and Bailey et al. (1983). Many detailed photometric, polarimetric and spectroscopic studies followed (e.g. Rosen et al., 1987; Cropper, 1989; Ferrario et al., 1992; Potter et al., 2004). An optical modulation in the light of V834 Cen was already observed by Mason et al. (1983). Interpreting it as the rotation period of the white dwarf, the orbital period should be the same. It was later improved spectroscopically by Schwope et al. (1993). Dynamical and geometrical system parameters are discussed by Tuohy et al. (1985), Cropper et al. (1986), Rosen et al. (1987), Schwope et al. (1993), Ramsay (2000) and Costa & Rodrigues (2009). Oscillations with periods or quasi-periods in the range of a few seconds have repeatedly been observed in the light curve of V834 Cen (Mason et al., 1983; Larsson, 1985, 1992; Middleditch et al., 1991; Imamura et al., 2000; Mouchet et al., 2017). However, their period is so small that even at the high time resolution of the light curves used for the present study they will be smeared out and thus have no bearing on the flickering properties as measured here. The available data consist of unpublished unfiltered light curves observed by the author, complemented by data provided by L. Chiappetti (see also Sambruna et al., 1991)
V1033 Cen (= RX J1141.3-6410) was detected as a ROSAT X-ray source by Motch et al. (1996) and identified in the optical with a 16.6 mag star exhibiting properties of a synchronized magnetic system, i.e., a polar. The observation of polarization by Rodrigues et al. (1998) and Buckley et al. (2000) confirmed this classification. Periodic light variations observed by Cieslinski & Steiner (1997) permitted to determine the orbital period. A refined value was measured by Rodrigues et al. (1998). Component masses of V1033 Cen remain unknown. Buckley et al. (2000) estimated an orbital inclination of 70o. Only three light curves retrieved from the OPD data bank are available for this study. They were already used by Cieslinski & Steiner (1997).
WW Cet is normally classified as a U Gem type dwarf nova. However, a standstill observed by Simonsen & Stubbings (2011) interrupted the 40 year historical record of normal outburst behaviour and suggests that the system may belong to the Z Cam stars. The orbital period was first measured spectroscopically by Thorstensen & Freed (1985) and then refined by Ringwald et al. (1996b) and Tappert et al. (1997). Tappert et al. (1997) also derived dynamical and geometrical system parameters. Several (unpublished) and Walraven (Bruch, 1992) light curves observed by the author were supplemented for this study by Walraven light curves taken from Hollander et al. (1993).
WX Cet is a short period dwarf nova of the SU UMa type, albeit with a long outburst cycle (880 days for superoutbursts and 200 days for short eruptions; Sterken et al., 2007). The orbital period has first been measured spectroscopically by Mennickent (1994) and was then confirmed (modulo a cycle count ambiguity) by Thorstensen et al. (1996). Rogoziecki & Schwarzenberg-Czerny (2001) found the same period photometrically. The most accurate value is provided by Sterken et al. (2007). Rogoziecki & Schwarzenberg-Czerny (2003) are the only authors to derive component masses and the orbital inclination for WX Cet. The data used in the present study consist of light curves provided by B. Warner and were already used by O’Donoghue et al. (1991). They were all observed during the maximum and early decline from the June 1989 superoutburst.
BO Cet is a little studied novalike CVs. While Zwitter & Munari (1995) present a single spectrum, the only time resolved spectroscopy was published by Rodríguez-Gil et al. (2007). They classify the system as being of SW Sex type. Apart from this study and some time resolved photometry of Bruch (2017a) no further detailed optical observations of BO Cet have been obtained. A photometric period reported in an informal communication by J. Patterson101010http://cbastro.org/communications/news/messages/0274.html; or http://cbastro.org/pipermail/cba-public/2002-October/000300.html based on Center for Backyard Astrophysics (CBA) data has been refined by Bruch (2017a) and is compatible with the spectroscopic period measured by Rodríguez-Gil et al. (2007). Dynamical and geometrical system parameters are unknown. The data used in the present study are those already investigated by Bruch (2017a) supplemented by light curves retrieved from the AAVSO International Database.
Z Cha: Like OY Car and HT Cas, Z Cha is another well known deeply eclipsing dwarf nova of SU UMa type. Its orbital period (Dai et al., 2009a) is slightly variable with a period of 32.6 years (Dai et al., 2009a) or 282 years (Baptista et al., 2002). Dynamical parameters were determined by Wood et al. (1986), Wade & Horne (1988) and McAllister et al. (2019). The location of the flickering light source in Z Cha has been investigated by Bruch (1996). He found that in quiescence and normal maximum flickering comes from the immediate vicinity of the white dwarf. However during quiescence a second source, located at the hot spot, also contributes. During superoutburst the situation is more complex. When the superhump light source shines flickering originates in an extended region of the accretion disk. When it is off, the immediate vicinity of the white dwarf as well as an extended range along the disk rim (possibly enhanced at the bright spot location) flickers. Here, I analyse numerous unfiltered high time resolution light curves kindly provided by B. Warner. Some of these have also been used in the studies of Warner (1974), Warner & O’Donoghue (1988) and Wood et al. (1986). They encompass all photometric states. More light curves were retrieved from the OPD data bank and the AAVSO International Database, again encompassing all photometric states.
ST Cha: Very little is know about this star. Originally discovered by Luyten (1934), its classification history was summarized by Simonsen et al. (2014a) who concluded that it belongs to the Z Cam subtype of dwarf novae. The tentative orbital period mentioned by Cieslinski et al. (1998) was recently shown to be erroneous by Bruch & Diaz (2017) who measured a spectroscopic period of 5.50 h during the final rise from a standstill to an outburst. Nothing is known about dynamical and geometrical system parameters. Only one light curve is used for the present study. It was already reproduced by Bruch & Diaz (2017).
TV Col: This intermediate polar was identified as the optical counterpart of the hard X-ray source 2H 0526-328 by Charles et al. (1979). It exhibits complicated photometric variations which, apart from flickering, includes 3 periods observed in optical light, in addition to another period only seen in X-rays. The reader is referred to the introduction of Rana et al. (2004) for references to observations of these periods. A coherent modulation with a period of 32 s in X-rays was first detected by Schrijver et al. (1985) in EXOSAT observations, confirmed by Schrijver et al. (1987) and Rana et al. (2004), and analysed in more detail by Norton & Watson (1989). It is interpreted as the rotation period of the white dwarf in TV Col and is the reason for the classification of the system as an intermediate polar. However, unlike in most other system of this kind the white dwarf rotation does not reveal itself in the optical light (Barrett et al., 1988). Instead, TV Col exhibits a spectroscopic period, a 5% shorter photometric modulation, and longer term variation on their beat period, first mentioned by Hutchings et al. (1981) and later confirmed by many other authors. The spectroscopic period is interpreted to be orbital, while the photometric modulation is thought to be due to the nodal precession of an inclined accretion disk (Barrett et al., 1988; Hellier, 1993), i.e., it is a negative superhump. The most precise value of the orbital period has been measured by Hellier (1993) who observed shallow eclipses, confirming that this period really reflects the binary revolution. The eclipses are only partial, involving a part of the accretion disk but not the primary. They are not very conspicuous in the light curve and where therefore not removed before analysing the flickering in this study. TV Col exhibits sometimes outbursts with amplitudes of the order of 2 mag (Szkody & Mateo, 1984; Hellier & Buckley, 1993; Hudec et al., 2005) which last only some hours and are thus quite different from normal dwarf novae outbursts. Hellier & Buckley (1993) and Hameury & Lasota (2017) interpret them as events of enhanced mass transfer from the secondary star rather than in the framework of the thermal-viscous disk instability model. Most of the observations of TV Col concentrate on the X-ray and optical variability. Almost no detailed optical spectroscopy has been performed. This may be one reason for the absence of mass determinations for the components. The geometrical properties have also not been explored. Only the orbital inclination has been estimated by Hellier et al. (1991), based on their detection of eclipses. The data available for this study consist light curves provided by B. Warner and C. Hellier. They were discussed previously in different contexts by Barrett et al. (1988), Hellier et al. (1991), Hellier (1993) and Hellier & Buckley (1993).
T CrB is a recurrent nova with outbursts observed in 1866 and 1946. Unlike most other cataclysmic variables the secondary star is not close to the main sequence but a giant. Therefore, T CrB is also classified as a symbiotic system and a symbiotic nova. As such, its orbital period is much longer than that of most CVs. It has first been measured spectroscopically by Sanford (1949). The most accurate value of 227.67 d was derived by Lines et al. (1987). Initial determinations of dynamical system parameters (Kraft, 1958; Paczynski, 1965; Kenyon & Garcia, 1986) proved to be incompatible with a CV model. This issue was resolved by Belczynski & Mikolajewska (1998), Hric et al. (1998) and Stanishev et al. (2004). Flickering in T CrB was relatively well studied in the past. Early observations were reported by Walker (1954), Ianna (1964), Lawrence et al. (1967), Walker (1977) (who also noted the much higher amplitude in the band compared to the band), Bianchini & Middleditch (1976) and Oskanian (1983). The latter two authors noted the absence of the flickering at certain epochs. Negative observations are also reported by Dobrzycka et al. (1996) and Mikolajewski et al. (1997). A strong increase of the flickering amplitude with decreasing wavelength has been noted by Raikova & Antov (1986), Bruch (1992) and Hric et al. (1998). More detailed studies of the flickering in T CrB start with Zamanov & Bruch (1998) who investigated band light curves and found that – unlike the behaviour during the outburst cycles of dwarf novae – the ratio of the flux of the flickering light source and the quiet part of the primary remains constant. They conclude that with the exception of the peculiar, not well understood feature that the activity can disappear temporarily, flickering in T CrB is on the whole indistinguishable from that in normal CVs in spite of the vastly larger geometrical dimensions. The constancy of the flux ratio of the flickering light source and average flux of the primary component in the presence of considerable variations of the latter is confirmed by Zamanov et al. (2004). They also find that the slope of the high frequency part of the power spectrum (on the double logarithmic scale) is always the same, independent of the brightness of T CrB in the band, as is the e-folding time of the auto-correlation function. Zamanov et al. (2016) show that the linear amplitude-flux relation in T CrB repeats itself with the same proportionality constant in other symbiotic systems just as in several novalike variables over four orders of magnitude in flux. They conclude that viscosity in the accretion disk is practically the same in all investigated systems. Dobrotka et al. (2010) analysed band flickering in T CrB. They simulated the statistical distribution of flare durations, assuming that the aperiodic variability is produced by turbulent elements in the disk and conclude that the majority of flickering events is concentrated in the inner disk which is weakly truncated. Finally, Ilkiewics et al. (2016) also study flickering in T CrB during active phases, emphasizing flickering in X-rays, and suggest that it originates in the boundary layer between the accretion disk and the white dwarf. Flickering in T CrB being strongest at short wavelength is in the first place due to the diluting effect of the giant secondary star the contribution of which in the visual range is overwhelming. Zamanov & Bruch (1998) estimate that it can be 90% in . However, this number is uncertain. Correcting the amplitude of the flickering in the visual for the contribution of the secondary star can thus lead to huge errors. Therefore, I prefer to use only data obtained in the band for this study. Here, the secondary contributes much less and any results are therefore more reliable (see Appendix B). The data used here consist of suitable light curves of Zamanov & Bruch (1998) supplemented by some unpublished light curves of the author.
SS Cyg: As the prototype dwarf nova and one of the brightest members of its class SS Cyg is arguably the best studied of all cataclysmic variables. The number of publications about the system is legion. It has a comparatively long orbital period. The (still) most accurate value is based on spectroscopic measurements published by Hessman et al. (1984) more than three decades ago. Geometrical and dynamical system parameters have been determined by many groups, e.g., Giovannelli et al. (1983), Bitner et al. (2007), Voloshina & Khruzina (2000), and Hill et al. (2017). Although SS Cyg is not generally recognized as a magnetic system, claims in this sense have been brought forward repeatedly in the past (see Giovannelli & Saubau-Graziati (2012) and references therein). In her epic work on SS Cyg, Zuckemann (1961) included the first ever systematic study on the flickering in any cataclysmic variable, although it did not leave a lasting imprint in the literature. Bruch (1992a) also included SS Cyg in his original flickering study. More recently, Aranzana et al. (2018) investigated simultaneous high time resolution observations in 3 photometric bands. They found a soft lag of the flickering events with an amplitude of about 5 s at a time scale of 250 s. To my knowledge no other paper dealing specifically with flickering in this system has be published. The contribution of the secondary star to the total system light is discussed in Appendix B. The available data for this study comprise some high time resolution light curves provided by R.E. Nather, several more light curves observed by the author and his collaborators, and many data sets retrieved from the AAVSO International Database.
EM Cyg is an eclipsing Z Cam type dwarf nova. At the comparatively long orbital period of almost 7 h, originally measured by Mumford & Krzeminski (1969) and last refined by Dai & Qian (2010b), the absorption spectrum of the secondary star is visible together with the accretion disk emission lines (Kraft, 1964b), making the system one of the few eclipsing double lined spectroscopic binaries among CVs. However, any determination of dynamical system parameters is complicated by the pollution of the light of EM Cyg by an unrelated K2-5 V star along the line of sight, discovered by North et al. (2000). Component masses were derived by various authors but due to the contaminating light of the unrelated K-star (not noted by most of them) the results are not reliable. It appears that the best values were derived by Welsh et al. (2007). The orbital inclination was determined by North et al. (2000) to be which means that during eclipses the secondary star only covers a part of the accretion disk but not the white dwarf. This is also immediately suggested by the shallow profile of the eclipses (e.g., Mumford & Krzeminski, 1969). The contribution of the secondary star (and the unrelated star in the line of sight) is discussed in Appendix B. The data used here consist of some high time resolution unfiltered light curves provided by R.E. Nather (see also Patterson, 1981), supplemented by light curves retrieved from the AAVSO International Database.
V751 Cyg is a novalike variable, probably of the VY Scl subtype. The early history is summarized by Patterson et al (2001). According to Greiner (1998) the magnitude of the star ranges between 13.2 and 17.8 mag. The AAVSO long term light curve suggests that the normal brightness of V751 Cyg appears to decrease slightly in recent years, attaining an average level of 15.1 mag currently. It also exhibits short lived excursions to faint states of different magnitude levels. The orbital period of V751 Cyg was first determined spectroscopically by Patterson et al (2001) and then refined by Echevarría et al. (2002). The latter authors also observed a shorter photometric period which they interpret as a negative superhump. Its presence was confirmed by Papadaki et al. (2009). The masses of the binary components are not known, while the orbital inclination seems to be low (Greiner et al., 1999). No detailed investigation of the flickering in the system has been performed, but Patterson et al (2001) measured the power spectrum to follow for ( in cycles/day). The data available for this study consist of unfiltered, high time resolution light curves provided by R.E. Nather, and light curves taken from Papadaki et al. (2009). All data refer to the normal high state of V751 Cyg.
HR Del is one of the brightest old novae. The outburst in 1967 was discovered by Alcock (1967) and peaked at a maximum brightness of 3.5 mag (Krempéc, 1970). After a long fading it reached is pre-outburst magnitude of 12 mag (Robinson, 1975) by the end of the decade of 1970 (Bruch, 1982b, and references therein) but kept on declining slowly, attaining a mean magnitude of 12.3 mag in recent times (see the AAVSO long term light curve). HR Del has a fairly long orbital period, first determined spectroscopically by Bruch (1982b) and later refined by Kürster & Barwig (1988). The latter authors also measured dynamical parameters of the system. From the structure of the nebula expelled during the nova explosion an orbital inclination of is derived (Solf, 1983; Pilyugin, 1985; Kürster & Barwig, 1988), confirming an earlier estimate of Bruch (1982b). The data available here consist of high time resolution unfiltered light curves provided by R.E. Nather and E. Robinson, complemented by light curves of I. Voloshina and the author (some of them used in the flickering study of Bruch, 1992a), and many more retrieved from the AAVSO International Database.
DO Dra: Due to a confusion concerning the identification of this star and another variable the denominations DO Dra and YY Dra are both used for the same system in the literature [see Patterson & Eisenmann (1987) and Kholopov & Samus (1988)]. It is a dwarf nova and at the same time an intermediate polar. The first indication for the magnetic nature of the system was observed by Patterson et al. (1992) who detected a low amplitude (1%) variation in the band with a period of 275 sec. However, the presence of sub-harmonics suggests that the true period (interpreted as the rotation period of the magnetic white dwarf) is twice this value. This was confirmed through X-ray observations first by Patterson & Szkody (1993) and then by other groups. Patterson et al. (1992) also saw double humped orbital variations in the IR light curve of DO Dra, attributed to ellipsoidal variations of the secondary star (confirming earlier observations of Mateo et al., 1991) and furthermore conclude that the mass accretion rate is quite low. The orbital period was first determined spectroscopically in the near infrared by Mateo et al. (1991) and later refined by Haswell et al. (1997). Both groups also determined dynamical and geometrical system parameters. In spite of its intermediate polar nature with variations on the time scale of 10 min caused by the white dwarf rotation I include DO Dra in this study because the modulation is of quite low amplitude in the optical range (Patterson et al., 1992) and thus have at most a minimal impact on the flickering parameters. The secondary star contribution is discussed in Appendix B. The data available here consist of two very high time resolution multicolour light curves provided by E. Robinson, some light curves published by Andronov et al (2008)111111avoiding their light curves observed on JD 2454162 and JD 2454163 because these are dominated by variations which the authors term transient periodic oscillations and which would significantly bias the flickering parameters. and many more retrieved from the AAVSO International Database.
AQ Eri, discovered by Morgenroth (1934), is an SU UMa type dwarf nova which, except for the study of superhumps during its superoutbursts (see, e.g., Kato et al., 2016, who also summarize the observational history of the star) has not been investigated in much detail. Thorstensen et al. (1996) measured spectroscopically an orbital period of 1.463 h which makes AQ Eri one of the shortest period SU UMa stars. Nothing is known about dynamical and geometrical system parameters. The present study draws exclusively on light curves retrieved from the AAVSO International Database, all observed during superoutburst.
KT Eri is a classical nova which erupted in 2009 (Itagai, 2009). While the outburst was well documented, investigations of the quiescent state are rare. Long term variations occurring on the time scale of hundreds of days were examined by Jurdana-Šepić et al. (2012) and Munari & Dallaporte (2014). Using additional data, Bruch (2018) showed that the periods suspected by these authors to be present in KT Eri are not stable and hence cannot be the orbital period in an scenario which puts the system in the vicinity of recurrent novae with evolved secondary stars. The orbital period is uncertain. C. Stockdale (Kato, vsnet-alert 11755) reports a possible period of 135 min. However, this value is unconfirmed and the corresponding observations remain undocumented. Moreover, they were performed soon after the nova outburst when KT Eri was at least 5 magnitudes above the average post-nova brightness. It is doubtful if orbital variations manifest themselves at a light level so much above quiescence. Bruch (2018) detected a modulation in the post-outburst light with a period of 4.685 h which may be orbital, although other origins, such as a permanent superhump as seen in several old novae and novalike variables, may also be possible. The data used in this study are limited to the high time resolution light curves already presented by Bruch (2018).
U Gem, like SS Cyg, is considered as prototype of dwarf novae. It was the first of its kind to be discovered (Hind, 1856), although at the time its nature was, of course, not yet recognized. Consequently, it has a very long history of observations and the list of publications is extensive. U Gem has an orbital period of 4.25 h (Marsh et al., 1990) which may show cyclic variations (Eason & Warden, 1983). Dynamical and geometrical system parameters have been determined by various authors, e.g., Stover (1981), Zhang & Robinson (1987), Naylor (2005) and Unda-Sanzana et al. (2006). As discussed in Appendix B, the secondary star contributes significantly to the total light of the system. The observational material available for U Gem consists of high time resolution unfiltered light curves provided by R.E. Nather, and numerous light curves retrieved from the AAVSO International Database.
DM Gem is an old nova which erupted in 1903. Very few details of the underlying binary system are known. A modulation with a period of 2.95 h was reported by Lipkin et al. (2000) and interpreted as quasi-periodic oscillations. Variations at the same period were also seen by Rodríguez-Gil & Torres (2005). They consider them to be probably linked to the orbital period. In the absence of stronger evidence I will consider the binary period of DM Gem to be unknown. Rodríguez-Gil & Torres (2005) also claim the presence of short-term variations on the time scale of 20 min. Only one high time resolution unfiltered light curve, provided by R.E. Nather, is available for this study. Note that it does not contain variations with a preferred time scale of 20 m. The respective variability seen by Rodríguez-Gil & Torres (2005) may therefore well be caused by the accidental occurrence of strong flickering flares on that time scale.
IR Gem was discovered as a dwarf nova by Popowa (1961) and classified as being of SU UMa subtype by Szkody & Shafter (1983) who conducted the first detailed study of this star. The spectroscopic orbital period was measured by Szkody et al. (1984) and Feinswog et al. (1988). Orbital brightness variations during quiescence are also observed, however, with strongly variable amplitude (Szkody et al., 1984, 1989; Feinswog et al., 1988; Fu et al., 2004). Nothing is known about dynamical and geometrical system parameters, execept that the absence of eclipses precludes a high orbital inclination. The data available for this study consist of one high time resolution unfiltered light curve provided by R.E. Nather, plus several light curves retrieved from the AAVSO International Database. They refer to different photometric states between quiescence and superoutburst.
RZ Gru is a little studied novalike variable of the UX UMa subtype. Originally discovered as a variable star by Hoffmeister (1949) its nature as a cataclysmic variable was first suspected by Kelly et al. (1981) and then confirmed by Stickland et al. (1984). The orbital period is uncertain. In a short notice Tappert et al. (1998) quote two possible values: 8.64 h and 9.79 h. Based on the narrowness of the emission lines in the spectrum of RZ Gru, Stickland et al. (1984) suspect an orbital inclination of 20o. A quite different value of was derived by Bisol et al. (2012) via modelling of the ultraviolet spectrum. These authors also found a primary star mass of and a distance of only 116 pc. The latter value is in stark contrast to the GAIA distance of pc, casting doubts upon the reliability of the adopted model. Therefore, I will consider all binary parameters of RZ Gru (including the unconfirmed orbital period) to be unknown. The data available for this study consist of unpublished high time resolution unfiltered light curves observed by the author.
AH Her is a dwarf nova of the Z Cam subtype. It oscillates between about 14.3 mag during minimum and 11.3 mag in outburst without ever remaining at a well defined quiescent light level (see AAVSO long-term light curve). Starting with Mumford (1966) various authors performed time resolved photometry. Moffat & Shara (1984) found a period in their extensive photometry which was later confirmed spectroscopically to be orbital (Horne et al., 1986). The latter authors also derived geometrical and dynamical system parameters. Absorption features of secondary star were seen in the optical spectrum of AH Her by Horne et al. (1986) and Bruch (1987) (who also derived some flickering properties in Bruch, 1992a). Its contribution to the total system light is discussed in Appendix B. The data available for this study consist of some high time resolution unfiltered light curves provided by R.E. Nather. Most of these were already analyzed in a different context by Patterson (1981). To these I add light curves retrieved from the AAVSO International Database.
AM Her is the prototype of strongly magnetized CVs, the polars. Their structure is significantly different from that of non-magnetic or only weakly magnetic systems. In particular, mass transfer does not occur via an accretion disk, but matter is guided by the strong magnetic field of the primary white dwarf directly from the L1 point to the vicinity of its magnetic poles where it forms accretion columns. This absence of a disk and a classical boundary layer between the disk and the white dwarf surface, considered to be the most probable site of flickering in non-magnetic CVs, obviously means that the flickering mechanism must be different in polars. Thus, it may be expected that the properties of flickering in these systems are also different. The magnetic nature of AM Her was revealed when Tapia (1977a) discovered strong optical linear polarization. As the brightest member of its class it has been extensively observed in particular at optical, UV and X-ray wavelengths. An extensive, albeit by far not exhaustive list of references is given in the introduction of the paper of Dai et al. (2013) to which the reader is referred. The system exhibits distinct photometric states. During the high state it attains a visual magnitude of the order of 12.3 mag while in the low state the magnitude averages about 15.3 mag (see the AAVSO long term light curve). The two states are thought to be caused by an enhanced and reduced, respectively, mass transfer between the components. The optical light is periodically modulated due to the changing visibility of the accreting magnetic pole of the rotating white dwarf. Since this rotation is coupled to the binary orbit, the period of these light changes is equal to the orbital period, the most precise values of which has been determined by Dai et al. (2013), based on an analysis of these variations over many years. Although many attempts have been undertaken to determine dynamical and geometrical system parameters they remain uncertain (Brainerd & Lamb, 1985; Cropper et al., 1998; Davey & Smith, 1996; Gänsicke et al., 1998; Greeley et al., 1999; Mouchet, 1983; Mukai & Charles, 1987; Southwell et al., 1995; Watson et al., 2003; Wickramasinghe et al., 1991; Wu et al., 1995; Young et al., 1981). Some work on the flickering in AM Her has been done in the past. Greeley et al. (1999) observed rapid variability in the far ultraviolet range where the brightness changes as much as 50% on time scales as short as 10 s. The spectrum of the variable light source is blue. The autocorrelation function suggests typical flare durations of some tens of seconds. This is quite similar to flickering observed in the optical light of AM Her by Stockman Sargent (1979) and Panek (1980). Simultaneous observations in hard X-rays and the optical range by Bearmore & Osborne (1977) revealed a correlation of the variations in these bands, decreasing towards shorter optical wavelengths. This is interpreted as a correlation between bremsstralhung (X-ray) and cyclotron (optical, decreasing to the blue) radiation. Such a correlation was, however, not seen in simultaneous optical and soft xray observations by Szkody et al. (1980). Szkody & Margon (1980) observed flickering in the and band and in a narrow band centred on the He II 4686 emission line. The currently available data consist exclusively of light curves retrieved from the AAVSO International Database.
DQ Her (= Nova Herculis 1934) is the prototype of the class of intermediate polars. In these CVs the white dwarf has a magnetic field which – while in most cases not strong enough to dominate the accretion flow from the secondary star from the very beginning as in AM Her stars (or polars) – is able to disrupt the inner accretion disk and guide matter via an accretion curtain to the magnetic poles. In contrast to polars the white dwarf rotation period is not synchronized with the orbital period. The accretion energy seen by the observer in the optical range (often as reprocessed X-ray radiation) is therefore modulated on the white dwarf spin period. While the denominations DQ Her star and intermediate polar are often used synonymously, sometimes the former term is used for a small subset of intermediate polars where the white dwarf rotation is particularly rapid with periods not exceeding 2 min. In the case of DQ Her itself the spin period, first detected by Walker (1956), is 71 s. There are, however, claims that the real period is twice this value. For a discussion of this still unsettled question, see Bloemen et al. (2010) and references therein. This spin period manifests itself in the light curves as a highly coherent low amplitude oscillation. Component masses of DQ Her have been determined by several authors. Initial studies resulted in either high or low masses. This issue was discussed in some detail and resolved by Horne et al. (1993). DQ Her is a deeply eclipsing system. Horne et al. (1993) found a very high orbital inclination of . An even higher value of (i.e., very nearly edge-on) was suggested by Wood et al. (2005). The orbital period has originally been determined by Walker (1956). Later other authors detected period variations. These studies were most recently summarized by Dai & Qian (2009) who discuss possible origins. The available data were all retrieved form the AAVSO International Data base and comprise 206 light curves.
V533 Her is the remnant of a bright nova which exploded in 1963. The quiescent system obtained some attention when Patterson (1979b) observed coherent oscillations with a period of 63.3 s which indicated that the system belongs to the rapidly rotating intermediate polars of the DQ Her subclass. However, later observations by Robinson & Nather (1983) showed that these oscillations had disappeared, casting doubts on the magnetic rotator model for V533 Her. The spectroscopic orbital period was measured by Thorstensen & Taylor (2000). A slightly shorter photometric period was observed by McQuillin et al. (2012) in SuperWASP data. It may be related to a negative superhump. Geometrical and dynamical system parameters we determined by (2002). The data available for this study consist of an extremely high time resolution multicolour light curve provided by E. Robinson, complemented by several light curves retrieved from the AAVSO International Database.
V795 Her, discovered in the Palmar Green survey (Green et al., 1982), was initially suspected to be an intermediate polar (Zhang et al., 1991; Thorstensen, 1996; Shafter et al., 1990). However, it appears now to be consensus that it is a SW Sex type novalike system as first proposed by Casares et al. (1996). With an orbital period of about 2.6 h determined spectroscopically by Shafter et al. (1990) it lies right within the period gap of cataclysmic variables. Mizusawa e al. (2010) estimate the primary star mass and the orbital inclination. V795 Her shows photometric variations with a period somewhat longer than the spectroscopic period (see, e.g., Kalużny, 1989; Patterson & Skillman, 1994; Papadaki et al., 2006; Šimon, 2012), establishing the system as a permanent superhumper. Superposed upon the superhumps are rapid flickering variations and occasional QPOs with periods of 10 – 20 min (Rosen et al., 1995; Patterson & Skillman, 1994; Papadaki et al., 2006). Šimon (2012) investigate the flickering in some detail. In particular, they find a correlation between the strength (amplitude) of the flickering on the phase of the superhump modulations (see Sect. 4.6.2 of the main paper). The presently available data consists of light curves already discussed by Kalużny (1989), Papadaki et al. (2006) and Šimon (2012), one very high time resolution multicolour light curve provided by E.L. Robinson and numerous light curves retrieved from the AAVSO International Database.
EX Hya is a well-known intermediate polar. It has a short orbital period, first measured by W. Krzeminski (cited by Mumford, 1964) and last revised by Echevarría et al. (2016). The optical light is dominated by a stable 67 min variation (Vogt et al., 1980) which is also seen in X-rays (Kruszewski et al., 1981). It is interpreted as being due to the rotation of the magnetic white dwarf primary of EX Hya (Warner, 1982). The ratio between the rotational and orbital period of almost exactly 2/3 is unusually large for intermediate polars. Many authors have tried to measure the component masses of EX Hya (see the list of references in Table 4 of Echevarría et al., 2016). EX Hya is normally encountered in a quiescent state at an average visual magnitude of 13.0 mag (see AAVSO long term light curve; however, in recent years the quiescent magnitude appears to decrease slightly). But occasionally this state is interrupted by short lived dwarf nova-like outburst which can reach 9 – 10 mag. Hellier et al. (2000) estimate the average outburst frequency to be once every 1.5 years. They are unable to decide whether the outbursts are triggered by a disk instability or by an enhanced mass transfer from the secondary. EX Hyi is an eclipsing system. However, flickering is particularly strong to the extend that, depending on the phase of the 67 min variation, it may be difficult to distinguish the eclipses from minima between flickering flares. To my knowledge, the only study (apart from Bruch, 1992a) dealing in some detail with flickering in this star was performed by Semena et al. (2014). They interpret flickering in this system as reprocessed X-ray radiation and determine properties of the accretion footprints on the white dwarf. The observational data used in the present study consist of many high time resolution quiescent light curves provided by B. Warner, R.E. Nather and C. Sterken, supplemented by light curves taken from Reinsch & Beuermann (1990) and others retrieved from the AAVSO International Database.
VW Hyi, discovered by Luyten (1932), is a well known SU UMa type dwarf nova and probably one of the best studied objects of the kind. In particular during the last two decades of the past century many publications were dedicated to the system. A prominent hump in its light curve permitted Vogt (1974) to measure the orbital period. After subsequent refinements over time the most accurate value modern value is quoted by Kato et al. (2014). Many authors have tried to determine the component masses of VW Hyi. A critical assessment of the various applied methods and their results has been performed by Smith et al. (2006). The orbital inclination remains rather uncertain. There appears to be no more accurate estimate than that of Schoembs & Vogt (1981) of . VW Hyi is a rich source of DNOs (dwarf nova oscillations) and QPOs (see, e.g., Warner & Woudt, 2006; Woudt, 2010; Blackman, 2010). However, no specific studies of the substantial flickering exhibited by the system have come to my knowledge. The data available for this study consist of numerous high time resolution light curves provided by B. Warner, used previously by Warner (1975a) Warner & Brickhill (1978) and Robinson & Warner (1984). These data are complemented by many more light curves retrieved from the AAVSO International Database.
WX Hyi is another SU UMa type dwarf nova, but by far not as well studied as more famous members of the group. While the long term visual behaviour was documented by Bateson & McIntosh (1986) and Bateson et al. (1990), detailed accounts of the optical behaviour are mostly restricted to the discussion of light curves (e.g., Walker et al., 1976; Bailey, 1979; Kuulkers et al., 1991). The orbital period was spectroscopically determined by Schoembs & Vogt (1981). These authors provide also the only estimate of dynamical and geometrical system parameters which, however, remain quite uncertain. The data available for this study consist of high quality light curves provided by B. Warner, observed in all photometric states. These are complemented by Walraven light curves, some observed by the present author [also used by Bruch (1992a) to characterize flickering in WX Hyi], but mostly taken form Kuulkers et al. (1991), and two unpublished light curves.
BL Hyi (= H0538+608) was discovered and classified as a polar by Agrawal et al. (1983). It belongs to the better studied CVs with numerous dedicated publications. Many of these deal with the complicated magnetic field structure and the X-ray properties. Even so, not much reliable information exists on some basic binary parameters. An exception is the orbital period which has been determined at similar levels of accuracy by various groups using different techniques (Pickles & Visvanathan, 1983; Cropper, 1987; Beuermann & Schope, 1989; Wolff et al., 1999; Mennickent et al., 1999). It lies below the CV period gap, as is the case for most polars. The orbital inclination and the masses are not well known (Beuermann & Schope, 1989; Wolff et al., 1999). Just as many other polars, BL Hyi exhibits low and high states in its long term light curve (see, e.g., Gerke et al., 2006). During high states, to which all observations used in the present study refer, strong orbital variations reaching almost 1.5 mag are caused by the various aspect of the active magnetic (accretion) regions on the white dwarf. The available data consist of 11 unpublished light curves observed by the author at a high time resolution.
DI Lac is an old novae which erupted in 1910. Although at an average magnitude of 15.6 mag (Hoard et al., 2000) it belongs to the brighter nova systems, details about the structure of the system are scarce. Even the orbital period is not well documented, only being quoted by Ritter & Kolb (2003) as a privat communication from R.F. Webbink. From model fits limits on the primary star mass and the orbital inclination are given by Gill & O’Brien (2000) and Moyer et al. (2003). The data available for this study consist of a single unfiltered light curve with a high time resolution provided by R.E. Nather.
X Leo: This dwarf nova has not received much attention in the past. The AAVSO long term light curve reveals that the system suffers frequent outbursts and remains in quiescence only for short periods of time. The orbital period has been determined spectroscopically by Shafter & Harkness (1986). Based on a synthetic spectral analysis of IUE spectra Urban & Sion (2006) estimated the primary star mass and the orbital inclination. The data available for this study consist of only one light curve observed close to outburst maximum retrieved from the AAVSO International Database and one quiescent high time resolution light curve provided by R.E. Nather.
GW Lib: Gonzales & Maza (1983) detected this dwarf nova during an outburst. A second large amplitude (super-) outburst was observed and extensively documented in 2007, establishing the system as a WZ Sge star. GW Lib became famous as the first CV to display WD oscillations of the ZZ Cet type in its light curves (van Zyl et al., 2000) which have been extensively investigated thereafter (e.g., van Zyl et al., 2004; Townsley et al., 2004; Szkody et al., 2016; Chote & Sullivan, 2016; Toloza et al., 2016). The oscillations subsided during the 2007 superoutburst and in subsequent years (Copperwheat et al., 2009; Vican et al., 2011; Bullock et al., 2011) probably because the white dwarf left the instability strip due to heating during the outburst. Apart from the short period WD oscillations a modulation with a period of 2.1 h was repeatedly observed during quiescence (Would & Warner, 2002; Copperwheat et al., 2009; Vican et al., 2011). The latter authors suspect that the true period is twice this value, i.e, 4.2 h (see also Bullock et al., 2011). It is of unknown origin, unrelated to the much shorter orbital period, first measured spectroscopically by Szkody et al. (2000) and then rectified by Thorstensen et al. (2002). The most complete geometrical and dynamical model was published by van Spaandonk et al. (2010). The data available for the present study consist of light curves retrieved from the OPD data bank and the AAVSO International Database. Most of the observations were taken during the plateau phase of the 2007 outburst while some were acquired after the steep decent at the end of the superoutburst during the gradual decline to quiescence, but still considerably above the quiescent magnitude of 17 mag (Thorstensen et al., 2002). As mentioned above, during these phases the white dwarf oscillations had ceased and therefore do not bias the determination of the flickering parameters.
BR Lup: Not many dedicated studies of this star exist. The detection of superhumps by O’Donoghue et al. (1987) during an outburst in 1986 permitted a classification as a dwarf nova of SU UMa subtype. The orbital period was measured by Mennickent & Sterken (1998) in photometric observations during quiescence. These authors also quote dynamical and geometrical system parameters. The data available for the present study consist of high time resolution light curves provided by B. Warner. These are the same data already used by O’Donoghue et al. (1987). They are supplemented by observations retrieved from the AAVSO International Database.
AY Lyr is a little studied cataclysmic variable. Discovered as a dwarf nova by Hoffmeister (1928), it was recognized as a SU UMa star by Patterson (1979a). Not much is known about the system parameters. Not even the orbital period has been measured directly. The period quoted by Ritter & Kolb (2003) has been inferred from the observed superhump period (Udalksi & Szymanski, 1988). The system appears to be seen almost pole-on. Voikhanskaya (1996) estimated . The data available for the present study consist of some light curves provided by R.E. Nather (already having been used by Patterson, 1979a). They are complemented by a few data retrieved from the AAVSO International Database.
MV Lyr is a well studied novalike variable of the VY Scl subtype. The long term light curves was characterized by many authors, e.g., Wenzel (1980), Rosino et al. (1993), Pavlenko & Shugarov (1998), or Honeycutt & Kafka (2004). During high states MV Lyr has a mean magnitude around . During low states it can become as faint as 18 mag. The orbital period has been determined spectroscopically by Voikhanskaya (1988), Borisov (1992) and last by Skillman et al. (1995). MV Lyr also exhibits a slightly longer photometric period (Borisov, 1992; Skillman et al., 1995) which may be interpreted as being due to a superhump. Dynamical and geometrical system parameter were investigated by Schneider et al. (1981), Voikhanskaya (1988) and Skillman et al. (1995). Of all individual CVs, MV Lyr is arguably the system where flickering has been studied most intensively. These investigations started with Pavlenko & Shugarov (1998), who fitted a shot noise model to the observed flickering, and Kraicheva et al. (1999a), who studied the power spectrum of the flickering and constructed autocorrelation functions to learn about the involved time scales. However, the long term, high cadence monitoring by the Kepler spacecraft provided an unprecedented opportunity to explore flickering in MV Lyr. Scaringi et al. (2012a) detected a linear relationship between the rms-variations in the light curve and the flux of the system; a feature previously observed in black hole and neutron star binaries and in AGNs, suggesting a common physical origin for broad band variability in all compact accretors. The same group also investigated the power density spectrum of the flickering light source and were able to decompose it into a number of Lorentzian shaped components (Scaringi et al., 2012b). On the basis of these findings Scaringi (2014) developed a model to explain flickering as fluctuation of the mass accretion rate at different disk radii which propagate inwards and couple together. Using the same Kepler data of MV Lyr, Dobrotka et al (2015) modelled the flickering variability in the framework of a statistical model based on disk angular momentum transport via discrete turbulent eddies with an exponential distribution of the dimension scale. The simulated light curves exhibit the typical linear rms-flux relationship and the observed log-normal flux distribution. The authors can also explain at least some of the breaks in the power spectra (see also Dobrotka et al., 2017). Finally, I mention the work of Zamanov et al. (2016) who showed that many accreting systems (CVs and symbiotic stars), including MV Lyr, obey the same rms-flux relation over four orders of magnitude in flux. The data available for the present study consist of light curves provided by R.E. Nather and S. Shugarov, as well as data retrieved from the AAVSO International Database. All light curves refer to the high state of MV Lyr.
AQ Men: Only three studies of the optical properties of AQ Men have been published. The star was detected in the Edinburgh-Cape Blue Object Survey as EC 05114-7955 by Chen et al. (2001) and classified as a cataclysmic variable. They suspected a dwarf nova nature but did not exclude the possibility of AQ Men being a novalike variable. Armstrong et al. (2013) prefer the lattere classification based on the absence of observed outbursts even many years after discovery and the compatible spectrum. From radial velocity variations covering only 1.5 cycles Chen et al. (2001) derived a period of 3.12 h. In extensive photometric observations Armstrong et al. (2013) found a similar but more precise period and suspect the presence of grazing eclipses. They also found indications for negative superhumps and a super-orbital signal with a period of 3.78 d. However, light curves observed by Bruch (2020) contain a strong modulation with a period of 1.95 h. It is not clear if any of the claimed periods is really due to the orbital motion of AQ Men. The present study draws on the light curves already used by Bruch (2020).
BT Mon is an old nova which suffered an outburst in 1939. Deep eclipses in the light curve were detected by Robinson et al. (1982) allowing to measure the orbital period which was later refined by Smith et al. (1998). Based on spectroscopic data the latter authors also derived a complete geometrical and dynamical model for the system. The present study is based on light curves with high time resolutions provided by R.E. Nather (see also Robinson et al., 1982), supplemented by light curves retrieved from the AAVSO International Database.
KQ Mon: Detected by Hoffmeister (1943), KQ Mon was originally classfied as an irregluar variable and only in 1982 identified as a UX UMa type novalike variable by Sion & Guinan (1982) (later confirmed by Zwitter & Munari, 1994). Not much is know about the object. Schmidtobreick et al. (2005) measured a spectroscopic orbital period. Modelling UV spectra, Wolfe et al. (2013) obtained a primary star mass of roughly , and an orbital inclination of no more than 60o. However, their model may be questionable because it implies a distance of only 144 – 165 pc, while the GAIA distance to KQ Mon is pc. Only three unpublished light curves by the author are available for this study.
RS Oph is well known as one of the most active recurrent novae. Since 1998 six outbursts have been observed and two more are suspected to have occurred undetected (Schaefer, 2010). In contrast to most other cataclysmic variables, the secondary star is not on or close to the main sequence, but a M type giant. Thus, RS Oph also ranks among the symbiotic stars. It is one of the few symbiotic stars exhibiting flickering which may be seen as a clear indication for the presence of an accretion disk. Schaefer (2010) presents a comprehensive overview of the photometric history of the system in the context of recurrent novae in general. As a system containing a giant component, the orbital period is much longer than that of the bulk of CVs. The most precise measurement is that or Brandi et al. (2009) (who also discuss earlier period measurements): d. As most recurrent novae, RS Oph contains a white dwarf with a high mass close to the Chandrasekhar limit. Dynamical and geometrical system parameters are discussed by Hachisu et al. (2006, 2007), Hachisu & Kato (2018), Brandi et al. (2009) and Somero et al. (2013). Beginning with the early observations of Walker (1957) and Walker (1977), reports on rapid variations in RS Oph abound in the literature. Starting with Bruch (1992a) some authors performed detailed studies of the flickering. Observing light curves, Zamanov et al. (2010) determined the colours of the flickering light source and estimated its temperature to be K, its radius to be and its luminosity to be (assuming a distance of 1.6 kpc). Zamanov et al. (2015) found a significant correlation between the flickering amplitude and the average flux of the hot component. This was already noticed by Šimon et al. (2004). Zamanov et al. (2016) showed that many accreting systems (CVs and symbiotic stars), including RS Oph obey the same rms-flux relation over four orders of magnitude in flux. Finally, in a series of papers, Georgiev et al. (2019, 2020a, 2020b) determined statistical parameters of intra-night variations in numerous light curves of RS Oph and concluded that flickering occurs on several preferred time scales (modes) which follow a power function. The present study draws on multicolour light curves observed by the author (some of them published in Bruch, 1986), and numerous light curves retrieved from the MEDUZA archive and the AAVSO International Database.
V380 Oph was identified as a variable star by Hoffmeister (1929). Its spectrum is considered a “textbook example” for a CV by Liu et al. (1999). The orbital period was spectroscopically determined by Shafter (1983d, 1985) and later refined by Rodríguez-Gil et al. (2007) who also classified V380 Oph as a SW Sex star. A long-term light curve with rather smooth variations between 14.3 and 16 mag is shown by Kafka & Honeycutt (2004), but an excursion to a low state of 17.5 mag observed by Shugarov et al. (2005) and in particular light curves generated from more recent data provided by the AAVSO, the AFOEV (Association Française des Observatuers d’Étoiles Variables) and the BAAVSS (British Astronomicial Association Variable Star Section) also justify to count V380 Oph among the VY Scl stars. Nothing is known about geometrical and dynamical system parameters. The data available for this study consist high time resolution light curves taken from Bruch (2017a). They were obtained at a brightness slightly below the normal high state magnitude. These data are complemented by light curves retrieved from the AAVSO International Database.
V426 Oph is a comparatively bright dwarf nova. A complete dynamical model based on spectroscopic observations has been presented by Hessman (1988) who also summarizes all previous observations of the system. At the long orbital period of almost 7 h the secondary spectrum is visible in the optical range, making the system a double lined spectroscopic cataclysmic binaries and thus permitting a direct measurement of the mass ratio. Based on apparently periodic modulation in X-rays and in optical light, V426 Oph was repeatedly suspected to contain a magnetic white dwarf and thus to belong to the intermediate polars (see, e.g., the discussion in Homer et al., 2004). However, none of them has survived the test of time. Previous studies of flickering in this system are restricted to Bruch (1992a). The data available for the present study consist of light curves observed during outburst by Shugarov (1983), Walraven light curves observed by the author (quiescence) and taken from Hollander et al. (1993) (outburst), and many light curves retrieved from the AAVSO International Database, referring to different photometric states.
V442 Oph: This novalike variable was identified as a cataclysmic variable by Szkody & Wade (1980). It has a spectroscopic orbital period (Diaz, 2001) which places the system close to the upper edge of the CV period gap. Like most novalike variables in this period range, V442 Oph shares many spectroscopic charateristics with the SW Sex stars (Hoard et al., 2000). The occasional ocurrence of low states in the light curve (Garnavich & Szkody, 1988) also makes it a VY Scl star. The presence of superhumps (negative and positive) was reported by Patterson et al. (2002). Nothing is known about dynamical and geometrical system parameters except that the absence of eclipses in the light curves precludes a high orbital inclination. Strong continuum flickering has been seen in V442 Oph by various observers (Szkody et al., 1984, 1989; Szkody & Shafter, 1983; Patterson et al., 2002) but has not been investigated in detail. Diaz (2001) studied the H emission line flickering. The data available for this study consist of light curves provided by B. Warner, supplemented by by data retrieved from the OPD data bank and the AAVSO International Database.
V841 Oph erupted as a nova in 1848 at the dawn of the epoch of astrophysics (Hind, 1948a, 1948b) and is thus one of the oldest old nova known. Slight semi-regular brightness variations with an amplitude of the order of 0.4 mag appear to occur on time scales of about 27 days (Turner, 1921) or 50 days (Barnard, 1921; Steavenson, 1923; Della Valle & Rosino, 1987; Hoard et al., 2000). The latter authors also report possibly periodic variations on a time scale fo 3.5 – 5 y. It took a long time before the orbital period could be determined. The first reliable value was measured spectroscopically, using both, emission lines and late type absorption features, by Diaz & Ribeiro (2003) and was soon afterwards improved by Peters & Thorstensen (2006). At more than 14 h it is among the longest of all CVs. Consequently, the secondary star has a fairly early spectral type of K32 (Peters & Thorstensen, 2006). Dynamical and geometrical system parameters were derived by Diaz & Ribeiro (2003). The data available for this study consist of light curves taken from Warner et al. (1995) and unpublished data observed by the author.
V2051 Oph: This deeply eclipsing SU UMa type dwarf nova is one of the better studied CVs with numerous dedicated publications dealing in particular with the optical properties of the system. It was discovered as a variable star by Sanduleak (1972) who already suspected its dwarf nova nature. Eclipses were first seen by Grauer & Bond (1981). The orbital period is slightly variable as shown by Echevarría & Alvarez (1993) and Baptista et al. (2003) (see also Qian et al., 2015). Geometrical and dynamical parameters are quoted by Baptista et al. (1998) and Longa-Peña et al. (2015). The location of the flickering light source in V2051 Oph was determined by Bruch (2000). It resides very close to the white dwarf while the outer parts of the accretion disk do not take part in the flickering to a perceptible degree. Additionally, flickering occurs also to a certain degree at the impact region of the transferred matter onto the accretion disk. This holds true for short period time scales of 1 min. Using a different approach Baptista & Bortoletto (2004) were able to investigate flickering at both, low and high frequencies. They found the low frequency flickering to be associated mainly to the gas stream from the secondary which overflows the accretion disk. The maximum occurs at the location of the closest approach of the gas stream to the white dwarf. In contrast, the high frequency flickering originates in the accretion disk and has a distribution similar to the steady disk light. There is no evidence for emission from the hot spot, gas stream or white dwarf. The observational data used here consist light curves provided by R.E. Nather and B. Warner, all referring to quiescence. In part, they were already used by Warner & Cropper (1983), Warner & O’Donoghue (1987) and Bruch (2000). Additional quiescent data sets were taken from Hollander et al. (1993). Further light curves obtained during quiescence and outburst were retrieved from the OPD data bank and the AAVSO International Database.
CN Ori: The long-term light curve of the dwarf nova CN Ori in unusual in the sense that in contrast to most other systems it does not contain well defined quiescent phases but rather a successive series of outbursts with a mean cycle length of only 16 days (Bateson, 1979). In spite of being a comparatively bright object, few specific studies of CN Ori have been published. Extensive photometry was performed by Schoembs (1982) and Mantel et al. (1988). Based on spectroscopic and photometric data Barrera & Vogt (1989a) measured the orbital period. Geometrical and dynamical system parameters are not well known. The most reliable values quoted in the literature appear to be those dirived by Mantel et al. (1987). The data sets used here consist of light curves provided by R.E. Nather, B. Warner and E. Robinson. To these I add many light curves retrieved from the AAVSO International Database. The entire data set comprises all photometric stages between quiescence and outburst maximum.
CZ Ori: This dwarf nova was discovered by Hoffmeister (1928). Szkody & Mattei (1984) studied the long term light curve, showing that the system oscillates between an outburst magnitude of 11.8 mag and 16.3 mag in quiescence. However, more recent observations (see the long-term AAVSO light curve) reveal that in quiescence CZ Ori can be even fainter than 17 mag. Based on spectroscopic observations Spogli & Claudi (1994) and Ringwald et al. (1994) derived slightly different values for the orbital period. Component masses and orbital inclination were estimated by Spogli & Claudi (1994). Only one light curve provided by R.E. Nather, observed during early decline from an outburst is available for this study.
V1193 Ori was discovered by Hamuy & Maza (1986) who noted its similarity to cataclysmic variables. This classification was confirmed by Bond et al. (1987) who showed that the system is a UX UMa-type novalike variable. A spectroscopic period measured by Ringwald et al. (1994) is consistent with the photometric period derived by Papadaki et al. (2009). However, while the latter authors did not see any other period in their data, Ak et al. (2005) claim the presence of three different periods which they interpret as (i) orbital [claiming that the periods of Ringwald et al. (1994) and Papadaki et al. (2009) are 1/day aliases), (ii) a negative superhump period, and (iii) the beat between the other two periods. Nothing is known about geometrical and dynamical system parameters. Flickering in V1193 Ori is rather strong. Warner & Nather (1988) draw attention to the fact that its amplitude is significantly higher than that of the flickering in other bona fide UX UMa type novalike variables. Papadaki et al. (2009) investigate the power spectrum of the flickering and mention the dificulties to interpret the power law index. The data available for the present study consist of light curves taken from Papadaki et al. (2009), complemented by light curves retrieved from the AAVSO International Database.
GS Pav was discovered as a variable star by Hoffmeister (1963). Zwitter & Munari (1995) published a spectrum. Only the Balmer emission lines can reliably be identified upon a blue continuum. The photometric measurements of Groot et al. (1998) revealed the star to be deeply eclipsing and thus permitted to derive the orbital period which was later refined by Bruch (2017b). Groot et al. (1998) restricted the orbital inclination to , but their mass estimates depend on unreliable assumptions and will therefore not be used here. While they classified the system to be a novalike variable of the RW Tri subclass, it is listed as being of VY Scl subtype in the Ritter & Kolb (2003) catalogue. However, as Bruch (2017b) argues, there is no reason for the latter classification. Therefore I consider GS Pav as a normal UX UMa type novalike variable. The data used in this study were all taken from Bruch (2017b).
V345 Pav: Most of what is known about V345 Pav (= EC 19314-5915) comes from a study of Buckley et al. (1992). They presented a detailed spectroscopic analysis, supplemented by some photometry. Based on eclipses observed in the latter they derived the orbital period which was later refined by Bruch (2017b). While Buckley et al. (1992) tentatively consider the star to be of Z Cam subtype the absence of any outburst activity in later data and the constancy of the out-of-eclipse light curve as evidenced, e.g., by the Catalina Sky Survey (2005 – 2013) renders a classification as an UX UMa novalike variable likely, as quoted in the Ritter & Kolb (2003) catalogue. The spectrum of V345 Pav is peculiar in the sense that it exhibits metallic absorption lines typical of a G8 dwarf star which cannot be attributed to the secondary of the CV system. Instead, Buckley et al. (1992) conjectured the presence of a third star which contributes 235% to the band light (see also Appendix B). Nothing is known about the component masses. The system being eclipsing, the orbital inclination must evidently be high, but no specific values is quoted in the literature. The light curves used in this study were all taken from Bruch (2017b).
IP Peg is an eclipsing dwarf nova with a period originally measured by Goranskij et al. (1985) and most recently updated by Copperwheat et al. (2010). The light curve in quiescence is dominated by a prominent orbital hump caused by the phase dependent visibility of the hot spot. IP Peg belongs to the better studied CVs with numerous papers dedicated to it. Geometrical and dynamical system parameters were derived by various authors (e.g., Marsh, 1988; Martin et al., 1987, 1989; Beekman et al., 2000; Smak, 2002; Ribeiro et al., 2007; Copperwheat et al., 2010). The contribution of the cool companion to the total light of IP Peg cannot be neglected. It is discussed in more detail in Appendix B. Specific statements on the flickering in IP Peg are rare in the literature. Using UV spectra observed with the Hubble Space Telescope Hoard et al. (1997) investigated the spectrum of the flickering component in the wavelength range 1300 – 2200 Å. They find an excess between 1300 and 1500 Å which they interpret as an indication for a dominant contribution of the bright spot to the flickering. This is in agreement with Bruch (2000) who, using quite different techniques, also concludes that most of the flickering originates in the bright spot in this system. The data used here consist of a light curve taken from Goranskij et al. (1985), multicolour light curves provided by E. Robinson, and one light curve downloaded from the OPD data bank. The bulk of the data, however, was retrieved from AAVSO International Database. The observations encompass all photometric states.
LQ Peg (= PG 2133+115) was discovered in the Palomar-Green survey (Green et al., 1986) and classified as a novalike variable by Ferguson et al. (1984). Most of the time hovering at a magnitude of about 14.8 mag, occasional low states, first seen by Sokolov et al. (1996) and then by Watanabe (1999), Kato & Uemura (1999), Schmidke et al. (2002) and Kafka & Honeycutt (2005), testify to a VY Scl nature of LQ Peg. Not many details about the structure of the system are known. In particular, no time resolved spectroscopy has been performed. Based on regular brightness variations Papadaki et al. (2006) derived an orbital period of 2.99 h. However, even this is contested by Rude & Ringwald (2012) who argue that this period is rather due to a negative superhump. They consider the orbital period (not observed directly, but inferred from indirect clues) to be 3.22 h. The data available for the present study are those published by Papadaki et al. (2006), supplemented by light curves retrieved from the AAVSO Internacional Database.
TZ Per: This Z Cam type dwarf nova was discovered as a variable star by d’Esterre (1912). The early observational history of the star is summarized by Bruch & Schimpke (1992). Based on radial velocity measurements Ringwald (1995) first measured the orbital period which was later refined by Echevarría et al. (1999). Nothing is known about geometrical and dynamical system parameters. Only two light curves retrieved from the AAVSO International Database are available for this study. They refer to outburst maximum and standstill, respectively.
GK Per erupted in 1901 as the first bright nova in the 20th century. After the outburst irregular fluctuations developed over time into a well defined alternation between quiescence and dwarf nova outbursts recurring in intervals of several hundred days (Bianchini & Sabbadin, 1983). Thus, today the system is established as one of a few old novae which became dwarf novae decades after the outburst. At very nearly 2 days the orbital period of GK Per is unusually long. The most precise measurement was published by Moreales-Rueda et al. (2002). The almost exact commensurability of the period with the solar day severely hampers observations destined to cover all orbital phases of the system. The long period may explain some peculiarities of the outburst light curve such as the long outburst intervals, the long duration and the symmetrical shape of outburst rise and decline (Evans et al., 2009); properties which GK Per shares with other long period dwarf novae such as BV Cen (Bateson, 1974), V630 Cas (Shears & Poyner, 2009) and possibly V1129 Cen (Bruch, 2017c). Many authors tried to determine geometrical and dynamical parameters of GK Per (see Wada et al., 2018, for a summary). Watson et al. (1985) detected a 351 s oscillation in X-rays, establishing GK Per as an intermediate polar. In the optical range sometimes QPOs with a period at or close to the X-ray period are seen. (Patterson, 1981; Mazeh et al., 1985). The former author observed the optical counterpart of the 351 s X-ray pulsation in the band at a small and variable amplitude of 0.002 – 0.016 mag. He did not see these variations in blue light but detected instead QPOs at a similar period. In high speed photometric observations Pezzuto et al. (1996) did not detect a corresponding signal. If present, these modulations remain on a small magnitude scale and occur predominantly in the ultraviolet. Therefore, they are not expected to have a significant impact on the flickering amplitudes determined here. Some properties of the flickering in GK Per were investigated by Bruch (1992a). The optical light contains a significant contribution of the secondary star which is detailed in Appendix B. The data used for the present study refer to all photometric states of the GK Per dwarf nova cycle and consists of unfiltered light curves provided by R.E. Nather and multicolour light curves observed by E. Robinson and the author, respectively (the later were already used by Mazeh et al., 1985). These data are suplemented by light curves retrieved from the MEDUSA archive and the AAVSO International Database.
KT Per: Various publications count this dwarf nova among the Z Cam star. This is apparently based on a tentative classification by Löchel (1965). However, as Simonsen (2011) points out, the long term AAVSO light curve, covering more than 40 years, does not contain evidence of standstills. The long-term light curve has also been studied by Szkody et al. (1984). The system is very active, remaining never in quiescence for an extended period of time. The first time resolved spectroscopy was published by Ratering et al. (1993) who measured radial velocity variations and determined the orbital period. Combing these data with data of Thorstensen & Ringwald (1997) and their own spectroscopy, Echevarría et al. (1999) refined the period. Nothing is known on dynamical and geometrical system parameters. However, the lack of eclipses in the light curve excludes a high inclination. The data available for this study consist of light curves provided by R.E. Nather (see Robinson & Nather, 1979; Patterson, 1981). These data are supplemented light curves retrieved from the AAVSO International Database. All light curves were observed in different outburst states, well above the quiescent magnitude.
RR Pic (Nova Pic 1925), in contrast to other similarly bright novae, has attracted relatively little attention. While a number of photometric studies have been published in the last decades of the past century (e.g., Warner, 1981, 1986; Kubiak, 1984; Haefner & Betzenbichler, 1991) few detailed optical spectroscopic investigations have been performed (Schmidtobreick et al., 2003; Ribeiro & Diaz, 2006). In consequence not much is known about the geometrical and dynamical system parameters. The values cited in Table C1 are nothing more that the centres of wide ranges of permitted values quoted by Ribeiro & Diaz (2006). The orbital period of RR Pic reveals itself through a periodic hump in the light curve. It was first determined by Vogt (1975) and last updated by Vogt et al. (2017). The long term behaviour of the hump was studied by Fuentes-Morales et al. (2018). Schmidtobreick et al. (2008) and Fuentes-Morales et al. (2018) claim the detection of superhumps in the light curve of RR Pic. The former authors also characterize the power spectrum of the fickering activity, however, without drawing specific conclusions. They confirm the presence of rapid oscillation, already previously seen by, e.g., Warner (1981) and Schoembs & Stolz (1981). The present study is based on white light observations published by Warner (1986), complemented by light curves retrieved from the AAVSO International Database.
TY PsA: The SU UMa type nature of this star, originally identified as the high galactic latitude early type star PS 74 by Philip & Stock (1972), was discovered by Barwig et al. (1982). It remains a little studied dwarf nova with few dedicated publications. Warner et al. (1989) performed photometric and spectroscopic observations in quiescence and different outburst states. They measured a photometric period but could not detect this period in radial velocity measurements. Only later, O’Donoghue & Soltynski (1992) found a spectroscopic period compatible with the photometric one. Warner et al. (1989) also suspect the presence of shallow eclipses seen during the decline from a superoutburst but not in quiescence. Similar features were already mentioned by Barwig et al. (1982). A range of possible component masses is mentioned by O’Donoghue & Soltynski (1992), but it is too wide to be useful in the present context. They also mention a possible range for the orbital inclination . The data available for the present study consist of light curves already presented by Warner et al. (1989).
VV Pup is the third among all detected polars and one of the best studied systems of its kind. Its nature as a magnetic cataclysmic variable was noticed by Tapia (1977b) on behalf of its strong circular polarization. Even before its identification as an AM Her star strong photometric modulations permitted Walker (1965) to measure a period which was interpreted as being the orbital period, and which was later confirmed spectroscopically by Schneider & Young (1980) and Cowley et al. (1982). Component masses were determined by Howell et al. (2006). The orbital inclination was measured by various authors (Cropper, 1988; Vennes et al., 1995; Sirk & Howell, 1998). The data available for the present study consist light curves provided by R.E. Nather and observed by the author.
CP Pup: (Nova Puppis 1942) was one of the brightest novae ever observed. At a quiescent magnitude of 15 mag Bruch & Engel (1994) it is bright enough for detailed observations. Yet the nature of this object is still shrouded in mysteries. Not only are the spectroscopic and photometric periods different from each other, but various authors found discrepant values at different epochs (see Bianchini et al., 2012, and references therein for a more detailed discussion). Mason et al. (2013) even raise doubts whether the radial velocity variations reflect the binary period at all or whether they might be caused by the rotation of a magnetic white dwarf (see below) in a system with a longer orbital period. Another mystery concerns the dynamical properties of the system which lead to considerable uncertainties about the component masses and the orbital inclination. O’Donoghue et al. (1989) point out the problems concerning a dynamical solution based on radial velocity measurements. They lead to low white dwarf masses (Duerbeck et al., 1987; Barrera & Vogt, 1989b; White & Honeycutt, 1993). This is in contradiction with the high outburst amplitude and the rapid decline rate of days (Duerbeck, 1981) which according to our current understanding of nova outbursts requires a massive white dwarf. Not the least of the enigmas about the CP Pup concern its possible nature as a magnetic CV. Several groups suggested that the unstable photometric period may be due to a rotation of the white dwarf with a period slightly out of synchronization with the orbital period (Warner, 1985; Diaz & Steiner, 1991b; White & Honeycutt, 1993). Based on their spectroscopic observations, Bianchini et al. (2012) come to a similar conclusion. The X-ray properties of the star make Balman et al. (1995) also suggest an intermediate polar nature for CP Pup. Mason et al. (2013) thoroughly discuss this issue. The data available for the present study consist of light curves provided by B. Warner. They were already published by Warner (1985) and O’Donoghue et al. (1989). These data are complemented by numerous light curves retrieved from the AAVSO International Database.
V348 Pup: Tuohy et al. (1990) identified the faint HEAO X-ray source 1H0709-360 as an eclipsing novalike variable in the CV period gap. They also measured the orbital period, later confirmed by Baptista et al. (1996), Rolfe et al. (2000) and Dai et al. (2010). The latter authors report a small period increase over time. Photometric variations with a period slightly different from the orbital period made Tuohy et al. (1990) suspect an intermediate polar nature of the star; a notion which could neither be confirmed no rejected in pointed X-ray observations by Rosen et al. (1994), while Froning et al. (2003a) found no evidence for a magnetic nature. Instead of intermediate polar type variations, Rolfe et al. (2000) reported superhumps in the system which, however, were not seen when Saito & Baptista (2016) observed the V348 Pup at a later epoch. Dynamical and geometrical system parameters were determined by Rolfe et al. (2000), Rodríguez-Gil et al. (2001) and Saito & Baptista (2016). The observational data used in this study consist of light curves retrieved from the OPD data bank.
T Pyx is one of the best known and thoroughly observed recurrent novae which suffered its first observed outburst in 1890. Thereafter it erupted on average every 20 years (Schaefer, 2010) until 1967, then requiring another 44 year until its (so far) last eruption in 2011. Schaefer et al. (2010) argue that these recurrent nova type eruptions were preceded by an (unobserved) classical nova outburst in 1866. Godon et al. (2018) summarize the extensive literature dealing with T Pyx and discuss in some detail the system parameters which have a bearing on the current work. The system belongs to the small group of recurrent novae with short (time scale of hours) orbital periods (Schaefer, 2010). It was photometrically measured first by Schaefer et al. (1992) and then seen and found to be slighly increasing over time by various authors (Patterson et al., 1998; Uthas et al., 2010; Patterson et al., 2017). All model calculations of recurrent novae outbursts indicate that the mass of the white dwarf is high (close to the Chandrasekhar limit; see, e.g., Starrfield et al., 1985, and later references). This is in line with a primary star mass for T Pyx derived by Schaefer et al. (2010) and Shara et al. (2018), respectively, based on nova outburst models. However, a much smaller mass is advocated by Uthas et al. (2010) on grounds of their radial velocity study. Conflicting secondary star masses have been derived by Patterson et al. (2017) and Selvelli et al. (1995). There is also no agreement concerning the orbital inclination of the system (Patterson et al., 1998; Uthas et al., 2010; Shore et al., 2013; Patterson et al., 2017). The observational data available for this study consist of light curves provided by B. Warner, supplemented by numerous data sets retrieved from the AAVSO International Database. The latter were all observed during the late decline from the 2011 outburst and the subsequent quiescence between 2012 and 2018.
WZ Sge is the prototype of a small class of dwarf novae which do not exhibit normal outbursts but only rare high amplitude superoutburst with intervals which can reach decades. Initially, it was thought to be a nova when it was first observed in outburst in 1913 by J.C. Mackie, as reported by Leavitt & Mackie (1919). A second outburst observed by K. Himpel and reported by Mayall (1946) led to a classification as recurrent nova. Only much later Warner (1976a) suggested the system to be dwarf nova. WZ Sge is doubtlessly one of the best studied CVs ever. Periodic photometric variations with a primary minimum which is now known to be a shallow eclipse of the bright spot in the system first permitted Krzeminski (1962) to measure the orbital period. Refinements have been performed various times afterwards, most recently by Patterson et al. (2018) who also discuss period variations. Even ignoring discrepant early mass estimates (performed before the canonical CV model was established) mass determinations of WZ Sge are controversial (Gilliland et al., 1986; Smak, 1993; Spruit & Rutten, 1998; Skidmore et al., 2000, 2002; Steeghs et al., 2007; Harrison, 2016) In contrast to the masses, there is not much disagreement concerning the binary inclination which cannot be small because the system exhibits eclipses and not very high because the eclipses are only grazing (Smak, 1993; Spruit & Rutten, 1998; Skidmore et al, 2002). The available data consist of light curves provided by R.E. Nather. They were already used by Patterson (1980) and Patterson et al. (1981). All data refer to quiescence. There are many more light curves in the AAVSO International Database. However, these do not have a suitable quality to be of use here.
V3885 Sgr: At an average magnitude of the novalike variable V3885 Sgr (= CD -42o 14462) is not only one of the brightest CVs in the sky, but it is also quite stable, exhibiting only slight variations since the first photometric observations in 1899 (Bond, 1978). The orbital period was measured by Hartley et al. (2005) and Ribeiro & Diaz (2007) with consistent results. Geometrical and dynamical system parameters were determined by Linnell et al. (2009) by modelling the ultraviolet and far ultraviolet spectral energy distribution. Their best model parameters are within the limits derived by Hartley et al. (2005). Flickering in V3885 Sgr, although remaining on a low level, has been observed for a long time, often together with short period oscillations (Warner, 1973; Hesser et al., 1974; Cowley et al., 1977b). It has been subjected to a thorough analysis by Ribeiro & Diaz (2007) who studied also the relationship between the continuum flickering and rapid variations in the H emission line. They found that the source of the line flickering may be associated with the secondary star and explain it as being due to disk flickering in the UV reprocessed on the illuminated face of the secondary. A cross-correlation study between the continuum and line flickering confirms a correlation between both. The data available for the current study consist of light curves provided by B. Warner, and multicolour light curves observed by Hollander et al. (1993) and the author.
V4140 Sgr: Discovered as a variable star by Hoffmeister (1963) V4140 Sgr (= NSV 12615) was identified as an eclipsing SU UMa type dwarf nova by Jablonski & Steiner (1987). The orbital period was originally measured by the latter authors and later discussed more thoroughly by Baptista et al. (1992) and Baptista et al. (2003). While the mean period identifies the system as being close to the lower CV period limit, it exhibits slight variations which may either be secular or periodic. Geometrical and dynamical system parameters have been determined by Borges & Baptista (2005). Several properties of the system are quite different from those of normal SU UMa stars. As pointed out by Borges & Baptista (2005), the normal outbursts, which occur in intervals of 80 – 90 days, have an amplitude of only about 1 mag, and the superoutbursts are 1 mag brighter. These are remarkably low values. Moreover, the disk temperature, both, in quiescence and in outburst, always remains lower than the critical temperature for outbursts to occur according to the disk instability model (Lasota, 2001). This is confirmed by Baptista et al. (2016) who also consider the quiescent disk to be in a high-viscosity steady state regime. Therefore Borges & Baptista (2005) and Baptista et al. (2016) conclude that the outbursts of V4140 Sgr are not due to a disk instability but instead are powered by bursts of enhanced mass transfer from the secondary star. The location of the flickering in V4140 Sgr was investigated by Baptista et al. (2016) via eclipse tomography. Their maps show flickering sources at an azimuthally extended stream-disk impact region and in the inner disk. Both are responsible for flickering on longer time scales (500 s). Instead, flickering on shorter time scales (which is dominant in optical light) has its origin in an extended disk region. Baptista et al. (2016) conclude that – if flickering is caused according to the MHD turbulence model of Geertsema & Achterberg (1992) – the quiescent viscosity parameter is as large as . All data used for the current study were either published by Baptista et al. (1989) or retrieved from the OPD data bank.
V893 Sco: Satyvoldiev (1972) identified this dwarf nova as a variable star, but it got lost thereafter. Only much later Kato et al. (1998) re-identified the system. Soon thereafter Bruch et al. (2000) discovered grazing eclipses which were also seen in X-rays by Mukai et al. (2009). The orbital period was first measured by Bruch et al. (2000) and later refined by Bruch (2014) who found a low amplitude cyclic variations which may be attributed to a light travelling effect due to the presence of a giant planet orbiting V893 Sco. Time resolved spectroscopic observations were published by Matsumoto et al. (2000) and Mason et al. (2001). The latter authors also derived component masses and the orbital inclination. The orbital period being below the CV period gap, V893 Sco is expected to be of SU UMa type. However, it took a long time to detect the defining properties of these stars, i.e., superoutbursts in addition to normal outbursts. To my knowledge, in spite of a dense coverage of the long term light curve since 1999, the first superoutburst was only observed in 2016 as reported by Kato et al. (2017). Apart from strong flickering V893 Sco exhibits QPOs (Warner et al., 2003) and possibly DNOs (Pretorius et al., 2006). Bruch (2014) also saw transient semi-periodic variations on time scales of several minutes which may be identified as QPOs. However, he pointed out the difficulty to draw a dividing line between QPOs and flickering. The bulk of the data used in this study are observations already used by Bruch et al. (2000) and Bruch (2014). They are complemented by light curves retrieved from the AAVSO International Database.
VY Scl is the prototype of a class of novalike variables, most of
them with orbital periods in the range of 3 – 4 h, which normally are
found in a high state but occasionally exhibit low states up to a couple
of magnitudes fainter than usual. VY Scl was discovered as a blue object
with large amplitude variations (i.e., high and low states) by
Luyten & Haro (1959).
In spite of its relatively high magnitude during the high state the system
has not been as extensively observed as may be expected considering its
status of prototype of a whole class. There is even some controversy
concerning basic parameters such as the orbital period. It was first
measured spectroscopically by Hutchings & Cowley (1984) at a value which is shorter
than the period advocated by Mart
ınez-Pais et al. (2000). Only recently, using
additional spectroscopic observations performed during a low state
Schmidtobreick et al. (2018) claim to have resolved this discrepancy,
finding a period which is compatible with the earlier data of
Hutchings & Cowley (1984).
Although Mart
ınez-Pais et al. (2000) and Schmidtobreick et al. (2018)
quote dynamical system parameters, the allowed masses encompass a large
range. Therefore I will assume them to be unknown. The orbital inclination
found by these authors is also uncertain, but it is definitely quite low.
The data available for the present study consist of light curves observed
by Hollander et al. (1993) in the Walraven system.
VZ Scl was discovered by Krzeminski (1966) as a deeply eclipsing novalike variable with the a period of 3.47 h. Although photometric and spectroscopic observations have thus a high potential to reveal many details about the properties and the structure of the system, surprisingly little work has been dedicated to the star. The photometric history as detailed by Sherrington et al. (1984). O’Donoghue et al. (1987) revealed low states in VZ Scl leading to its classification as a VY Scl star. No reliable mass determinations for the system components exist. As is evident from the deep eclipses the orbital inclination must be high (Sherrington et al., 1984; O’Donoghue et al., 1987). While no specific study of the flickering in VZ Scl has been performed before (except for the determination of wavelet parameters by Fritz & Bruch, 1998), O’Donoghue et al. (1987) mention that the source of the flickering appears to be centred on the white dwarf primary and is not associated with the bright spot. The observational data available for this study consists of light curves already published by O’Donoghue et al. (1987), complemented by light curves retrieved from the OPD data bank and AAVSO International Database.
LX Ser, also known as Stepanyan’s star, was first noticed by Stepanyan (1979). Is is a deeply eclipsing novalike variable. The orbital period has been steadily refined by many authors over the years and was last updated by Li et al. (2017). The long-term light curve shows a low state (Liller, 1980). The system may therefore be considered to be of VY Scl subtype (Leach et al., 1999). Dynamical and geometrical system parameters have been studied by Young et al. (1981a) and Marin et al. (2007). All light curves used in the present study were retrieved from the AAVSO International Database.
RW Sex (= BD -7o 3007) is one of the brightest novalike variables. Hesser et al. (1972) performed early photometric observations and found low amplitude flickering. Cowley et al. (1977a) were the first to suggest an orbital period (albeit with possible aliases) based on spectroscopy, which was then confirmed and improved by Bolick et al (1987) and Beuermann et al. (1992). While Bolick et al (1987) derive tentative component masses, Beuermann et al. (1992) argue that the uncertainty of the orbital inclination renders individual masses very uncertainty. Therefore, I only quote the mass ratio in Table C1. The data available for this study consist of light curves provided by R.E. Nather, and multicolour data sets observed by the author and his collaborators (see also Bruch, 1991b).
KK Tel: Discovered by Hoffmeister (1962) as a variable blue object and suspected by him to be a dwarf nova, KK Tel remains a little studied object. The dwarf nova classification was confirmed photometrically by Bateson (1982a, 1982b, 1984) and McIntosh (1989), and spectroscopically by Zwitter & Munari (1995). A photometric modulation of 2.02 h, interpreted as the orbital period, observed by Howell et al. (1991) during minimum, together with the large magnitude difference between minimum and maximum of 6.2 mag suggested a nature as SU UMa star. In fact, Kato et al. (2003) and Patterson et al. (2003) observed superhumps during a bright state. Their period is slightly longer that the photometric period reported by Howell et al. (1991), confirming the latter to be orbital in origin. Nothing is known about dynamical and geometrical system parameters. Only one light curve, observed during superoutburst and retrieved from the AAVSO International Database, is available for this study.
RW Tri is a deeply eclipsing novalike variable of the UX UMa type. The orbital period was determined by Robinson et al. (1991) and appears not to have been refined since then. Low amplitude ( mag) oscillations on time scales of some tens of days have been observed by Honeycutt et al. (1994, 2014), Honeycutt (2001) and even more clearly by Bruch (2020). Apart from this the system is relatively stable as is corroborated by the long term AAVSO light curve which shows the out-of-eclipse magnitude in general to be between 12.5 and 13 mag. However, there are exceptions. An isolated measurement in the AAVSO light curve on 2011, April 14 shows the system at 8.8 mag121212No observations are available in the interval of 7 days before and 10 days after this event.. Another bright state was seen in spectrophotometric observations performed by Still et al. (1995) in 1988, October, when RW Tri was 3.5 mag brighter than normal. Smak (2019) reports negative superhumps in his observations obtained in 1984 and possibly 1957. They were, however, not present in 2015 – 2016 (Bruch, 2020). Component masses have repeatedly been determined in the past, but with conflicting results (Kaitchuck et al., 1983; Shafter, 1983a; Rutten et al., 1992; Smak, 1995, 2019; Vande Putte et al., 2003; Poole et al., 2003; Mizusawa e al., 2010). Orbital inclinations between 67o and 80o are reported in the literature (Kaitchuck et al., 1983; Rutten et al., 1992; Smak, 1995, 2019; Mason et al., 1997). The contribution of the secondary star to the total system light is discussed in Appendix B. The data used here consist light curves provided by R.E. Nather, multicolour light curves observed by E. Robinson and the author, and numerous data sets retrieved from the AAVSO International Database.
EF Tuc (= EC 23593-6724) was discovered as a dwarf nova in the Edinburgh-Cape Blue Object Survey. The spectrum shown by Stobie et al. (1995) is dominated by strong hydrogen emission lines. Chen et al. (2001) investigated the spectrum in somewhat more detail and suspected EF Tuc to be of SU UMa type. A photometric study of the system was presented by Bruch (2017a) who – while not confirming the dwarf nova nature of the system – argues against the classification as an SU UMa star. Indeed, the average quiescent magnitude of roughly 14.5 mag as judged from the AAVSO long term light curve together with the distance and interstellar reddening as quoted in Table C1 leads to an absolute magnitude of 3.8 mag, way too bright for a quiescent SU UMa type star. Such a classification is also not possible if the orbital period of 3.6 hours quoted by the Ritter & Kolb (2003) is correct. This value is based on an informal communications by J. Patterson in 2003 and 2006131313http://cbastro.org/communications/news/messages/0350.html; http://cbastro.org/communications/news/messages/0487.html where it is considered a candidate period. It has never been confirmed and it is not seen in the data of Bruch (2017a). Therefore, I consider the orbital period of EF Tuc unknown. The same is true for dynamical and geometrical system parameter. As already mentioned by Chen et al. (2001) and confirmed by Bruch (2017a), EF Tuc exhibits strong flickering. Bruch (2017a) also provides some quantitative information on the flickering parameters which are re-investigated with more rigour here. The data used in the present study are all taken from Bruch (2017a), including the AAVSO data mentioned in that publication.
SU UMa is the prototype of a class of short period dwarf novae which apart from normal outburst exhibit from time to time so-called superoutbursts which last longer and are brighter at maximum than these. While the outburst properties have extensively been investigated (e.g., Szkody et al., 1984; Udalski, 1990; van Paradijs et al., 1994; Rosenzweig et al., 2000; Imada et al., 2013) much less is known about the struture of the binary system. Voikhanskaya & Nazarenko (1983) quote two possible values for the orbital period, one of which was later confirmed with higher precision by Thorstensen et al. (1986). The component masses remain unknown just as the orbital inclination. The latter is probably moderately low (Thorstensen et al., 1986). The data available for this study consist of light curves provided by R.E. Nather, complemented light curves retrieved from the AAVSO International Database. The data comprise all photometric states between quiescence and superoutburst.
SW UMa is a SU UMa type dwarf nova. While variations during outbursts have been extensively studied (e.g. Robinson et al., 1987; Kato et al., 1992; Semeniuk et al., 1997; Nogami et al., 1998; Pavlenko et al., 2000; Soejima et al., 2009) the basic dynamical and geometrical system parameters remain to a large degree unknown. In particular the component masses and the orbital inclination have not yet been determined. The orbital period was first measured spectroscopically by Shafter (1983d, 1985) and then slightly revised by Shafter et al. (1986). SW UMa has been suspected to be an intermediate polar because Shafter et al. (1986) saw a modulation with a period of 15.9 min in optical light during quiescence and in X-rays. However, these variations were never seen again and the intermediate polar nature remains unconfirmed. The data available for this study consist of light curves provided by R.E. Nather and are supplemented by data retrieved from the AAVSO International Database. All observations refer to superoutburst or to the early decline.
UX UMa is the prototype of novalike stars, in particular of those system which, in contrast to VY Scl star, have never been observed to go into a low state. It is an eclipsing system which in many aspects is similar to RW Tri (see above). As the prototype of its class and the brightest eclipsing novalike variable, UX UMa has been extensively studied in the past (see Neustroev et al., 2011, for a short summary of previous observations). The orbital period was last refined by Baptista et al. (1995). Dynamical and geometrical system parameters have been discussed by many authors (Baptista et al., 1995; Froning et al., 2003b; Smak, 1994; Vande Putte et al., 2003). In extensive photometric observations during the 2015 observing season de Miguel et al. (2016) found a modulation with a period of 3.680 d in the light curve of UX UMa which they interpret as being due to a retrograde precession of the accretion disk. An associated negative superhump at the beat period of the precession and the orbit is also seen. Bruch (2020) confirmed this behaviour but also noted that it was restricted to that particular season and did not repeat itself in previous or following years. Rapid oscillations with a period of 29 s and a low amplitude were first detected by Warner & Nather (1972) in optical observations, but were not seen by Froning et al. (2003b) in the far UV. Instead, the latter authors detected quite strong (flux variations of more than a factor of two within 5 minutes) flickering in this wavelength range. It is restricted to the continuum with no flickering in the emission lines. The optical flickering was studied by Bruch (2000) who concluded that at least its high frequency part occurs very close to the white dwarf, while the hot spot may also contribute. The contribution of the secondary star to the total light is discussed in Appendix B. Of all systems investigated in this study the number of light curves of UX UMa is the second largest (after TT Ari). The bulk of them were retrieved from the AAVSO International Database. To these data I add light curves provided by R.E. Nather and E. Robinson.
IX Vel: This novalike variable is the brightest CV in the sky. It may therefore be surprising that – when compared to other system – relatively few dedicated studies have been devoted to this star. Linnell et al. (2007) extensively review the previous literature about IX Vel. With 4.65 h (Beuermann & Thomas, 1990) it has a similar orbital period as other famous novalikes like UX UMa and TW Tri, but in contrast to these systems IX Vel is not eclipsing. Dynamical and geometrical system parameters have been determined by Beuermann & Thomas (1990), Linnell et al. (2007) and Hoard et al. (2014). Occasionally, IX Vel exhibits coherent oscillations with periods in the range 24 – 29 s and with amplitudes of 1 mmag (Warner et al., 1985). Flickering occurs on a rather low scale. A study of autocorrelations functions of its light curves make Williams & Hiltner (1984) suggest that two time scales exist in the flickering activity, namely 77 and 500 s. Most of the data used here were provided by B. Warner. Some the them were already used in the study of Warner et al. (1985). These data are supplemented by unpublished light curves observed by the author and data sets retrieved from the OPD data bank.
HV Vir belongs to the class of WZ Sge stars, i.e., short period dwarf novae which exhibit rare large amplitude superoutbursts, without interspersed normal outbursts (as seen in SU UMa type stars). The star was discovered as a variable by Schneller (1931) and for a long time thought to be a nova. Only when Schmeer (1992) detected a second outburst in 1992 and Della Valle et al. (1992) verfied that the spectrum was that of a dwarf nova in outburst instead of a (recurrent) nova, the classification was rectified. The faintness of HV Vir during quiescence (19.2 mag, Howell et al., 1992) explains the almost complete absence (mentioning the notable exception of Szkody et al., 2002) of detailed optical studies of the system in this phase. In contrast, the 1992 outburst was well observed (Ingram & Szkody, 1992; Barwig et al., 1992; Leibowitz et al., 1994; Kato et al., 2001). Another outburst in 2002 was covered by Ishioka et al. (2003). Details about the structure of the system are rare. The orbital period has never been measured directly. Assuming that early superhumps in WZ Sge stars occur with the same period, Kato et al. (2001), using data from various previous publications, suggested the orbital period to be 1.3700 h. Component masses and orbital inclination remain unknown. The data available for this study consist of light curves already included in the study of Leibowitz et al. (1994), complemented by light curves retrieved from the AAVSO International Database. All observations were taken during superoutburst.
CTCV J2056-3014: Little is known about this star. Agusteijn et al. (2010) observed the star as part of follow-up observations of CV candidates identified in the Calán-Tololo Survey (see Maza et al., 1989, and references therein). They measured a spectroscopic period of 1.757 h and suspect the system to be an intermediate polar, based upon apparently periodic variations of 15.4 min observed in one light curve. While the arguments which lead Agusteijn et al. (2010) to this classification were refuted by Bruch (2018), more recently Lopes de Oliveira et al. (2020) revived this notion because they found a coherent 29.6 s oscillation in X-ray observations and an X-ray spectrum compatible with that of the recently identified class of low luminosity IPs. A re-analysis of the data of Bruch (2018) revealed the presence of oscillation with the same period also in the optical. Associating it to the rotation of the white dwarf means that CTCV J2056-3014 harbours the white dwarf with the shortest securely known spin period. The data available for this study consist of the light curves already used by Bruch (2018).
EC 21178-5417: Unitil quite recently, not much was known about this CV. Identified as a blue object in the Edinburgh Cape survey (Stobie et al., 1997), it was first mentioned as a cataclysmic variable by Warner et al. (2003) who found it to be an eclipsing novalike system. Time resolved photometry was published by Bruch (2017b) who measured the orbital period. It was refined by Khangale et al. (2020) who published a spectroscopic analysis of the system. Component masses remain unknown. The orbital inclination must be high in view of the deep eclipses in the light curves. This is confirmed by Khangale et al. (2020) who estimate . The data available for this study consist of light curves already presented by Bruch (2017b).
LS IV –08o 3 was originally classified as an OB star Nassau & Stephenson (1963). At mag (Høg et al., 2000) it is a fairly bright star. The first detailed investigation of the star was performed by Stark et al. (2008), who also give an overview of the history of our knowledge about this object. They performed a detailed spectroscopic study, found LS IV –08o 3 to be a binary, and measured the orbital period. The characteristics of the system suggested a reclassification as a nova-like variable of the UX UMa subtype. Stark et al. (2008) also present some time resolved photometry which reveals low scale (a few hundredths of a magnitude) apparently stochastic variations superposed on slight orbital variations. These findings were confirmed and enhanced by Bruch & Diaz (2017). They improved the precision of the orbital period. Component masses and orbital inclination of LS IV –08o 3 remain unknown. The observational data used here are the light curves already discussed by Bruch & Diaz (2017), supplemented by light curves retrieved from the AAVSO International Database.
References
- Agrawal et al. (1983) Agrawal P.C., Riegler G.R., Rao A.R., 1983, Nature, 301, 318
- Ak et al. (2005) Ak T., Retter A., Liu A., 2005, New Astr., 11, 147
- Alcock (1967) Alcock G.E.D., 1967, IAU Circ. 2022
- Andronov et al (2008) Andronov I.L., Chinarova L.L., Han W., Kim Y. Yoon J.-N., 2008, A&A, 486, 855
- Aranzana et al. (2018) Aranzana E., Scaringi S., Körding E., Dhillon V.S., & Coppejans D.L., 2018, MNRAS, 481, 2140
- Araujo-Betancon et al. (2005) Araujo-Betancor S., Gänsicke B.T., Hagen H.-J. et al., 2005 A&A, 430, 629
- Arenas et al. (2000) Arenas J., Catalán M.S., Augusteijn T., Retter A., 2000, MNRAS, 311, 135
- Armstrong et al. (2013) Armstrong E., Patterson J., Michelsen E. et al., 2013, MNRAS, 435, 707
- Augusteijn (1994) Augusteijn T., 1994, A&A, 292, 481
- Agusteijn et al. (2010) Augusteijn T., Tappert C., Dall T., Maza J., 2010, MNRAS, 405, 621
- Barnard (1921) Barnard E.E., 1921, MNRAS, 81, 167
- Bailer-Jones et al. (2018) Bailer-Jones C.A.L., Rybizki J., Fouesneau M., Mantelet G., Andrae R., 2018, AJ, 156, 58
- Bailey (1979) Bailey J., 1979, MNRAS, 188, 681
- Bailey et al. (1983) Bailey J., Axon D.J., Hough J. et al., 1983, MNRAS, 205, 1p
- Balman et al. (1995) Balman Ş., Orio M., Ögelman H., 1995, ApJ, 449, L47
- Baptista et al. (2003) Baptista R., Borges B.W., Bond H.E. et al., 2003, MNRAS, 345, 889
- Baptista et al. (2016) Baptista R., Borges B.W., Oliveira A.S., 2016, MNRAS, 463, 3799
- Baptista & Bortoletto (2004) Baptista R., Bortoletto A., 2004, AJ, 128, 411
- Baptista & Bortoletto (2008) Baptista R., Bortoletto A., 2008, ApJ, 676, 1240
- Baptista et al. (2002) Baptista R., Bortoletto A., Harlaftis E.T., 2002, MNRAS, 335, 665
- Baptista et al. (1998) Baptista R., Catalán M.S., Horne K., Zilli D., 1998, MNRAS, 300, 233
- Baptista et al. (1995) Baptista R., Horne K., Hilditch R.W., Mason K.O., Drew J.E., 1995, ApJ, 448, 393
- Baptista et al. (1989) Baptista R., Jablonski F.J., Steiner J.E., 1989, MNRAS, 241, 631
- Baptista et al. (1992) Baptista R., Jablonski F.J., Steiner J.E., 1992, AJ, 104, 1557
- Baptista et al. (1996) Baptista R., Patterson J., O’Donoghue D. et al., 1996, IAU Circ., 6327
- Baptista et al. (2000) Baptista R., Silveira C., Steiner J.E., Horne K., 2000, MNRAS, 314, 713
- Baptista et al. (1994) Baptista R., Steiner J.E., Cieslinski D., 1994, ApJ, 433, 332
- Barrera & Vogt (1989a) Barrera L.H., Vogt N., 1989a, A&A, 220, 99
- Barrera & Vogt (1989b) Barrera L.H., Vogt N., 1989b, Rev. Mex. A&A, 19, 99
- Barrett et al. (1988) Barrett P., O’Donoghue D., Warner B., 1988, MNRAS, 273, 759
- Barwig et al. (1982) Barwig H., Hunger K., Kudritzki R.P., Vogt N., 1982, A&A, 114, L11
- Barwig et al. (1992) Barwig H., Mantel K.H., Ritter H., 1992, A&A, 266, L5
- Bateson (1974) Bateson F.M., 1974, Publ. V.S.S. Roy. Astron. Soc. New Zealand, 2, 1
- Bateson (1978) Bateson F.M., 1978, Publ. V.S.S. Roy. Astron. Soc. New Zealand, 6, 1
- Bateson (1979) Bateson F.M., 1979b, Publ. V.S.S. Roy. Astron. Soc. New Zealand, 7, 29
- Bateson (1982a, 1982b, 1984) Bateson F.M., 1982a, Publ. V.S.S. Roy. Astron. Soc. New Zealand, 10, 12
- Bateson (1982b) Bateson F.M., 1982b, Publ. V.S.S. Roy. Astron. Soc. New Zealand, 10, 24
- Bateson (1984) Bateson F.M., 1984, Publ. V.S.S. Roy. Astron. Soc. New Zealand, 12, 45
- Bateson & McIntosh (1986) Bateson F.M., McIntosh R., 1986, Publ. V.S.S. Roy. Aston. Soc. New Zealand, 14, 1
- Bateson et al. (1990) Bateson F.M., McIntosh R., Brunt D., 1990, Publ. V.S.S. Roy. Aston. Soc. New Zealand, 17, 29
- Bearmore & Osborne (1977) Beardmore A.P., Osborne J.P., 1997, MNRAS, 290, 145
- Beekman et al. (2000) Beekman G., Somers M., Naylor T., Hellier C., 2000, MNRAS, 318, 9
- Belczynski & Mikolajewska (1998) Belczynski K., Mikolajewska J., 1998, MNRAS, 296, 77
- Beljawsky (1926) Beljawsky P.R., 1926, Beobachtungs-Zirkular der Astron. Nachr., 6, 38
- Belova et al. (2013) Belova A.I., Suleimanov V.F., Bikmaev I.F. et al., 2013, Astron. Lett., 39, 111
- Beuermann & Schope (1989) Beuermann K., Schwope A.D., 1989, A&A, 223, 179
- Beuermann et al. (1992) Beuermann K., Stasiewski U., Schwope A.D., 1992, A&A, 256, 433
- Beuermann & Thomas (1990) Beuermann K., Thomas H.-C., 1990, A&A, 230, 326
- Bianchini (1980) Bianchini A., 1980, MNRAS, 192, 127
- Bianchini & Middleditch (1976) Bianchini A., Middleditch J., 1976, IBVS, 1151,
- Bianchini & Sabbadin (1983) Bianchini A., Sabbadin F., 1983, A&A Suppl., 54, 393
- Bianchini et al. (2012) Bianchini A., Saygac T., Orio M., della Valle M., Williams R., 2012 A&A, 539, A94
- Biryukov & Borisov (1990) Biryukov W., Borisov G.V., 1990, Perem. Szvesdy 1544, 1
- Bisol et al. (2012) Bisol A.C., Godon P., Sion E.M., 2012, PASP, 124, 158
- Bitner et al. (2007) Bitner M.A., Robinson E.L., Behr B.B., 2007, ApJ, 662, 564
- Blackman (2010) Blackman C., 2010, ApJ Suppl., 191, 185
- Bloemen et al. (2010) Bloemen S., Marsh T.R., Steeghs D., Ostensen R.H., 2010, MNRAS, 407, 1903
- Bolick et al (1987) Bolick K., Beuermann K., Bruch A., Lenzen R., 1987, Ap&SS, 130, 175
- Bond (1978) Bond H.E., 1978, PASP, 90, 216
- Bond et al. (1987) Bond H.E., Grauer A.D., Burstein D., Marzke R.O., 1987, PASP, 99, 1097
- Borges & Baptista (2005) Borges B.W., Baptista R., 2005, A&A, 437, 235
- Borisov (1992) Borisov G.V., 1992, A&A, 261, 154
- Brainerd & Lamb (1985) Brainerd J.J., Lamb D.Q. 1985, in Lamb D.Q., Patterson J., eds, Proc. 7th North American Workshop on Cataclysmic Variables and Low Mass X-ray Binaries, Reidel, Dordrecht, p. 247
- Brandi et al. (2009) Brandi E., Quiroga C., Mikolajewska J., Ferrer O.E., García L.G., 2009, A&A, 497, 815
- Bruch (1982a) Bruch A., 1982a, Kataklysmische Veränderliche in Beobachtung, Statistik und Analyse, Ph.D. thesis, Münster
- Bruch (1982b) Bruch A., 1982b, PASP, 94, 916
- Bruch (1986) Bruch A., 1986, A&A, 167, 91
- Bruch (1987) Bruch A., 1987, A&A, 172, 187
- Bruch (1989) Bruch A., 1989, A&AS, 78, 145
- Bruch (1991a) Bruch A., 1991a, Acta Astron., 41, 101
- Bruch (1991b) Bruch A., 1991b, IBVS, 3567
- Bruch (1992) Bruch A., 1992, A&A, 266, 237
- Bruch (1996) Bruch A., 1996, A&A, 312, 97
- Bruch (2000) Bruch A., 2000, A&A, 359, 998
- Bruch (2003) Bruch A., 2003, A&A, 409, 647
- Bruch (2014) Bruch A., 2014, A&A, 566, A101
- Bruch (2015) Bruch A., 2015, A&A, 579, A50
- Bruch (2016) Bruch A., 2016, New Astr., 46, 60
- Bruch (2017a) Bruch A., 2017a, New Astr., 52, 117
- Bruch (2017b) Bruch A., 2017b, New Astr., 56, 69
- Bruch (2017c) Bruch A., 2017c, New Astr., 57, 51
- Bruch (2018) Bruch A., 2018, New Astr., 58, 53
- Bruch (2019a) Bruch A., 2019a, IBVS, 6257
- Bruch (2019b) Bruch A., 2019b, MNRAS, 489, 2961
- Bruch (2020) Bruch A., 2020, New Astr., 78, 101369
- Bruch et al. (1986) Bruch A., Beele D., Baptista R., 1996, A&A, 306, 151
- Bruch & Cook (2018) Bruch A., Cook L.M., 2018, New Astr., 63,1
- Bruch & Diaz (2017) Bruch A., Diaz M.P., 2017, New Astr., 50, 109
- Bruch et al. (1981) Bruch A., Duerbeck H.W., Seitter W.C., 1981, Mitt. Astron. Ges., 52, 34
- Bruch & Engel (1994) Bruch A., Engel A., 1994, A&AS, 104, 79
- Bruch & Schimpke (1992) Bruch A., Schimpke T., 1992, A&AS, 93, 419
- Bruch et al. (2000) Bruch A., Steiner J.E., Gneiding C.D., 2000, PASP, 112, 327
- Bruch et al. (1997) Bruch A., Vrielmann S., Hessman F.V., Kochsiek A., Schimpke T., 1997, A&A, 237, 1107
- Buckley et al. (2000) Buckley D.A.H., Cropper M., van der Heyden K., Potter S.B., Wickramasinghe D.T., 2000, MNRAS, 318, 187
- Buckley et al. (1992) Buckley D.A.H., O’Donoghue D., Kilkenny D., Stobie S.R., & Remillard R.A., 1992, MNRAS, 258,285
- Bullock et al. (2011) Bullock E., Szkody P., Mukadam A.S. et al., 2011, AJ, 141, 84
- Capitano et al. (2017) Capitano L, Lallement R., Vergely J.L., Elyajouri M., Monreal-Ibero A., 2017, A&A, 606, A65
- Casares et al. (1996) Casares J., Martínez-Pais I.G., Marsh T.R., Charles P.A., Lazaro C., 1996, MNRAS, 278, 219
- Casares et al. (2009) Casares J., Martínez-Pais I.G., Rodríguez-Gil P., 2009 MNRAS, 399, 1534
- Cassatella et al. (1985) Cassatella A., Hassall B.J.M., Harris A., Snijders M.A.J., 1985, in Burke W.R., ed., Recent results on cataclysmic variables, ESA SP-236, p. 281
- Cassatella et al. (1982) Cassatella A., Patriarchi A., Selvelli P. et al., 1982, in Rolfe E., Heck A., Battrick B., eds, Third European IUE Conference, ESA SP-176, p. 229
- Charles et al. (1979) Charles P.A., Thostensen J., Bowyers S., Middledich J., 1979, ApJ, 231, L131
- Chen et al. (2001) Chen A., O’Donoghue D., Stobie R.S., Kilkenny D., Warner B., 2001, MNRAS, 385, 89
- Chote & Sullivan (2016) Chote P., Sullivan D.J., 2016, MNRAS, 458, 1393
- Cieslinski & Steiner (1997) Cieslinski D., Steiner J.E., 1997, MNRAS, 291, 321
- Cieslinski et al. (1998) Cieslinski D., Steiner J.E., Jablonski F., 1998, A&AS, 131, 119
- Cook (1985) Cook M.C., 1985, MNRAS, 215, 211
- Copperwheat et al. (2009) Copperwheat C.M., Marsh T.R., Dhillon V.S. et al., 2009, MNRAS, 393, 157
- Copperwheat et al. (2010) Copperwheat C.M., Marsh T.R., Dhillon V.S. et al., 2010, MNRAS 402, 1824
- Costa & Rodrigues (2009) Costa J.E.R., Rodrigues C.V., 2009, MNRAS, 398, 240
- Cowley et al. (1977a) Cowley A.P., Crampton D., Hesser J.E., 1977a, PASP, 89, 716
- Cowley et al. (1977b) Cowley A.P., Crampton D., Hesser J.E., 1977b, ApJ, 214, 471
- Cowley et al. (1982) Cowley A.P., Crampton D., Hutchings J.B., 1982, ApJ, 259, 730
- Cowley et al. (1975) Cowley A.P., Crampton D., Hutchings J.B., Marlborough J.M., 1975, ApJ, 195, 413
- Cropper (1987) Cropper M., 1987, MNRAS, 228, 389
- Cropper (1988) Cropper M., 1988, MNRAS, 231, 508
- Cropper (1989) Cropper M., 1989, MNRAS, 236, 935
- Cropper et al. (1986) Cropper M., Menzies J.W., Tapia S., 1986, MNRAS, 218, 201
- Cropper et al. (1998) Cropper M., Ramsay G., Wu K., 1998, MNRAS, 293, 222
- Dahlmark (1999) Dahlmark L., 1999, IBVS, 4734
- Dai & Qian (2009) Dai Z.B., Qian S.B., 2009, A&A, 503, 883
- Dai & Qian (2010a) Dai Z.B., Qian S.B., 2010a, New Astron., 15, 380
- Dai & Qian (2010b) Dai Z.B., Qian S.B., 2010b, PASJ, 62, 965
- Dai et al. (2009a) Dai Z.B., Qian S.B., Fernández-Lajús E., 2009a, ApJ, 703, 109
- Dai et al. (2010) Dai Z.B., Qian S.B., Fernández-Lajus E., Baume G.L., 2010, MNRAS, 409, 1195
- Dai et al. (2013) Dai Z.B., Qian S.B., Li L., 2013, ApJ, 774, 153
- Davey & Smith (1996) Davey S., Smith R.C., 1996, MNRAS, 280, 481
- Della Valle & Rosino (1987) Della Valle M., Rosino L., 1987, IBVS, 2995
- Della Valle et al. (1992) Della Valle M., Duerbeck H.W., Motch C., 1992, IAU Circ., No. 5503
- de Miguel et al. (2016) de Miguel E., Patterson J., Cejudo E. et al., 2016, MNRAS, 457, 1447
- d’Esterre (1912) d’Esterre C.R., 1912, Astron. Nachr., 192, 131
- Dhillon et al. (1991) Dhillon V.S., Marsh T.R., Jones D.H.P., 1991, MNRAS, 252, 342
- Diaz (2001) Diaz M.P., 2001, ApJ, 553, L177
- Diaz & Ribeiro (2003) Diaz M.P., Ribeiro F.M.A., 2003, AJ, 125, 3359
- Diaz & Steiner (1991a) Diaz M.P., Steiner J.E., 1991a, AJ, 102, 1417
- Diaz & Steiner (1991b) Diaz M.P., Steiner J.E., 1991b, PASP, 103, 964
- Diaz & Steiner (1995) Diaz M.P., Steiner J.E., 1995, AJ, 110, 1816
- Dobrotka et al. (2010) Dobrotka A., Hric L., Casares J. et al., 2010, MNRAS, 402, 2567
- Dobrotka et al. (2012) Dobrotka A., Mineshige S., Casares J., 2012, MNRAS, 420, 2467
- Dobrotka et al (2015) Dobrotka A., Mineshige S., Ness J.-U., 2015, MNRAS, 447, 3162
- Dobrotka et al. (2017) Dobrotka A., Ness J.-U., Mineshige S., Nucita A.A., 2017, MNRAS, 468, 1183
- Dobrzycka et al. (1996) Dobrzycka D., Kenyon S.J., Milone A.A.E., 1996, AJ, 111,414
- Downes (1982) Downes R.A., 1982, PASP, 94, 590
- Downes (1990) Downes R.A., 1990, AJ, 99, 339
- Downes et al. (1986) Downes R.A., Szkody P., Jenner D.C., Margon B., 1986, ApJ, 301, 240
- Downes et al. (2001) Downes R.A., Webbink R.F., Shara M.M. et al., 2001, PASP, 113, 764
- Drechsel et al. (1983) Drechsel H., Rahe J., Seward F.D., Wargau W., 1983, A&A, 126, 357
- Drew et al. (2003) Drew J.E., Hartley L.E., Long K.S., van der Walt J., 2003, MNRAS, 338, 401
- Drew et al. (1993) Drew J.E., Jones D.H.P., Woods J.A., 1993, MNRAS, 260, 803
- Duerbeck (1980) Duerbeck H.W., 1980, Habilitation thesis, Univ. Bonn
- Duerbeck (1981) Duerbeck H.W., 1981, PASP, 93, 165
- Duerbeck et al. (1987) Duerbeck H.W., Seitter W.C., Duemmler R., 1987, MNRAS, 229, 653
- Dulcin-Hacyan et al. (1980) Dulcin-Hacyan D., Andrillat Y., Audouze J. et al., 1980, in Battrick B., Mort J., eds, Second European IUE Conference, ESA SP-156, p. 87
- Eason & Warden (1983) Eason E.L.E. Warden S.P., 1983, PASP, 95, 58
- Echevarría & Alvarez (1993) Echevarría J., Alvarez M., 1993, 275, 187
- Echevarría et al. (2002) Echevarría J., Costero R., Tovmassian G. et al., 2002, Rev. Mex. A&A Conf. Ser., 12,86
- Echevarría et al. (1999) Echevarría J., Pineda L., Costero R., 1999, Rev. Mex. A&A, 35, 135
- Echevarría et al. (2016) Echevarría J., Ramírez-Torres A., Michel R., Hernández Santisteban J.V., 2016, MNRAS, 461, 1576
- Eggen et al. (1968) Eggen O.J., Freeman K.C., Sandage A., 1968, ApJ, 154, L27
- Elsworth & James (1986) Elsworth Y., James J.F., 1986, MNRAS, 220, 895
- Evans et al. (2009) Evans P.A., Beardmore A.P., Osborne J.P., Wynn G.A., 2009, MNRAS, 399, 1167
- Feinswog et al. (1988) Feinswog L., Szkody P., Garnavich P., 1988, AP 96, 1702
- Feline et al. (2005) Feline W.J., Dhillon V.S., Marsh T.R., Watson C.A., & Littlefair S.P., 2005, MNRAS, 364, 1158
- Ferguson et al. (1984) Ferguson D.H., Green R.F., Liebert J., 1984, ApJ, 287, 320
- Ferland et al. (1982) Ferland G.J., Lambert D.L., McCall M.L., Shields G.A., Slovak M.H., 1982, ApJ, 260, 794
- Ferrario et al. (1992) Ferrario L., Wickramasinghe D.T., Bailey J., Hough J.H., Tuohy I.R., 1992, MNRAS, 256, 252
- Friend et al. (1990) Friend M.T., Martin J.S., Smith R.C., Jones D.H.P., 1990, MNRAS, 246, 654
- Fritz & Bruch (1998) Fritz T., Bruch A., 1998, A&A, 332, 586
- Froning et al. (2003a) Froning C.S., Long K.S., Baptista R., 2003a, AJ, 126, 964
- Froning et al. (2003b) Froning C.S., Long K.S., Knigge C., 2003b, ApJ, 584, 433
- Fu et al. (2004) Fu H., Li Y.-Y., Leung K.-C. et al., 2004, Chin. J. A&A, 4, 88
- Fuentes-Morales et al. (2018) Fuentes-Morales I., Vogt N., Tappert C. et al., 2018, MNRAS, 474, 2494
- Gänsicke (2007) Gänsicke B.T., 2007, in Napiwotzki R., Burleigh M.R., eds, 15th European Workshop on White Dwarfs, ASP Conf. Ser., 372, p. 597
- Gänsicke et al. (1998) Gänsicke B.T., Hoard D.W., Beuermann K., Sion E.M., Szkody P., 1998, A&A, 338, 933
- Gänsicke et al. (2009) Gänsicke B.T., Dhillon M., Southworth J. et al., 2009, MNRAS, 397, 2170
- Gallagher & Holm (1974) Gallagher J.S., Holm A.V., 1974, ApJ, 189, L123
- Garnavich & Szkody (1988) Garnavich P., Szkody P., 1988, PASP, 100, 1522
- Garrison et al. (1984) Garrison R.F., Schild R.E., Hiltner W.A., Krzeminski W., 1984, ApJ, 276, L13
- Geertsema & Achterberg (1992) Geertsema G.T., Achterberg A., 1992, A&A, 255, 427
- Georgiev et al. (2019, 2020a, 2020b) Georgiev T., Zamanov R.K., Boeva S. et al., 2019, Bulg. Astron. J., 30, 1
- Georgiev et al. (2020a) Georgiev T., Zamanov R.K., Boeva S. et al., 2020a, Bulg. Astron. J., 32, 1
- Georgieve et al. (2020b) Georgiev T., Zamanov R.K., Boeva S. et al., 2020b, Bulg. Astron. J., 33, 1
- Gerke et al. (2006) Gerke J.R., Howell S.B., Walter F.M., 2006, PASP, 118, 678
- Gill & O’Brien (2000) Gill C.D., O’Brien T.J., 2000, MNRAS,314,175
- Gilliland (1982a) Gilliland R.L., 1982a, ApJ, 254, 653
- Gilliland (1982b) Gilliland R.L., 1982b, ApJ, 263, 302
- Gilliland et al. (1986) Gilliland R.L., Kemper E., Suntzeff N., 1986, ApJ, 301, 252
- Gilliland & Phillips (1982) Gilliland R.L., Phillips M.M., 1982, ApJ, 261, 617
- Giovannelli et al. (1983) Giovannelli F., Gaudenzi S., Rossi C., Piccioni A., 1983, Acta Astron., 33, 319
- Giovannelli & Saubau-Graziati (2012) Giovannelli F. Sabau-Graziati L., 2012, Mem. S.A.I., 83, 698
- Glasby (1970) Glasby J.S., 1970, The dwarf novae, Constable & Co., London
- Godon et al. (2007) Godon P., Sion E.M., Barrett P., Szkody P., 2007, ApJ, 656, 1092
- Godon et al. (2014) Godon P., Sion E.M., Starrfield S. et al., 2014, ApJ, 784, L33
- Godon et al. (2018) Godon P., Sion E.M., Williams R.E., Starrfield S., 2018, ApJ, 860, 89
- Gonzales & Maza (1983) Gonzales L.E., Maza J., 1983, IAU Circ. No. 3854
- Goranskij et al. (1985) Goranskij V.P., Shugarov S.Yu., Orlowsky E.I., Rahimov V.Yu., 1985, IBVS, 2653
- Grauer & Bond (1981) Grauer A.D., Bond H.E., 1981, PASP, 93, 388
- Greeley et al. (1999) Greeley B.W., Blair W.P., Long K.S., Raymond J.C., 1999, ApJ, 513, 491
- Green et al. (1982) Green R.F., Ferguson D.H., Liebert J., Schmidt M., 1982, PASP, 94, 560
- Green et al. (1986) Green R.F., Schmidt M., Liebert J., 1986, ApJS, 61, 305
- Greenhill et al. (2006) Greenhill J.G., Hill K.M., Dieters S. et al., 2006, MNRAS, 372, 1129
- Greiner (1998) Greiner J., 1998, A&A, 336, 626
- Greiner et al. (2010) Greiner J., Schwarz R., Tappert C. et al., 2010, Astron. Nachr., 331, 227
- Greiner et al. (1999) Greiner J., Tovmassian G.H., Di Stefano R. et al., 1999, A&A, 343, 183
- Groot et al. (1998) Groot P.J., Augusteijn T., Barziv O., van Paradijs J., 1998, A&A 340, L31
- Hachisu & Kato (2018) Hachisu I., Kato M., 2018, ApJS, 237, 4
- Hachisu et al. (2006, 2007) Hachisu I., Kato M., Kiyota S. et al., 2006, ApJ, 651, L141
- Hachisu et al. (2007) Hachisu I., Kato M., Luna G.J.M., 2007, ApJ, 659, L153
- Haefner (1981) Haefner R., 1981, IBVS, 2045
- Haefner & Betzenbichler (1991) Haefner R., Betzenbichler W., 1991, IBVS, 3665
- Haefner & Metz (1985) Haefner R., Metz K., 1985, A&A, 145, 311
- Haefner & Schoembs (1987) Haefner R., Schoembs R., 1987, MNRAS, 224, 231
- Hagen et al. (1995) Hagen H.J., Groote D., Engels D., Reimers D., 1995, A&AS, 111, 195
- Hameury & Lasota (2017) Hameury J.-M., Lasota J.-P., 2017, A&A, 602, A102
- Hamuy & Maza (1986) Hamuy M., Maza J., 1986, IBVS, 2867
- Harlaftis et al. (1992) Harlaftis E.T., Hassall B.J.M., Naylor T., Charles P.A., & Sonneborn G., 1992, MNRAS, 257, 607
- Harrison (2016) Harrison T.E., 2016, ApJ, 816, 4
- Harrison et al. (2009) Harrison T.E., Bornak J., Howell S.B. et al., 2009, AJ, 137, 4061
- Harrison et al. (2004) Harrison T.E., Johnson J.J., McArthur B.E. et al., 2004, AJ, 127, 460
- Hartley et al. (2005) Hartley L.E., Murray J.R., Drew J.E., Long K.S., 2005, MNRAS, 363, 285
- Hassall (1985) Hassall B.J.M., 1985, in Lamb D.Q., Patterson J., eds, Cataclysmic Variables and Low Mass X-ray Binaries, Reidel, Dordrecht, p. 287
- Haswell et al. (1997) Haswell C.A., Patterson J., Thorstensen J.R., Hellier C., Skillman D.R., 1997, ApJ, 476, 847
- Hellier (1993) Hellier C., 1993, MNRAS, 264, 132
- Hellier (1996) Hellier C., 1996, ApJ, 471, 949
- Hellier & Buckley (1993) Hellier C., Buckley D.A.H., 1993, MNRAS, 265, 766
- Hellier et al. (2000) Hellier C., Kemp J., Naylor T. et al., 2000, MNRAS, 313, 703
- Hellier et al. (1991) Hellier C., Mason K.O., Mittaz J.P.D., 1991, MNRAS, 248, 5p
- Hesser et al. (1972) Hesser J.E., Lasker B.M., Osmer P.S., 1972, ApJ, 176, L31
- Hesser et al. (1974) Hesser J.E., Lasker B.M., Osmer P.S., 1974, ApJ, 189, 315
- Hessman (1988) Hessman F.V., 1988, A&AS, 72, 512
- Hessman et al. (1984) Hessman F.V., Robinson E.L., Nather R.E., Zhang E.-H., 1984, ApJ, 286, 747
- Hill et al. (2017) Hill C.A., Smith R.C., Hebb L., Skzody P., 2017, MNRAS 472, 2937
- Hind (1948a, 1948b) Hind J.R., 1848a, Astron. Nachr., 27, 191
- Hind (1948b) Hind J.R., 1848b, MNRAS, 8, 146
- Hind (1856) Hind J.R., 1856, MNRAS 16, 56
- Hoard et al. (1997) Hoard D.W., Baptista R., Eracleous M. et al., 1997, MNRAS, 288, 691
- Hoard et al. (2014) Hoard D.W., Long K.S., Howell S.B. et al., 2014, ApJ, 786, 68
- Hoard et al. (1998) Hoard D.W., Still M.D., Szkody P., Smith R.C., Buckley D.A.H., 1998, MNRAS 294, 687
- Hoard et al. (2000) Hoard D.W., Szkody P., Honeycutt R.K. et al., 2000, PASP, 112, 1595
- Hoffmeister (1928) Hoffmeister C., 1928, Astron. Nachr., 234, 33
- Hoffmeister (1929) Hoffmeister C., 1929, Mitt. Sternw. Sonneberg, N16
- Hoffmeister (1943) Hoffmeister C., 1943, AN, 274, 36
- Hoffmeister (1949) Hoffmeister C., 1949, Astr. Abh., 12, No. 1
- Hoffmeister (1962) Hoffmeister C., 1962, VSS, 6, no.1
- Hoffmeister (1963) Hoffmeister C., 1963, Veröff. Sternw. Sonneberg, Vol. 6, Nr. 1
- Høg et al. (2000) Høg E., Fabricius C., Makarov V.V. et al., 2000, A&A, 355, L27
- Hollander et al. (1993) Hollander A., Kraakman H., van Paradijs J., 1993, A&AS, 101, 87
- Homer et al. (2004) Homer L., Szkody P., Raymond J.C. et al., 2004, ApJ, 610, 991
- Honeycutt (2001) Honeycutt R.K., 2001, PASP, 113, 473
- Honeycutt & Kafka (2004) Honeycutt R.K., Kafka S., 2004, AJ, 128, 1279
- Honeycutt & Robertson (1998) Honeycutt R.K., Robertson J.W., 1998, AJ, 116, 1961
- Honeycutt et al. (1998) Honeycutt R.K., Robertson J.W., Turner G.W., 1998, AJ, 115, 2527
- Honeycutt et al. (1994, 2014) Honeycutt R.K., Robertson J.W., Turner G.W., Vesper D.N., 1994, in Shafter A.W., ed., ASP Conf. Ser. 56, Interacting Binary Stars, p. 277
- Honeycutt & Schlegel (1985) Honeycutt R.K., Schlegel E.M., 1985, PASP, 97, 1189
- Honeycutt et al. (2014) Honeycutt R.K., Shears S., Kafka S., Robertson J.W., Henden A.A., 2014, AJ, 147, 105
- Horne et al. (1982) Horne K., Lanning H.H., Gomer K., 1982, ApJ, 252, 681
- Horne et al. (1986) Horne K., Wade R. A., Szkody P., 1986, MNRAS, 219, 791
- Horne et al. (1993) Horne K., Welsh W.F., Wade R.A., 1993, ApJ, 410, 307
- Horne et al. (1991) Horne K., Wood J.H., Stiening R.F., 1991, ApJ 378, 271
- Howell et al. (2006) Howell S.B., Harrison T.E., Campbell R.K., Córdova F.A., Szkody P., 2006, AJ, 131, 2216
- Howell et al. (1991) Howell S.B., Szkody P., Kreidl T.J., Dobrzycka D., 1991, PASP, 103, 300,
- Howell et al. (1992) Howell S.B., Wagner R.M., Bertram R., Szkody P., 1992, IAU Circ., No. 5505
- Hric et al. (1998) Hric L., Petrik K., Urban Z., Niarchos P., Anupama G.C., 1998, A&A, 329, 449
- Hudec et al. (2005) Hudec R., Šimon V., Skalický J., 2005, ASPC, 330, 405
- Hunger et al. (1985) Hunger K., Heber U., Koester D., 1985, A&A, 149, L6
- Hutchings et al. (1981) Hutchings J.B., Crampton D., Cowley A.P., Thorstensen J., & Charles P.A., 1981, ApJ, 249, 680
- Hutchings et al. (1983) Hutchings J.B., Link R., Crampton D., 1983, PASP, 95, 265
- Hutchings & Cowley (1984) Hutchings J.B., Cowley A.P., 1984, PASP, 96, 559
- Hutchings et al. (1985) Hutchings J.B., Cowley A.P., Crampton D., 1985, PASP, 97, 423
- Ianna (1964) Ianna P.A., 1964, ApJ, 139, 780
- Itagai (2009) Itagaki K., 2009, CBET, 2050, 1
- Ilkiewics et al. (2016) Ilkiewics K., Mikolajewska J., Stoyanov K., Manousakis A., & Miszalski B., 2016, MNRAS, 462, 2695
- Imada et al. (2013) Imada A., Izumiura H., Kuroda D. et al., 2013, PASJ, 65, 87
- Imamura et al. (2000) Imamura J.N., Steiman-Cameron T.Y., Wolff M.T., 2000, PASP, 112, 18
- Ingram & Szkody (1992) Ingram D., Szkody P., 1992, IBVS 3810
- Ishioka et al. (2003) Ishioka R., Kato T., Uemura M. et al., 2003, PASJ, 55, 683
- Jablonski & Steiner (1987) Jablonski F.J., Steiner J.E., 1987, ApJ, 313, 376
- Jensen et al. (1982) Jensen K.A., Nousek J.A., Nugent J.J., 1982, ApJ, 261, 625
- Johnson et al. (2014) Johnson C.B., Schaefer B.E., Kroll P., Henden A.A., 2014, ApJ, 780, L25
- Jurdana-Šepić et al. (2012) Jurdana-Šepić R., Ribeiro V.R.A.M., Darnley M.J., Munari U., Bode M.F., 2012, A&A, 537, A34
- Kafka et al. (2008) Kafka S., Anderson R., Honeycutt R.K., 2008, AJ, 135, 1649
- Kafka & Honeycutt (2004) Kafka S., Honeycutt R.K., 2004, Rev. Mex. A&A (Conf. Ser.), 20, 238
- Kafka & Honeycutt (2005) Kafka S., Honeycutt R.K., 2005, IBVS, 5597
- Kaitchuck (1989) Kaitchuck R.H., 1989, PASP, 101, 1129
- Kaitchuck et al. (1998) Kaitchuck R.H., Schlegel E.M., White J.C., Mansperger C.S., 1998 ApJ, 499, 444
- Kaitchuck et al. (1983) Kaitchuck R.H., Honeycutt R.K., Schlegel E.M., 1983, ApJ, 267, 239
- Kalużny (1989) Kalużny J., 1989, Acta Astron., 39, 235
- Kato et al. (2014) Kato T., Dubovsky P.A., Kudzej I. et al., 2014, PASJ, 60, 30
- Kato et al. (2016) Kato T., Hambsch F.-J., Monard B. et al., 2016, PASJ, 68, 65
- Kato et al. (1998) Kato T., Haseda K., Takamizawa K., Kazarovets E.V., Samus N.N., 1998, IBVS, 4584
- Kato et al. (1992) Kato T., Hirata R., Mineshige S., 1992, PASJ, 44, L215
- Kato et al. (2009, 2014) Kato T., Imada A., Uemura M. et al., 2009, PASJ, 61, S395
- Kato et al. (2002) Kato T., Ishioka R., Uemura M., 2002, PASJ, 54, 1003
- Kato et al. (2017) Kato T., Isogai K., Hambsch F.-J. et al., 2017, PASJ, 69, 75
- Kato et al. (2003) Kato T., Santallo R., Bolt G. et al., 2003, MNRAS, 339, 861
- Kato et al. (2001) Kato T., Sekine Y., Hirata R., 2001, PASJ, 53, 1191
- Kato & Stubbings (2003) Kato T., Stubbings R., 2003, IBVS, 5426
- Kato & Uemura (1999) Kato T., Uemura M., 1999, IBVS, 4786
- Kelly et al. (1981) Kelly B.D., Kilkenny D., Cooke J.A., 1981, MNRAS, 196, 91p
- Kenyon & Garcia (1986) Kenyon S.J., Garcia M.R., 1986, AJ, 91, 125
- Khangale et al. (2020) Khangale Z.N., Woudt P.A., Potter S.B., et al., 2020, MNRAS, 495, 637
- Kholopov & Samus (1988) Kholopov P.N., Samus N.N., 1988, IBVS, 3154
- Kholopov et al. (1985) Kholopov P.N., Samus N.N., Frolov M.S. et al., 1985, General Catalogue of Variable Stars, edition, Moscow, Nauka Publishing House
- Kilkenny & Lloyd Evans (1989) Kilkenny D., Lloyd Evans T., 1989, Obs., 109, 89
- Klare et al. (1982) Klare G., Krautter J., Wolf B. et al., 1982, A&A, 113, 76
- Knigge (2006) Knigge C., 2006, MNRAS, 373, 484
- Knigge et al. (2000) Knigge C., King A.R., Patterson J., 2000, A&A, 364, L75
- Kozhevnikov (2007) Kozhevnikov V.P., 2007, MNRAS, 378, 957
- Kozhevnikov (2015) Kozhevnikov V.P., 2015, New Astron., 41, 59
- Kraft (1958) Kraft R.P., 1958, ApJ 127, 625
- Kraft (1964a) Kraft R.P., 1964a, ApJ 139, 457
- Kraft (1964b) Kraft R.P., 1964b, in Luyten W.J., ed., 1st Conference on Faint Blue Stars, Univ. of Minnesota Press, p. 77
- Kraicheva et al. (1999a) Kraicheva Z., Stanishev V., Genkov V., 1999a, A&AS, 134, 263
- Kraicheva et al. (1999b) Kraicheva Z., Stanishev V., Genkov V., Iliev L., 1999b, A&A 351, 607
- Krautter et al. (1981a) Krautter J., Klare G., Wolf B. et al., 1981a, A&A 98, 27
- Krautter et al. (1981b) Krautter J., Klare G., Wolf B. et al., 1981b, A&A 102, 337
- Krempéc (1970) Krempéc J., 1970, Acta Astr., 20, 267
- Kruszewski et al. (1981) Kruszewski A., Mewe R., Heise J. et al., 1981, Space Science Rev., 30, 221
- Krzeminski (1962) Krzeminski W., 1962, PASP, 74, 66
- Kubiak (1984) Kubiak K., 1984, Acta Astron., 34, 331,
- Kürster & Barwig (1988) Kürster M., Barwig H., 1988, A&A, 199, 201
- Kurochkin (1960) Kurochkin N.E., 1960, Astron. Tsirk., 212, 9
- Kurochkin & Shugarov (1980) Kurochkin N.E., Shugarov S.Yu., 1980, Astron. Tsirk., 1114, 1
- Krzeminski (1966) Krzeminski W., 1966, IBVS 160
- Kuulkers et al. (1991) Kuulkers E., Hollander A., Oosterbroek T. van Paradijs J., 1991, A&A, 242, 401
- la Dous (1991) la Dous C., 1991, A&A, 252, 100
- la Dous et al. (1985) la Dous C., Verbunt F., Schoembs R. et al., 1985, MNRAS, 212, 231
- Lanning (1973) Lanning H.H., 1973, PASP, 85, 70
- Lanning et al. (1981) Lanning H.H., Horne K., Gomer R., 1981, IAU Circ., 3567
- Lasota (2001) Lasota J.P., 2001, New Astr. Rev., 45, 449
- Lawrence et al. (1967) Lawrence G.M., Ostriker J.P., Hesser J.E., 1967, ApJ, 148, 161
- Larsson (1985, 1992) Larsson S., 1985, A&A, 145, L1
- Larsson (1992) Larsson S., 1992, A&A, 265, 133
- Leach et al. (1999) Leach R., Hessman F.V., King A.R., Stehle R., Mattes J., 1999 MNRAS, 305, 225
- Leavitt & Mackie (1919) Leavitt H.S., Mackie J.C., 1919, Harvard Circ., 219
- Leibowitz et al. (1994) Leibowitz E.M., Mendelson H., Bruch A. et al., 1994, 421, 771
- Li et al. (2017) Li K., Hu S.-M., Zhou J.-L. et al., 2017, PASJ, 69, 28
- Liller (1980) Liller M.H., 1980, IBVS, 1743
- Lines et al. (1987) Lines H.C., Lines R.D., McFaul T.G., 1987, AJ, 95, 1505
- Linnell et al. (2007) Linnell A.P., Godon P., Hubeny I., Sion E.M., Szkody P., 2007, ApJ, 662, 1204
- Linnell et al. (2008a) Linnell A.P., Godon P., Hubeny I., 2008a, ApJ, 676, 1226
- Linnell et al. (2008b) Linnell A.P., Godon P., Hubeny I., Sion E.M., Szkody P., 2008b, ApJ, 688, 568.
- Linnell et al. (2009) Linnell A.P., Godon P., Hubeny I. et al., 2009, ApJ, 703, 1839
- Lipkin et al. (2000) Lipkin Y., Leibowitz E., Retter A., 2000, IAU Circ., 7433
- Littlefair et al. (2000) Littlefair S.P., Dhillon V.S., Howell S.B. Ciardi D.R., 2000 MNRAS, 313, 117
- Liu et al. (1999) Liu W., Hu J.Y., Zhu X.H., Li Z.Y., 1999, ApJS, 122, 243
- Löchel (1965) Löchel K., 1965, MVS, 3, 107
- Longa-Peña et al. (2015) Longa-Peña P., Steeghs D., Marsh T., 2015, MNRAS, 447, 149
- Lopes de Oliveira et al. (2020) Lopes de Oliveira R., Bruch A., Rodrigues C.V., Oliveira A.S., Mukai K., 2020, ApJL, 898, L40
- Luyten (1932) Luyten W.J., 1932, AN, 245, 211
- Luyten (1934) Luyten W.J., 1934, AN, 253, 135
- Luyten & Haro (1959) Luyten W.J., Haro G., 1959, PASP, 71, 469
- Mantel et al. (1987) Mantel K.H., Barwig H., H., Haefner R., Schoembs R., 1987 in Drechsel H., Kondo Y., Rahe J., eds, Cataclysmic Variables – Recent Multifrequency Observations and Theoretical Developments, ApSS, 130, p. 501
- Mantel et al. (1988) Mantel K.H., Marschhäusser H., Schoembs R., Haefner R., & la Dous C., 1988, A&A 193, 101
- Margon & Downes (1981) Margon B., Downes R., 1981, AJ, 86, 747
- Marin et al. (2007) Marin E., Shafter A.W., Misselt K.A., 2007, AAS, 211, 5108
- Marino & Walker (1984) Marino B.F., Walker W.S.G., 1984, Southern Stars, 30, 389
- Marsh (1988) Marsh T.R., 1988, MNRAS 231, 1117
- Marsh et al. (1990) Marsh T.R., Horne K., Schlegel E.M., Honeycutt R.K., Kaitchuck R.H., 1990, ApJ, 364, 637
- Martin et al. (1989) Martin J.S., Friend M.T., Smith R.C., Jones D.H.P., 1989, MNRAS, 240, 519
- Martin et al. (1987, 1989) Martin J.S., Jones D.H.P., Smith R.C., 1987, MNRAS, 224, 1031
-
Mart
ınez-Pais et al. (2000) Martínez-Pais I.G., Martím-Hernández N.L., Casares J., Rodríguez-Gil P., 2000, ApJ 538, 315 - Mason et al. (1997) Mason K.O., Drew J.E., Knigge C., 1997, MNRAS, 290, L23
- Mason et al. (1983) Mason K.O., Middleditch J., Córdova F.A. et al., 1983, ApJ, 264, 575
- Mason & Howell (2003) Mason E., Howell S.B., 2003, A&A, 403, 707
- Mason et al. (2013) Mason E., Orio M., Mukai K. et al., 2013, MNRAS 436, 212
- Mason et al. (2001) Mason E., Skidmore W., Howell S.B., Mennickent R.E., 2001, ApJ, 563, 351
- Mateo et al. (1991) Mateo M., Szkody P., Garnavich P., 1991, ApJ, 370, 370
- Mateo et al. (1985) Mateo M., Szkody P., Hutchings J., 1985, ApJ, 288, 292
- Matsui et al. (2009) Matsui R., Uemura M., Arai A. et al., 2009, PASJ, 61, 1081
- Matsumoto et al. (2000) Matsumoto K., Mennickent R.E., Kato T., 2000, A&A, 363, 1029
- Mayall (1946) Mayall M.W., 1946, Harvard. Bull., 918, 3
- Maza et al. (1989) Maza J., Ruiz M.T., González E., Wischnjewsky M., 1989, ApJ Suppl., 69, 349
- Mazeh et al. (1985) Mazeh T., Tal Y., Shaviv G., Bruch A., Budell R., 1985, A&A 149, 470
- McAllister et al. (2019) McAllister M., Littlefair S.P., Parsons S.G. et al., 2019, MNRAS, 486, 5535
- McIntosh (1989) McIntosh R., 1989, Publ. Var. Star Sect. RASNZ, 16, 83
- McLaughlin (1960) McLaughlin D.B., 1960, in Greenstein J.E., ed., Stars and Stellar Systems, Vol. VI, Stellar Atmospheres, University of Chicago Press, Chicago, p. 585
- McQuillin et al. (2012) McQuillin R., Evans A., Wilson D. et al., 2012, MNRAS, 419, 330
- Mennickent (1994) Mennickent R.E., 1994, A&A, 250, 363
- Mennickent & Diaz (2002) Mennickent R.E., Diaz M.P., 2002, MNRAS, 326, 765
- Mennickent et al. (1999) Mennickent R.E., Diaz M.P., Arenas J., 1999, A&A, 352, 167
- Mennickent & Sterken (1998) Mennickent R.E., Sterken C., 1998, PASP, 110, 1039
- Mennickent et al. (2006) Mennickent R.E., Unda-Sanzana E., Tappert C., 2006, A&A, 451, 619
- Metik (1981) Metik L.P., 1981, Perem. Zvesdy 13, 364
- Middleditch & Córdova (1982) Middleditch J., Córdova F.A., 1982, ApJ, 255, 585
- Middleditch et al. (1991) Middleditch J., Imamura J.N., Wolff M.T., Steiman-Cameron T.Y., 1991, ApJ, 382, 315
- Mikolajewski et al. (1997) Mikolajewski M., Tomov T., Kolev D., 1997, IBVS, 4428
- Miroshnichenko (1988) Miroshnichenko A.S., 1988, Astron. Zh., 65, 582
- Mizusawa e al. (2010) Mizusawa T., Merritt J., Ballous R.-L. et al., 2010, PASP, 122, 299
- Moffat & Shara (1984) Moffat A.F.J., Shara M.M., 1984, PASP, 96, 552
- Moffett & Barnes (1974) Moffett T., Barnes T.G., 1974, ApJ, 194, 141
- Moreales-Rueda et al. (2002) Morales-Rueda L., Still M.D., Roche R., Wood J.H., Lockley J.J., 2002, MNRAS, 329, 597
- Morgenroth (1934) Morgenroth O., 1934, Astron. Nachr., 253, 443
- Motch et al. (1996) Motch C., Haberl F., Guillot P. et al., 1996, A&A, 307, 459
- Mouchet (1983) Mouchet M., 1983, in Livio M., Shaviv G., eds, Proc. IAU Coll. 72, Cataclysmic Variables and Related Objects, p. 173
- Mouchet et al. (1981) Mouchet M., Bonnet-Bidaud J.-M., Ilovaisky S.A., Chevalier C., 1981, A&A, 102, 31
- Mouchet et al. (2017) Mouchet M., Bonnet-Bidaud J.-M., Van Box Som L. et al., 2017, A&A, 600, A53
- Moyer et al. (2003) Moyer E., Sion E.M., Szkody P. et al., 2003, AJ, 125, 288
- Mukadam et al. (2016) Mukadam A.S., Pyrzas S., Townsley D.M. et al., 2016. ApJ, 821, 14
- Mukai & Charles (1987) Mukai K., Charles P.A., 1987, MNRAS 226, 209
- Mukai et al. (2009) Mukai K., Zietsman E., Still M., 2009, ApJ, 707, 652
- Mumford (1964) Mumford G.S., 1964, PASP, 76, 57
- Mumford (1966) Mumford G.S., 1966, ApJ, 146, 411
- Mumford & Krzeminski (1969) Mumford G.S., Krzeminski W., 1969, ApJS, 18, 429
- Munari & Dallaporte (2014) Munari U., Dallaporte S., 2014, New Astr., 27, 25
- Nadalin & Sion (2001) Nadalin I., Sion E.M., 2001, PASP, 113, 829
- Nassau & Stephenson (1963) Nassau J.J., Stephenson C.B., 1963, Hamburger Sternw., Warner & Swasey Obs.
- Naylor (2005) Naylor T., Allen A., Long K., 2005, MNRAS, 361,1091
- Neustroev et al. (2011) Neustroev V.V., Suleimanov V.F., Borisov N.V., Belyakov K.V., Shearer A., 2011, MNRAS, 410, 963
- Nogami et al. (2009) Nogami D., Hiroi K., Suzuki K. et al. 2009, in Soonthornthum B., Komonjinda S., Cheng K.S. et al. eds, ASP Con. Ser. 404, The 8th Pacific Rim Conference on Stellar Astrophysics, p. 52
- Nogami & Kato (1995) Nogami D., Kato T., 1995, IBVS, 4227
- Nogami et al. (1995) Nogami D., Masuda S., Kato T., 1995, IBVS, 4218
- Nogami et al. (1998) Nogami D., Baba H., Kato T., Novák R., 1998, PASJ, 50, 297
- North et al. (2000) North R.D., Marsh T.R., Moran C.K.J. et al., 2000, MNRAS, 313, 383
- Norton & Watson (1989) Norton A.J., Watson M.G., 1989, MNRAS, 327, 853
- O’Donoghue (1987) O’Donoghue D., 1987, ApSS, 136, 297
- O’Donoghue et al. (1987) O’Donoghue D., Fairall A.P., Warner B., 1987, MNRAS, 225, 43
- O’Donoghue et al. (1991) O’Donoghue D., Chen A., Marang F. et al., 1991, MNRAS, 250, 363
- O’Donoghue et al. (1987) O’Donoghue D., Fairall A.P., Warner B., 1987, MNRAS, 225, 43
- O’Donoghue & Soltynski (1992) O’Donoghue D., Soltynski M.G., 1992, MNRAS 254, 9
- O’Donoghue et al. (1989) O’Donoghue D., Warner B., Wargau W., Grauer A.D., 1989, MNRAS, 240, 41
- Oliveira et al. (2014) Oliveira A.S., Lima H.J.F., Steiner J.E., Borges B.W., Cieslinski D., 2014, MNRAS, 444, 2682
- Oliveira & Steiner (2004) Oliveira A.S., Steiner J.E., 2004, MNRAS, 351, 685
- Oskanian (1983) Oskanian A.V., 1983, IBVS 2349
- Okazaki et al. (1982) Okazaki A., Kitamura M., Yamasaki A., 1982, PASP, 94, 162
- Paczynski (1965) Paczynski B., 1965, Acta Astr., 15, 197
- Panek (1980) Panek R.J., 1980, ApJ, 241, 1077
- Panek & Holm (1984) Panek R.J., Holm A.V., 1984, ApJ, 227, 700
- Papadaki et al. (2009) Papadaki C., Boffin H.M.J., Stanishev V. et al., 2009, J. Astron. Data 15, 1
- Papadaki et al. (2006) Papadaki C., Boffin H.M.J., Sterken C. et al., 2006, A&A, 456, 599
- Patterson (1979a) Patterson J., 1979a, AJ, 84, 804
- Patterson (1979b) Patterson J., 1979b, ApJ, 233, L13
- Patterson (1980) Patterson J., 1980, ApJ, 241, 235
- Patterson (1981) Patterson J., 1981, ApJ Suppl., 45, 517
- Patterson & Eisenmann (1987) Patterson J. Eisenman N., 1987, IBVS, 3079
- Patterson et al. (2002) Patterson J., Fenton W.H., Thorstensen J.R. et al., 2002, PASP, 114, 1364
- Patterson et al. (2005) Patterson J., Kemp J., Harvey D.A. et al., 2005, PASP, 117, 1204
- Patterson et al. (1981) Patterson J., McGraw J.T., Coleman L., Africano J.L., 1981, ApJ 248, 1067
- Patterson et al. (1998) Patterson J., Kemp J., Shambrook A. et al., 1997, PASP, 109, 1100
- Patterson et al. (1998) Patterson J., Kemp J., Shambrook A. et al., 1998, PASP, 110, 380
- Patterson et al. (2017) Patterson J., Oksanen A., Kemp J. et al., 2017, MNRAS, 466, 581
- Patterson et al. (1992) Patterson J., Schwartz D.A., Pye J.P. et al., 1992, ApJ, 393, 233
- Patterson & Skillman (1994) Patterson J., Skillman D.R., 1994, PASP, 106, 1141
- Patterson et al. (2018) Patterson J., Stone G., Kemp J. et al., 2018, PASP, 130, 4202
- Patterson & Szkody (1993) Patterson J., Szkody P., 1993, PASP, 105, 1116
- Patterson et al. (1993) Patterson J., Thomas G., Skillman D.R., Diaz M., 1993, ApJ Suppl., 83, 235
- Patterson et al (2001) Patterson J., Thorstensen J.R., Fried R. et al., 2001, PASP, 113, 72
- Patterson et al. (2003) Patterson J., Thorstensen J.R., Kemp J. et al., 2003, PASP, 115, 1308
- Pavlenko & Shugarov (1998) Pavlenko E.P., Shugarov S.Yu., 1998, AA Trans., 15, 89
- Pavlenko et al. (2000) Pavlenko E.P., Shugarov S.Yu., Katysheva N.A., 2000, Astrophys., 43, 419
- Peters & Thorstensen (2006) Peters C.S., Thorstensen J., 2006, PASP, 118, 687
- Pezzuto et al. (1996) Pezzuto S., Bianchini A., Stagni R., 1996, A&A, 312, 865
- Philip & Stock (1972) Philip A.G.D., Stock J., 1972, Bull. Obs. Ton. Tac., 38, 201
- Pickering (1906) Pickering E.C., 1906, Harv. Circ., 120
- Pickles & Visvanathan (1983) Pickles A.J., Visvanathan N., 1983, MNRAS, 204, 463
- Pilyugin (1985) Pilyugin L.S., 1985, Astrofiz., 23, 277
- Poole et al. (2003) Poole T., Mason K.O., Ramsay G., Drew J.H. Smith R.C., 2003, MNRAS, 340, 499
- Popowa (1961) Popowa M., 1961, Astron. Nachr., 286, 81
- Potter et al. (2004) Potter S.B., Romero-Colmerero E., Watson C.A., Buckley D.A.H., Phillips A., 2004, MNRAS, 348, 316
- Pretorius et al. (2006) Pretorius M.L., Warner B., Woudt P.A., 2006, MNRAS, 368, 361
- Qian et al. (2007) Qian S.-B., Dai Z.-B., He J.-J. et al., 2007, A&A, 466, 589
- Qian et al. (2015) Qian S.-B., Han Z.T., Fernández Lajús R. et al., 2015, ApJ Suppl., 221, 17
- Qian et al. (2013) Qian S.-B., Shi G., Fernández Lajús R. et al., 2013, ApJ, 771, L18
- Raikova & Antov (1986) Raikova D., Antov A., 1986, IBVS, 2260
- Ramsay (2000) Ramsay G., 2000, MNRAS, 314, 403
- Rana et al. (2004) Rana V.R., Singh K.P., Schlegel E.M., 2004, AJ, 127, 489
- Ratering et al. (1993) Ratering C., Bruch A., Diaz M.P., 1993, A&A, 268, 694
- Rayne & Whelan (1981) Rayne M.W., Whelan J.A.J., 1981, MNRAS, 196, 73
- Reinmuth (1925) Reinmuth K., 1925, Astron. Nachr., 225, 385
- Reinsch & Beuermann (1990) Reinsch K., Beuermann K., 1990, A&A, 240, 360
- Ribeiro & Diaz (2006) Ribeiro F.M.A., Diaz M.P., 2006, PASP, 118, 84
- Ribeiro & Diaz (2007) Ribeiro F.M.A., Diaz M.P., 2007, AJ, 133, 2659
- Ribeiro & Diaz (2007, 2009) Ribeiro F.M.A., Diaz M.P., 2009, PASJ, 61, 137
- Ribeiro et al. (2007) Ribeiro T., Baptista R., Harlaftis E.T., Dhillon V.S., & Rutten R.G.M., 2007, A&A, 474, 213
- Ringwald (1995) Ringwald F.A., 1995, MNRAS, 274, 127
- Ringwald et al. (1996) Ringwald F.A., Naylor T., Mukai K., 1996a, MNRAS, 281, 192
- Ringwald et al. (1994) Ringwald F.A., Thorstensen J.R., Hamvey R.M., 1994, MNRAS, 271, 323
- Ringwald et al. (1996b) Ringwald F.A., Thorstensen J.R., Honeycutt R.K., Smith R.C., 1996b, AJ, 111, 2077
- Ritter & Kolb (2003) Ritter H., Kolb U., 2003, A&A, 404, 301
- Robinson (1975) Robinson E.L., 1975, AJ, 80, 515
- Robinson & Nather (1979) Robinson E.L., Nather R.E., 1979, ApJS, 39, 401
- Robinson & Nather (1983) Robinson E.L., Nather R.E., 1983, ApJ, 273, 255
- Robinson et al. (1982) Robinson E.L., Nather R.E., Kepler S.O., 1982, ApJ, 254, 646
- Robinson et al. (1991) Robinson E.L., Shretone M.D., Africano J.L., 1991, AJ, 102, 1176
- Robinson & Warner (1984) Robinson E.W., Warner B., 1984, ApJ, 277, 250
- Robinson et al. (1987) Robinson E.L., Shafter A.W., Hill J.A., Wood M.A., Mattei J.A., 1987, ApJ, 313, 772
- Rodrigues et al. (1998) Rodrigues C.V., Cieslinski D., Steiner J.E., 1998, A&A, 335, 939
- (488) Rodríguez-Gil P., Martínez-Pais I.G., 2002, MNRAS, 337, 209
- Rodríguez-Gil et al. (2001) Rodríguez-Gil P., Martínez-Pais I.G., Casares J., Villada M., van Zyl L., 2001, MNRAS, 238, 903
- Rodríguez-Gil et al. (2007) Rodríguez-Gil P., Schmidtobreick L., Gänsicke B.T., 2007, MNRAS, 374, 1359
- Rodríguez-Gil et al. (2020) Rodríguez-Gil P., Shahbaz T., Torres M.P.A. et al., 2020, MNRAS, 494, 425
- Rodríguez-Gil & Torres (2005) Rodríguez-Gil P., Torres M.P.A., 2005, A&A, 431, 289
- Rogoziecki & Schwarzenberg-Czerny (2001) Rogoziecki P. Schwarzenberg-Cerny A., 2001, MNRAS, 323, 850
- Rogoziecki & Schwarzenberg-Czerny (2003) Rogoziecki P. Schwarzenberg-Cerny A., 2003, A&A, 397, 961
- Rolfe et al. (2000) Rolfe D.J., Haswell C.A., Patterson J., 2000, MNRAS, 317, 759
- Romano (1958) Romano G., 1958, Mem. S.A.I., 29, 2
- Rosen et al. (1994) Rosen S.R., Clayton K.L., Osborne J.P., McGale P.A., 1994, MNRAS, 269, 913
- Rosen et al. (1987) Rosen S.R., Mason K.O., Córdova F.A., 1987, MNRAS, 224, 987
- Rosen et al. (1995) Rosen S.R., Watson K.T., Robinson E.L. et al., 1995, A&A, 300, 392
- Rosenzweig et al. (2000) Rosenzweig P., Mattei J.A., Kafka S., Turner G.W., Honeycutt R.K., 2000, PASP, 112, 632
- Rosino et al. (1993) Rosino L., Romano G., Marziani P., 1993, PASP, 105, 51,
- Rude & Ringwald (2012) Rude G.D., Ringwald F.A., 2012, New Astr., 17, 453
- Rutten et al. (1992) Rutten R.G.M., van Paradijs J., Tinbergen J., 1992, A&A, 260, 213
- Sahman et al. (2018) Sahman D.I., Dhillon V.S., Littlefair S.P., Hanninan G., 2018, MNRAS, 477, 4483
- Saito & Baptista (2016) Saito R., Baptista R., 2016, MNRAS, 457, 198
- Sambruna et al. (1991) Sambruna R.M., Chiapetti L., Treves A. et al., 1991, ApJ, 374, 744
- Sanduleak (1972) Sanduleak N., 1972, IBVS, 663
- Sanford (1949) Sanford R.F., 1949, ApJ, 109, 81
- Satyvoldiev (1972) Satyvoldiev V., 1972, Astron. Tsirk., 711, 1
- Scaringi (2014) Scaringi S., 2014, MNRAS, 438, 1233
- Scaringi et al. (2012a) Scaringi S., Körding E., Uttley P. et al., 2012a, MNRAS, 427, 2854
- Scaringi et al. (2012b) Scaringi S., Körding E., Uttley P. et al., 2012b, MNRAS, 427, 3396
- Schaefer (2010) Schaefer B.E., 2010, ApJS, 187, 275
- Schaefer (2018) Schaefer B.E., 2018, MNRAS, 481, 3033
- Schaefer et al. (1992) Schaefer B.E., Landolt A.U., Vogt N. et al., 1992, ApJS, 81, 321
- Schaefer et al. (2010) Schaefer B.E., Pagnotta A., Shara M.M., 2010, ApJ, 708, 381
- Schild (1969) Schild R.E., 1969, ApJ, 157, 709
- Schlegel et al. (1986) Schlegel E.M., Honeycutt R.K., Kaitchuck R.H., 1986, ApJ, 307, 760
- Schlindwein (2017) Schlindwein W. 2017, Mapeando o disco de acrécimo em variáveis cataclísmicas: SDSS J0926+3624 and OY Carinae, Master thesis, Fed. Univ. Santa Catarina, Florianópolis
- Schmeer (1992) Schmeer P., 1992, IAU Circ., No. 5502
- Schmidke et al. (2002) Schmidke P.C., Ciudin G.A., Indlekofer U.R. et al., 2002, in Gänsicke B., Beuermann K., eds, ASP Conf. Ser., 261, Physics of Cataclysmic Variables and Related Objects, p. 539
- Schmidtobreick et al. (2018) Schmidtobreick L., Mason E., Howell S.B. et al., 2018, A&A, 617, A16
- Schmidtobreick et al. (2008) Schmidtobreick L., Papadaki C., Tappert C., Ederoclite A., 2008, MNRAS, 389, 1345
- Schmidtobreick et al. (2005) Schmidtobreick L., Tappert C., Galli L., Whiting A., 2005, IBVS, 5627
- Schmidtobreick et al. (2003) Schmidtobreick L., Tappert C., Saviane I., 2003, MNRAS, 342, 142
- Schneider & Young (1980) Schneider D.P., Young P., 1980, ApJ, 240, 821
- Schneider et al. (1981) Schneider D.P., Young P., Shectman S.A., 1981, ApJ, 245, 644
- Schneller (1931) Schneller H., 1931, Astron. Nachr., 243, 335
- Schoembs (1982) Schoembs R., 1982, A&A, 115, 190
- Schoembs et al. (1987) Schoembs R., Dreier H., Barwig H., 1987, A&A, 181, 50
- Schoembs & Stolz (1981) Schoembs R., Stolz B., 1981, IBVS, 1986
- Schoembs & Vogt (1981) Schoembs R., Vogt N., 1981, A&A, 97, 185
- Schrijver et al. (1987) Schrijver J., Brinkman A.C., van der Woerd H., 1987, ApSS, 130, 261
- Schrijver et al. (1985) Schrijver J., Brinkman A.C., van der Woerd H. et al., 1985, Sp. Sc. Rev., 40, 121
- Schwarzenberg-Czerny et al. (1992) Schwarzenberg-Czerny A., Udalski A., Monier R., 1992, ApJ, 401, L19
- Schwope et al. (1993) Schwope A.D., Thomas H.-C., Beuermann K., Reinsch K., 1993, A&A, 267, 103
- Selvelli (2004) Selvelli P., 2004, Baltic Astr., 13, 93
- Selvelli & Gilmozzi (2013) Selvelli P., Gilmozzi R., 2013, A&A, 560, A49
- Selvelli et al. (1995) Selvelli P.L., Gilmozzi R., Cassatella A., 1995, in Bianchini A., Della Valle M., Orio M., eds, Cataclysmic Variables, Kluwer Academic Publishers, Dordrecht, p. 182
- Semena et al. (2014) Semena A.N., Revnivtsev M.G., Buckley D.A.H. et al., 2014, MNRAS 442, 1123.
- Semeniuk (1980) Semeniuk I., 1980, A&AS, 39, 29
- Semeniuk et al. (1997) Semeniuk I., Olech A., Kwast T., Należyty M., 1997, Acta Astron., 47, 201
- Shafter (1983a) Shafter A.W., 1983a, PhD thesis, UCLA
- Shafter (1983b) Shafter A.W., 1983b, ApJ, 267, 222
- Shafter (1983d, 1985) Shafter A.W., 1983d, IBVS, 2377
- Shafter (1985) Shafter A.W., 1985, AJ, 90, 643
- Shafter & Harkness (1986) Shafter A.W., Harkness R.P., 1986, AJ, 93, 659
- (548) Shafter A.W., Hessmann F.V., 1988, AJ, 95, 178
- Shafter et al. (1990) Shafter A.W., Robinson E.L., Crampton D., Warner B., Prestage R.M., 1990, ApJ, 354, 719
- Shafter et al. (1986) Shafter A.W., Szkody P., Thorstensen J.R., 1986, ApJ, 308 765
- Shafter et al. (1995) Shafter A.W., Veal J.M., Robinson E.L., 1995, ApJ, 440, 853
- Shara et al. (2018) Shara M.M., Prialnik D., Hillman Y., Kovetz A., 2018, ApJ, 860, 110
- Shears & Poyner (2009) Shears J., Poyner G., 2009, JBAA, 120, 169
- Sheets et al. (2007) Sheets H.A., Thorstensen J.R., Peters C.J., Kapusta A.B., 2007 PASP, 119, 494
- Sherrington et al. (1984) Sherrington M.R., Bailey J., Jameson R.F., 1984, MNRAS, 206, 859
- Shore et al. (2013) Shore S.N. Schwarz G.J., de Gennaro Aquino I. et al., 2013, A&A, 549, 140
- Shugarov (1983) Shugarov S.Yu., 1983, Pis’ma Astron. Zh., 9, 31
- Shugarov et al. (2005) Shugarov S.Yu., Katysheva N.A., Seregina T.M., VolkovI.M., 2005, in Hameury J.-M., Lasota J.-P., eds, ASP Conf. Series, 330, The Astrophysics of Cataclysmic Variables and Related Objects, p. 495
- Šimon (2000) Šimon V., 2000, A&A, 364, 694
- Šimon et al. (2004) Šimon V., Hudec R., Hroch F., 2004, IBVS, 5562
- Šimon (2012) Šimon V., Polášek C., Štrobl J., Hudec R., Blažek M., 2012, A&A, 540, A15
- Simonsen (2011) Simonsen M., 2011, JAAVSO, 39, 1
- Simonsen et al. (2014a) Simonsen M., Bohlsen T., Hambsch F.-J., Stubbings R., 2014a JAAVSO, 42
- Simonsen et al. (2014b) Simonsen M., Boyd D., Goff W. et al., 2014b, JAAVSO, 42, 177
- Simonsen & Stubbings (2011) Simonsen M., Stubbings R., 2011, JAAVSO, 39, 73
- Singh et al. (1993) Singh J., Rao P.V., Agrawal P.C. et al., 1993, ApJ, 419, 337
- Sion & Guinan (1982) Sion E.M., Guinan E.F., 1982, in Kondo Y., Mead J.M., Chapman R.D., eds, Advances in ultraviolet astronomy: Four years of IUE Research, NASA CP-2238., p. 460,
- Sirk & Howell (1998) Sirk M., Howell S.B., 1998, ApJ, 506, 824
- Skidmore et al. (2000, 2002) Skidmore W., Mason E., Howell S.B. et al., 2000, MNRAS, 318, 429
- Skidmore et al (2002) Skidmore W., Wynn G.A., Leach R., Jameson R.F., 2002, MNRAS, 336, 1223
- Skillman et al. (1995) Skillman D.R., Patterson J., Thorstensen J.R., 1995, PASP, 107, 545
- Smak (1993) Smak J., 1993, Acta Astron., 43, 212
- Smak (1994) Smak J., 1994, Acta Astron., 44, 59
- Smak (1995, 2019) Smak J., 1995, Acta Astr. 45, 259
- Smak (2002) Smak J., 2002, Acta Astr., 52, 189
- Smak (2019) Smak J., 2019, Acta Astr., 69, 79
- Smith et al. (2006) Smith A.J., Haswell C.A., Hynes R.I., 2006, MNRAS, 369, 1546
- Smith et al. (1998) Smith D.A., Dhillon V.S., Marsh T.R., 1998, MNRAS, 296, 465
- Smith et al. (1993) Smith R.C., Fiddik R.J., Nawkins N.A., Catalán M.S., 1993, MNRAS, 264, 619
- Smith et al. (2005) Smith R.C., Mehes O., Vande Putte D., Hawkins N.A., 2005, MNRAS, 360, 374
- Snijders (1987) Snijders M.A.J., 1987, in Bode M.F., ed., RS Ophiuchi (1985) and the recurrent nova phenomenon, VNU Science Press, p. 51
- Soejima et al. (2009) Soejima Y., Nogami D., Kato T. et al., 2009, PASJ, 61, 659
- Sokolov et al. (1996) Sokolov D.A., Shugarov S.Yu., Pavlenko E.P., 1996, in: Evans A., Wood J.H., eds, Cataclysmic Variables and Related Objects, Kluwer Academic Publishers, p. 219
- Solf (1983) Solf J., 1983, ApJ, 273, 647
- Somero et al. (2013) Somero A., Hakala P., Wynn G.A., 2013, MNRAS, 2784
- Southwell et al. (1995) Southwell K.A., Still M.D., Smith R.C., Martin J.S., 1995, A&A, 302, 90
- Spogli & Claudi (1994) Spolgi C., Claudi R., 1994, A&A, 281, 808
- Spruit & Rutten (1998) Spruit H., Rutten R.G.M., 1998, MNRAS, 299, 768
- Stanishev et al. (2004) Stanishev V., Zamanov R.K., Tomov N., Marziani T.G., 2004, A&A, 415, 609
- Stark et al. (2008) Stark M.A., Wade R.A., Thorstensen J.R. et al., 2008, AJ, 135, 991
- Starrfield et al. (1985) Starrfield S., Sparks W.M., Truran J.W., 1985, 291, 136
- Steavenson (1923) Steavenson W.H., 1923, MNRAS, 83, 160
- Steeghs et al. (2007) Steeghs D., Howell S.B., Knigge C. et al., 2007, ApJ, 667, 442
- Steiner & Diaz (1998) Steiner J.E., Diaz M.P., 1998, PASP, 110, 276
- Stepanyan (1979) Stepanyan J.A., 1979, IVBS, 1630
- Sterken et al. (2007) Sterken C., Vogt N., Schreiber M.R., Uemura M., Tuvikene T., 2007, A&A, 463, 1053
- Stickland et al. (1984) Stickland D.J., Kelly B.D., Cooke J.A., 1984, MNRAS 206, 819
- Still et al. (1995) Still M.D., Dhillon V.S., Jones D.H.P., 1995, MNRAS, 273, 849
- Stobie et al. (1995) Stobie R.S., Kilkenny D., O’Donoghue D., 1995, ApSS, 230, 101
- Stobie et al. (1997) Stobie R.S., Kilkenny D., O’Donoghue D. et al., 1997, MNRAS, 287, 848
- Stockman Sargent (1979) Stockman H.S., Sargent T.A., 1979, ApJ, 227, 197
- Stover (1981) Stover R.E., 1981, ApJ 248, 684
- Strope et al. (2010) Strope R.J., Schaefer B.E., Henden A.A., 2010, AJ, 140, 134
- Svolopoulos (1966) Svolopoulos S.N., 1966, PASP, 78, 157
- Szkody (1981) Szkody P., 1981, ApJ, 247, 577
- Szkody (1985) Szkody P., 1985, AJ, 90, 1837
- Szkody et al. (2002) Szkody P., Gänsicke B.T., Sion E.M., Howell S.B., 2002, ApJ, 574, 950
- Szkody et al. (1980) Szkody P., Córdova F.A., Tuohy I.R. et al., 1980, ApJ, 241,1070
- Szkody Crosa (1981) Szkody P., Crosa L., 1981, ApJ, 251, 620
- Szkody et al. (2000) Szkody P., Desai V., Hoard D.W., 2000, AJ, 119, 365
- Szkody et al. (1984, 1989) Szkody P., Howell S.B., Mateo M., Kreidl T.J., 1989, PASP, 101, 899
- Szkody & Margon (1980) Szkody P., Margon B., 1980, ApJ, 236, 862
- Szkody & Mateo (1984) Szkody P., Mateo M., 1984, ApJ, 280, 729
- Szkody & Mateo (1988) Szkody P., Mateo M., 1988, PASP, 100, 1111
- Szkody & Mattei (1984) Szkody P., Mattei J.A., 1984, PASP, 96, 988
- Szkody et al. (2016) Szkody P., Mukadam A.S., Gänsicke B.T. et al., 2016, AJ, 152, 48
- Szkody & Piché (1990) Szkody P., Piché F., 1990, ApJ, 361, 235
- Szkody & Shafter (1983) Szkody P., Shafter A.W., 1983, PASP, 95, 509
- Szkody et al. (1984) Szkody P., Shafter A.W., Cowley A.P., 1984, ApJ, 282, 236
- Szkody & Wade (1980) Szkody P., Wade R.A., 1980, PASP, 92,806
- Tapia (1977a) Tapia S., 1977a, ApJ, 212, L125
- Tapia (1977b) Tapia S., 1977b, IAU Circ., 3954
- Tapia (1982) Tapia S., 1982, IAU Circ., 3685
- Tappert et al. (1998) Tappert C., Hanuschik R.W., Wargau W.F., 1998, AG Astr. Series, 14, 126
- Tappert et al. (1997) Tappert C., Wargau W.F., Hanuschik R.W., Vogt N., 1997, A&A, 327, 231
- Taylor & Thorstensen (1996) Taylor C.J., Thorstensen J.R., 1996, PASP, 108, 894
- Thoroughgood et al. (2004) Thoroughgood T.D., Dhillon V.S., Watson C.A. et al., 2004, MNRAS, 253, 1135
- Thorstensen (1996) Thorstensen J.R., 1996, AJ, 91, 940
- Thorstensen & Freed (1985) Thorstensen J.R., Freed I.W., 1985, AJ, 90, 2082
- Thorstensen & Taylor (1997) Thorstensen J.R., Taylor C.J., 1997, PASP, 109, 1359
- Thorstensen & Taylor (2000) Thorstensen J.R., Taylor C.J., 2000, MNRAS, 312, 629
- Thorstensen et al. (2002) Thorstensen J.R., Patterson J., Kemp J., Vennes S., 2002, PASP, 114, 1108
- Thorstensen et al. (1996) Thorstensen J.R., Patterson J.O., Shambrook A., Thomas G., 1996, PASP, 108, 73.
- Thorstensen & Ringwald (1997) Thorstensen J.R., Ringwald F.A., 1997, PASP 109, 483
- Thorstensen et al. (1986) Thorstensen J.R., Wade R.A., Oke J.B., 1986, ApJ, 309, 721
- Toloza et al. (2016) Toloza O., Gänsicke B.T., Hermes J.J. et al., 2016, MNRAS, 459, 1393
- Townsley et al. (2004) Townsley D.M., Arras P., Bildsten H., 2004, ApJ, 608, L105
- Tsessevich (1969) Tsessevich V.P., 1969, Astron. Tsirk., 529, 7
- Tuohy et al. (1990) Tuohy I.R., Remillard R.A., Brissenden R.J.V., Bradt H.V., 1990, ApJ, 359, 204
- Tuohy et al. (1985) Tuohy I.R., Visvanathan N., Wickramasinghe D.T., 1985, ApJ, 289, 721
- Turner (1921) Turner H.H., 1921, MNRAS, 81, 426
- Udalski (1990) Udalski A., 1990, AJ, 100, 226
- Udalski & Schwarzenberg-Czerny (1989) Udalski A., Schwarzenberg-Czerny A., 1989, Acta Astron.,39, 125
- Udalksi & Szymanski (1988) Udalski A., Szymanski M., 1988, Acta Astron., 38, 215
- Uemura et al. (2001) Uemura M., Kato T., Pavlenko E., Baklanov A., Pietz J., 2001 PASJ, 53, 539
- Unda-Sanzana et al. (2006) Unda-Sanzana E., Marsh T.R., Morales-Rueda L., 2006, MNRAS, 269, 805
- Urban & Sion (2006) Urban J.A., Sion E.M., 2006, ApJ, 642, 1029
- Uthas et al. (2010) Uthas H., Knigge C., Steeghs D., 2010, MNRAS, 409, 237
- van Paradijs et al. (1994) van Paradijs J., Charles P.A., Harlaftis E.T. et al., 1994, MNRAS, 267, 465
- van Spaandonk et al. (2010) van Spaandonk L., Steeghs D., Marsh T.R., Parsons S.G., 2010, ApJ 715, L109
- van Zyl et al. (2000) van Zyl L., Warner B. O’Donoghue D. et al., 2000, Baltic Astr., 9, 231
- van Zyl et al. (2004) van Zyl L., Warner B. O’Donoghue D. et al., 2004, MNRAS, 350, 307
- Vande Putte et al. (2003) Vande Putte D., Smith R.D., Hawkings N.A., Martin J.S., 2003, MNRAS, 342, 151
- Vennes et al. (1995) Vennes S., Szkody P., Sion E.M., Long K.S., 1995, ApJ, 445, 921
- Verbunt (1987) Verbunt F., 1987, A&AS, 71, 339
- Verbunt et al. (1984) Verbunt F., Pringle J.E., Wade R.A. et al., 1984, MNRAS, 210, 197
- Vican et al. (2011) Vican L., Patterson J., Allen W. et al., 2011, PASP, 123, 1156
- Visvanathan & Tuohy (1983) Visvanathan N., Tuohy I., 1983, ApJ, 275, 709
- Vogt (1974) Vogt N., 1974, A&A, 36, 369
- Vogt (1975) Vogt N., 1975, A&A, 41, 15
- Vogt (1976) Vogt N., 1976, in Eggleton P., Mitton S., Whelan J., eds, Proc. IAU Symp. 73, Structure and evolution of close binary systems, Reidel, Dordrecht, p. 147
- Vogt & Breysacher (1980) Vogt N., Breysacher J., 1980, ApJ, 235, 945
- Vogt et al. (1980) Vogt N., Krzeminski W., Sterken C., 1980, A&A 85, 106
- Vogt et al. (2017) Vogt N., Schreiber M.R., Hambsch F.-J. et al., 2017, PASP, 129, 4201
- Voikhanskaya (1988) Voikhanskaya N.F., 1988, A&A, 192, 128
- Voikhanskaya (1996) Voikhanskaya N.F., 1996, Astron. Rep., 40, 674
- Voikhanskaya & Nazarenko (1983) Voikhanskaya N.F., Nazarenko I.I., 1983, Astron. Zh. 62, 81
- Volkov et al. (1986) Volkov I.M., Shugarov S.Yu., Seregina T.M., 1986, Astr. Tsirk., 1418, 3
- Voloshina & Khruzina (2000) Voloshina I.B., Khruzina T.S., 2000, Astron. Rep., 44, 89
- Wada et al. (2018) Wada Y., Yuasa T., Nakazawam K. et al., 2018, MNRAS, 474, 1564
- Wade & Horne (1988) Wade R.A., Horne K., 1988, ApJ 324, 411
- Walker (1977) Walker A.R., 1977, MNRAS, 179, 587
- Walker (1954) Walker M.F., 1954, PASP, 66, 71
- Walker (1956) Walker M.F., 1956, ApJ, 123, 68
- Walker (1957) Walker M.F., 1957, in Herbig G.H., ed., Proc. IAU Symp. 3, Non Stable Stars, p. 46
- Walker (1963) Walker M.F., 1963, ApJ, 138, 313
- Walker (1965) Walker M.F., 1965, Comm. Konkoly Obs., No. 57, p. 1
- Walker et al. (1976) Walker W.S.G., Marino B.F., Freeth G., 1976, IBVS, 1185
- Warner (1973) Warner B., 1973, MNRAS, 163, 25p
- Warner (1974) Warner B., 1974, MNRAS, 168, 235
- Warner (1975a) Warner B., 1975a, MNRAS, 170, 219
- Warner (1975b) Warner B., 1975b, MNRAS, 173, 37p
- Warner (1976a) Warner B., 1976a, in Eggleton P., Mitton S., Whelan J., eds, Structure and Evolution of Close Binary Systems, Reidel, Dordrecht, p. 85
- Warner (1976b) Warner B., 1976b, in Fitch W.S., ed., Proc. IAU Coll. No. 29, Multiple periodic variable stars, Budapest, p. 247
- Warner (1981) Warner B., 1981, MNRAS, 195, 101
- Warner (1982) Warner B., 1982, in Livio M., Shaviv G., eds, Proc. IAU Coll. 72, Cataclysmic Variables and Related Objects, p. 155
- Warner (1985) Warner B., 1985, MNRAS, 217, 1p
- Warner (1986) Warner B., 1986, MNRAS, 219, 751,
- Warner (1987) Warner B., 1987, MNRAS, 227, 23
- Warner (1995) Warner B., 1995, Cataclysmic Variable Stars, Cambridge University Press, Cambridge
- Warner & Brickhill (1978) Warner B., Brickhill A.J., 1978, MNRAS 182, 777
- Warner & Cropper (1983) Warner B., Cropper M., 1983, MNRAS, 203, 909
- Warner et al. (1995) Warner B., Martinez P., O’Donoghue D., 1995, ApSS, 226, 27
- Warner & Nather (1972) Warner B., Nather R.E., 1972, MNRAS, 159, 429
- Warner & Nather (1988) Warner B., Nather R.E., 1988, IBVS, 3140
- Warner & O’Donoghue (1987) Warner B., O’Donoghue D., 1987, MNRAS, 224, 733
- Warner & O’Donoghue (1988) Warner B., O’Donoghue D., 1988, MNRAS, 233, 705
- Warner et al. (1985) Warner B., O’Donoghue D., Allen S., 1985, MNRAS, 212, 9p
- Warner et al. (1989) Warner B., O’Donoghue D., Wargau W., 1989, MNRAS, 238, 73
- Warner & Woudt (2006) Warner B., Woudt P.A., 2006, MNRAS, 367, 1562
- Warner et al. (2003) Warner B., Woudt P.A., Pretorius M.L., 2003, MNRAS, 344, 1193
- Watanabe (1999) Watanabe T., 1999, SVOLJ Var. Star Bull., 34, 3
- Watson et al. (2003) Watson C.A., Dhillon V.S.,Rutten R.G.M., Schwope A.D., 2003, MNRAS, 341, 129
- Watson et al. (2007) Watson C.A., Steeghs D., Shahbaz T., Dhillon V., 2007, MNRAS, 282, 1105
- Watson et al. (1985) Watson M.G., King A.R., Osborne J., 1985, MNRAS, 212, 917
- Webbink (1978) Webbink R.F., 1978, PASP, 90, 57
- Weight et al. (1994) Weight A., Evans A., Naylor T., Wood J.H., Bode M.F., 1994, MNRAS, 266, 761
- Weil et al. (2018) Weil K.E., Thorstensen J.R., Haberl F., 2018, AJ, 156, 231
- Welsh et al. (2007) Welsh F.W., Froning C.S., Marsh T.R. et al., 2007, in Kang Y.W. et al., eds, ASP Conf. Series, 362, The Seventh Pacific Rim Conference on Stellar Astrophysics, p. 241
- Wenzel (1980) Wenzel W., 1980, IBVS, 1810
- White & Honeycutt (1993) White J.C., Honeycutt R.K., 1993, ApJ, 412, 278
- Wickramasinghe et al. (1991) Wickramasinghe D.T., Bailey J., Meggitt S.M.A. et al., 1991, MNRAS 251, 28
- Williams & Hiltner (1984) Williams G., Hiltner W.A., 1984, MNRAS, 211, 629
- Williger et al. (1988) Williger G., Berriman G., Wade R.A., Hassall B.J.M., 1988, ApJ, 333, 277
- Wolfe et al. (2013) Wolfe A., Sion E.M., Bond H.E., 2013, AJ, 145, 168
- Wolff et al. (1999) Wolff M.T., Wood K.S., Imamura J.N., Middleditch J., & Steiman-Cameron T.Y., 1999, ApJ, 526, 435
- Stephenson et al. (1968) Stephenson C.B., Sanduleak N., Schild R.E., 1968, ApL, 1, 247
- Wood et al. (1986) Wood J.H., Horne L., Berriman G. et al., 1986, MNRAS, 219, 629
- Wood et al. (1989) Wood J.H., Horne K., Berriman G., Wade R.A., 1989, ApJ, 341, 974
- Wood et al. (2005) Wood M.A., Robertson J.R., Simpson J.C. et al., 2005, ApJ, 634, 570
- Would & Warner (2002) Woudt P., Warner B., 2002, ApSS, 282, 433
- Woudt (2010) Woudt P.A., Warner B., O’Donoghue D. et al., 2010, MNRAS, 401, 500
- Wu et al. (1989) Wu C.C., Panek R.H., Holm A.V., 1989, ApJ, 339, 443
- Wu et al. (1995) Wu K., Chanmugam G., Shaviv G., 1995, ApJ, 455, 260
- Wu et al. (2002) Wu X., Li Z., Ding Y., Zhang Z., Li Z., 2002, ApJ, 569, 418
- Young et al. (1981a) Young P., Schneider D.P., Shectman S.A., 1981a, ApJ, 244, 259
- Young et al. (1981) Young P., Schneider D.P., Shectman S.A., 1981b, ApJ, 244, 259
- Zamanov et al. (2004) Zamanov R.K., Bode M.F., Stanishev V., Martıı, J., 2004, MNRAS, 350, 1477
- Zamanov et al. (2010) Zamanov R.K., Boeva S., Bachev R., 2010, MNRAS, 404, 381
- Zamanov et al. (2016) Zamanov R.K., Boeva S., Latev G. et al., 2016, MNRAS, 457, L10
- Zamanov & Bruch (1998) Zamanov R.K. Bruch A., 1998, A&A, 338, 988
- Zamanov et al. (2015) Zamanov R.K., Latev G., Boeva S. et al., 2015, MNRAS, 450, 3958
- Zhang & Robinson (1987) Zhang E.-H., Robinson E.L., 1987, ApJ 321, 813
- Zhang et al. (1991) Zhang E.-H., Robinson E.L., Ramseyer T.F., Shetrone M.D. Stiening R.F., 1991, ApJ, 381, 534
- Zuckemann (1961) Zuckermann M.C., 1961, Ann. Astroph., 24, 431
- Zwitter & Munari (1994) Zwitter T., Munari U., 1994, A&AS, 107, 503
- Zwitter & Munari (1995) Zwitter T., Munari U., 1995, A&AS, 114, 575
Appendix C Derivation of the flickering spectrum
Neglecting the contribution of the white dwarf and remembering that the light of the secondary has already been removed when the corresponding correction to the flickering amplitude was made, the total flux of a CV can be thought to be composed of two components. The first one, , is constant, being emitted by the quiet (i.e., non flickering) part of the accretion disk. The second part, , represents the flickering light source. Since, in general, it cannot be assumed that the latter is 100% modulated (i.e., that at the minimum of the flickering activity ) it can be expressed as consisting of a base level, , and a part (the latter being that part which is really seen as flickering). Let and denominate a reference and a comparison passband, respectively, and and the flickering amplitude observed in the two passbands. If and are the magnitudes of the system at the minimum of the flickering activity and at some other brightness level, respectively, the difference in the reference passband can be written as:
| (8) | |||||
Similarly, the magnitude difference in the comparison passband is:
| (9) | |||||
The flux unit is arbitrary, permitting to define the flux of the constant light source in the reference passbands to be . Its flux in the comparison passband can then be expresses as . If the spectrum of the constant source can be specified, is known. Let describe the spectrum of the flickering light source, normalized at the wavelength of the reference passband. Assuming that does not change when the flickering light brightens or weakens, , and . Finally, the ratio is known from Table 2. Thus, Eqs. 8 and 9 can be expressed as
| (10) |
and
| (11) |
Before proceeding it is now necessary to quantify the parameter , i.e., the spectrum of the non-flickering light. Since the uncertainties in the current approach do not warrant a more sophisticated treatment, I will assume it to radiate like a standard steady-state accretion disk (e.g., Shakura & Sunyaev, 1973; Frank et al., 2002) in the black body approximation. The spectrum is then a function of the mass of the central star, the mass transfer rate through the disk, and the inner () and outer () disk radii. Here, is taken to be equal to the radius of the central star which is assumed to be that of a white dwarf of mass according to Nauenberg (1972). is taken to be 40% of the distance between the binary components, calculated from Kepler’s third law. This implies the knowledge of the secondary star mass (or the mass ratio ) and the binary period. I calculate the disk spectrum for a statistical sample of 10 000 hypothetical systems, choosing random values from a uniform distribution of , and . The period is taken to increase linearly with the mass ratio from 80 min at to 8 h at . The 10 000 trials yield fluxes at the effective wavelength of the , , and bands relative to the flux at (i.e., the parameter ) as listed in the last column of Table 2.
Due to the non-linear relation between the flux and the magnitude scale there is a slight dependence of on . In other words, if is supposed to be constant, is a weak function of . Taking the band to be the reference and (, , ) as the comparison band, varies by 6.9% (1.1%, 1.5%, 0.6%) of its average value in the range in the case of a fully modulated flickering light source (). Neglecting these small variations, and to be definite, I assume .
References
- Frank et al. (2002) Frank J., King A.R., Raine D., 2002, Accretion Power in Astrophysics, Third Edition, Cambridge University Press
- Nauenberg (1972) Nauenberg M., 1972, ApJ, 175, 417
- Shakura & Sunyaev (1973) Shakura N.I., Sunyaev R.A., 1973, A&A, 24, 337
Appendix D An atlas of flickering light curves
The characterization of flickering in CVs and the comparison of its properties between different systems is complicated by several factors. The most obvious of these are:
The time resolution of the light curves: The visual properties of the flickering, as apparent to the eye of an investigator, depend strongly on the time resolution at which the data points in a light curve were taken. If the sampling time is long, details of the rapid variations which give rise to flickering are washed out. The light curve may then even appear to consist of pure noise. The ideal situation would be a time resolution which permits to resolve every individual flare. However, so far there is no indication of a minimum time scale on which these occur. Therefore, whatever time resolution is chosen for the observations, it is too long to permit to see all the details of the flickering. As an additional problem the noise level will rise when decreasing the sampling time, and this depends also on the apparent brightness of the observed system and the aperture of the telescope used. According to my experience, in order to get a good visual impression of the flickering properties, a 5 second cadence of the observations is appropriate in a high signal to noise light curve. Of course, the acceptable time resolution also depends on the tools which are applied to characterize the flickering.
The noise level of the light curves: The acceptable noise level depends strongly on the amplitude of the flickering signal. For a light curve to be useful for flickering studies the signal to noise ratio must remain high enough to permit the secure detection of variations occurring on time scales no longer than a couple (say, 4 or 5) integrations. Thus, a system with a strong flickering signal requires less stringent limits on the noise than a system where the flickering is weak.
Variations other than flickering: Many systems show variations which apparently are not related to flickering. The most obvious of these are orbital variations or (negative or positive) superhumps. These occur on time scales significantly longer than the flickering and can thus be subtracted with relative ease (if it is possible to determine their wave form reliably). More disturbing are variations which occur in magnetic systems such as polars and in particular intermediate polars. Here, rapid variations related to the changing aspect of the system as a function of the rotational phase of the white dwarf can occur on much shorter time scales, and a correction is not always easy. It is often not obvious if variations on comparatively long time scales (say, some 10 minutes), if they are not strictly periodic and transient (often termed quasi-periodic oscillations), should be regarded as flickering, or if they are due to unrelated mechanisms. If variations other than flickering occur on time scales equal to those normally associated with flickering, these have often small amplitudes and therefore - even if they cannot readily be recognized - they will have only a limited influence on any properties measured with tools applied to study flickering (unless they are - strictly - period, in which case it is, however, much easier to recognize them).
In this situation a synoptic view of light curves of many CVs of different types and photometric states is useful in order to enable a comparison of their visual flickering properties. Such an atlas is presented here in Figs. 19 – 37. To compile it, suitable light curves from the light curve collection of the author were chosed and are presented in a way which facilitates their comparison. In Table A1 the light curves used for the atlas are listed. It is structured as follows:
Column 1: The name of the star in lexigraphical order
Column 2: The type of the variable. The following abbreviations are used:
-
N = (classical) nova
-
RN = recurrent nova
-
UX = novalike variable of UX UMa subtype
-
VY = novalike variable of VY Scl subtype
-
DN = dwarf nova; may be of any of the various subtypes
-
IP = intermediate polar (DQ Her star)
-
AM = polar (AM Her star)
Column 3: Date (start of observations)
Column 4: Passband (w stands for white light)
Column 5: Photometric state. This is only given for dwarf novae and normally is based on information provided by the original observer in the respective observing logs. The light curves of all other systems were taken during their normal (high) state (quiescence for novae and recurrent novae). The following abbreviations are used:
-
Q = quiescence
-
O = outburst; not further specified; not always maximum
-
M = outburst maximum
-
SM = superoutburst (in SU UMa type dwarf novae)
Column 6: Number of the figure in which the light curve is reproduced
Column 7: Reference to a paper where the light curve is published
| Name | Type | Obs. | Pass- | photom. | Figure | Reference |
|---|---|---|---|---|---|---|
| Date | band | state | ||||
| RX And | DN | 1976, Aug 20 | w | O | A12 | Patterson (1981) |
| UU Aqr | UX | 2016, Aug 28 | B | A1 | ||
| AE Aqr | IP | 1992, Aug 05 | B | A17 | ||
| CZ Aql | UG | 2014, Jun 17 | w | Q | A8 | Bruch (2018) |
| V603 Aql | N | 1991, Jul 10 | B | A1 | ||
| AT Ara | UG | 2001, Jul 01 | w | Q | A8 | |
| TT Ari | VY | 1979, Dec 24 | w | A6 | ||
| T Aur | N | 1977, Nov 10 | w | A1 | ||
| SS Aur | DN | 1977, Set 09 | w | O | A12 | Patterson (1981) |
| KR Aur | VY | 1977, Nov 14 | w | A6 | ||
| SY Cnc | DN | 1977, Jan 24 | w | Q | A8 | Patterson (1981) |
| YZ Cnc | DN | 1978, Jan 05 | w | SM | A15 | Patterson (1979) |
| BG CMi | IP | 1982, Feb 21 | w | A17 | ||
| OY Car | UG | 2014, Fev 12 | B | Q | A8 | |
| HT Cas | DN | 1978, Set 10 | w | Q | A8 | Patterson (1981) |
| BV Cen | DN | 1987, May 26 | w | O | A12 | |
| MU Cen | DN | 2015, Jun 10 | w | Q | A9 | Bruch (2016) |
| V436 Cen | DN | 1973, Apr 10 | w | Q | A9 | |
| V436 Cen | DN | 1984, Jan 24 | w | SM | A15 | |
| V442 Cen | DN | 1982, May 25 | w | M | A12 | |
| V504 Cen | VY | 2014, Apr 29 | w | A6 | Bruch (2018) | |
| V834 Cen | AM | 1984, Mar 24 | V | A19 | Chiapetti et al. (1989) | |
| WW Cet | DN | 1976, Aug 20 | w | Q | A9 | Patterson (1981) |
| BO Cet | UX | 2016, Aug 11 | w | A1 | Bruch (2018) | |
| Z Cha | DN | 1972, Dec 08 | w | Q | A9 | Warner (1974) |
| Z Cha | DN | 1973, Jan 08 | w | O | A12 | Warner (1974), Warner & O’Donoghue (1988) |
| Z Cha | DN | 1980, Feb 19 | w | SM | A15 | Warner & O’Donoghue (1988) |
| TV Col | IP | 1986, Jan 01 | w | A17 | ||
| T CrB | RN | 1996, Feb 28 | U | A1 | Zamanov & Bruch (1998) | |
| EM Cyg | DN | 1978, Apr 12 | w | O | A13 | Patterson (1981) |
| V751 Cyg | VY | 1977, Jul 18 | w | A6 | ||
| HR Del | N | 1977, Sep 13 | w | A2 | ||
| DO Dra | DN | 1992, Jan 31 | B | A9 | ||
| KT Eri | N | 2014, Oct 23 | w | A2 | ||
| U Gem | UG | 1983, Apr 12 | w | Q | A10 | |
| DM Gem | N | 1977, Nov 11 | w | A2 | ||
| RZ Gru | UX | 2017, Aug 23 | w | A2 | ||
| V533 Her | N | 1992, Jun 02 | B | A2 | ||
| V795 Her | UX | 1987, May 28 | B | A3 | Kalużny (1989) | |
| EX Hya | IP | 1982, Feb 82 | w | A17 | ||
| VW Hyi | DN | 1972, Set 12 | w | Q | A10 | Warner (1975) |
| BL Hyi | AM | 2001, Jun 30 | w | A19 | ||
| DI Lac | N | 1976, Oct 22 | w | A3 | ||
| MV Lyr | VY | 1978, Jun 08 | w | A6 | ||
| BT Mon | N | 1977, Dec 14 | w | A3 | ||
| KQ Mon | UX | 2001, Mar 01 | w | A3 | ||
| RS Oph | RN | 1993, Aug 05 | w | A3 | ||
| V380 Oph | VY | 2014, Jun 18 | w | A7 | Bruch (2018) | |
| V442 Oph | VY | 1983, Jul 11 | w | A7 | ||
| V2051 Oph | DN | 1985, Aug 10 | w | Q | A10 | Warner & O’Donoghue (1987) |
| CN Ori | DN | 1976, Oct 25 | w | O | A13 | Patterson (1981) |
| RU Peg | DN | 1975, Nov 08 | w | M | A13 | |
| IP Peg | DN | 1990, Oct 26 | B | Q | A10 | |
| GK Per | N | 1978, Dec 04 | w | A4 | ||
| KT Per | DN | 1977, Dec 12 | w | M | A13 | Patterson (1981) |
| RR Pic | N | 1984, Dec 29 | w | A4 | Warner (1986) |
| Name | Type | Obs. | Pass- | photom. | Figure | Reference |
|---|---|---|---|---|---|---|
| Date | band | state | ||||
| AO Psc | IP | 1980, Aug 29 | w | A17 | Warner et al. (1981) | |
| TY PsA | DN | 1987, Jul 29 | w | Q | A10 | Warner et al. (1989) |
| TY PsA | DN | 1984, Sep 23 | w | O | A13 | Warner et al. (1989) |
| TY PsA | DN | 1984, Jun 22 | w | SM | A15 | Warner et al. (1989) |
| CP Pup | N | 1985, Feb 15 | w | A4 | Warner (1985) | |
| V1223 Sgr | IP | 2000, Mai 06 | w | A18 | ||
| V3885 Sgr | UX | 1982, Jul 26 | w | A4 | ||
| VZ Scl | VY | 1985, Aug 11 | w | A7 | O’Donoghue (1987) | |
| WZ Sge | DN | 1977, Sep 10 | w | Q | A11 | Patterson (1980) |
| WZ Sge | DN | 1978, Dez 02 | w | SM | A15 | Patterson et al. (1981) |
| V893 Sco | DN | 2000, May 23 | w | Q | A11 | Bruch (2014) |
| RW Sex | UX | 1989, May 09 | w | A4 | ||
| RW Tri | UX | 1991, Jan 16 | B | A5 | ||
| EF Tuc | DN | 2014, Sep 22 | w | Q | A11 | Bruch (2018) |
| SU UMa | DN | 1978, Dec 23 | w | Q | A11 | |
| SW UMa | DN | 1986, Mar 21 | w | SM | A16 | |
| UX UMa | UX | 1979, May 05 | w | A5 | ||
| IX Vel | UX | 1983, Dec 18 | w | A5 | ||
| TW Vir | DN | 1975, May 17 | w | O | A14 | |
| HV Vir | DN | 1992, Apr 23 | w | SM | A16 | Leibowitz et al. (1994) |
The individual light curves are displayed in Figs. 19 – 23 for classical and recurrent novae, and novalike variables of the UX UMa type subtype, Figs. 24 – 25 for novalike variable of the VY Scl subtype, Figs. 26 – 29 for quiescent dwarf novae, Figs. 30 – 32 for dwarf novae in outburst, Figs. 33 – 34 for SU UMa type dwarf novae during supermaximum, Figs. 35 – 36 for intermediate polars, and Fig. 37 for AM Her stars.
The left hand column of each figure is structured such as to permit a direct comparison between different light curves. The scale in x (time) and y (magnitude) is the same for all. Thus, a section of 4 hours (or less, if the entire duration of the data set is less) of a light curve is shown. The magnitude scale comprises always , independent of the amplitude of the variations in the light curve. This enables a visualization of the relative strength of the flickering in different systems. In the right hand part of each figure a 1 hour subset of the same light curves is shown. Now, the magnitude scale is adapted to the total range of variability of the star within the chosen time frame. This enables a better comparison of the structure of the flickering (e.g., if the variations occur more rapidly or more slowly).
In some light curves the variations are strongly dominated by mechanisms other than flickering. In these cases in right hand part of the figures such variations have been removed by subtracting a smoothed version of the same data. This has been done for the dwarf novae WW Cet, U Gem and IP Peg in quiescence, YZ Cnc, V436 Cen, Z Cha and TY PsA in superoutburst, and the polars V834 Cen, BL Hyi.
This is not the place for a detailed assessment of the light curves shown in the atas. However, some quick remarks are in order.
It is obvious that the strength of the flickering, expressed as the total amplitude of the variations, varies significantly from one system to the next even in systems which are expected to be rather similar in structure. Even ignoring variations on longer time-scales (which may not be related to flickering) the total amplitude can reach 0.5 magnitudes or more; see e.g. KR Aur (Fig. 24) or SU UMa in quiescence (Fig. 29). In other systems, such as IX Vel (Fig. 23), the flickering only occurs on a very small scale of not more than a few hundredths of a magnitude. But on that small scale flickering is definitly present and at first glance has a temporal structure which does not differ drastically from that of systems with much stronger flickering (e.g. V751 Cyg, Fig. 24). Dwarf novae in outburst also often have a small flickering amplitude (see RU Peg and KT Per, Fig. 31). But this is not always the case, as testified by the outburst light curves of Z Cha (Fig. 30), TY PsA (Fig. 31) and TW Vir Fig. 32).
Although complicated by differences in the signal-to-noise level of the present light curves, it can also be said that the temporal structure of the flickering, as seen on the right hand side of the figures, can differ significantly, even for systems of the same type and in the same state. Variations of V442 Cen in outburst (Fig. 30), for instance, appear to occur on a quite small magnitude scale but on comparatively long time scales. Variations of KT Per in outburst (Fig. 31) occur on a similar magnitude scale but much more rapidly.
A quantitative assessment of the flickering variations in different system and light curves is subject of the main part of this paper.
References
- Bruch (2014) Bruch A., 2014, A&A, 566, A101
- Bruch (2016) Bruch A., 2016, New Astr., 46, 60
- Bruch (2018) Bruch A., 2017, New Astr., 52, 117
- Bruch (2018) Bruch A., 2018, New Astr., 58, 53
- Chiapetti et al. (1989) Chiapetti L., Belloni T., Bonnet-Bidaud J.-M., del Gratta C., de Martino D. et al. 1989, ApJ 342, 493
- Kalużny (1989) Kalużny J., 1989, Acta Astron., 39, 235
- Leibowitz et al. (1994) Leibowitz E.M., Mendelson H., Bruch A. et al. 1994, 421, 771
- O’Donoghue (1987) O’Donoghue, D., 1987, ApSS, 136, 297
- Patterson (1979) Patterson J., 1979, AJ, 84, 804
- Patterson (1980) Patterson J., 1980, ApJ, 241, 235
- Patterson (1981) Patterson J., 1981, ApJ Suppl., 45, 517
- Patterson et al. (1981) Patterson J., McGraw J.T., Coleman L., Africano J.L., 1981, ApJ 248, 1067
- Warner (1974) Warner B., 1974, MNRAS, 168, 235
- Warner (1975) Warner B., 1975, MNRAS, 170, 219
- Warner (1985) Warner B., 1985, MNRAS, 217, 1p
- Warner (1986) Warner B., 1986, MNRAS 219, 751,
- Warner & O’Donoghue (1987) Warner B., O’Donoghue D., 1987, MNRAS, 224, 733
- Warner & O’Donoghue (1988) Warner B., O’Donoghue D., 1988, MNRAS, 233, 705
- Warner et al. (1981) Warner B., O’Donoghue D., Fairall A.P., 1981, MNRAS, 196, 705
- Warner et al. (1989) Warner B., O’Donoghue D., Wargau W., 1989, MNRAS, 238, 73
- Zamanov & Bruch (1998) Zamanov R.K., Bruch A., 1998, A&A, 338, 988