The Relative Diffusivities of Bound and Unbound Protein Can Control Chemotactic Directionality
Abstract
Enzyme-based systems have been shown to undergo directional motion in response to their substrate gradient. Here, we formulate a kinetic model to analyze the directional movement of an ensemble of protein molecules in response to a gradient of the ligand. A similar analysis has been performed to probe the motion of enzyme molecules in response to a gradient of the substrate under catalytic conditions. In both cases, a net movement up the ligand/substrate gradient is predicted when the diffusivity of the ligand/substrate-bound protein is lower than that of the unbound protein (positive chemotaxis). Conversely, movement down the ligand/substrate gradient is expected when the diffusivity of the ligand/substrate-bound protein is higher than that of the unbound protein (negative chemotaxis). The work underscores the critical importance of measuring the diffusivity of the bound protein and compare it with that of the free protein.
Pennsylvania State University] Department of Chemical Engineering, Pennsylvania State University, University Park, PA 16802 \alsoaffiliation[Pennsylvania State University] Department of Chemistry, Pennsylvania State University, University Park, PA 16802
![[Uncaptioned image]](/html/2103.13469/assets/images/toc2.jpg)
1 Introduction
Chemotaxis is a phenomenon historically used to describe the motion of organisms like bacteria towards or away from a chemical attractant or repellant1, respectively. Recent studies have shown that ensembles of single enzyme molecules2, 3, 4, 5, as well as enzyme-attached microparticles6, 7, 8, 9, 10, also chemotax in response to a gradient of the substrate. Several theories to this date have been used to describe chemotaxis in enzyme-based systems11. These include space-dependent diffusivity, phoretic mechanisms12, thermodynamically induced drift13. Phoretic mechanisms have not found wide-range experimental support2, 14. Chemotaxis arising from a thermodynamic force has typically been accounted for using a cross-diffusion coefficient13, 15 which dictates the movement of the enzyme towards or away from the substrate. It has also been proposed that enzymes may have different diffusivities when free and substrate-bound12. In this paper, we analyze the phenomenon of chemotaxis from a kinetic standpoint. Using two scenarios, a) substrate binding only and b) catalytic turnover of the substrate, we show that the direction of chemotactic migration depends critically on the relative diffusivities of the free and substrate-bound protein (enzyme). Unlike the previously used Finite Elements Method, we use the Finite Difference Method which is more appropriate for a regular geometry to solve the reaction-diffusion equations16. Typically, equilibrium conditions13 or Michael-Menten kinetics15 has been used previously to derive the thermodynamic force in chemotaxis. We discuss the limits where equilibrium or Michaelis- Menten kinetics can be assumed, and where these assumptions might break down.
2 Methods
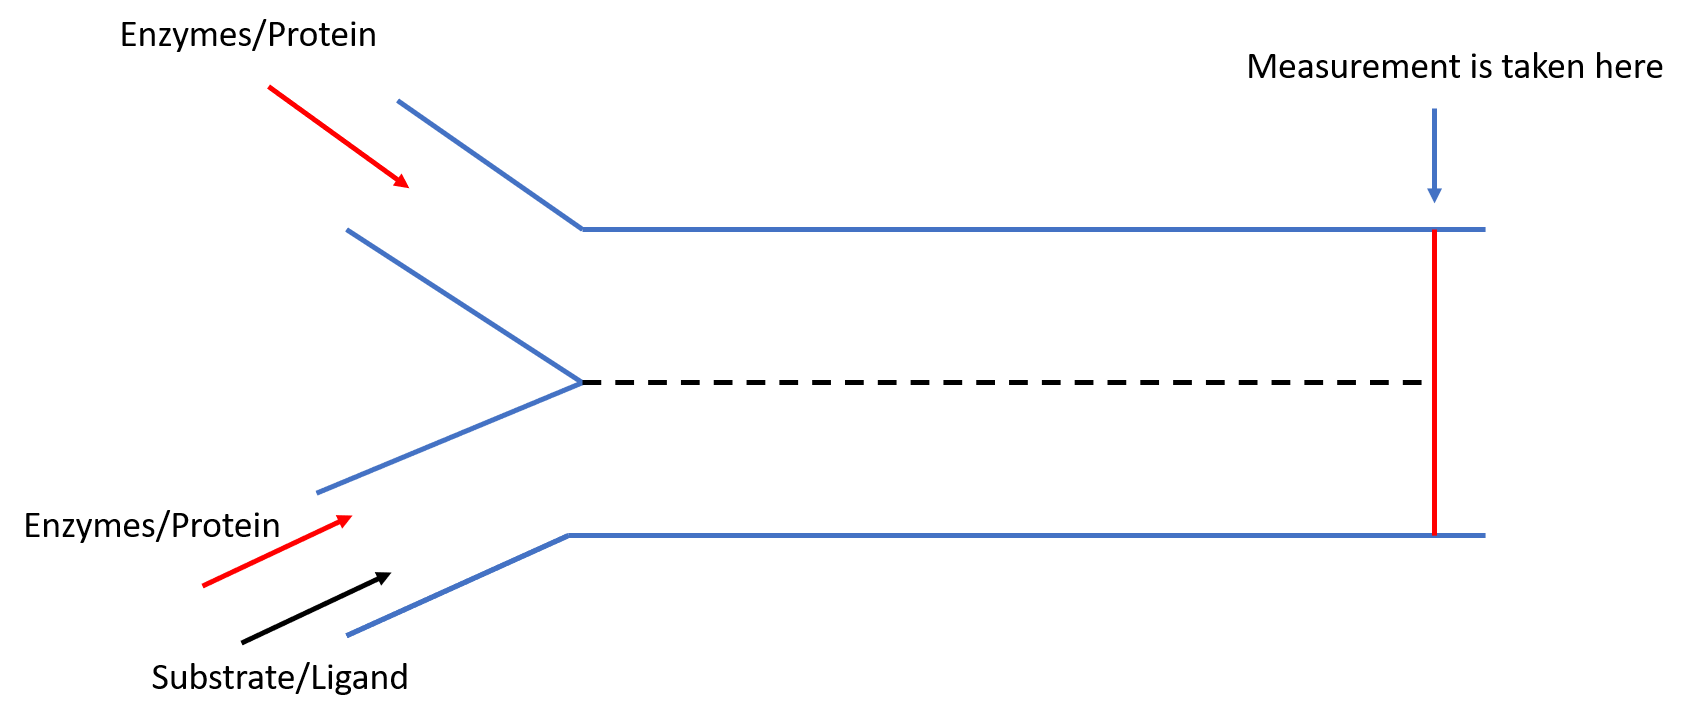
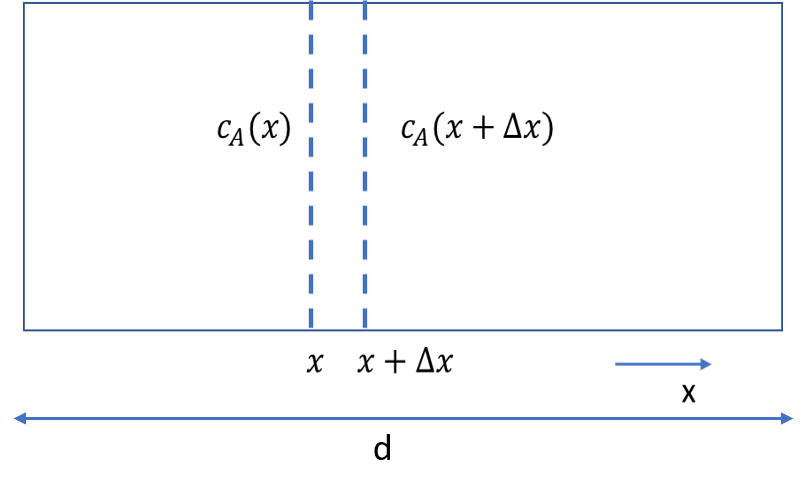
In this section, we develop the relevant equations required to analyze the interaction between enzyme/protein with its substrate/ligand. For the rest of the paper, we refer to protein and ligand when we consider simple binding interactions. For catalytic reactions involving turnover, we use the terms enzyme and substrate. We first develop the equations for a binding interaction and then show how the set of equations changes when a catalytic step is added. We base our work on experiments of chemotaxis in microfluidic channels17, 18, 2, 3, 4 a simple diagram of which is shown in Figure 1. We begin our analysis of chemotaxis by assuming a one-dimensional system with no flow and channel width, . This is shown in Figure 2.
Binding Interaction between a protein and a ligand
Consider a binding reaction between a protein(A) and ligand(B) as follows:
| (1) |
The mass-transfer equations then can be written for all three species in the system, namely A, AB, and B 19:
| (2) |
| (3) |
| (4) |
Here and stands for the concentration and the diffusion coefficient of the species respectively. We now want to investigate whether the assumption of equilibrium condition be universally valid for this system. The initial concentration of the protein and ligand in the system are and respectively. The concentration of the protein-ligand complex can be scaled with equilibrium assumption. The dissociation constant is given by . Then the variables can be scaled as follows20:
| (5) |
Non-dimensionalizing Eq. 2 - 4 leads to the following equations:
| (6) |
| (7) |
| (8) |
Non-dimensionalizing the mass-transfer equations give us the three Damkohler numbers for the system which are . The Damkohler numbers represent the ratio of time taken for diffusion to the time taken for reaction. For example, in Eq. 6 the characteristic time for diffusion is and the characteristic time for reaction is , hence the Damkolher number for Eq. 6 is . The inverse of the Damkohler’s numbers are characterized by the constants , and . and are ratio of diffusivity of bound-protein and the free protein and the ligand and the free protein respectively. These constants appear in the mass-balance equations as evident from Eq. 6-Eq. 8.
At this point, we want to investigate whether we can assume equilibrium for the binding reaction in the domain. First, we introduce a notation of (read big-O). The big-O notation describes the limiting behavior of a function or a constant when the parameters of the domain are changed. To illustrate, if there exists a positive number such that for all positive values of . Now, the condition for equilibrium is that the forward rate of reaction must be equal to the backward rate of reaction. Thus one can write the following equations to characterize the equilibrium condition.
| (9) |
| (10) |
Eq. 10 is obtained from Eq 9 by applying the scaling of the respective variables from Eq. 5. Observing Eq. 7 one can see that Eq. 10 can be obtained from Eq. 7 if the time derivative() and the spatial derivative() are extremely small compared to the rest of the terms of Eq. 7. The ratio of the diffusivity of the bound and the free enzyme, is , a constant. Thus for the equilibrium condition to hold we need , then only Eq.7 will yield Eq.10.
Also, is . For example, diffusivity of hexokinase reported previously is 15 and the diffusivity of glucose is reported to be 21 which means that which is . Therefore or will also yield Eq.10 from Eq.8 and Eq.6 respectively. Overall one needs to be much less than O(1) for the equilibrium condition to hold. This suggests that the equilibrium assumption cannot be used universally and even though most enzymes that have been used for chemotaxis experiments fulfil the aforementioned criterion we must be wary of them breaking down especially when the width of our channel narrows down significantly, or when the time taken to reach equilibrium is large. One can show using some crude assumptions(see SI) that the time for a system to reach equilibrium varies as . When the domain length narrows down considerably, the time scale of diffusion, will be comparable to the time taken to reach equilibrium(). In such a circumstance, one cannot assume instantaneous equilibrium in the system.
For this paper we have selected systems where the equilibrium will be valid. In such cases where the rate of the reaction is fast enough to make the time taken to reach equilibrium much smaller than the time taken for the protein to diffuse through the channel, one can simplify equations to the following:
| (11) |
| (12) |
Here is the total protein concentration evaluated by adding Eq. 2 and 3. It is convenient to define the bound protein diffusivity as 12. A positive means that the bound protein has a higher diffusivity than the free protein. When is negative the diffusivity of the bound protein is lower than the free protein. The derivation of Eq. 11 and 12 is then completed by equilibrium assumptions and . We now non-dimensionlize the equations using the following parameters and obtain the final equations:
| (13) |
| (14) |
| (15) |
Eq. 14 and 15 has been used for solving the concentration profiles in the 1D system shown in Figure 2.
Enzymatic catalysis
An enzymatic reaction between an enzyme(E), substrate(S) and product(P) can be described as follows:
| (16) |
The approach for analysing the reaction in Eq 16 remains same as that for the binding case except that the system never reaches equilibrium because of the irreversible catalytic step. It however can reach a pseudo-steady state where following relation hold:
| (17) |
The criterion for this relation to hold is to have large Damkolher numbers, . The detailed description of the validity of Eq. 17 has been provided in the SI. Following the same approach of simplification and non-dimensionalization(the details of which can be found in the SI) as before we get the following final equations for the system involving enzymatic reaction:
| (18) |
| (19) |
Here stand for the non-dimensionalized enzyme and substrate concentration respectively. has the same definition as the previous section. is the ratio of diffusivity of the substrate to the diffusivity of the free enzyme. is the Michaelis-Menten constant. Eq. 18 and 19 has been used for solving the concentration profiles in the 1D system shown in Figure 2.
3 Results
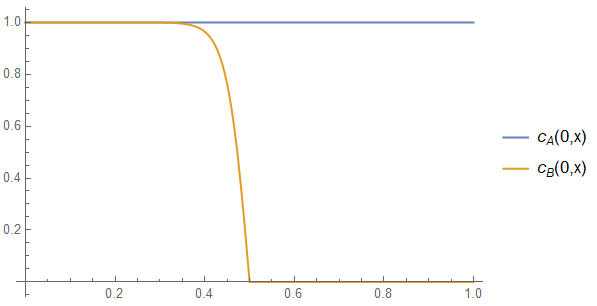
For both binding interaction and the enzymatic reaction, we have chosen a 1D geometry of width . We have placed at time a uniform concentration of protein/enzyme in the domain. The initial substrate concentration is however present at only one-half of the domain from to . The boundary condition at each end of the domain is a no-flux condition because the walls are impermeable. The initial conditions of the substrate and the enzyme in the domain can be seen in Figure 3. Our goal is to see the time evolution of the concentration of total enzyme in this system for various values of . This analysis would tell us how might affect chemotaxis in a time-dependent manner.
Binding Interactions
We have summarized here the results for binding reaction described in Eq. 1. We have selected hexokinase as our protein which reversibly binds with glucose to form an inactive complex in the absence of ATP in the system22. The forward and the backward reaction rates are and respectively23. Diffusivity of hexokinase is taken to be . Diffusivity of glucose is taken to be 10 times faster than hexokinase. For our modeling, we set the initial ligand/protein concentration ratio at .
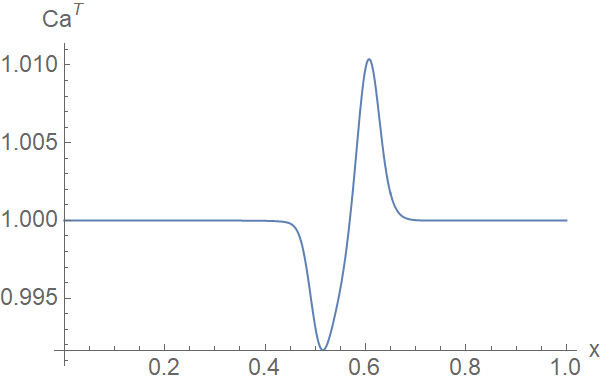
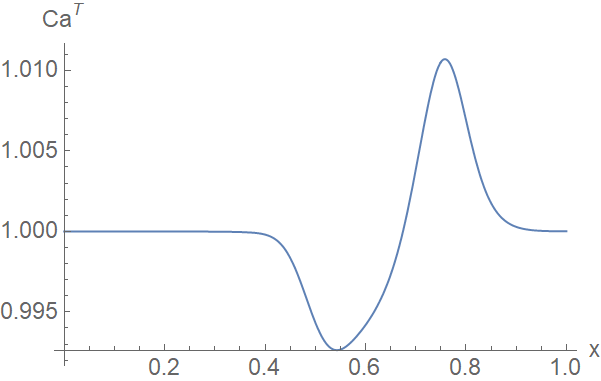
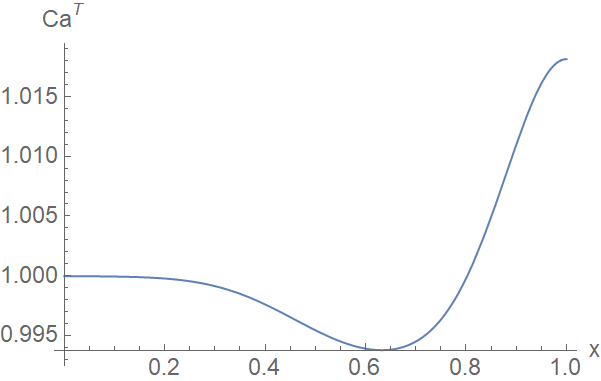
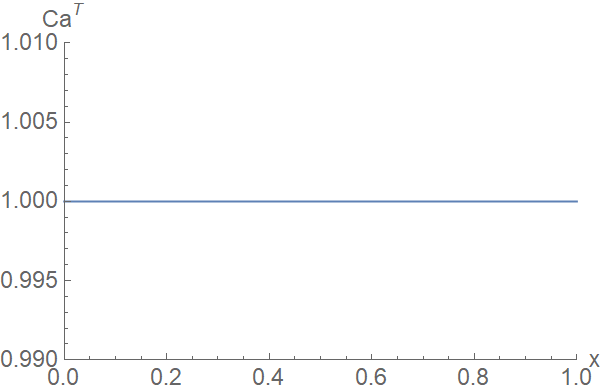
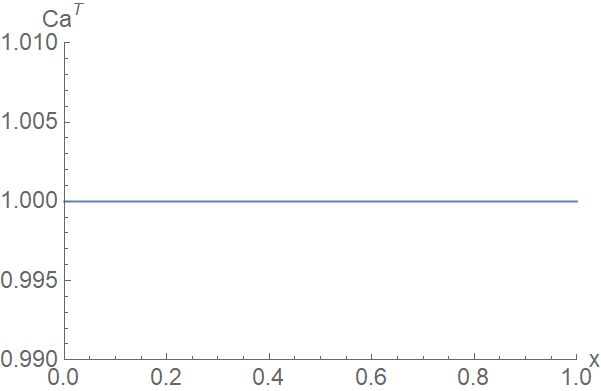
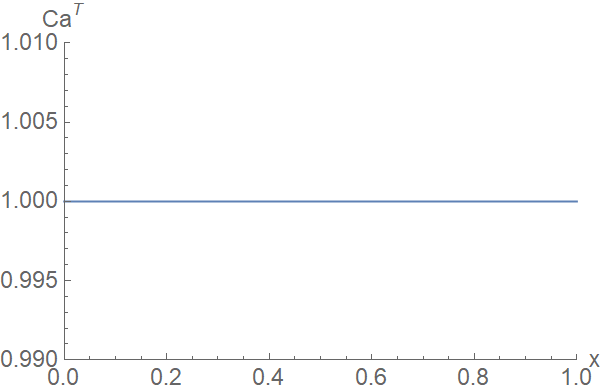
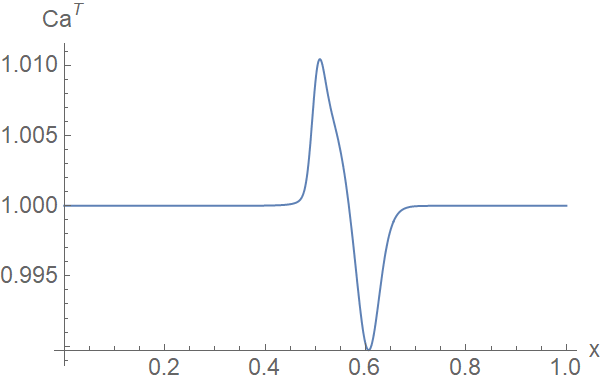
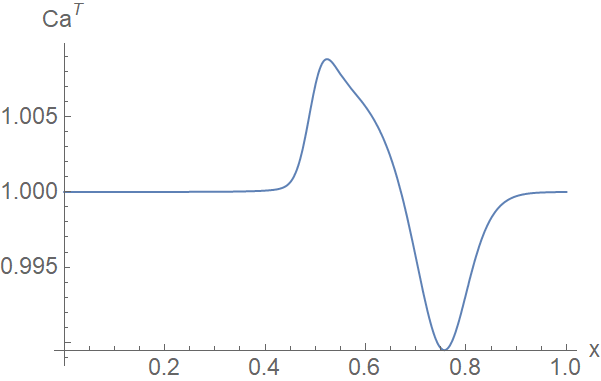
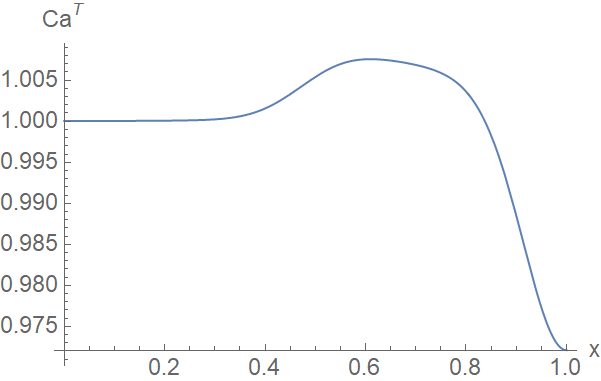
Figure 4 shows us the evolution of the concentration profile of total protein with time in the 1-D domain for three values of , one positive, one negative, and one zero. The time here is non-dimensionalized according to Eq. 13. With the parameters for hexokinase, the diffusion time scale turns out to be . That means non-dimensionalized time of corresponds to which is typically the time used for chemotaxis experiments. The zero value for alpha shows that there will be no change in the concentration profile of the protein. Due to the conservation of protein mass and since the initial protein concentration is uniform everywhere the gradient of free protein and bound protein are equal in magnitude but act in opposite direction. We should note that the concentration of the free protein decreases in the direction of increasing substrate concentration since the concentration of the free protein will be higher at positions with less substrate. The opposite is true for the bound protein whose concentration increasing in the direction of increasing substrate concentration since bound protein will be found in higher concentration at positions where there is higher substrate concentration. The mass flux of total protein concentration is related to the concentration gradient of the free and bound species as follows:
| (20) |
The zero value for alpha shows that there will be no change in the concentration profile of the protein since and the two terms in Eq 20 will cancel each other. For positive values of , i.e, when the second term in Eq 20 which is the mass-flux for bound protein, will be larger. The direction of this larger term is along decreasing concentration of substrate. Hence we will see that the total protein concentration will shift towards the direction of decreasing substrate concentration. This will result in negative chemotaxis. When the values are negative we see the reverse effect happens. Now the gradient of the free protein has a greater contribution to the flux because of a higher diffusivity of the free protein. Since the gradient of the free protein is in the direction of increasing substrate concentration the protein will move towards the center of the channel. This is indeed what has been experimentally observed in microchannels15. From these results, it would seem that negative values of which correspond to a less diffusive bound protein will lead to positive chemotaxis.
Enzymatic Catalysis
The same system of hexokinase has been analysed with an overall catalytic step that has a rate constant of . For our modeling, we set the initial substrate/enzyme concentration ratio at . We now solve for equations Eq. 18 and 19.
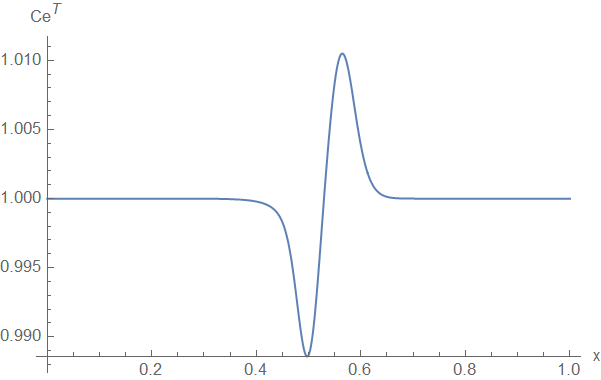
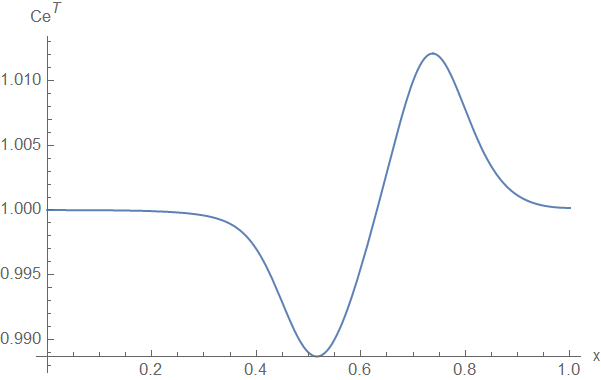

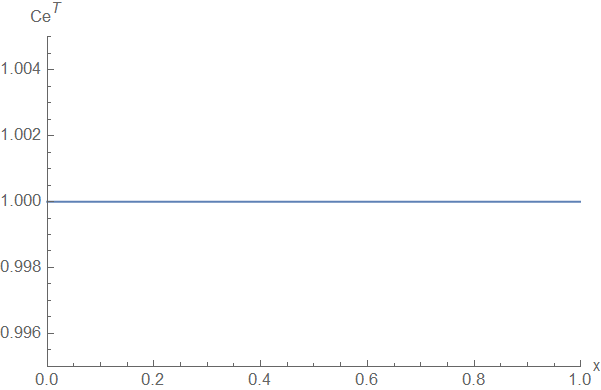
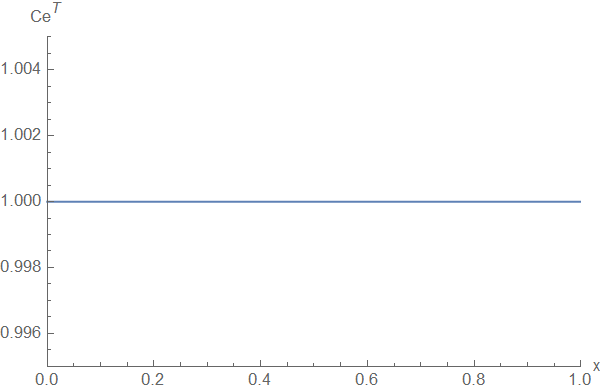
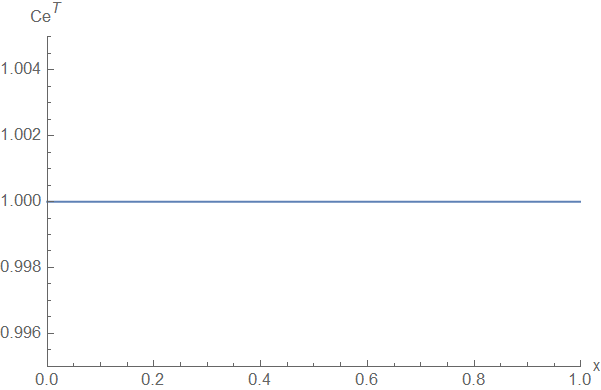
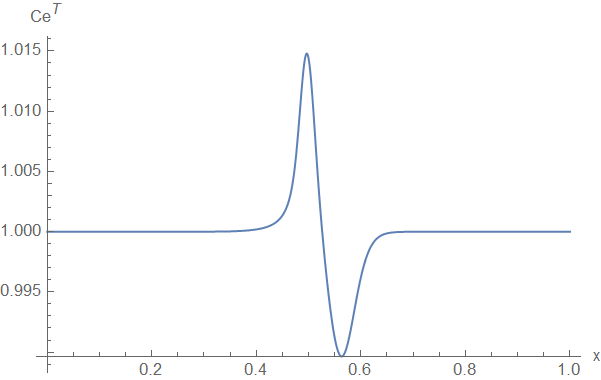
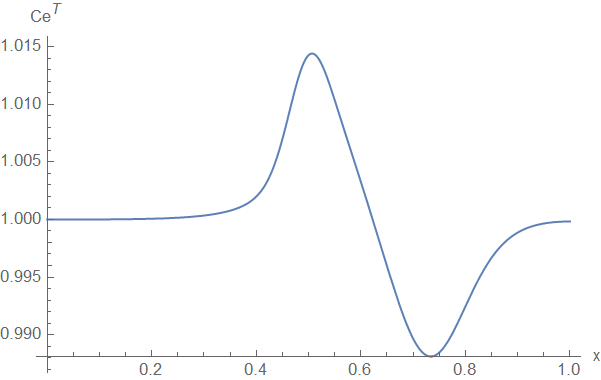
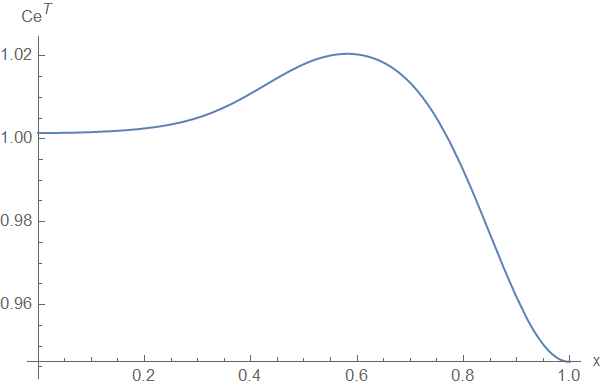
Figure 5 shows the evolution of the total enzyme concentration with time for different values of . Similar to the binding interactions we see a reaction-front going away from the substrate for and moving towards the substrate for . This would again suggest that for the focusing of enzymes to occur towards a higher concentration of substrate we will need . Compared to a simple binding interaction, the simulated concentration profile of the total enzyme develops faster because of catalysis.
4 Discussion
The primary deduction from the results shown above is that for positive chemotaxis to occur the diffusivity of the bound protein/enzyme must be lower than the free protein/enzyme. A higher diffusivity of the bound protein/enzyme will lead to the migration of the protein/enzyme away from the substrate, i.e. negative chemotaxis. Thus, it is critically important to measure the diffusivities of the free protein/enzyme and ligand/substrate-bound protein/enzyme.
Reconciliation with theories on cross-diffusion
Previous theories of enzyme chemotaxis have been based on cross-diffusion of an enzyme in response to a gradient of substrate4, 13, 15. The overall approach for such a theory has been to use the total enzyme concentration at equilibrium in the system to characterize cross-diffusion. The focus is on the increased mass flux of free enzyme given the fact their equilibrium concentration will be lower than their original concentration because of the presence of the substrate. This paper through kinetic analysis explains the same idea without having to characterize a cross-diffusion phenomenon. We have also shown that the equilibrium assumption is not always valid and hence the basic formulation for any chemotactic system should always begin with Eq 2- 4. Starting from this point we can decide whether equilibrium or a pseudo-steady state assumption will be valid. The examples we have taken have high Damkolher numbers and have been selected because experimental observations are available for these enzymes.
Why cannot we ignore diffusion of bound enzyme/protein species?
We have seen through our analysis that bound protein/enzyme gradient exists in the direction of decreasing substrate concentration and hence diffuse in the direction opposite to the free enzyme. In a previous article Mohajerani et al. explained chemotaxis by suggesting that the bound enzymes do not cross-diffuse15. This assumption corresponds to our case of . That will be a limiting case where the bound protein/enzyme diffusivity will be exactly zero and both the self-diffusion and the cross-diffusion of the bound protein/enzyme are ignored. For other values of , we will need to include the bound protein/enzyme diffusivity.
5 Conclusion
In this paper, we have shown how chemotaxis can be explained using kinetic analysis. We have formulated separate kinetic models for reactions with and without a turnover step, analyzed the validity of the equilibrium and the pseudo-steady-state assumptions in a mass transfer system, and discussed the conditions under which these assumptions are valid. For our modeling, we have assumed instantaneous achievement of equilibrium or pseud-steady state condition and hence we recognize that while our results are valid for the time scale of diffusion, the concentration profile at extremely small times needs to be explored. We have shown using numerical simulations how the difference in diffusivity between the free and bound enzyme manifests itself in a 1D domain. We see from the results that it is critically important to measure the diffusivity of the bound protein/enzyme and compare it with that of the free protein/enzyme. While a net increase in diffusion has been observed for enzymes during catalysis24, 15, 25, 14, 26, 27, this increase in diffusion should not a priori lead to the conclusion that the bound enzyme diffuses faster than the unbound counterpart. The enhancement in diffusion in active enzyme systems may also arise from thermodynamic driving forces associated with the binding and/or the turnover step28.
We have also introduced in this area the practice of using finite difference methods rather than finite element methods. Finite difference methods being a differential scheme are faster than integral methods like FEM. At the same time for domains that are well described with cartesian systems like lines and rectangles, the finite difference method can increase its accuracy vastly by refining its grid.
The authors thank Prof Igor Aronson and Prof Ali Borhan for their insights in the way differential equations can be solved, and in understanding the scaling of variables for the governing equations. We acknowledge financial support by the Department of Energy, Office of Basic Energy Sciences (DOE-DE-SC0020964).
Kinetic analysis of enzyme catalysis, calculation of time taken to reach equilibrium, and simulation details. The information is available free of charge at https://pubs.acs.org/
References
- Berg 2003 Berg, H. C. Chemotaxis in Bacteria. Annu. Rev. Biophys. Bioeng. 2003, 125, 1128–1129
- Sengupta et al. 2013 Sengupta, S.; Dey, K. K.; Muddana, H. S.; Tabouillot, T.; Ibele, M. E.; Butler, P. J.; Sen, A. Enzyme molecules as nanomotors. J. Am. Chem. Soc. 2013, 135, 1406–1414
- Dey et al. 2014 Dey, K. K.; Das, S.; Poyton, M. F.; Sengupta, S.; Butler, P. J.; Cremer, P. S.; Sen, A. Chemotactic separation of enzymes. ACS Nano 2014, 8, 11941–11949
- Zhao et al. 2018 Zhao, X.; Palacci, H.; Yadav, V.; Spiering, M. M.; Gilson, M. K.; Butler, P. J.; Hess, H.; Benkovic, S. J.; Sen, A. Substrate-driven chemotactic assembly in an enzyme cascade. Nat. Chem. 2018, 10, 311–317
- Jee et al. 2018 Jee, A. Y.; Dutta, S.; Cho, Y. K.; Tlusty, T.; Granick, S. Enzyme leaps fuel antichemotaxis. Proc. Natl. Acad. Sci. U. S. A. 2018, 115, 14–18
- Somasundar et al. 2019 Somasundar, A.; Ghosh, S.; Mohajerani, F.; Massenburg, L. N.; Yang, T.; Cremer, P. S.; Velegol, D.; Sen, A. Positive and negative chemotaxis of enzyme-coated liposome motors. Nat. Nanotechnol. 2019, 14, 1129–1134
- Dey et al. 2015 Dey, K. K.; Zhao, X.; Tansi, B. M.; Méndez-Ortiz, W. J.; Córdova-Figueroa, U. M.; Golestanian, R.; Sen, A. Micromotors Powered by Enzyme Catalysis. Nano Lett. 2015, 15, 8311–8315
- Ji et al. 2019 Ji, Y.; Lin, X.; Wu, Z.; Wu, Y.; Gao, W.; He, Q. Macroscale Chemotaxis from a Swarm of Bacteria-Mimicking Nanoswimmers. Angew. Chemie - Int. Ed. 2019, 58, 12200–12205
- Joseph et al. 2017 Joseph, A.; Contini, C.; Cecchin, D.; Nyberg, S.; Ruiz-Perez, L.; Gaitzsch, J.; Fullstone, G.; Tian, X.; Azizi, J.; Preston, J.; Volpe, G.; Battaglia, G. Chemotactic synthetic vesicles: Design and applications in blood-brain barrier crossing. Sci. Adv. 2017, 3
- Wang et al. 2020 Wang, J.; Toebes, B. J.; Plachokova, A. S.; Liu, Q.; Deng, D.; Jansen, J. A.; Yang, F.; Wilson, D. A. Self-Propelled PLGA Micromotor with Chemotactic Response to Inflammation. Adv. Healthc. Mater. 2020, 9, 1–8
- Feng and Gilson 2020 Feng, M.; Gilson, M. K. Enhanced Diffusion and Chemotaxis of Enzymes. Annu. Rev. Biophys. 2020, 49, 87–105
- Agudo-Canalejo et al. 2018 Agudo-Canalejo, J.; Illien, P.; Golestanian, R. Phoresis and Enhanced Diffusion Compete in Enzyme Chemotaxis. Nano Lett. 2018, 18, 2711–2717
- Schurr et al. 2013 Schurr, J. M.; Fujimoto, B. S.; Huynh, L.; Chiu, D. T. A theory of macromolecular chemotaxis. J. Phys. Chem. B 2013, 117, 7626–7652
- Zhao et al. 2018 Zhao, X.; Gentile, K.; Mohajerani, F.; Sen, A. Powering Motion with Enzymes. Acc. Chem. Res. 2018, 51, 2373–2381
- Mohajerani et al. 2018 Mohajerani, F.; Zhao, X.; Somasundar, A.; Velegol, D.; Sen, A. A Theory of Enzyme Chemotaxis: From Experiments to Modeling. Biochemistry 2018, 57, 6256–6263
- Blazek 2015 Blazek, J. Computational Fluid Dynamics: Principles and Applications, 3rd ed.; Elsevier Science & Technology: Waltham, MA, 2015
- Lin and Butcher 2006 Lin, F.; Butcher, E. C. T cell chemotaxis in a simple microfluidic device. Lab Chip 2006, 6, 1462–1469
- Diao et al. 2006 Diao, J.; Young, L.; Kim, S.; Fogarty, E. A.; Heilman, S. M.; Zhou, P.; Shuler, M. L.; Wu, M.; DeLisa, M. P. A three-channel microfluidic device for generating static linear gradients and its application to the quantitative analysis of bacterial chemotaxis. Lab Chip 2006, 6, 381–388
- Fogler 2006 Fogler, S. H. Elements of Chemical Reaction Engineering, 4th ed.; Pearson: Essex, United Kingdom, 2006
- Deen 2012 Deen, W. M. Analysis of Transport Phenomena, 2nd ed.; Oxford University Press: New York, 2012
- Ziegler et al. 1987 Ziegler, G. R.; Benado, A. L.; Rizvi, S. S. Determination of Mass Diffusivity of Simple Sugars in Water by the Rotating Disk Method. J. Food Sci. 1987, 52, 501–502
- Wilkinson and Rose 1981 Wilkinson, K. D.; Rose, I. A. Study of crystalline hexokinase-glucose complexes by isotope trapping. J. Biol. Chem. 1981, 256, 9890–9894
- Wilkinson and Rose 1979 Wilkinson, K.; Rose, I. Isotope trapping studies of yeast hexokinase during steady state catalysis. J. Biol. Chem. 1979, 254, 12567–12572
- Muddana et al. 2010 Muddana, H. S.; Sengupta, S.; Mallouk, T. E.; Sen, A.; Butler, P. J. Substrate catalysis enhances single-enzyme diffusion. J. Am. Chem. Soc. 2010, 132, 2110–2111
- Zhang and Hess 2019 Zhang, Y.; Hess, H. Enhanced Diffusion of Catalytically Active Enzymes. ACS Cent. Sci. 2019, 5, 939–948
- Xu et al. 2019 Xu, M.; Ross, J. L.; Valdez, L.; Sen, A. Direct Single Molecule Imaging of Enhanced Enzyme Diffusion. Phys. Rev. Lett. 2019, 123, 1–5
- Riedel et al. 2015 Riedel, C.; Gabizon, R.; Wilson, C. A.; Hamadani, K.; Tsekouras, K.; Marqusee, S.; Pressé, S.; Bustamante, C. The heat released during catalytic turnover enhances the diffusion of an enzyme. Nature 2015, 517, 227–230
- Jee et al. 2020 Jee, A. Y.; Tlusty, T.; Granick, S. Master curve of boosted diffusion for 10 catalytic enzymes. Proc. Natl. Acad. Sci. U. S. A. 2020, 117, 29435–29441