Characterizing the X-ray Emission of Intermediate-Mass Pre-Main-Sequence Stars
Abstract
We use X-ray and infrared observations to study the properties of three classes of young stars in the Carina Nebula: intermediate-mass pre-main sequence stars (IMPS), late-B and A stars on the zero-age main sequence (AB), and lower-mass T Tauri stars (TTS). We divide our sources among these three sub-classifications and further identify disk-bearing young stellar objects versus diskless sources with no detectable infrared (IR) excess emission using IR (1–8 m) spectral energy distribution modeling. We then perform X-ray spectral fitting to determine the hydrogen absorbing column density (), absorption-corrected X-ray luminosity (), and coronal plasma temperature () for each source. We find that the X-ray spectra of both IMPS and TTS are characterized by similar and , and on average /. IMPS are systematically more luminous in X-rays (by 0.3 dex) than all other sub-classifications, with median erg s-1, while AB stars of similar masses have X-ray emission consistent with TTS companions. These lines of evidence converge on a magneto-coronal flaring source for IMPS X-ray emission, a scaled-up version of the TTS emission mechanism. IMPS therefore provide powerful probes of isochronal ages for the first 10 Myr in the evolution of a massive stellar population, because their intrinsic, coronal X-ray emission decays rapidly after they commence evolving along radiative tracks. We suggest that the most luminous (in both X-rays and IR) IMPS could be used to place empirical constraints on the location of the intermediate-mass stellar birth line.
1
1 Introduction
The observed X-ray emission of low-mass, T Tauri stars (TTS) is primarily coronal in origin (e.g., Preibisch et al., 2005; Stassun et al., 2006, 2007; Telleschi et al., 2007). TTS coronae are roughly an order of magnitude hotter than the solar corona, and more X-ray luminous than the Sun by up to a factor of (Preibisch et al., 2005, herafter P05). P05 derived – and – relationships for low-mass pre-main-sequence (PMS) stars (0.1–2 ) observed as part of the Chandra Orion Ultradeep Project (COUP; Getman et al., 2005). Among the 870 X-ray detected stars in the COUP optical sample (a subset of stellar members from Hillenbrand, 1997), only 20 () low-mass stars () produced total-band (0.5–8 keV) erg s-1, but the majority of intermediate-mass stars (2–3 ) exceeded this luminosity threshold (see Fig. 3 of P05).
High-quality X-ray sources in the COUP sample were generally well-fit by two-temperature thermal plasma models, with a characteristic softer component at MK and a harder component ranging over 20 MK MK, with a steeply increasing function of observed X-ray flux (P05). While the actual distribution of plasma temperatures within coronally-active stars is certainly more complicated and varied (Güdel et al., 2007), a simple 2-component thermal plasma model is generally adequate to fit the observed spectra of faint X-ray sources (Getman et al., 2010).
Coronal TTS X-ray emission indicates the presence of a strong surface magnetic field (Stassun et al., 2006, 2007), with typical mean field strengths 1-5 kG (Alecian et al., 2019; Sokal et al., 2020). The dynamos producing these magnetic fields are driven by convective interior structure, typical of low-mass TTS evolving along Hayashi tracks. In the case of intermediate-mass, PMS stars (IMPS; 2–4 ) the development of a radiative interior marks the beginning of a rapid decline in observed X-ray emission (Mayne et al., 2007; Mayne, 2010; Gregory et al., 2016; Getman & Feigelson, 2021). IMPS with spectral types G through early K are the progenitors of zero-age main sequence (ZAMS) late-B through A-type stars. Fully-radiative AB stars possess neither magnetic dynamos nor sufficiently strong winds to power the shock-driven X-rays This implies that any intrinsic X-ray emission from convective IMPS should disappear over timescales shorter than the Myr ZAMS arrival times of stars (Siess et al., 2000; Haemmerlé et al., 2019).
The stellar initial mass function (IMF), coupled with shorter PMS evolutionary timescales, makes IMPS rare compared to lower-mass TTS, hence statistically robust samples of X-ray emitting IMPS can only be studied in very young, very massive star-forming regions. The Chandra Carina Complex Project (CCCP; Townsley et al., 2011) covered 1.42 deg2 of the Great Nebula in Carina with the Chandra X-ray Observatory, revealing young stellar members as X-ray point sources (Broos et al., 2011b, a). As part of CCCP, Povich et al. (2011) analyzed the Spitzer Space Telescope point-source population to produce a Pan-Carina YSO catalog of 1432 young stellar objects with mid-infrared excess emission from circumstellar disks and infalling envelopes, 410 of which were also detected in X-rays. Based on the spectral energy distribution (SED) modeling of these predominantly intermediate-mass YSOs, Povich et al. (2011) found that X-ray detection correlated with cooler stellar photospheres and higher disk masses, both indicators of earlier evolutionary ages. These results provided the first indication that convection-driven, magneto-coronal X-ray emission was present in the Carina IMPS population. Povich et al. (2019, hereafter P19) presented a detailed study of 2269 CCCP X-ray sources whose Spitzer counterparts lacked detectable 4.5 m excess emission to constrain the duration of star formation in various sub-regions within the complex. The fraction of X-ray detected, intermediate-mass stars is lower in more evolved populations (the Tr 15 cluster and distributed populations, 6–10 Myr) compared to the younger clusters (Tr 14 and 16, Myr). The highly time-dependent nature of IMPS X-ray emission can provide new insights into both stellar properties and evolutionary timescales within young, massive star-forming regions.
In this paper we fit thermal plasma models to 370 of the brightest CCCP X-ray sources, excluding those associated with known or candidate OB stars (Gagné et al., 2011; Povich et al., 2011; Alexander et al., 2016). Using the novel IR SED modeling technique developed by P19, we classify sources as IMPS (including a special sub-category of partially-radiative, R-IMPS), TTS, late-B and A-type (AB) stars on the ZAMS, or unclassified sources that could not be confidently placed into any one of the former categories. We investigate trends in X-ray emission properties, including thermal plasma temperature, hydrogen absorbing column density, and X-ray luminosity, both within and across these classes. We also analyze both the X-ray and IR properties to investigate the – and – relationships across the often-neglected 2–4 mass range.
This paper is structured as follows. In Section 2 we describe our data, source selection criteria, and the IR SED and X-ray spectral model fitting. In Section 3 we analyze physical properties from the X-ray spectral analysis results. In Section 4 we discuss trends across classifications, – and – relations, and several interesting individual IMPS. In Section 5 we summarize our conclusions.
2 Sample Selection
2.1 IR and X-ray Observations
Our study sample is drawn from 410 YSOs and 3657 “diskless” (no excess emission above a stellar photosphere at 4.5 m) stars positionally matched to X-ray point-sources in the CCCP catalog (Broos et al., 2011b; Povich et al., 2011, 2019). The Spitzer Space Telescope Vela-Carina Survey Point Source Archive provided mid-infrared (MIR) photometry from IRAC (at 3.6, 4.8, 5.6, and 8.0 m; Fazio et al., 2004), as well as near-infrared (NIR) JHKS photometry from the Two-Micron All Sky Survey (2MASS) Point Source Catalog (Skrutskie et al., 2006). The Vela-Carina data have spatial resolution and typical sensitivity of mag (less sensitive in regions of bright MIR nebulosity). For YSOs, Povich et al. (2011) additionally provided Spitzer/MIPS 24 m photometry detections or upper limits. CCCP X-ray point sources were observed with the Chandra/ACIS-I detector, (Garmire et al., 2003), with positional, photometric, temporal, and spectral information obtained using ACIS Extract (Broos et al., 2010). We restrict our sample to the brightest CCCP X-ray sources, those with net counts (in the full ACIS 0.5–8 keV energy band) and significance to ensure reliable spectral analysis. There were 1,049 sources from the CCCP sample that fit our X-ray selection criteria.
2.2 Cleaning the Initial Sample
Not all of the sources in our initial sample were genuine low- or intermediate-mass young stars in the Carina Nebula. Our selection criteria may include massive, OB members of the Carina Nebula and contaminating foreground stars.
To identify residual foreground stars that were not previously flagged as contaminants by Broos et al. (2011a), P19 used parallax information from Gaia DR2 (Gaia Collaboration et al., 2018) for all available sources to distinguish between members and non-members of Carina. There were 19 sources in our initial X-ray bright sample with parallaxes that were consistent with being foreground sources; we excluded these.
2.3 IR Source Classification from SED Modeling
Following Povich et al. (2011, 2019), we divide the MIR counterparts of X-ray sources into two broad categories: YSOs with excess 4.5 m emission consistent with circumstellar disks (usually coupled with excess 5.8 m and 8.0 m emission), and stars with no excess emission at 4.5 m and hence no warm dust disks. These “diskless” stars may have (1) 5.8 and/or 8.0 m detections consistent with a Rayleigh-Jeans spectrum, (2) no photometric detection at wavelengths longer than 4.5 m, or (3) marginal IR excess emission at 5.8 m or 8.0 m. In cases (2) or (3) the stars could still possess disks with large inner holes, and in all three cases the stars could still possess debris disks that would produce excess emission at m wavelengths. These classifications were determined by fitting model spectral energy distributions (SEDs) to the 1–8 m broadband photometry of all sources.
Diskless SEDs were fit with a set of 100,000 “naked” stellar photosphere PMS models (P19) using the Robitaille et al. (2007) SED fitting tool. These models sample a range in stellar mass and age ( and ), then convert these properties to the corresponding photospheric temperature and radius ( and ) using PMS evolutionary tracks (Siess et al., 2000; Bernasconi & Maeder, 1996). For SEDs showing IR excess (the minority of our sample), we use the Robitaille et al. (2006) YSO model fit parameters published by Povich et al. (2011). For both YSOs and diskless SED models, we assumed the Indebetouw et al. (2005) extinction curve, which introduced a new free parameter, , allowed to vary from 0 to 15 mag (P19). Sources for which no SED models provided satisfactory fits according to the criteria of Povich et al. (2011) or P19 were excluded from our sample.
Using the methodology developed by P19, the likelihood of each model fit to a given SED is weighted individually using two distinct, mass- and age-dependent weighting functions, one based on the disk destruction timescale (see Povich et al., 2016, and references therein) and the other on the X-ray emission decay timescale for PMS stars from Gregory et al. (2016, hereafter G16). The result is a set of probability distributions for the model stellar parameters , , , and .
We classify each source into one of four temperature–mass () classifications: IMPS, TTS, AB stars (A and late B-type stars on or near the ZAMS in the same mass range as IMPS, including Herbig Ae/Be stars), or massive OB stars. We combine the weighted and probability distributions for each source into a two dimensional weighted probability distribution () to determine the relative probability of each source being any particular class. Preliminary Class Distributions are summed to a single value that we define as Preliminary Class probabilities () to compare the relative likelihood of all Preliminary Classes to one another. We define the pairings using
| (1) |
To make the final classifications, we compare the two most probable preliminary class probabilities to one another, according to
| (2) |
where (and ) are the preliminary class probabilities defined in Equation 1 for the first- (TM1) and second-most (TM2) probable -Classes for an individual SED. “U” designations are given to sources that remain unclassified based on this criterion. Sources that were classified as OB stars, 30 in total, were removed from our sample.
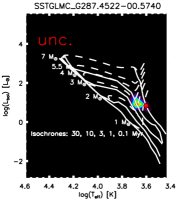
To visualize these Classes we constructed Probabilistic H-R Diagrams (pHRDs, see P19) by summing the probability distributions for all sources in a given Class. The pHRDs for three Classes plus unclassified are plotted as two-dimensional histograms in the four panels of Figure 1 (the OB class is excluded and would extend above the maximum plotted here). These pHRDs demonstrate that even the TTS sources in our sample are typically more massive than the Sun, which reflects both the relatively shallow IR photometry and our selection of the brightest CCCP X-ray sources. U sources consist primarily of stars whose SED model fits straddled the mass cutoff separating IMPS from TTS; based on the IMF the majority of U sources are likely T Tauri stars.
| aaSum of all rows in a single column. The total number of sources per population = 1T + 2T or + Free. There are 370 total sources. | Initial | Reclass | Final | ||
|---|---|---|---|---|---|
| Class | (K) | () | §2.1–2.3 | §2.4 | §2.5 |
| IMPS | 2–8 | 57 | 59 | 54 | |
| R-IMPS | bbfootnotemark: | 2–8 | 24 | 23 | |
| TTS | 194 | 196 | 176 | ||
| AB | 2–8 | 52 | 39 | 35 | |
| U | 102 | 84 | 82 | ||
| All | 405 | 402 | 370 |
K is the canonical value for an F0 V star.
bbfootnotemark: R-IMPS classifications require spectroscopic .
2.4 Stars with Spectroscopically-Measured Effective Temperatures
Damiani et al. (2017, hereafter D17) analyzed optical spectra of sources in the Trumpler (Tr) 14 and 16 clusters in Carina obtained as part of the Gaia-ESO survey with the FLAMES/Giraffe multi-fiber spectrometer at the ESO VLT/UT2 telescope. They broadly separated their sources into early-type and late-type stars, and for the latter they reported a spectroscopically-measured effective temperature for each star. We compared our samples and found no matches to their early-type stars but found 64 matches to their late-type stars (13 AB, 12 IMPS, 25 TTS, and 14 unclassified). Three matched sources that we had classified as AB had 4800 K; these were removed from our sample as suspected foreground stars.
We refit the SEDs for the remaining 61 sources, this time constraining the model parameter using the and (assumed Gaussian) uncertainty values reported by D17 (see P19 for details). We were thus able to classify 8 previously-unclassified sources as TTS, 2 as IMPS, and define a new Class of radiative-IMPS (R-IMPS). R-IMPS are a transitional stage between fully-convective IMPS and fully-radiative AB stars in the 2–4 range. They have begun to traverse the Henyey tracks and have K, corresponding to spectral types F and early-G. We hence reclassified 24 sources as R-IMPS, including 10 initially classified as AB sources, 6 as IMPS, and 8 previously unclassified. The large majority of R-IMPS (21 out of 24) exhibited no MIR excess and were fit with diskless PMS models.
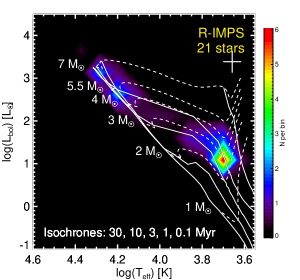
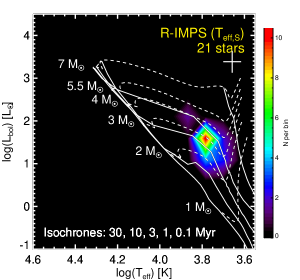
The two composite pHRDs plotted in Figure 2 show why the constraints are required to classify R-IMPS. Our age-weighting scheme for SED models seldom preferred that was close to the actual values for R-IMPS. This is mainly due to the low density of SED models populating this range of and in both the naked PMS and Robitaille et al. (2006) model sets. Based on photometry and our age-weighting alone, the most likely models are typically cooler, and occasionally hotter (P19). There are almost certainly additional R-IMPS in our sample that lacked spectroscopic measurements, in particular those located in the wider field outside the relatively small, central region surveyed by D17. In the absence of constraints, about 60% of R-IMPS were misclassified as cooler, less luminous IMPS, and the remainder were predominantly misclassified as hotter, more luminous AB stars.
2.5 X-ray Spectral Fitting
We fit the 0.5–8 keV X-ray spectra of all sources in our sample with XSPEC v12.91.1 (Arnaud, 1996) . We model each source using either one thermal plasma (apec) component (which we refer to as the 1T model) or two apec components (the 2T Model; Smith et al., 2001). The plasma temperature in the 1T models is left as a free parameter. In the 2T models, one temperature is fixed at keV (corresponding to the expected MK base emission for coronal TTS emission observed by P05), while is left as a free parameter.
Both the 1T and 2T models include an absorbing column (tbabs; Wilms et al., 2000), which can be left as a free parameter in the fits or For sources fit with the Robitaille et al. (2006) YSO models, this extinction is the sum of the foreground plus the total through the circumstellar dust disk and/or infalling envelope.111In some cases the internal parameter for the disk+envelope can be very high, and it may be highly uncertain or even unreliable, in which case the Free models were preferred. The large majority of X-ray bright sources in our sample were fit with diskless PMS models that are unaffected by this issue. The internal parameter is no longer implemented in the updated YSO model sets of Robitaille (2017). was converted to using the relation cm-2 mag-1 (Vuong et al., 2003). We hence further divide our X-ray spectral fitting results into “Free” or “”, for which was left as a free parameter or constrained using the from IR SED fitting or NIR colors (when the SED fitting returned values). Table 2 summarizes the naming scheme that we use for the X-ray spectral models.
| 1T Plasma | 2T Plasma | |
|---|---|---|
| Free NH | 1T Free | 2T Free |
| -Frozen NH | 1T Frozen | 2T Frozen |
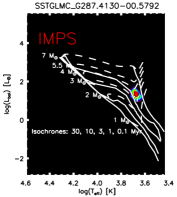
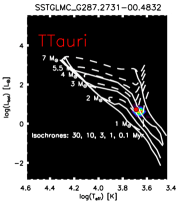
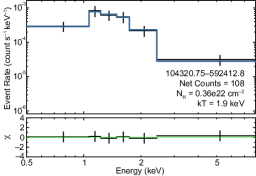
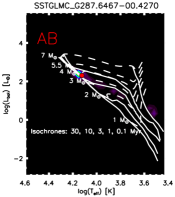
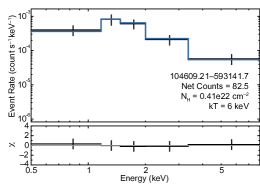
The models were fit to the unbinned X-ray spectra using the Cash statistic, (Cash, 1979). Figure 3 gives examples of both the X-ray spectrum, and individual pHRD of a single source from each Class (Section 2.3). and pHRDs for our full CCCP X-ray bright source catalog are available for download from our Zenodo repository.222DOI:10.5281/zenodo.4628273
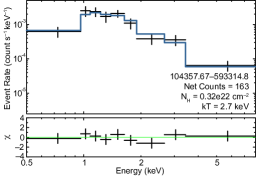
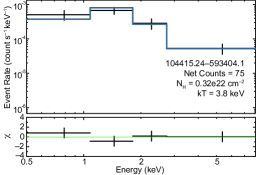
We visually reviewed all XSPEC model fits to each of our X-ray spectra using the GUI-based tool ae_spectra_viewer provided with ACIS Extract (Broos et al., 2010). In the majority of cases, the fit statistics (e.g., the Cash statistic per degrees of freedom) between the four models were similar. We therefore chose the best-fit spectral model among the 1T Frozen, 2T Frozen, 1T Free, and 2T Free based upon the residuals and grouped spectra outputs (shown in the right column of Figure 3).
We removed 32 sources that could not be adequately fit with any of the models included in Table 2.333These removed sources were not included in the composite pHRDs of Figures 1 and 2. The majority of these had high X-ray background levels ( of source counts) causing poor modeling of both the source and the background.
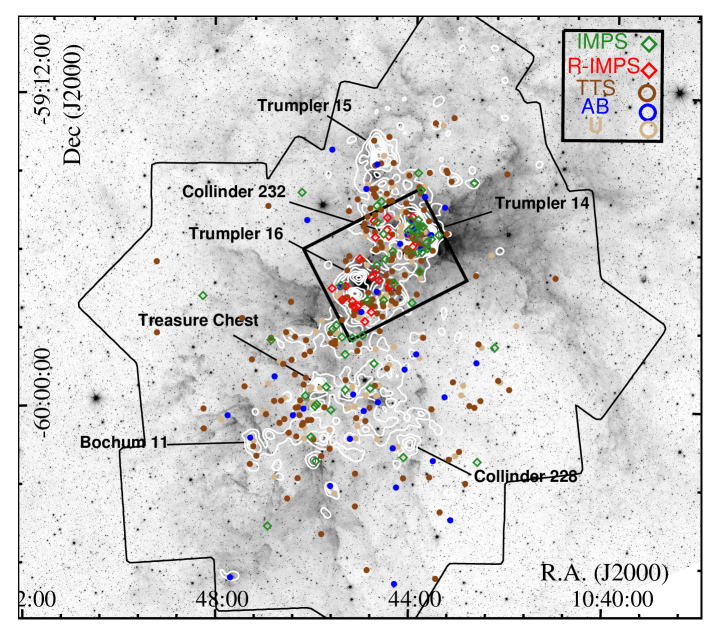
The sky positions of all 370 sources in our final sample are overlaid on a Spitzer 3.6 m mosaic of the Carina Nebula in Figure 4. The colored symbols denote stars in their respective Classes, while the white contours correspond to the source density of X-ray young stellar members (Broos et al., 2011b; Feigelson et al., 2011). Every Class is represented in all parts of the region. IMPS and TTS show more clustering compared to AB and U sources. IMPS are densely clustered in Tr 14, which contains roughly one-third of all IMPS in our sample and has the highest X-ray point source density of the CCCP catalog (Feigelson et al., 2011). Because R-IMPS require spectroscopic confirmation for classification, all are found within the Gaia-ESO survey area (black thick box; D17). The majority of the R-IMPS (14/23) cluster around Tr 16 (Wolk et al. (2011)), which contains the famous massive binary system Carinae (Hamaguchi et al., 2014). X-ray bright TTS generally follow the spatial distribution of all X-ray detected members (contours), especially in the vicinity of Tr 16 and Tr 14.
3 X-ray Spectral Analysis Results
3.1 Best Fit Spectral Models
In Table 3 we tally for each Class the best fit XSPEC model type (1T or 2T), origin of the parameter (free in the fit or by ) and occurrence of variability in the X-ray light curve. We use the same variability criterion described in detail by Broos et al. (2010), by which the light curves of each source during a single observation is tested for uniform flux over time using a one-sided Kolmogorov-Smirnov (KS) Test. P-values () for the null hypothesis of uniform flux are flagged as “no variability” (0) for , “possible variability” (1) for , and “definite variability” (2) for . Although a multi-observation KS probability is computed by ACIS Extract it is not used for determining variability in this work. The single-observation exposure times vary across the large CCCP mosaic, but are generally ks, a timescale well-matched to the duration of individual coronal flares (Favata et al., 2005).
| - | 1T | 2T | Frozen | Free | 1T & | 2T & | % |
|---|---|---|---|---|---|---|---|
| Vary | Vary | Vary | |||||
| IMPS | 10 | 1 | 20 | ||||
| R-IMPS | 23 | 0 | 4 | 0 | 17 | ||
| TTS | 34 | ||||||
| AB | 34 | 1 | 7 | 1 | 23 | ||
| U | 24 | ||||||
| Allbbfootnotemark: | 28 |
We found that for 82% (306/370 sources) of our sample, the predicted from the best-fit Free models (including cases where the Frozen model was preferred) fell within the range of returned by the IR SED fitting or estimated from NIR photometry.
The overwhelming majority of sources in our sample () required only a single plasma component (1T model) to achieve acceptable XSPEC fits. Even among our sample of bright CCCP X-ray sources, the majority were detected with net counts. But in cases where is relatively high and is non-negligible, a single (harder) component can dominate the observed spectrum
Using the best-fit model to correct observed fluxes for absorption, we computed the hard-band (; 2–8 keV) and total-band (; 0.5–8 keV) X-ray luminosities assuming the Gaia DR2 parallax distance to Carina of 2.5 kpc (P19). We prefer hard-band luminosities over over soft-band (0.5–2 keV) luminosities for this analysis because the hard photons are less sensitive to absorption correction.
The best fit X-ray and IR properties for our sample will be available as an electronic table. The columns of the e-table are described in Table 4.
| Column Label | Units | Description |
| XName | IAU source; prefix is CXOGNC J(Chandra X-ray) Observatory Great Nebula in Carina | |
| MIRName | Spitzer MIR Vela-Carina source name | |
| RA | deg | Right Ascension (J2000) |
| Dec | deg | Declination (J2000) |
| TMClass | Classification (Section 2.3) | |
| YSO | (y)es or (n)o; Source a YSO (See Section 2.1) | |
| NetCounts | count | Full band (0.5 - 8 keV) net counts |
| Variable | (0) non-variable, (1) possible, or (2) definite; (See Section 3.1) | |
| SrcArea | (0.492arsec)2 | Average aperture area |
| Theta | arcmin | Chandra off axis angle |
| Mass | Mass from SED | |
| Mass_err | Weighted 1–sigma uncertainty of Mass (Section 2.3, P19) | |
| NHX | 1022 cm-2 | Hydrogen absorbing column from XSPEC |
| AvSED | (y)es or (n)o; See Section 3.1 | |
| Av_mean | mag | Mean on Av; When AvSED = y, Av from SED fit displayed. Else, Av from NIR estimate is displayed |
| Av_min | mag | Lower bound of weighted 1–sigma uncertainty on Av (Section 2.3, P19) |
| Av_max | mag | Upper bound of weighted 1–sigma uncertainty on Av (Section 2.3, P19) |
| 2TModel | (y)es or (n)o; Source fit with 2T plasma component | |
| kT | keV | 1T or 2T plasma temperature; When “2TModel” = y, kT2 is displayed (See Section 2.5) |
| Fx_hc | erg s-1 cm-2 | Hard band (2–8 keV) absorption corrected flux |
| Fx_tc | erg s-1 cm-2 | Total band (0.5–8 keV) absorption corrected flux |
| logLx_hc | (erg s-1) | Hard band (2–8 keV) absorption corrected luminosity |
| logLx_tc | (erg s-1) | Total band (0.5–8 keV) absorption corrected luminosity |
| logLbol | (L⊙) | Bolometric Luminosity from IR SED |
| logLbol_err | (L⊙) | Weighted 1–sigma uncertainty on Lbol (Section 2.3, P19) |
3.2 Absorption and Plasma Temperature Parameter Distributions
We compared the distributions of and for each Class against one another using two-sided KS tests. We define a “significant difference” as KS Probability , marginal as , and no difference as . These KS tests reveal no statistically significant differences in distributions among the classes. In terms of average absorption within each class, the AB sources have the lowest, at , while TTS have the highest absorbing column, and largest spread, with values .
Similarly we find no statistically significant differences in plasma temperatures between the Classes. We performed the same KS tests on the of the sources that were fit with 1T models (both Free and Frozen). The average for each Class fell within the narrow range of 2.6–3.2 keV, corresponding to coronal plasma temperatures of 30–37 MK. Since there were very few sources that preferred the 2T models (Table 3), statistical comparisons of the parameter were not performed.
3.3 X-ray Luminosity Functions
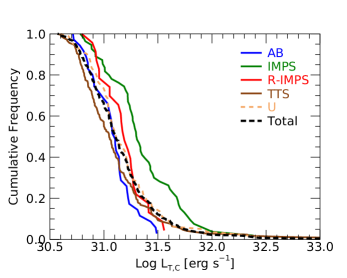
The cumulative X-ray luminosity functions (XLFs) for all classes are shown in Figure 5. IMPS are systematically more luminous than the TTS, AB, and U classes, with a mean offset of dex in both and . The most luminous R-IMPS (section 2.4), have comparable (Figure 5, right panel) to the most luminous AB sources, while the least luminous R-IMPS are comparable to the least luminous IMPS. The resultant shape of the (partially-convective) R-IMPS XLF looks like a transition between that of the (fully-convective) IMPS and the (radiative) AB classes. Most of the same qualitative trends among the classes appear in the XLFs (Figure 5, left panel), but the curves appear noisier because the absorption correction more strongly affects the soft ( keV) portion of the spectrum.
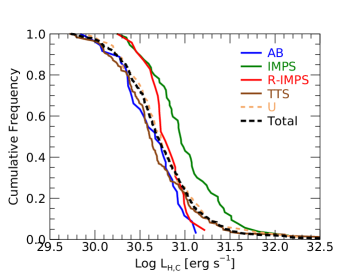
Tables 5 and 6 show the two-sided KS tests comparing and distributions for each class respectively. For the hard band luminosities (Table 5) we find a statistically significant difference between IMPS and TTS. We also find marginally significant differences comparing IMPS with AB or U. KS tests reveal no statistically significant differences among the non-IMPS classes. KS tests applied to the total band luminosities (Table 6) give similar results, except for the inclusion of a statistically significant difference comparing IMPS with AB stars.
| - | IMPS | R-IMPS | TTS | AB | Unc |
| IMPS | 1 | 0.0319 | 5.03e-7 | 9.12e-4 | 0.0018 |
| R-IMPS | 0.0319 | 1 | 0.0121 | 0.107 | 0.338 |
| TTS | 5.03e-7 | 0.0121 | 1 | 0.621 | 0.126 |
| AB | 9.12e-4 | 0.107 | 0.621 | 1 | 0.531 |
| Unc | 0.0018 | 0.338 | 0.126 | 0.531 | 1 |
The XLFs have not been corrected for survey completeness. However, in the hard-band XLF (right panel of Figure 5) the faint-end turn-over for the AB/TTs/U curves occurs 0.5 dex fainter compared to IMPS. The faint end cutoff for the AB/TTs/U is likely due to incompleteness, but the IMPS cut-off seems to be real as it occurs at a luminosity dex higher than the likely completeness cutoff at . This seems to indicate a lower bound of erg s-1 for the X-ray luminosity of convective IMPS.
| - | IMPS | R-IMPS | TTS | AB | Unc |
| IMPS | 1 | 0.0379 | 1.78e-7 | 1.96e-5 | 1.38e-4 |
| R-IMPS | 0.0379 | 1 | 0.0594 | 0.0871 | 0.500 |
| TTS | 1.78e-7 | 0.0594 | 1 | 0.582 | 0.0472 |
| AB | 1.96e-5 | 0.0871 | 0.582 | 1 | 0.282 |
| Unc | 1.38e-4 | 0.500 | 0.0472 | 0.282 | 1 |
4 Discussion
4.1 IMPS as Luminous, Coronal X-ray Emitters
We have found that the X-ray spectra from our X-ray bright sample of low- and intermediate-mass stars in the CCCP survey can generally be fit using thermal plasma models returning similar plasma temperatures, implying a similar underlying physical emission mechanism. The median hard- and total-band absorption-corrected X-ray luminosities for IMPS are dex more luminous compared to TTS and AB stars, and the XLF turnover for IMPS occurs at higher luminosity (Figure 5). Because the IMPS sample is dominated by fully-convective stars, this strongly suggests a coronal origin for IMPS X-ray emission. As a class, the IMPS sample is also more luminous than our TTS sample (which is itself relatively X-ray bright); thus IMPS X-ray emission must be intrinsic, not attributable to unresolved, lower-mass companions.
R-IMPS are the second-most luminous class, and the XLF turnover coincides with that of IMPS in both the hard and total-band XLFs (Figure 5). This reflects the decay in X-ray luminosity from the initially high values exhibited by IMPS, as the convective dynamo gives way to the development of an interior radiative zone (Mayne et al., 2007; Mayne, 2010; Gregory et al., 2016). Once R-IMPS reach the ZAMS as fully-radiative AB stars, we expect intrinsic X-ray emission to cease, hence the AB stars in our X-ray bright sample are likely included owing to the presence of relatively bright, unresolved convective companions (themselves IMPS or, more frequently, TTS).
In Figure 6 we plot on an HR diagram the subset of 65 sources from our X-ray bright sample with photospheric temperatures measured spectroscopically as part of the Gaia-ESO survey. This subset includes 23 R-IMPS, 14 IMPS, 24 TTS, and 4 sources that remained unclassified due to poorly-constrained SED model parameters. No AB stars are included because D17 did not report values for hot stars. For this plot we refit the SEDs of the nine IR-excess sources (boxed) using the updated sets of YSO models provided by Robitaille (2017). We then computed and using the mean parameter values for all SED models with falling within 3-sigma of reported by D17. In 12 instances (all non-excess sources) no SED models fell within this range, most likely due to the limitations of the Castelli & Kurucz (2003) stellar atmosphere models, which do not accurately reproduce the H- opacity minimum at 1.65 m for PMS stars with –5000 K. In these cases we plotted and the mean from the 10 SED models with the nearest parameter values.
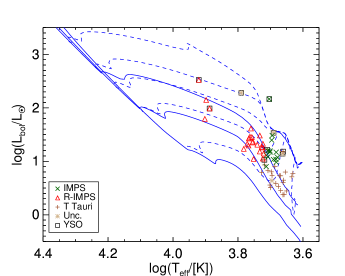
As Figure 6 illustrates, R-IMPS (red triangles) are traversing the radiative Henyey tracks and have generally higher Lbol compared to fully-convective IMPS (green asterisks). Most R-IMPS and IMPS have stellar masses of 2–4 , but nearly all of the IMPS in this mass range lie above the 1 Myr isochrone, while nearly all the R-IMPS fall between the 1 and 3 Myr isochrones. The lower-mass TTS span the same range in isochronal ages as the R-IMPS and IMPS combined, in good agreement with the Myr duration of star formation in the central regions of the Carina Nebula reported by P19. The YSOs (boxed) lie close the intermediate-mass stellar birthline (defined by the upper-right boundary of the Haemmerlé et al., 2019 evolutionary tracks), including three with masses exceeding .
4.2 Trends in X-ray Luminosity with Stellar Mass and Luminosity
Up to this point we have focused primarily on comparing the distributions of various X-ray emission properties among our different stellar classes, and we have demonstrated that X-ray luminosity is by far the most distinguishing characteristic of (R-)IMPS compared to lower-mass TTS. To investigate trends in X-ray luminosity with the parameters of individual stars, we are limited by the source selection requirements for reliable X-ray spectral fitting. The luminosity range over which our X-ray bright sample appears mostly complete spans dex (Figure 5), which is comparable to the typical scatter observed in stellar relations (Preibisch et al., 2005; Gagné et al., 2011).
To probe more extended trends in our analysis we add another sample of X-ray emitting pre-main-sequence stars to our analysis. The MYStIX (Massive Young Star-Forming Complex Study in Infrared and X-ray) sample is a multi-wavelength survey similar to CCCP that combines Chandra X-ray data and NIR/MIR data from 2MASS, UKIRT, and Spitzer/IRAC (Feigelson et al., 2013). We only used sources from the CCCP-MYStIX sample that had published X-ray luminosities and for which we could classify their IR counterparts with confidence. We made no cut to the X-ray detection significance or X-ray net counts for these sources.
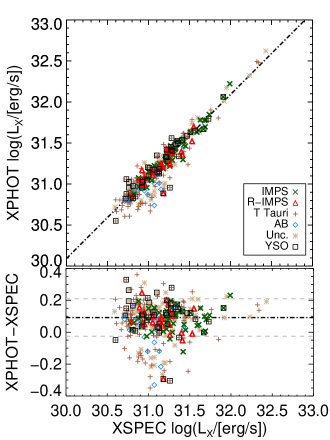
In the MYStIX catalog (Broos et al., 2013), reported values were computed using the XPHOT method for faint X-ray sources (Getman et al., 2010), which assumes a (luminosity-dependent) template TTS spectral shape to estimate the absorption affecting the observed spectrum. Because XPHOT was developed empirically using low-mass TTS samples, there is a danger that undiagnosed trends in X-ray spectral shape with stellar mass could bias this method toward systematically different values when applied to IMPS. To check for such systematics, in Figure 7 we plot derived from XPHOT (rescaled to the revised Carina distance) versus our spectral fitting (XSPEC) for the sources in common among our sample and MYStIX. We find generally good agreement, with within 0.1 dex, between the two methods across our sample, with the large majority of sources falling within dex of the 1:1 line between the two methods. There are no evident trends among the various classes. We therefore can reliably compare the from either method and incorporate the larger, MYStIX sample to probe trends in .
G16 adopted previously-published X-ray luminosities derived from XPHOT, and the generally good agreement we have found between XPHOT and our more careful XSPEC analysis (Figure 7) reinforces their conclusions about the decay of X-ray luminosity with time.
In Figure 8 we plot against stellar mass derived from IR SED fitting. We broadly split the figure into two regions: sources powered by intrinsic coronal X-ray (CX) emission consistent with a convective interior versus sources whose IR bright primary star has a mostly or fully radiative envelope (R), meaning the X-ray emission most likely originates from a lower-mass, convective TTS (or IMPS) companion (CX companion), that is unseen in the IR. Some magnetic “peculiar” (Ap) stars have been detected in X-rays (Stelzer et al., 2003) but these would be far too faint to be detected at the Carina distance, given CCCP sensitivity limits . These dividing lines are based on the P05 vs M⋆ linear regression fit extrapolated for 2 M⊙ to 4 M⊙ stars. We find that the majority of IMPS and even R-IMPS fall above this extrapolation line, while the vast majority of AB X-ray sources fall below it.
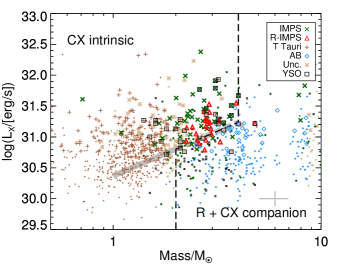
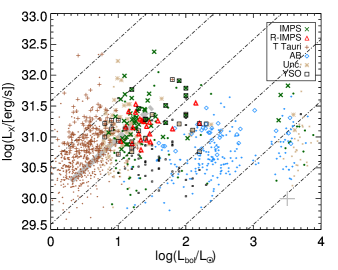
This separation in between IMPS, R-IMPS, and AB stars of 2–4 illustrates the evolution of X-ray emission as a probe of IMPS interior structure: IMPS begin as (fully) convective and X-ray luminous, then develop a radiative zone and become R-IMPS, at which point the X-ray luminosity declines. Finally, a fully-radiative envelope completes the transition to an AB star, spelling the end of magneto-coronal X-ray emission. At this point an X-ray quiet AB star would drop out of our sample, unless it has a lower-mass X-ray bright companion. This means that the AB sources have X-ray emission characteristic of TTS, not IMPS, dropping them below the extrapolated P05 –mass relation. The MYStIX sample allows us to include many more of these AB sources with lower in Figure 8 (smaller symbols) than appear in our X-ray bright sample.
In Figure 9 we plot against derived from IR SED fitting. Both IMPS and R-IMPS generally follow the TTS log(LX/Lbol) relation, with the large majority falling in the range of . The AB sources do not follow this relation because and are decoupled in the case of unresolved binary systems where the IR and X-ray emission are dominated by different stellar components, as discussed above. No sources in Figure 9 fall below the line, indicating that few to none of the AB stars exhibit intrinsic X-ray emission from shocked stellar winds (Carina OB stars have ; Nazé et al., 2011).
4.3 Interesting Individual IMPS
In this section we discuss nine individual stars and YSOs drawn from the 77 IMPS and R-IMPS candidates in our sample. All of these featured objects have measured by D17, increasing the precision of their locations on the HR diagram (Figure 6). Table 7 summarizes the best-fit X-ray parameters for all sources in our sample, with the 9 sources discussed in this section highlighted.
4.3.1 The Brightest X-ray Flare from a Spectroscopically Classified, Diskless IMPS
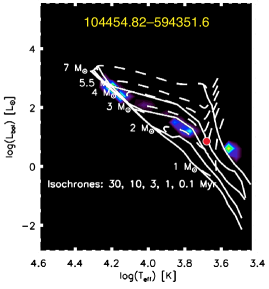
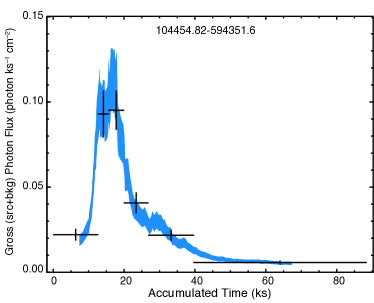
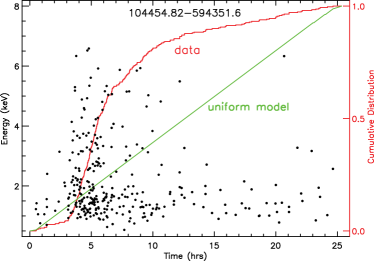
Among the IMPS for which we have spectroscopic classifications, CXOGNC J104454.82-594351.6 is the most X-ray luminous, with erg s-1. Nearly 60% of this luminosity is emitted in the hard band ( keV). Without spectroscopy, this IMPS would remain unclassified by our scheme, because the naked PMS model fits to its SED were unconstrained (top panel of Figure 10). The H- opacity bump likely caused the SED fits to miss the correct K (D17), which gives a mass of . This star therefore barely exceeds our mass threshold for IMPS classification, and its high X-ray luminosity appears to be due to variability produced by one or more large flares. The middle panel of Figure 10 shows the X-ray light curve of CXOGNC J104454.82-594351.6, which is dominated by a fast-rise and exponential-decay flare (Getman et al., 2008; Getman & Feigelson, 2021).
4.3.2 Two IMPS Near the Maximum Mass for Fully-Convective, Non-Accreting Stars
CXOGNC J104352.31-593922.2 appears to be the least-evolved YSO among the 65 stars in our spectroscopic subsample. It has a high erg s-1 with no evident variability. We incorporated available photometry from D17 into the IR SED and refit with both disk-only and disk+infalling envelope YSO models from Robitaille (2017). Example plots illustrating the multiple acceptable model fits to the photometry data are shown in Figure 11, and it is clear that the disk+envelope models provide qualitatively better fits to the MIR SED.
The best SED models for this YSO that agree with the correct K (D17) indicate a stellar mass of 3–4 and a position very near the Haemmerlé et al. (2019) birthline. This interpretation is consistent with the presence of a circumstellar disk and envelope, indicating the possibility of recent or ongoing mass accretion. Even in a flare, such high X-ray luminosity is unlikely to be produced by an unresolved, lower-mass T Tauri companion, making CXOGNC J104352.31-593922.2 one of the youngest and most massive YSOs powering coronal X-ray emission that we would expect to discover, given its location at or above the maximum mass for the fully-convective birthline (Haemmerlé et al., 2019).444CXOGNC J104352.31-593922.2 appears to lie above the birthline in Figure 6, but that is an artifact of the averaging of parameters over multiple models, since the majority of the well-fit YSO models for this source prefer temperatures hotter than , with commensurately higher bolometric luminosities.
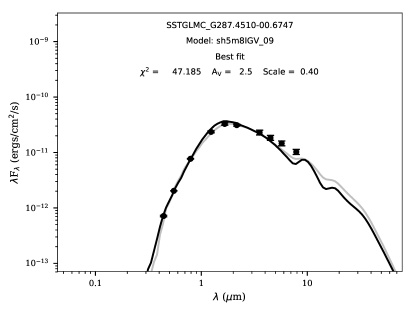
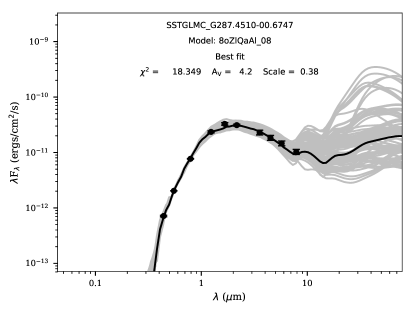
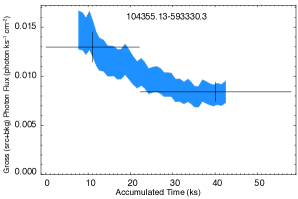
A second IMPS (CXOGNC J104355.13-593330.3) also has a high X-ray luminosity ( erg s-1) and a remarkably high mass. It is possibly variable (Section 3), with a lightcurve showing what could be post-flare exponential decay over the 60-ks observation (Figure 12). It presents a cooler X-ray spectrum than most stars in our sample, with 67% of emission at softer energies ( keV). Its MIR counterpart shows no excess emission out to 4.5 m. SED modeling with stellar atmospheres indicates a mass , making CXOGNC J104355.13-593330.3 an example of the most massive, fully-convective, non-accreting IMPS theoretically allowed by Haemmerlé et al. (2019). The SED fit parameters found excellent agreement with K (D17), and the X-ray spectrum was best fit with the 1T Free models.
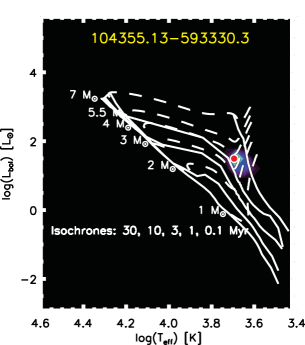
This extreme star is located close to the heart of Tr 14, the densest cluster in Carina (Figure 4) with many surrounding stars within 3″. It is possible that its high inferred luminosity, and hence mass, could result from the blending of two (or more) sources. This could more strongly affect the IR SED fits than the X-ray spectral fits, since Chandra has a higher (on-axis) spatial resolution compared to Spitzer/IRAC or 2MASS.
4.3.3 Two Diskless IMPS at the Convective-Radiative Transition
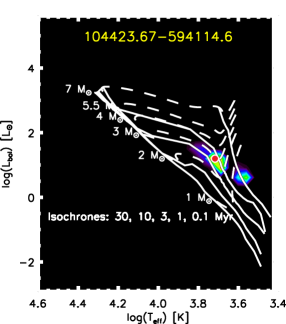
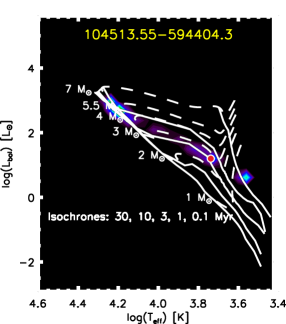
CXOGNC J104423.67-594114.6 and J104513.55-594404.3 are both diskless IMPS with erg s-1, on the faint end of the (R-)IMPS in our sample. While their SED fit parameters were too poorly constrained for classification without spectroscopy, they fell on either side of our (admittedly blurry) temperature dividing line between IMPS and R-IMPS, with K and 5515 K (D17), respectively (Figure 13). It is possible that the X-ray emission from each of these two IMPS has begun to decay due to the development of an interior radiative zone.
4.3.4 The Four Hottest R-IMPS
Four of the R-IMPS plotted in Figure 6 have K (D17), making them late A-type stars with fully radiative envelopes.555An argument could be made to re-classify these stars as AB, but we have reserved this classification for hot, intermediate-mass stars on or near the ZAMS. Two of these, CXOGNC J104401.10-593535.1 and J104538.35-594207.5, exhibit both IR excess and H emission, making them candidate Herbig Ae stars. These two YSOs and the diskless, hot R-IMPS CXOGNC J104432.58-593303.5 have erg s-1, which is below the median X-ray luminosity of both the TTS and AB classes. Their observed X-ray emission is consistent with convective, lower-mass TTS companions.
The fourth star in this group, CXOGNC J104446.53-593413.3, has erg s-1. This is the most massive of the diskless R-IMPS in our sample, at (Figure 6). Assuming this star is fully-radiative and hence incapable of producing magneto-coronal X-rays, the high is most likely powered by a companion that is itself a fully-convective IMPS of 2–3 .
| XName | TMClass | YSO | FrozenModel | NetCounts | Variable | NHX | kT1 | logLx_tc | logLbol |
|---|---|---|---|---|---|---|---|---|---|
| (Counts) | () | (keV) | () | () | |||||
| 104454.82-594351.6 | IMPS | n | n | 300 | 2 | 31.7 | 1.7 | ||
| 104352.31-593922.2 | IMPS | y | n | 139 | 0 | 31.4 | 2.0 | ||
| 104355.13-593330.3 | IMPS | n | n | 140 | 2 | 31.4 | 1.3 | ||
| 104423.67-594114.6 | IMPS | n | n | 144 | 0 | 30.9 | 1.0 | ||
| 104513.55-594404.3 | RIMPS | n | n | 74 | 0 | 30.8 | 1.2 | ||
| 104401.10-593535.1 | RIMPS | y | n | 60 | 0 | 31.1 | 2.3 | ||
| 104538.35-594207.5 | RIMPS | y | n | 105 | 1 | 31.2 | 2.2 | ||
| 104432.58-593303.5 | RIMPS | n | n | 63 | 0 | 31.1 | 1.8 | ||
| 104446.53-593413.3 | RIMPS | n | n | 135 | 0 | 31.5 | 2.1 |
5 Conclusions
We have analyzed the X-ray emission properties of 370 X-ray bright stars in the Carina Nebula that we classified via IR SED fitting as IMPS, R-IMPS, TTS, or AB stars (Section 2.3). X-ray spectral fitting with thermal plasma emission models returned physical parameters. We found that 82% of sources had good agreement between the hydrogen absorbing columns determined independently using our X-ray spectral fitting and IR SED fitting (or NIR colors in a few instances).
Convective IMPS are systematically more X-ray luminous, by 0.3 dex (Section 4), than all other low- and intermediate-mass stars in our sample. The mean total-band (0.5–8 keV) luminosity of () erg s-1 for IMPS falls within the typical ranges for wind-driven emission from OB stars ( to 31.8; only have , Gagné et al., 2011). Based on X-ray brightness alone, an IMPS could be mistaken for a late O or early B-type star.
Spectroscopically-classified R-IMPS on radiative Henyey tracks have lower X-ray luminosity compared to IMPS, but higher than low-mass TTS. Combined with their similar distributions to IMPS and TTS, this signals that R-IMPS are producing their final breaths of X-ray emission before joining the ZAMS as AB stars.
AB and TTS in our X-ray bright sample exhibit similar XLFs and plasma temperature distributions (Section 3.3). No AB stars exhibit sufficiently low to be consistent with a wind-driven X-ray emission mechanism. We conclude that the apparent X-ray emission from AB stars in our sample originates from IR-dim, but X-ray bright, low-mass TTS companions (Section 4).
The preponderance of evidence supports a common magneto-coronal flaring mechanism for coronal X-ray production for IMPS, R-IMPS, and TTS across the wide mass range from down to the hydrogen-burning limit (P05). We observe the time-decay of X-ray luminosity with growth of a radiative zone reported by G16, but with a much larger sample of IMPS and more careful determination of absorption-corrected X-ray luminosity. We find that the absorption-corrected luminosity determined by assuming a TTS spectral template (XPHOT method) generally gives accurate results for IMPS and R-IMPS, indirect evidence for similar underlying spectral shapes for all coronal X-ray emission from PMS stars of all masses.
The most massive, non-accreting, fully-convective IMPS, as evidenced by both their strong coronal X-ray emission and location on the HR diagram (Figure 6) have masses of 3– 4 . We also find 3 X-ray bright YSOs with spectroscopically-constrained SED models returning higher masses than any diskless IMPS, but IR excess emission indicative of recent or ongoing accretion. These empirical constraints on the location of the intermediate-mass birthline show very good agreement with the evolutionary models of Haemmerlé et al. (2019).
The rapid evolution of stellar interior structure from fully-convective to fully-radiative, as traced by the transition from IMPS to R-IMPS to AB means that IMPS provide sensitive probes of isochronal ages for the first 10 Myr of a massive star stellar population (Povich et al., 2019). The high concentration of IMPS in the Tr 14 cluster compared to the higher fraction of R-IMPS in Tr 16 (Figure 4) indicates that Tr 14 is even younger than Tr 16 (Appendix A14 in Getman et al., 2014 gives a similar result).
Acknowledgements
We thank K. V. Getman and L. A. Hillenbrand for helpful discussions that improved this paper. This work was supported the NSF under award CAREER-1454333 and by NASA under Chandra awards G07-18003A/B, GO7-18003A/B, GO8-9131X, and the ACIS Instrument Team contract SV4-74018; these were issued by the Chandra X-ray Center, which is operated by the Smithsonian Astrophysical Observatory for and on behalf of NASA under contract NAS8-03060. E.H.N. acknowledges prior support from the Cal-Bridge program through NSF award DUE-1356133. The scientific results are based in part on observations made by the Chandra X-ray Observatory and published previously in cited articles. This work is based in part on archival data obtained with the Spitzer Space Telescope, which is operated by the Jet Propulsion Laboratory, California Institute of Technology under a contract with NASA. This publication makes use of data products from the Two Micron All-Sky Survey, which is a joint project of the University of Massachusetts and the Infrared Processing and Analysis Center/California Institute of Technology, funded by NASA and the NSF.
Facility: CXO (ACIS)
Facility: Spitzer (IRAC)
Facility: CTIO:2MASS
References
- Alecian et al. (2019) Alecian, E., Villebrun, F., Grunhut, J., et al. 2019, in EAS Publications Series, Vol. 82, EAS Publications Series, 345–355
- Alexander et al. (2016) Alexander, M. J., Hanes, R. J., Povich, M. S., & McSwain, M. V. 2016, AJ, 152, 190, doi: 10.3847/0004-6256/152/6/190
- Arnaud (1996) Arnaud, K. A. 1996, in Astronomical Data Analysis Software and Systems V, ed. G. H. Jacoby & J. Barnes, Vol. 101, 17
- Bernasconi & Maeder (1996) Bernasconi, P. A., & Maeder, A. 1996, A&A, 307, 829
- Broos et al. (2011a) Broos, P. S., Getman, K. V., Povich, M. S., et al. 2011a, ApJS, 194, 4, doi: 10.1088/0067-0049/194/1/4
- Broos et al. (2010) Broos, P. S., Townsley, L. K., Feigelson, E. D., et al. 2010, ApJ, 714, 1582, doi: 10.1088/0004-637X/714/2/1582
- Broos et al. (2011b) —. 2011b, The Astrophysical Journal Supplement Series, 194, 2, doi: 10.1088/0067-0049/194/1/2
- Broos et al. (2013) Broos, P. S., Getman, K. V., Povich, M. S., et al. 2013, ApJS, 209, 32, doi: 10.1088/0067-0049/209/2/32
- Cash (1979) Cash, W. 1979, ApJ, 228, 939, doi: 10.1086/156922
- Castelli & Kurucz (2003) Castelli, F., & Kurucz, R. L. 2003, in IAU Symposium, Vol. 210, Modelling of Stellar Atmospheres, ed. N. Piskunov, W. W. Weiss, & D. F. Gray, A20
- Damiani et al. (2017) Damiani, F., Klutsch, A., Jeffries, R. D., et al. 2017, A&A, 603, A81, doi: 10.1051/0004-6361/201629020
- Favata et al. (2005) Favata, F., Flaccomio, E., Reale, F., et al. 2005, ApJS, 160, 469, doi: 10.1086/432542
- Fazio et al. (2004) Fazio, G. G., Hora, J. L., Allen, L. E., et al. 2004, ApJS, 154, 10, doi: 10.1086/422843
- Feigelson et al. (2011) Feigelson, E. D., Getman, K. V., Townsley, L. K., et al. 2011, The Astrophysical Journal Supplement Series, 194, 9, doi: 10.1088/0067-0049/194/1/9
- Feigelson et al. (2013) Feigelson, E. D., Townsley, L. K., Broos, P. S., et al. 2013, ApJS, 209, 26, doi: 10.1088/0067-0049/209/2/26
- Gagné et al. (2011) Gagné, M., Fehon, G., Savoy, M. R., et al. 2011, The Astrophysical Journal Supplement Series, 194, 5, doi: 10.1088/0067-0049/194/1/5
- Gaia Collaboration et al. (2018) Gaia Collaboration, Brown, A. G. A., Vallenari, A., et al. 2018, A&A, 616, A1, doi: 10.1051/0004-6361/201833051
- Garmire et al. (2003) Garmire, G. P., Bautz, M. W., Ford, P. G., Nousek, J. A., & Ricker, George R., J. 2003, in Society of Photo-Optical Instrumentation Engineers (SPIE) Conference Series, Vol. 4851, X-Ray and Gamma-Ray Telescopes and Instruments for Astronomy., ed. J. E. Truemper & H. D. Tananbaum, 28–44
- Getman & Feigelson (2021) Getman, K. V., & Feigelson, E. D. 2021, arXiv e-prints, arXiv:2105.04768. https://arxiv.org/abs/2105.04768
- Getman et al. (2008) Getman, K. V., Feigelson, E. D., Broos, P. S., Micela, G., & Garmire, G. P. 2008, ApJ, 688, 418, doi: 10.1086/592033
- Getman et al. (2010) Getman, K. V., Feigelson, E. D., Broos, P. S., Townsley, L. K., & Garmire, G. P. 2010, ApJ, 708, 1760, doi: 10.1088/0004-637X/708/2/1760
- Getman et al. (2005) Getman, K. V., Flaccomio, E., Broos, P. S., et al. 2005, ApJS, 160, 319, doi: 10.1086/432092
- Getman et al. (2014) Getman, K. V., Feigelson, E. D., Kuhn, M. A., et al. 2014, ApJ, 787, 108, doi: 10.1088/0004-637X/787/2/108
- Gregory et al. (2016) Gregory, S. G., Adams, F. C., & Davies, C. L. 2016, MNRAS, 457, 3836, doi: 10.1093/mnras/stw259
- Grevesse & Sauval (1998) Grevesse, N., & Sauval, A. J. 1998, Space Sci. Rev., 85, 161, doi: 10.1023/A:1005161325181
- Güdel et al. (2007) Güdel, M., Briggs, K. R., Arzner, K., et al. 2007, A&A, 468, 353, doi: 10.1051/0004-6361:20065724
- Günther et al. (2007) Günther, H. M., Schmitt, J. H. M. M., Robrade, J., & Liefke, C. 2007, A&A, 466, 1111, doi: 10.1051/0004-6361:20065669
- Haemmerlé et al. (2019) Haemmerlé, L., Eggenberger, P., Ekström, S., et al. 2019, A&A, 624, A137, doi: 10.1051/0004-6361/201935051
- Hamaguchi et al. (2014) Hamaguchi, K., Corcoran, M. F., Russell, C. M. P., et al. 2014, ApJ, 784, 125, doi: 10.1088/0004-637X/784/2/125
- Hillenbrand (1997) Hillenbrand, L. A. 1997, AJ, 113, 1733, doi: 10.1086/118389
- Indebetouw et al. (2005) Indebetouw, R., Mathis, J. S., Babler, B. L., et al. 2005, ApJ, 619, 931, doi: 10.1086/426679
- Mayne (2010) Mayne, N. J. 2010, MNRAS, 408, 1409, doi: 10.1111/j.1365-2966.2010.17245.x
- Mayne et al. (2007) Mayne, N. J., Naylor, T., Littlefair, S. P., Saunders, E. S., & Jeffries, R. D. 2007, MNRAS, 375, 1220, doi: 10.1111/j.1365-2966.2006.11347.x
- Nazé et al. (2011) Nazé, Y., Broos, P. S., Oskinova, L., et al. 2011, ApJS, 194, 7, doi: 10.1088/0067-0049/194/1/7
- Povich et al. (2019) Povich, M. S., Maldonado, J. T., Haze Nuñez, E., & Robitaille, T. P. 2019, ApJ, 881, 37, doi: 10.3847/1538-4357/ab26b2
- Povich et al. (2016) Povich, M. S., Townsley, L. K., Robitaille, T. P., et al. 2016, ApJ, 825, 125, doi: 10.3847/0004-637X/825/2/125
- Povich et al. (2011) Povich, M. S., Smith, N., Majewski, S. R., et al. 2011, The Astrophysical Journal Supplement Series, 194, 14, doi: 10.1088/0067-0049/194/1/14
- Preibisch et al. (2021) Preibisch, T., Flaischlen, S., Göppl, C., Ercolano, B., & Roccatagliata, V. 2021, arXiv e-prints, arXiv:2103.00196. https://arxiv.org/abs/2103.00196
- Preibisch et al. (2005) Preibisch, T., Kim, Y.-C., Favata, F., et al. 2005, ApJS, 160, 401, doi: 10.1086/432891
- Robitaille (2017) Robitaille, T. P. 2017, A&A, 600, A11, doi: 10.1051/0004-6361/201425486
- Robitaille et al. (2007) Robitaille, T. P., Whitney, B. A., Indebetouw, R., & Wood, K. 2007, The Astrophysical Journal Supplement Series, 169, 328, doi: 10.1086/512039
- Robitaille et al. (2006) Robitaille, T. P., Whitney, B. A., Indebetouw, R., Wood, K., & Denzmore, P. 2006, ApJS, 167, 256, doi: 10.1086/508424
- Shull et al. (2021) Shull, M., Darling, J., & Danforth, C. 2021, arXiv e-prints, arXiv:2103.07922. https://arxiv.org/abs/2103.07922
- Siess et al. (2000) Siess, L., Dufour, E., & Forestini, M. 2000, A&A, 358, 593
- Skrutskie et al. (2006) Skrutskie, M. F., Cutri, R. M., Stiening, R., et al. 2006, AJ, 131, 1163, doi: 10.1086/498708
- Smith et al. (2001) Smith, R. K., Brickhouse, N. S., Liedahl, D. A., & Raymond, J. C. 2001, ApJ, 556, L91, doi: 10.1086/322992
- Sokal et al. (2020) Sokal, K. R., Johns-Krull, C. M., Mace, G. N., et al. 2020, ApJ, 888, 116, doi: 10.3847/1538-4357/ab59d8
- Stassun et al. (2007) Stassun, K. G., van den Berg, M., & Feigelson, E. 2007, ApJ, 660, 704, doi: 10.1086/513138
- Stassun et al. (2006) Stassun, K. G., van den Berg, M., Feigelson, E., & Flaccomio, E. 2006, ApJ, 649, 914, doi: 10.1086/506422
- Stelzer et al. (2003) Stelzer, B., Huélamo, N., Hubrig, S., Zinnecker, H., & Micela, G. 2003, A&A, 407, 1067, doi: 10.1051/0004-6361:20030934
- Telleschi et al. (2007) Telleschi, A., Güdel, M., Briggs, K. R., Audard, M., & Palla, F. 2007, A&A, 468, 425, doi: 10.1051/0004-6361:20066565
- Townsley et al. (2011) Townsley, L. K., Broos, P. S., Corcoran, M. F., et al. 2011, The Astrophysical Journal Supplement Series, 194, 1, doi: 10.1088/0067-0049/194/1/1
- Vuong et al. (2003) Vuong, M. H., Montmerle, T., Grosso, N., et al. 2003, A&A, 408, 581, doi: 10.1051/0004-6361:20030942
- Wilms et al. (2000) Wilms, J., Allen, A., & McCray, R. 2000, ApJ, 542, 914, doi: 10.1086/317016
- Wolk et al. (2011) Wolk, S. J., Broos, P. S., Getman, K. V., et al. 2011, ApJS, 194, 12, doi: 10.1088/0067-0049/194/1/12