Automated Mapping of Vulnerability Advisories
onto their Fix Commits in Open Source Repositories
[PRE-PRINT]
Daan Hommersom, Antonino Sabetta,
Bonaventura Coppola, Dario Di Nucci, Damian A. Tamburri
The lack of comprehensive sources of accurate vulnerability data represents a critical obstacle to studying and understanding software vulnerabilities (and their corrections). In this paper, we present an approach that combines heuristics stemming from practical experience and machine-learning (ML)—specifically, natural language processing (NLP)—to address this problem. Our method consists of three phases. First, an advisory record containing key information about a vulnerability is extracted from an advisory (expressed in natural language). Second, using heuristics, a subset of candidate fix commits is obtained from the source code repository of the affected project by filtering out commits that are known to be irrelevant for the task at hand. Finally, for each such candidate commit, our method builds a numerical feature vector reflecting the characteristics of the commit that are relevant to predicting its match with the advisory at hand. The feature vectors are then exploited for building a final ranked list of candidate fixing commits. The score attributed by the ML model to each feature is kept visible to the users, allowing them to interpret the predictions.
We evaluated our approach using a prototype implementation named FixFinder on a manually curated data set that comprises 2,391 known fix commits corresponding to 1,248 public vulnerability advisories. When considering the top-10 commits in the ranked results, our implementation could successfully identify at least one fix commit for up to 84.03% of the vulnerabilities (with a fix commit on the first position for 65.06% of the vulnerabilities). In conclusion, our method reduces considerably the effort needed to search OSS repositories for the commits that fix known vulnerabilities.
Citing this paper
Please cite this work as:
@misc{hommersom2021mapping,
title = {Automated Mapping of Vulnerability Advisories onto
their Fix Commits in Open Source Repositories},
author = {Hommersom, Daan and
Sabetta, Antonino and
Coppola, Bonaventura and
Dario Di Nucci and
Tamburri, Damian A. },
year = {2021},
month = {March},
}
![]()
![]()
Abstract.
The lack of comprehensive sources of accurate vulnerability data represents a critical obstacle to studying and understanding software vulnerabilities (and their corrections). In this paper, we present an approach that combines heuristics stemming from practical experience and machine-learning (ML)—specifically, natural language processing (NLP)—to address this problem. Our method consists of three phases. First, we construct an advisory record object containing key information about a vulnerability that is extracted from an advisory, such those found in the National Vulnerability Database (NVD). These advisories are expressed in natural language. Second, using heuristics, a subset of candidate fix commits is obtained from the source code repository of the affected project, by filtering out commits that can be identified as unrelated to the vulnerability at hand. Finally, for each of the remaining candidate commits, our method builds a numerical feature vector reflecting the characteristics of the commit that are relevant to predicting its match with the advisory at hand. Based on the values of these feature vectors, our method produces a ranked list of candidate fixing commits. The score attributed by the ML model to each feature is kept visible to the users, allowing them to easily interpret the predictions.
We implemented our approach and we evaluated it on an open data set, built by manual curation, that comprises 2,391 known fix commits corresponding to 1,248 public vulnerability advisories. When considering the top-10 commits in the ranked results, our implementation could successfully identify at least one fix commit for up to 84.03% of the vulnerabilities (with a fix commit on the first position for 65.06% of the vulnerabilities). Our evaluation shows that our method can reduce considerably the manual effort needed to search OSS repositories for the commits that fix known vulnerabilities.
1. Introduction
Over the past two decades, the availability of open-source software (OSS) components and their adoption have grown so much that the applications that do not include at least one open-source component have become the exception rather than the norm (Zaffar et al., 2011). According to a report by Snyk (Tal, 2019), the large majority of applications on GitHub Enterprise (GitHub, 2020) include some open-source components, which account for as much as 50% of the entire code-base of those applications.
Because OSS components have become an integral part of the large majority of software products (either free or commercial), their vulnerabilities can have a disruptive impact on businesses and on the society at large.
The effective management of the software supply chain has proven to be a critical problem of today’s software industry and has received considerable attention both from academia, from practitioners, and from tool makers, particularly the numerous players in the Software Composition Analysis space that have emerged in the past ten years.
While the early approaches (such as OwaspDC) attacked the problem of detecting vulnerable dependencies by relying on metadata to link vulnerability advisories (such as those collected by the National Vulnerability Database, NVD) and the affected software artifacts (i.e. packaged dependencies), the limitations of such approach soon became evident.
More advanced approaches in the literature use code-level information about the vulnerable code fragment and its fix; this enables a more accurate detection of vulnerable dependencies, as well as a precise impact assessment through reachability analysis. Thew first of such approaches that go beyond metadata, was first proposed, to the best of our knowledge, by Ponta et al. in 2015 (Ponta et al., 2020). While the public information about how the commercial tools that appeared in the market later on is lacking, they often advertise capabilities that explicitly or implicitly refer to a code-oriented approach.
Unfortunately, the data about security vulnerabilities is scattered across heterogeneous sources, often not machine-readable, and does not provide the the necessary level of detail, especially when it comes to code-level details. At the same time, manual approaches (Ponta et al., 2019) to find such data cannot scale proportionally to the amount of open-source code developed by the community and incorporated in commercial products.
The role of automated tools becomes increasingly important (Sabetta and Bezzi, 2018; Cabrera Lozoya et al., 2021). Academic and industrial researchers have mostly focused on the classification of security-relevant commits, where a critical piece of data is the commit that introduces or fixes some vulnerability. However, this kind of research requires a large amount of training data to be available, which leads to a somewhat circular problem.
To address this problem head-on, we argue that the first step is an automated method to reduce the effort needed and increase the success rate in finding fix commits for known vulnerabilities in OSS. While a completely automated method that would ensure full accuracy is infeasible. We believe that an approach that dramatically reduces the time spent by human security experts to mine source code repositories to find fix-commits is of high practical value. To this aim, we propose an approach consisting of three sequential steps: (1) extract - a record containing all relevant vulnerability information is created from the heterogeneous vulnerability data; (2) filter - this advisory record is used select candidate commits by filtering out those that, based on heuristics motivated by observations on the available vulnerability data, are known to be irrelevant for the task at hand; (3) rank - these candidate commits are ranked based on their probability of being a fix commit for the advisory record given as input.
In this paper, we present a prototype (named FixFinder) that implements our method. FixFinder provides a proof-of-concept that can serve as a baseline for further experimentation and research as well as for the implementation of a usable solution to be adopted in an industrial context. FixFinder is released as open-source software as part of SAP’s project “KB”111https://github.com/sap/project-kb, whose goal is to support the creation, management, and aggregation of a distributed, collaborative knowledge base of vulnerabilities that affect open-source software.
To the best of our knowledge, no similar research has been done in the current state of the literature in the security engineering research domain, most of the existing related research has rather focused on the related but distinct problem of predicting whether a commit introduces or fixes some vulnerability. The problem of determining whether a commit is the fix commit for a specific vulnerability (as described in an advisory) has not received much attention from the research community, despite being of practical relevance.
Our experimentation with FixFinder shows that this method can identify the fix commits of an advisory with a precision of 65.06% and a recall in the top ten (84.03%). This performance makes the tool suitable for practical use in that it allows the effort of the human expert to be dedicated to the (relatively few) residual cases that the tool could not deal with.
The remainder of the paper is organized as follows. In LABEL:motivation, we provide some background information and elaborate on the need for a method to automate the process of finding fix commits for known vulnerabilities in OSS. Section 3 describes the three pillars of the approach; our implementation of this method is presented in Section 4. The evaluation of our method is presented in Section 5. In Section 6, we elaborate on the findings gathered from our experiment, and we outline some opportunities for further research. After a brief overview of the current state of the literature is given in Section 7, Section 8 concludes the paper.
2. Background and Motivation
2.1. Vulnerabilities of Open Source Software
According to the European Union Agency for Cybersecurity (ENISA, 2020), a security vulnerability is a weakness an attacker could take advantage of to compromise the confidentiality, availability, or integrity of a resource. Vulnerabilities can allow malicious parties to steal, destroy or modify sensitive data, causing disruption in the form of data loss, system downtime, etc. Depending on the severity of the vulnerability, the level of damage can be enormous. The damage done is twofold: it affects customers as their personal data such as credit card numbers and passwords can be stolen, and it affects businesses as their data can be stolen and their services can be disrupted.
The adoption of software reuse, particularly of third-party libraries released under open-source licenses, has dramatically increased over the past two decades. It has become so pervasive in today’s software, including commercial products, that the once clear-cut distinction between proprietary and open-source software has gradually blurred. Whereas traditionally software vendors used to have full control on the entire development process of most of the components that made up their products, nowadays a large part of the codebases of those products come from community-developed free open-source (FOSS) projects, managed by independent parties, each with their own unsynchronized lifecycles, heterogeneous quality standards, and development practices. Building upon these free, high-quality, community-developed building blocks, vendors can focus their efforts on differentiating features and deliver innovative capabilities faster. When doing so, however, they become responsible for assessing and mitigating the impact that a vulnerability in those open-source components might have on their products. On average, open-source projects have 180 package dependencies, and a large number of projects can depend on one project (GitHub, 2020): a vulnerability in any one of these dependencies can enable malicious parties to do harm. For example, in the npm ecosystem, the average package has 3.5 million dependent projects but fewer than 40 direct contributors. Moreover, 37% of open-source developers do not implement any sort of security testing during development, while 81% of the users feel developers are responsible for open-source security, and only three in ten open-source maintainers consider themselves to have high security knowledge (Tal, 2019).
2.2. On the Need for Code-level Data about Vulnerabilities and their Fixes
The existing standard for reporting vulnerabilities is the Common Vulnerabilities and Exposures (CVE) identifier. CVEs are assigned by MITRE, a research organization funded by the U.S. government. The largest database of CVE vulnerability data is the National Vulnerability Database (NVD) from the U.S. National Institute of Standards and Technology (NIST). The NVD standardizes the CVE published by MITRE in a data format that enables researchers to directly process their data, and provides an API to query this data.
To enable secure usage of OSS, product development teams are required to frequently scan the open-source components their project depends upon and ensure that they are not affected by known vulnerabilities. Because mapping software artifacts as used in development environments with the metadata in advisories is difficult and potentially unreliable, tools such as Eclipse Steady222https://github.com/eclipse/steady use code-level analysis to determine which software artifact is affected by which vulnerability. To do so, Eclipse Steady relies on the availability of accurate data about the code-level changes (commits) that fix each known vulnerability. To support the tool operation, SAP has manually created a knowledge base of vulnerabilities that affect open-source components used in SAP software (either products or internal tools). Early 2019, this knowledge base was released on GitHub as project “KB” (SAP, 2020; Ponta et al., 2019).
Such commits are used to determine if any dependency of a subject project contains the vulnerable code fragment, and if that code fragment can be actually reached, via concrete executions or static reachability analysis (Ponta et al., 2020).
While one of the advantages of OSS is free availability, accurate (code-level) data about its vulnerabilities and fixes are hard to obtain. These data are often scattered across different sources: public vulnerability databases such as the NVD, project-specific issue trackers, websites publishing security advisories and proprietary databases such as those offered by vendors of software composition analysis (SCA) tools.
This difficulty in obtaining vulnerability data hinders further development of new tools that could push the state of the art in vulnerability detection and mitigation. Also, a considerable effort is spent by multiple parties to independently search for vulnerability data, without addressing the problem at the root.
When initiating a vulnerability analysis from the largest vulnerability database (NVD), finding the commit that fixes the disclosed CVE may be a difficult task; in fact, the fix commit may often not be found at all. This is emphasized by (Schryen, 2011), which reports that for 17.6% of the published OSS vulnerabilities no patch information can be found. To demonstrate that one cannot solely rely on NVD advisories to find fix commits, we performed an analysis of the coverage of the NVD for the fix commits in our dataset.
Jimenez et al. (Jimenez et al., 2018) have proposed an approach to automatically find fix commits for CVEs published in the NVD. Their method relies on two sources of information: (i) CVE IDs in commit messages and (ii) links referred to in NVD. For the latter, their tool checks if the NVD page contains a link to a commit in the repository. However, often NVD does not refer to a fix commit at all, and in practice, there is no one-to-one correspondence between a commit and a vulnerability.
3. Solution Design: General Overview
We propose an approach of automating the process of finding fix commits, inspired by the steps that a security researcher would perform manually. Such an approach is therefore based on three phases, described below, that are functional to reducing the research problem introduced previously into a problem which can be addressed via machine-learning. A high-level outline of the three-phase approach is depicted in Figure 1.
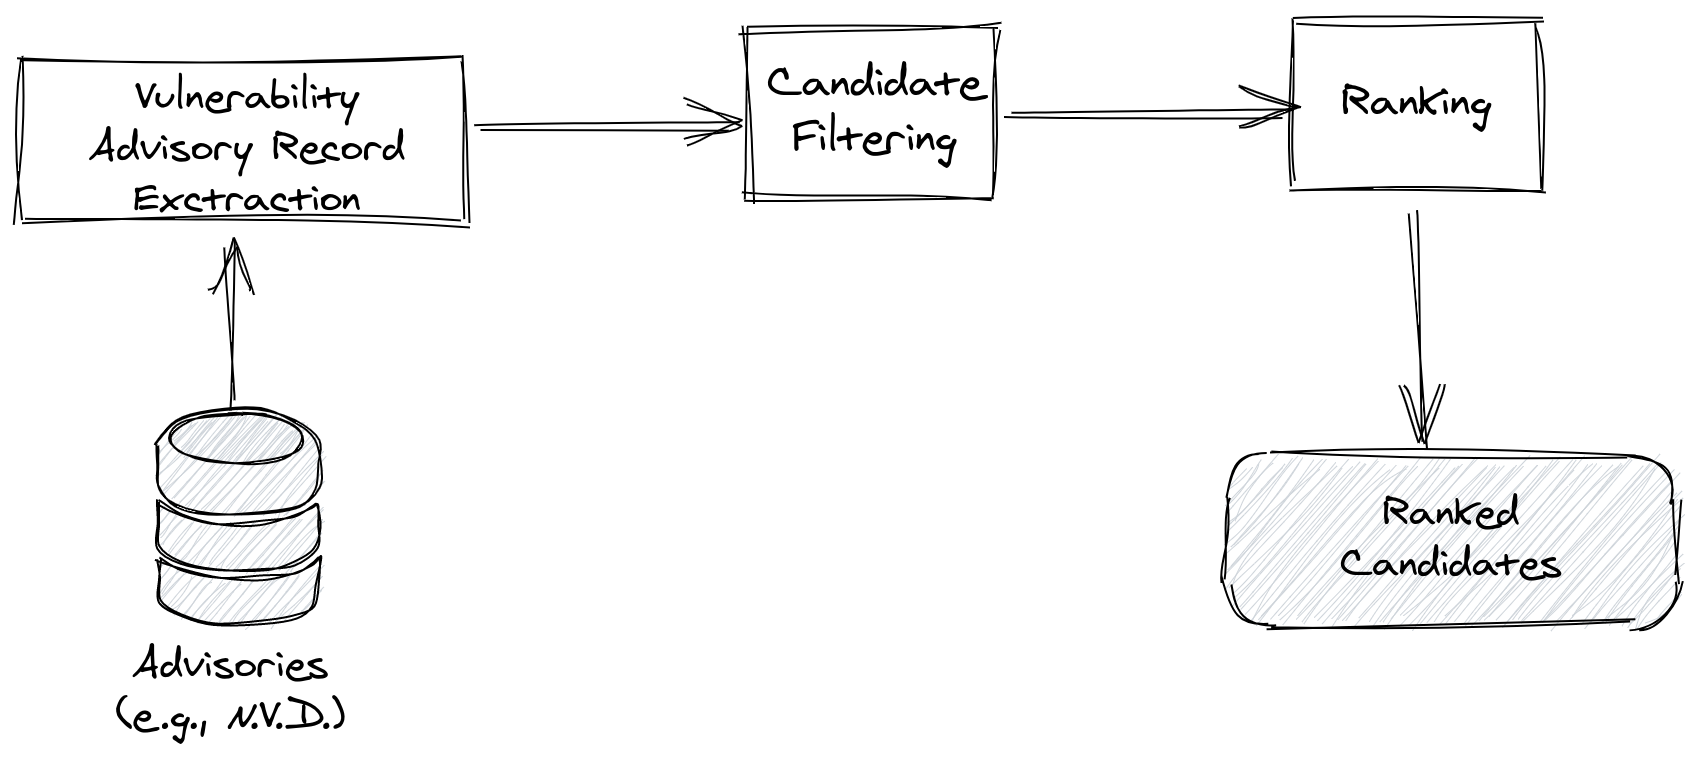
3.1. Phase 1: Information Extraction
The first issue within this phase is to ensure the extraction only the relevant information from all available sources. To this purpose, in this first phase, we create an advisory record, containing all relevant information for a vulnerability expressed in natural language, such as the vulnerability description and the repository URL.
When searching for fix commits for a vulnerability which has been assigned a CVE and is published in the NVD, the NVD can be used to extract data as the vulnerability description, publication date and references.
3.2. Phase 2: Candidate Filtering
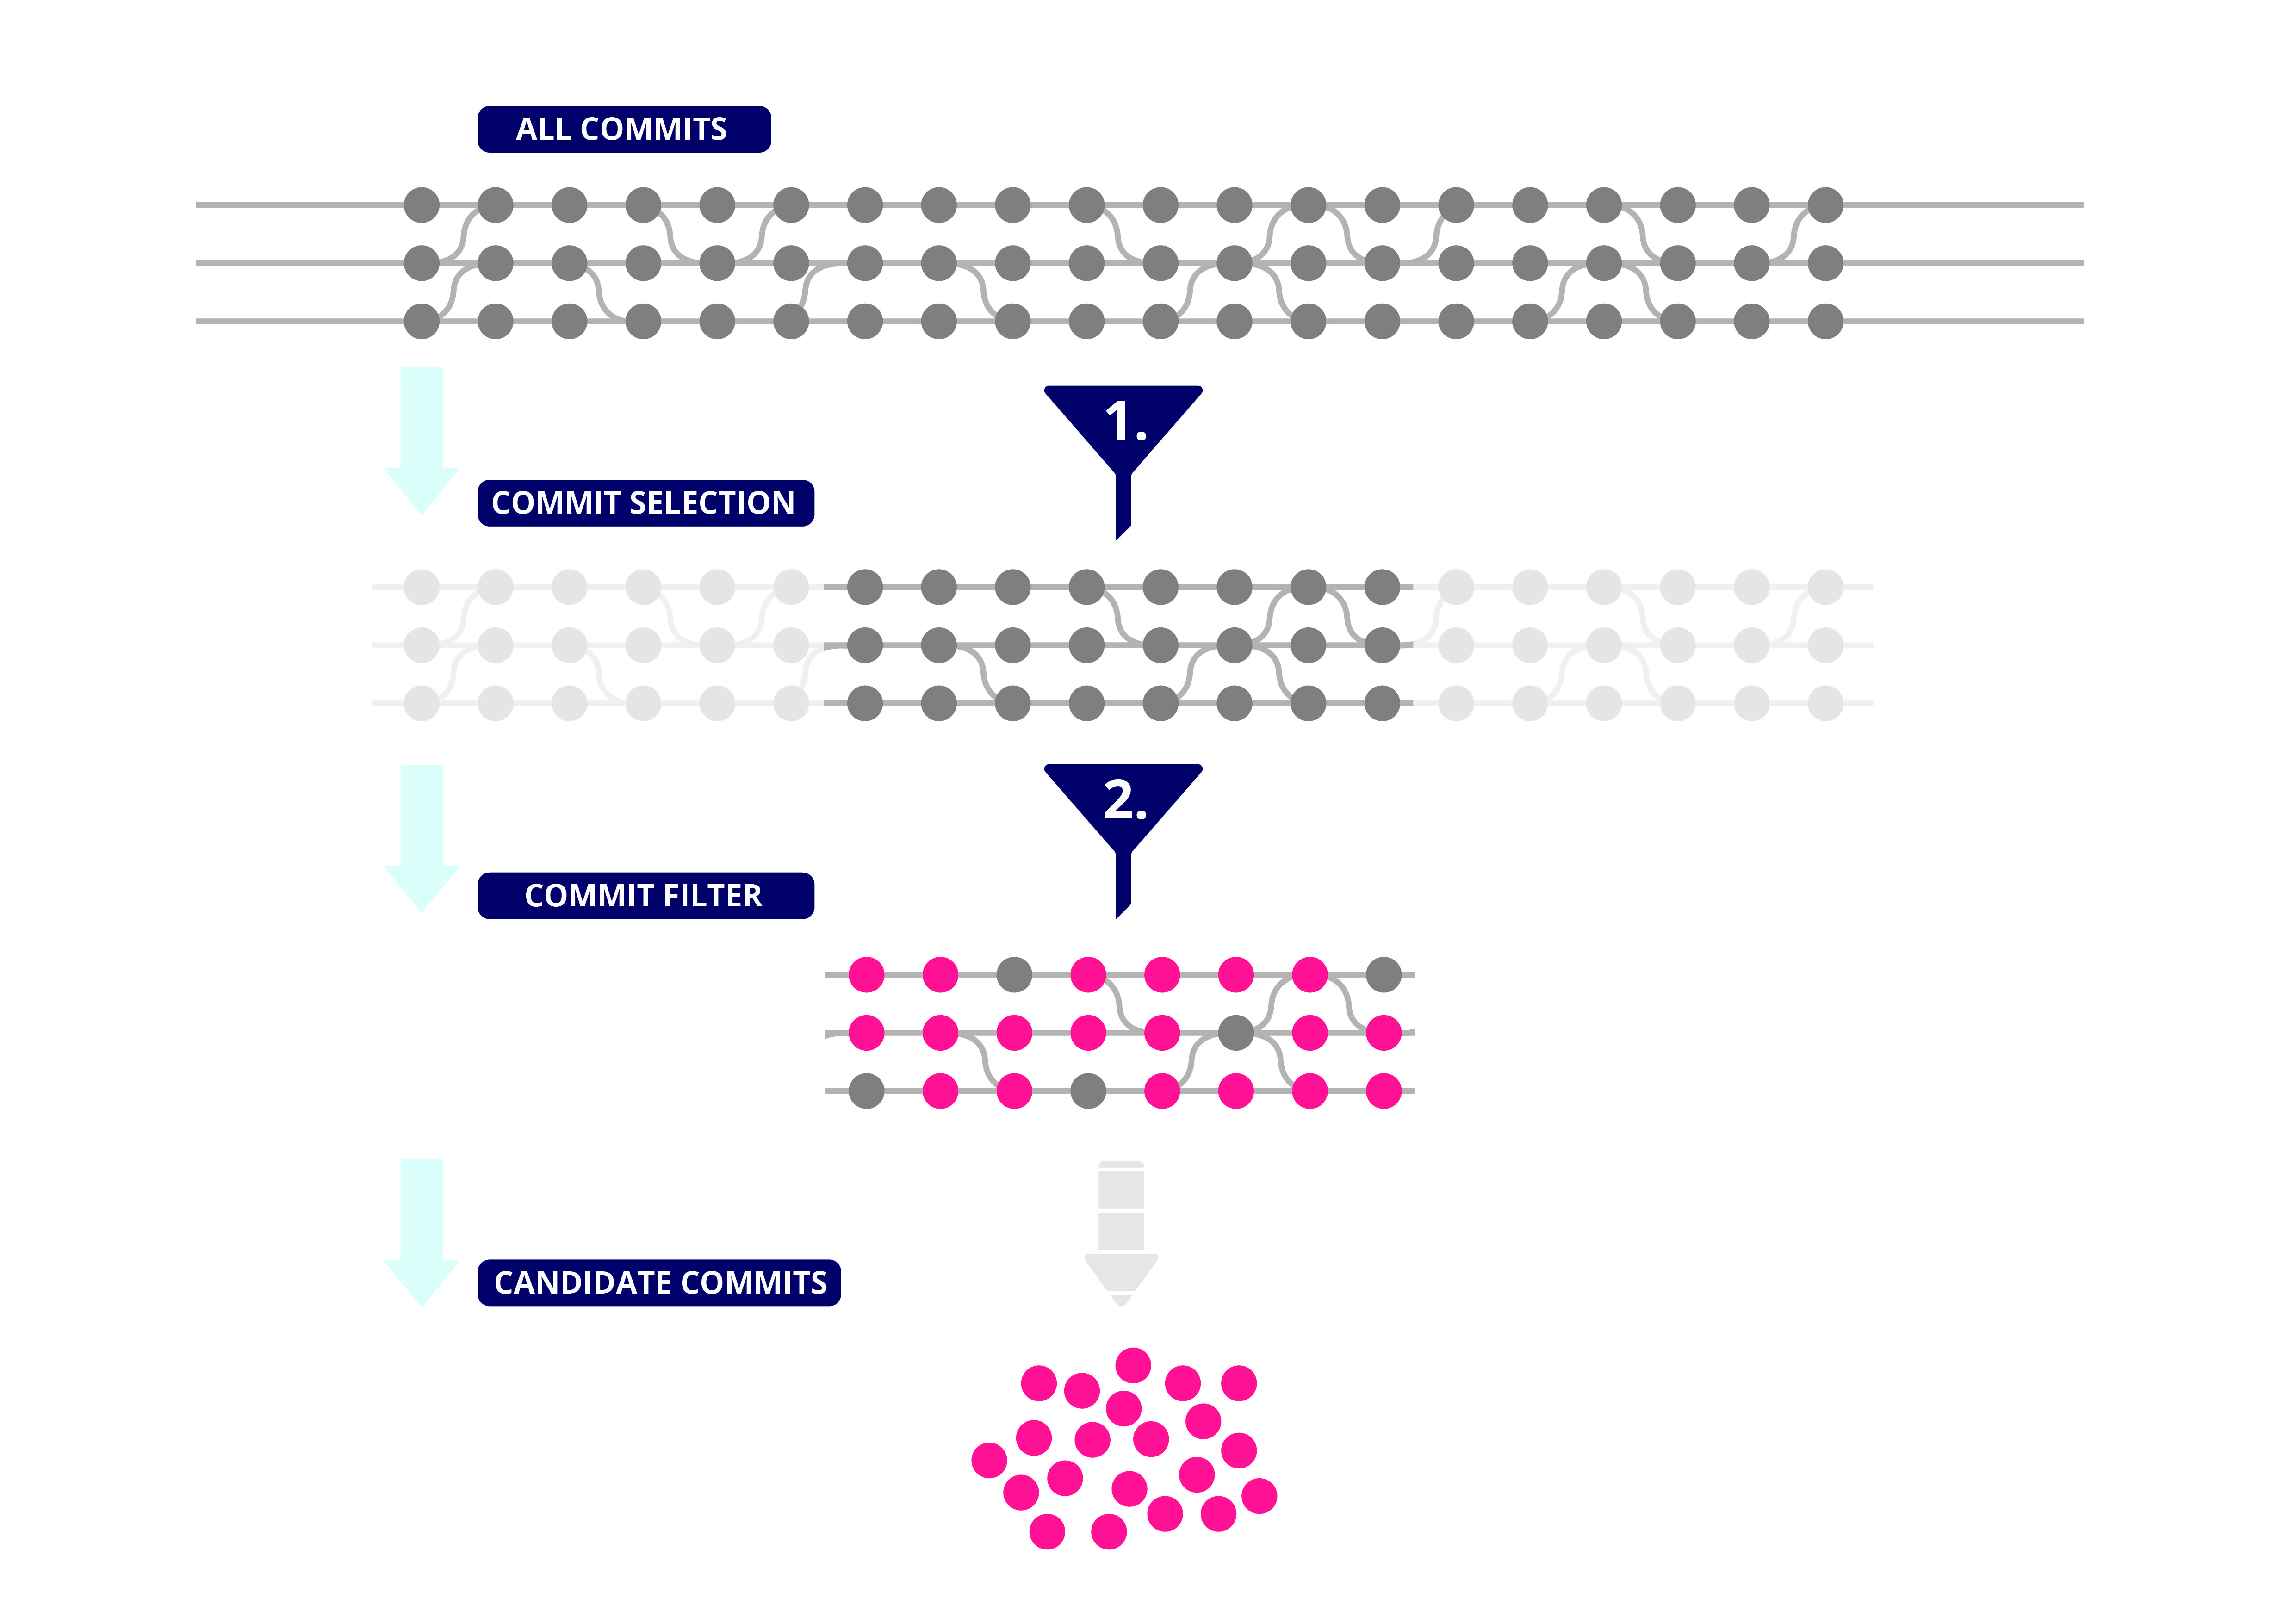
After all valuable information is extracted, such data can be used to identify fix commits. One could regard every commit in a repository as a commit that could be the fix commit. However, as repositories can have a large number of commits (e.g., the git repository of the Linux kernel333https://github.com/torvalds/linux has almost 1M commits at the time of writing, with more being added on a daily basis), identifying the fix commit among this large number of commits would be impractical. Therefore, the next step is to come to a selection of candidate commits, obtained by discarding those that are known to be irrelevant for the vulnerability advisory at hand.
The filter phase has as the objective to reduce the number of commits to consider as a candidate commit without discarding fix commits, which is a trade-off between precision and recall. The larger the number of candidate commits (low precision), the greater the odds that the fix commits are in such selection (high recall). On the other hand, the smaller the number of candidate commits (high precision), the higher the chance of discarding also commits that happen to be precisely the fix commits one is looking for. Figure 2 depicts this procedure.
3.3. Phase 3: Candidate Ranking
As a result of the previous phase, a set of candidate fix commits is determined. The third and last step now consists in ranking such candidates into a list of commits sorted by decreasing probability of being true fix commits. Finally, the most likely fix-commits will appear at the top of the list. This is a standard ranking task which can be approached exploiting a number of machine learning (ML) algorithms. As a preliminary step, a feature space is defined, so that each candidate commit is represented as a vector of informative features. Eventually, these feature vectors constitute the input of a ranking algorithm that assigns a score to each candidate. The task of selecting informative features makes the most relevant part of a ML approach and is described in detail in Section 4. In order to train the learning algorithms, a training set must be built including both fix commits as positive training examples, and non-fix commits as negative training examples, drawn from the same repository (Sabetta and Bezzi, 2018) and respecting their naturally occurring distributions.
4. Prototype implementation: FixFinder
FixFinder 444FixFinder is available under the terms of the Apache 2.0 version from the GitHub repository of project “KB” https://github.com/sap/project-kb, is a prototype implementation of the approach described in Section 3. In the following sections, we detail how we extract the vulnerability information from an advisory, how we prune the large initial number of candidate commits, how we obtain a suitable feature vector representation for them, and finally how we rank the remaining candidate commits.
4.1. Design of FixFinder: a Data-Driven Approach
In order to evaluate our approach, we use the publicly available vulnerability knowledge base disclosed by Ponta et al. (Ponta et al., 2019), extended with additional records that were collected at SAP Security Research after the publication of (Ponta et al., 2019)555These data are still not published at the time of writing, but there are plans for SAP to add them to project “KB” in 2021. Our dataset consists of 1,248 vulnerabilities with vulnerability identifiers (referred to as CVEs), vulnerability descriptions, and a total of 2,391 known fix commit identifiers. While only part of this dataset is currently public, our study can be partially replicated using the dataset by Ponta et al (Ponta et al., 2019), as we show in Section 6.1.
From the initial set of 1,317 vulnerabilities, we removed 69 vulnerabilities for which the affected repository could not be cloned or none of the fix commits mentioned in the vulnerability statement could be obtained after cloning the entire repository666This is due, for example, to commits in our training dataset that belonged to branches that do not exist any longer, making the commit unreachable (and subject to Git’s garbage collection).. This eventually led to a dataset including 1,248 unique vulnerabilities.
There are two common procedures to automatically find fixes for vulnerabilities: through following references in the NVD, or through finding a vulnerability ID in the commit message (Jimenez et al., 2018). There are 2,080 fix commits known for the 1,248 vulnerabilities in the dataset. We added an additional 295 commits as the commit messages contained the vulnerability ID of one of the vulnerabilities in the data, and another 16 commits as the NVD referred directly to these commits. Using this technique, we grew our data set to 1,248 vulnerabilities with 2,391 fix commits.
Since a large number of commits need typically to be compared, we create a data base to store the commit meta-data and content; the commit timestamp, the commit message, the changed files, and the git diff content. The git diff shows what changes have been made in the commit, and compares the two states of the files that have been changed. The information about the two files which are compared was already captured in the ’changed files’ variable thus is not needed. Therefore, a line was only kept if it did not start with ’diff --git’, ’index ’, ’+++ ’, ’--- ’ or ’@@ ’, whereby noise was reduced.
For every column in the database, a pre-processed column is added. The content is pre-processed through removing all tokens that do not contain at least one alphabet letter (i.e., only digits), and tokens that are just one character. The SpaCy NLP Library (Honnibal et al., 2020) is used to tokenize the content, remove stopwords (such as determiners and prepositions) and splitting tokens that are either in CamelCase, snake_case, or dot.case. All resulting words are lemmatized using SpaCy. Finally, all tokens are converted to lowercase.
4.2. Core Vulnerability Information Extraction
The FixFinder workflow begins with an information extraction stage focused on selecting and extracting from advisory pages those pieces of vulnerability information which are deemed both relevant and reliable towards finding fix commits. The considered sources are the NVD and the advisory pages pointed by the NVD. This process is actually an intermediate step towards generating the features supporting the final ML-based ranking task. For every CVE, the selected information pieces are collected into an advisory record that is the distilled, structured version of the available information we could reasonably find about such individual CVE. Since our dataset contains vulnerabilities that have been published in the NVD, we use the new NVD CVE/CPE API to extract data as the vulnerability description, publication date and references. The NVD often refers to advisory pages that are relevant for the given vulnerability. Therefore, we explore how these references can be utilized when trying to find fix commits. To test this, we crawl all references and extract their content, such as all URL references on the sites. We then use this information to create features from. Later on, we will inspect the weights the ML models assign to these features in order to check whether these features bring a positive impact on the predictions.
4.3. Filtering of fix-commit candidates
In order to reduce the amount of processed data, we choose to perform a reasonably safe preliminary pruning on the whole set of commits. We select a subset of the commits in the repository based on the NVD publication date of the vulnerability. In addition, we discard commits that do not change at least one code file by means of filtering on extensions (e.g., commits that just change the documentation of the project). The process eventually generates the actual set of commits that we treat as candidate fix commits.
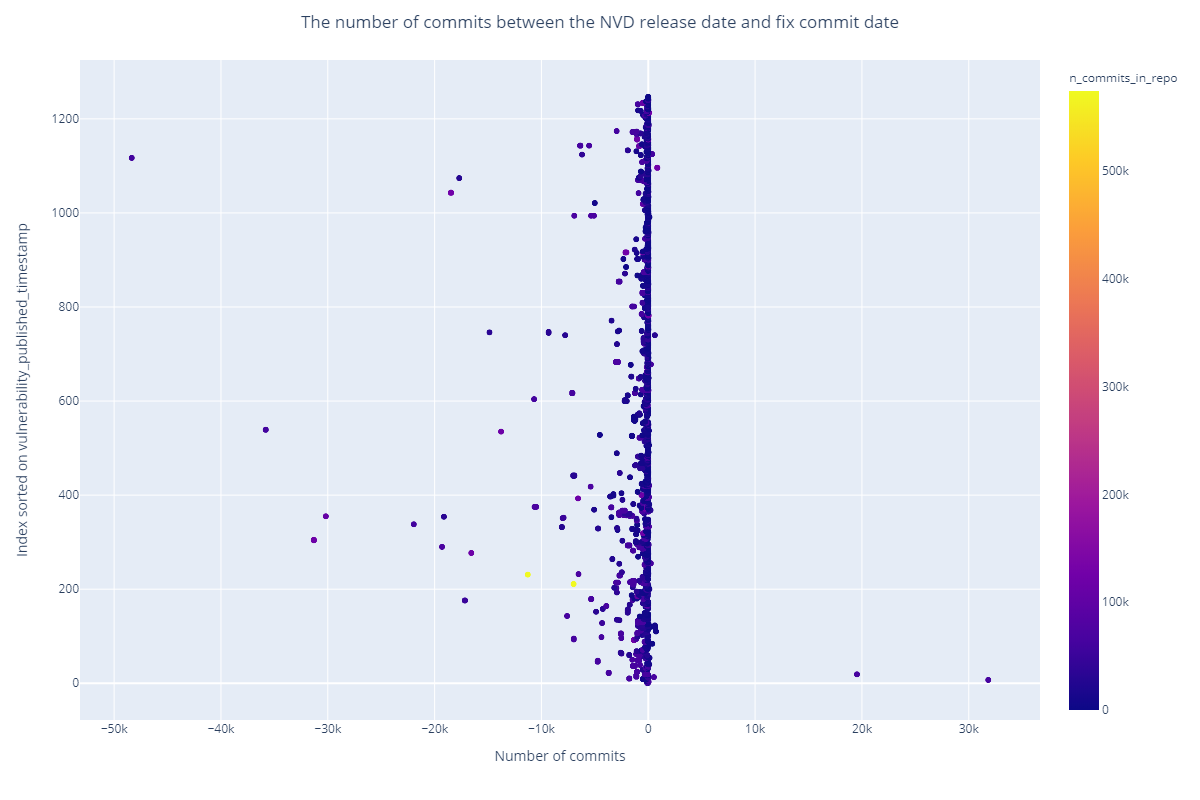
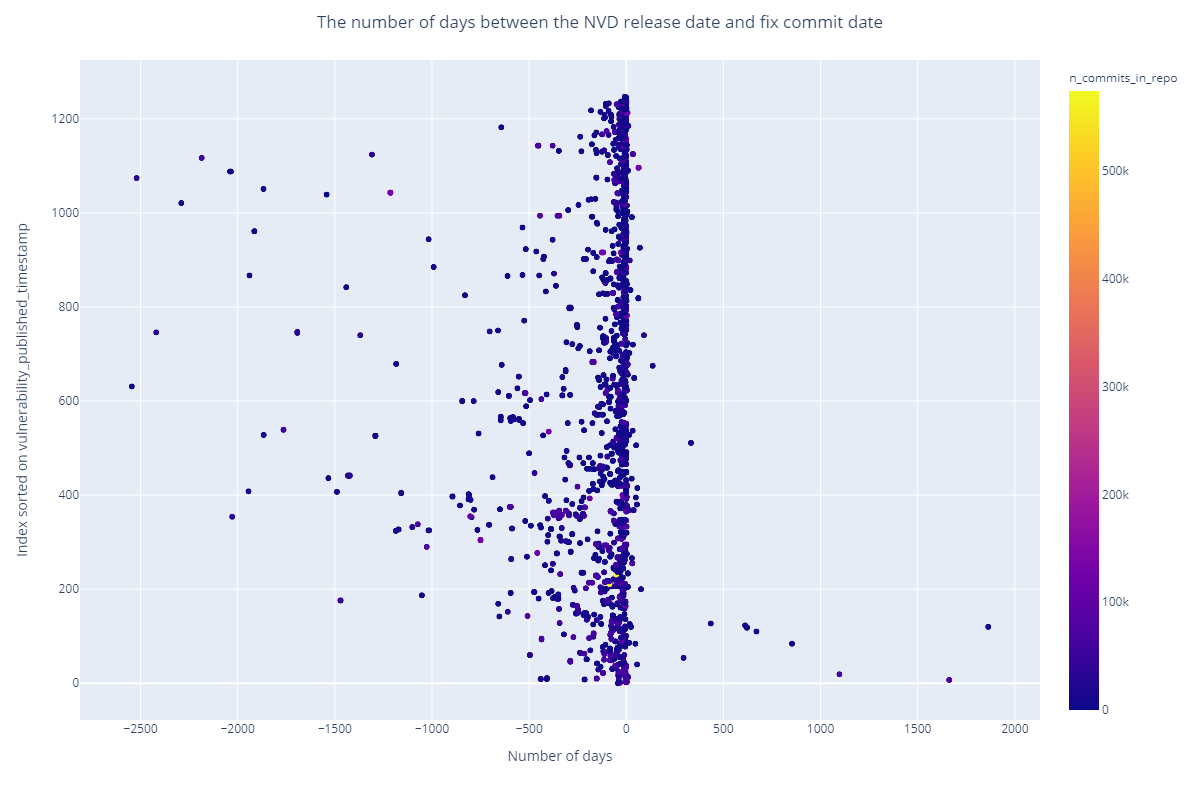
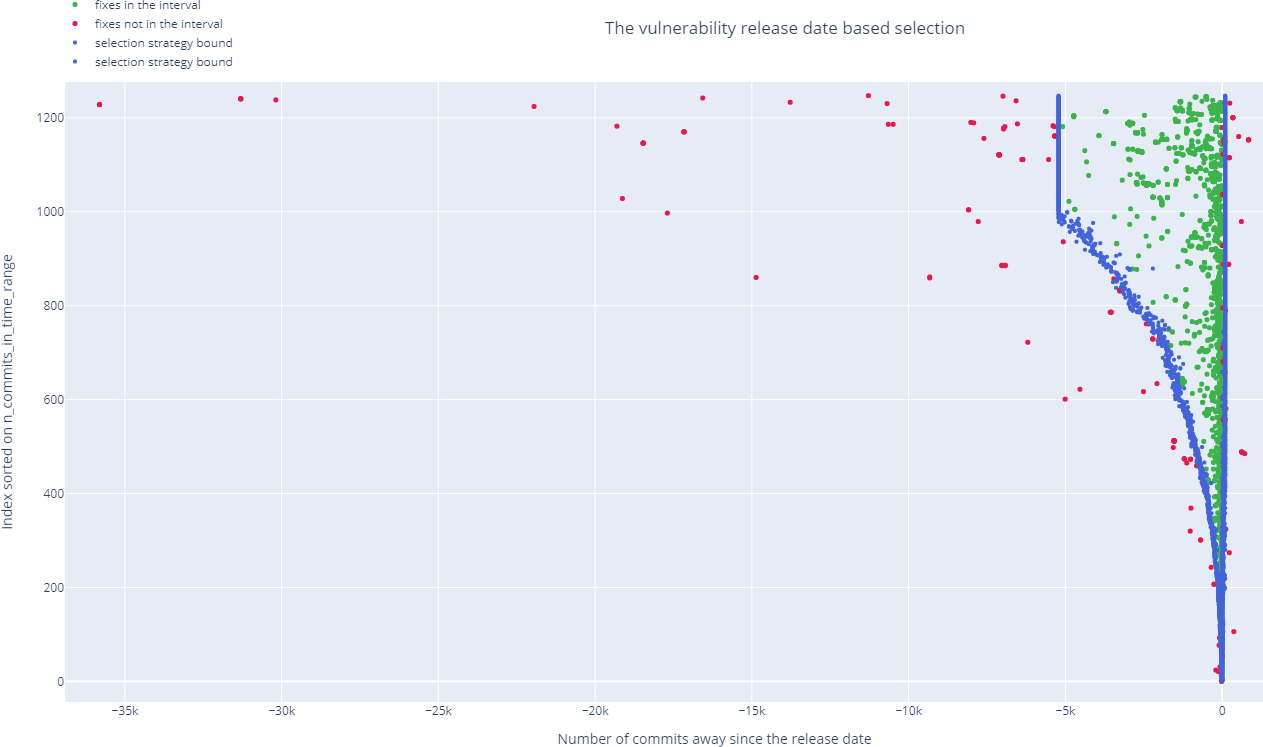
To determine the strategy for filtering the commits based on the distance from the CVE publication, we computed the difference between the fix commits and the CVE publication date and plotted it in Figure 3. The commit distance is the number of commits that can be found between the fix commit timestamp and the CVE publication timestamp, and the days distance is the number of days between these two timestamps. When the number is negative, this means that the fix commit was before the CVE publication. When the number is positive, the fix commit was after the CVE publication. The y-axis reports the indices of the vulnerabilities sorted by publication date of the vulnerability, thus y = 0 stands for the oldest vulnerability in the data.
From Figure 3, we can observe that various fixes are far away from the CVE publication date. Therefore, trying to determine an interval that captures all commits, based on the CVE publication date, would result in a too large number of candidate commits, which would be impractical to treat. Please consider that this filtering could hinder the recall of the approach. Nevertheless, the interval should be selected to find the correct balance between lower recall and higher scalability. To come to an initial selection of candidate commits, we select all commits within two years before and one hundred days after the release date with a maximum number of commits of respectively 5215 and 100 commits. This selection strategy, visualized in Figure 4, results in a selection recall of 93.59% but reduces the number of commits to 11.00%.
After we determine this commit interval, we select all commits within it. From this selection, commits that do not change the actual code can be discarded since a fix commit should at least change one code file. This can be achieved through the criterion that a commit should have changed at least one file with a relevant extension. The exact list of those considered in our implementation is: ["java", "c", "cpp", "h", "py", "js", "xml", "go", "rb", "php", "sh", "scale", "lua", "m", "pl", "ts", "swift", "sql", "groovy", "erl", "swf", "vue", "bat", "s", "ejs", "yaml", "yml", "jar"].
For every candidate commit, we check whether the commit changes at least one file with a relevant extension through splitting the filenames on the dots (e.g. ’example.py’ becomes [’example’, ’py’]) and checking whether the last element of one of these files is in the list of relevant extensions. If the commit does not change a relevant file, we filter it from the selection. We regard the remaining commits as candidate commits.
4.4. Feature Engineering for the commit ranking task
For every candidate commit, we create a corresponding feature vector, which constitutes our set of independent variables. This feature vector comprises multiple component features that take numeric values providing information on the candidate commit. In total, 23 features are extracted to predict the probability of a candidate commit being a fix commit and sort the commits based on this probability score, which constitutes our dependent variables. For this prediction task, we evaluate five ML models. The features used as independent variables by the model and needed for the ranking task are the following.
- Vulnerability ID in message.:
-
As explained in LABEL:motivation, one way to find fix commits for a given vulnerability is to search for commits that include the CVE vulnerability identifier in the commit message. Therefore, we create a feature that contains this information. When the vulnerability ID is found in the message the feature value equals 1.0, otherwise the value equals 0.0. It is important to emphasise that the goal of our approach is not to find any fix-commits (that is, the fix commits of any vulnerability), but rather to find the particular commits that fix the vulnerability at hand777In other words, if our approach is used to find the commit(s) fixing vulnerabiilty and it comes across candidate commit whose commit message says “This is the fix to security vulnerability ”. Reporting as a fix for would be wrong: generally speaking, is definitely a security fix, but not the one we’d be looking for.. For this reason, we add another feature that indicates whether a vulnerability ID, other than the one of interest provided as input, is mentioned in the commit message of the candidate. The value of this additional feature is set to 1.0 when the identifier of the vulnerability of interest is not in the commit message but the string ’CVE-’ is present instead (indicating that some other vulnerability is mentioned), otherwise it is set to 0.0.
- ‘Referred to’ features.:
-
The second method to find fix commits that is proposed by Jimenez et al. (Jimenez et al., 2018), and adopted by others, is through following the hyperlink Web references in the NVD. When a NVD entry refers to a commit in the repository of the affected project, such commit is labelled as a fix commit. Therefore, we create a feature that reflects whether the references in the advisory record contain a reference to a commit. In practice, when a URL contains the string ’/commit/’, the first eight characters after this pattern are stored in a list. Then, for all candidate commits, we check whether the first eight characters of the commit ID can be found in this list. If this is the case, the value for these feature equals 1.0, and 0.0 otherwise. As it can be seen in LABEL:tab:nvd_reference_analysis in LABEL:motivation, only 7.53% of the known fix commits is referenced by the NVD. Therefore, we create another feature which reflects whether the commit is referred to by an advisory reference. By means of web-scraping, we extract all URLs from the references in the advisory record (advisory pages). We then recursively apply the same approach as described above to provide a score that reflects whether a commit is mentioned by one of the advisory references.
- Commit statistics.:
-
There are some commit statistics that can be used as a predictor for a commit being a fix commit, such as the spread of the patch (Sawadogo et al., 2020). A commit can change an arbitrary number of files and an arbitrary number of lines which can be represented as the spread of the patch: the more files and continuous blocks of lines (hunks) have been modified, the more spread out the patch is. Therefore, we create three different individual features indicating the spread of the patch: the number of hunks, the average hunk size, and the number of changed files.
- Commit message references.:
-
On GitHub, developers can create ‘issues’ to report bugs such as vulnerabilities or ‘pull requests’ to propose modifications to a repository. When a commit fixes an issue or follows up on proposed modifications in a pull request, various commit messages refer to other resources such as issue tickets, i.e., ’Close #306 and #359’, which is not a useful commit message on its own. However, this might be a predictor for fix commits. Therefore, we add a feature that is equal to 1.0 if the commit message contains a reference by means of a hashtag followed by digits, and 0.0 if this is not the case. Next to git issues, the Jira tool888https://www.atlassian.com/software/jira is often used as a bug and issue tracking system for OSS projects. Jira references match the pattern NAME-REF, e.g., for Apache Solr a Jira issue can be SOLR-12345. Therefore, we add another feature that is equal to 1.0 if the commit message contains a Jira reference found through this pattern, and 0.0 if this is not the case.
- Path similarity score.:
-
It can be the case that a vulnerability description provides a lot of information, and can even mention the file that was vulnerable. When such a file (usually a file path) is provided, it is very likely that the fix commit should change this file. Therefore, we add a path similarity feature. First, we extract the paths from vulnerability descriptions. When a path is found, we split this path and all paths the commit changes on dots and slashes, and reverse the list of path components. Depending on whether or not the path extracted from the description contains an extension, we remove the extensions from these lists. For every file we count how long the longest sub-list of similar elements is when starting from the front. Thus if ’example/file.py’ is extracted from the description and one of the changed files was ’project/main/example/file.py’ the longest matching sub-list is of length three ([’py’, ’file’, ’example’]). If the found path contains an extension and the longest matching sub-list has length equal to 1, hence just a matching extension, we do not add this score. We compute this score for every changed file and add the maximum score to the feature, which we do for all paths found in the vulnerability description — remember that a description may mention multiple paths. The pseudo-code of how the value for this feature is computed is detailed in Algorithm 1.
Algorithm 1 Compute path similarity score 1:path similarity score = 0;2:for path in the vulnerability description: do3: intermediate score = 0;4: Split path on special characters;5: for changed file in all changed files: do6: Split changed file on special characters;7: similarity score = longest matching sub-list from the end;8: if path contains extension and similarity score 1: then9: if similarity score intermediate score: then10: intermediate score = similarity score;11: path similarity score += intermediate score;12:return path similarity score; - Lexical similarity features.:
-
While other approaches try to predict whether a commit is a fix commit for a vulnerability, our approach is centered around predicting whether a commit is a fix for a specific vulnerability. Therefore, we assume that the actual fix commits have high lexical similarity with the vulnerability description, through e.g., mentioning the same vulnerable components and vulnerability threats. The abstract approach to model such situation lies in mapping a vulnerability description and the commit information onto a joint feature space where their similarity can be established. A widely adopted method for this is term frequency-inverse document frequency (TF-IDF), which has been applied to vulnerability descriptions before (Sawadogo et al., 2020). TF-IDF increases importance of words that do not occur often in the entire corpus, and thereby adjusts for words that appear more frequently in the entire corpus. As the lines in the git diff contain code, the standard code constructs are becoming less important that project specific component names such as class and function names. For this, the TfidfVectorizer function from Scikit Learn’s feature extraction module was used (Pedregosa et al., 2011).
We perform the same pre-processing steps on the vulnerability description and on the commit content. However, sometimes the git diff contains hundreds of thousands lines. Therefore, we consider only the first ten-thousand lines. For each advisory record, we create a separate array for each commit component; Thus, one corpus contains all commit messages of all candidate commits, one all changed file names, and one all git diff information.
We then compare the elements in these arrays with the vulnerability description, code tokens, and the advisory references content. The code tokens are the tokens in the vulnerability description that are in CamelCase, snake_case, or dot.case, and are no path. The advisory references content was extracted through scraping all references the NVD refers to, from which we take the 20 most frequently occurring words after the texts have been preprocessed. To the vulnerability description that we compare with the commit messages, we add a list of fix indicating words in order to assign them additional importance: [’security’, ’cve’, ’patch’, ’vulnerability’, ’vulnerable’, ’advisory’, ’attack’, ’exploit’, ’exploitable’].
Next, we fit three different TF-IDF vectorizers on the three arrays. The vectorizer transforms the description, code token list, advisory references content, and the commit content to vectors. We compute the cosine similarity for each candidate’s feature vector with the description vector, the references content vector, and the code token vector. The cosine similarity score is a value that is between 0.0 and 1.0, where the higher the score the higher the similarity. This results in three vectors for each commit feature, hence nine lexical similarity features.
- Commit distance to vulnerability release.:
-
We also add two features reflecting the distance between the vulnerability release date and the commit date, one reflecting the distance if the commit was done before the vulnerability release, and one if the commit was done after the vulnerability release. We decided to create two distinct features to allow for an easier interpretation of the scores that are assigned to the features. The value for the feature reflecting the time distance before the vulnerability release is equal to 0.0 if the commit is after the release date, and between 0.5 and 1.0 if the commit was before the vulnerability release. The closer the commit is to the release, the higher the value. Hence, the ’first’ candidate commit has a value of 0.5 and the ’last’ commit that was still before the vulnerability release has a score of 1.0 for this feature. For the time distance after the vulnerability release, this is the other way around. If a commit was before the vulnerability release date the score is 0.0, and if the commit was after the score is between 0.5 and 1.0, where the higher the score the closer the commit was to the vulnerability date. Please consider that ’time distance before’ and ’time distance after’ could be combined into one feature like ’absolute time distance’. However, we decided not to go in this direction for the sake of interpretability.
- Reachability score.:
-
It can take a long time before a vulnerability is released after it has been actually discovered and patched ( Figure 4), whereby the two time-based features might not be a good predictor. As commits in GitHub are in a tree structure, not every commit is reachable from a given tag. Therefore, we add another feature that reflects the distance to a commit from the last vulnerable version. Figure 5 presents an example of such tree structure and shows how the branches of this tree are used in software development, where commits are illustrated by circles and the tags are illustrated squares showing version numbers. Referring to this example, the commits that are reachable from e.g., version 1.6.0 are the commits that are before this tag and in the same branch (i.e., commits belonging to tag 1.5.0). Commits that are in the same branch but after the current tag (i.e., version 1.7.0) or in a different branch (i.e., version 1.4.2) are not reachable. This reachability can be translated into a predictor for being the fix when a vulnerability description mentions that e.g., version 1.6.0 is no longer vulnerable, the fix should be reachable from this tag.
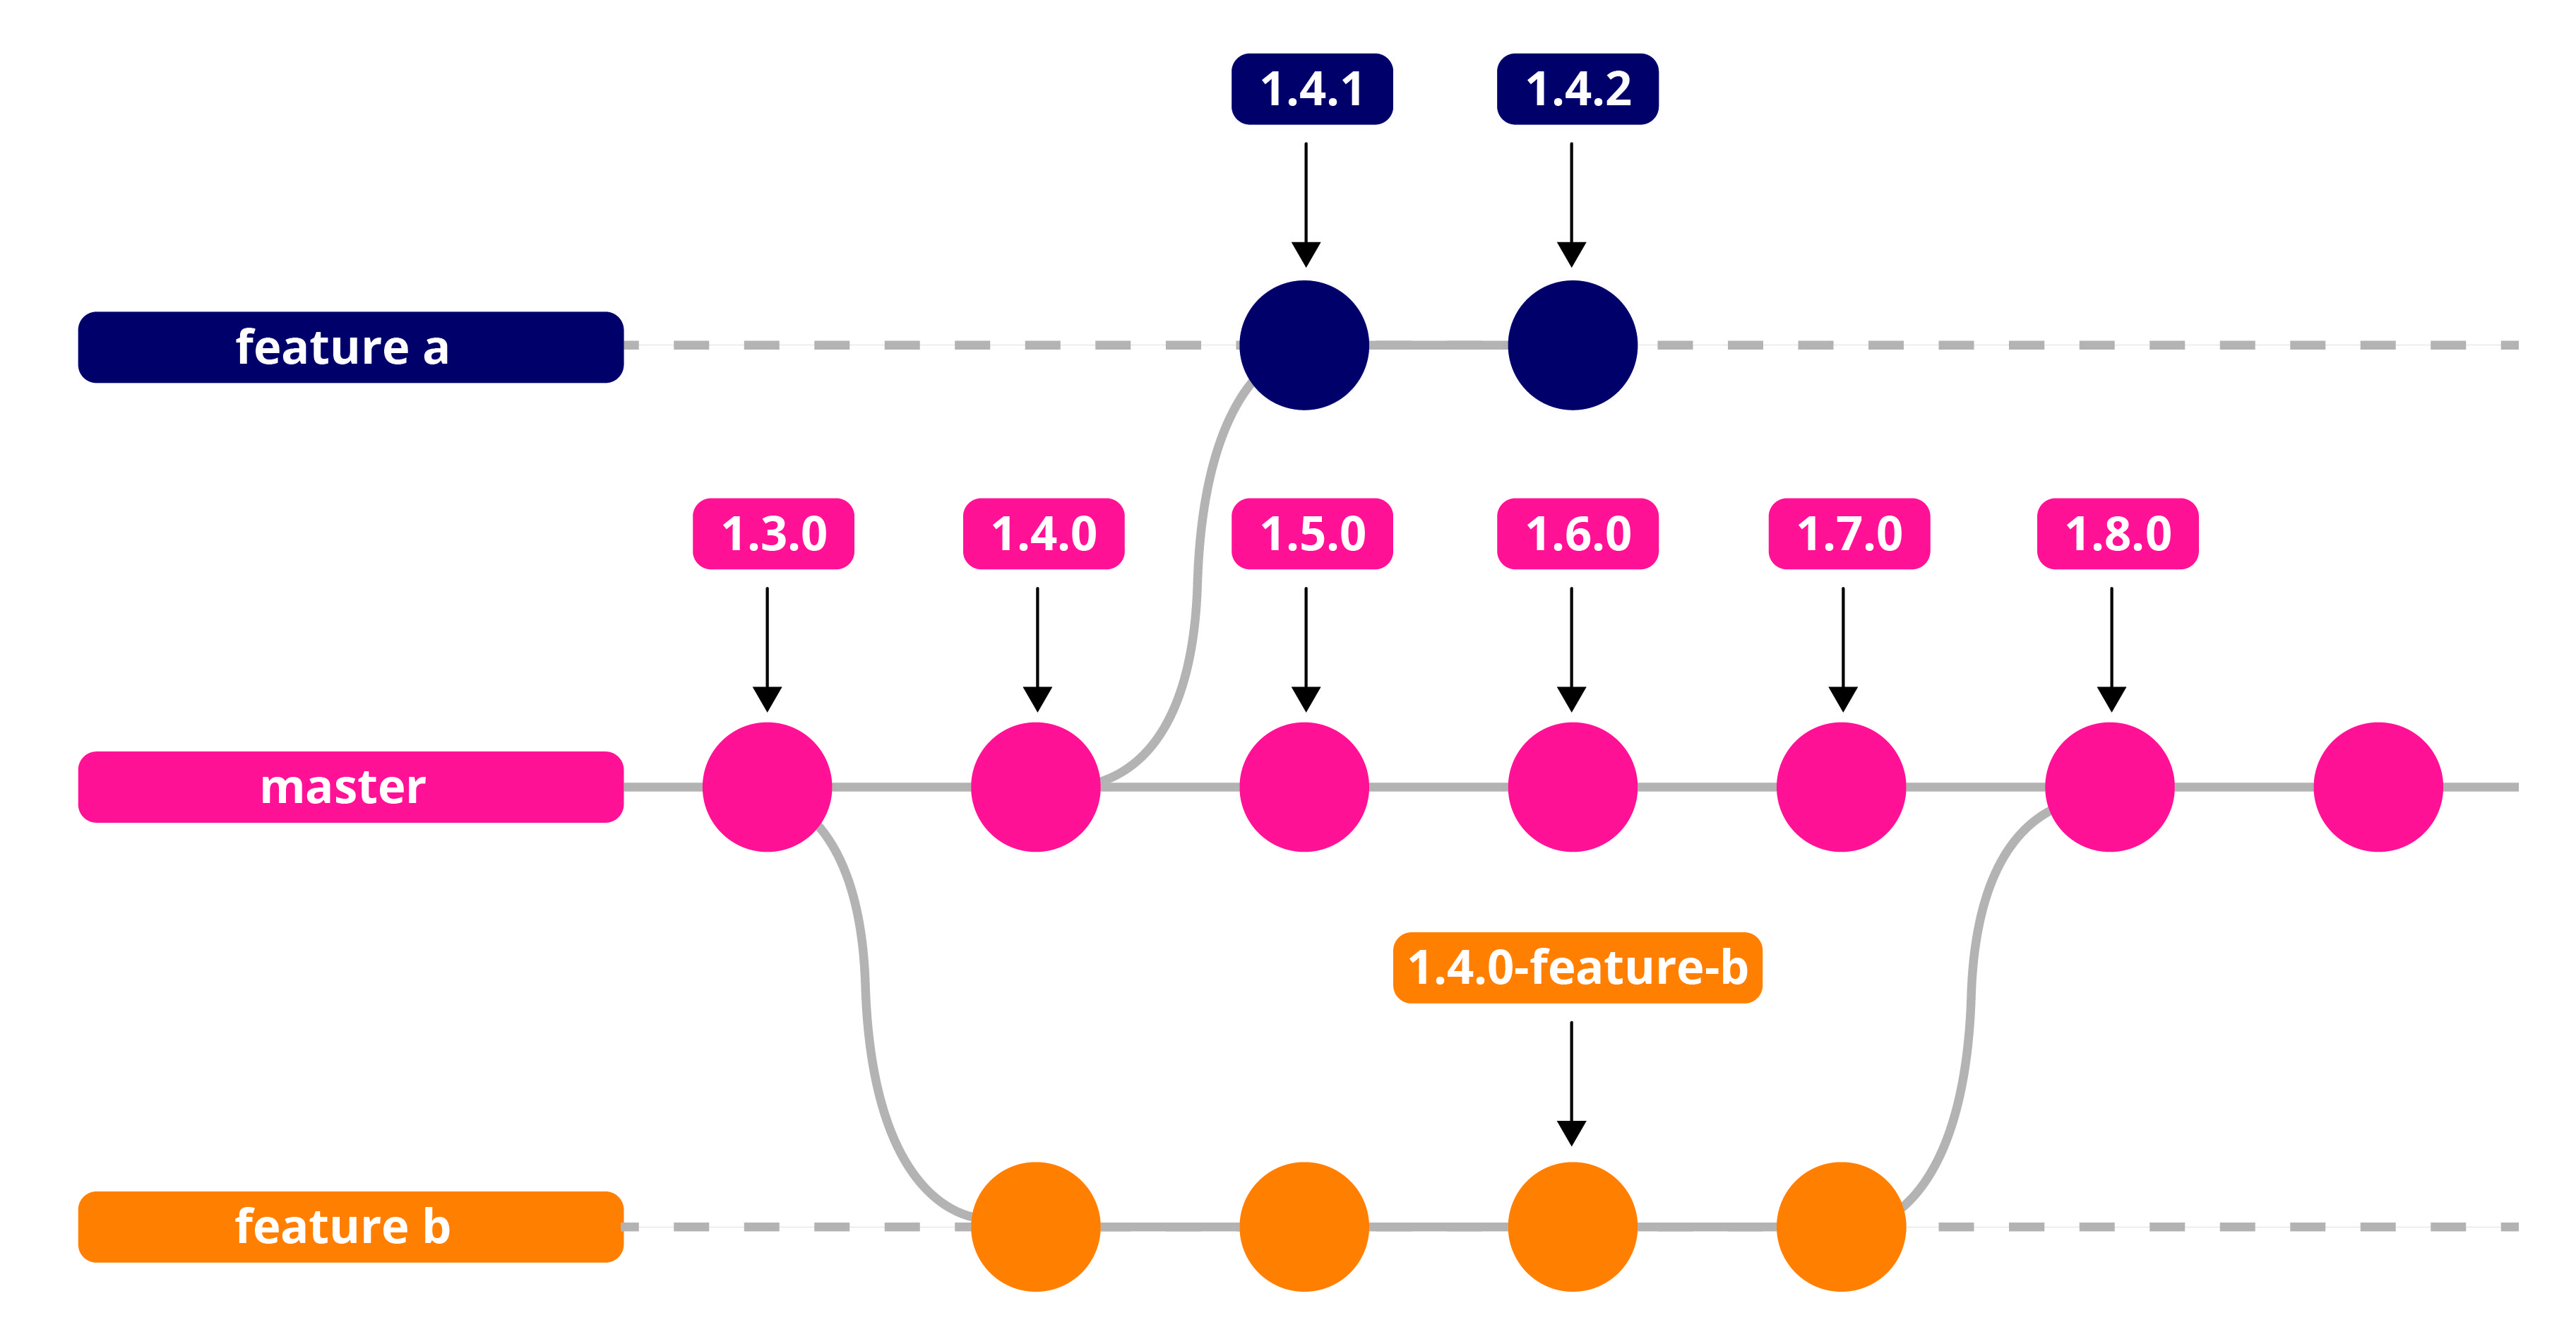
Figure 5. An illustration of how Git’s branch-based version works for an example with three different branches. We compute the reachability score by the following steps. First, we add all tags from the repository to a tree where only the tags from the same major and minor version are in the same branch. We sort the tags in the branches on the tag timestamp (visualized in Figure 6 in Appendix A). We then extract the version numbers from the vulnerability description, and map these to tags from the repository. For every tag that we find in the repository, we find the next tag by means of the sorted tags tree if there is a later tag with the same major, otherwise the original tag is used to calculate reachability from. For every candidate commit, we compute a list of scores where every element is the reachability score from the tags that have been found: this reachability score is 0.0 if it is not reachable (or not within 100 days of the tag), and 1.0 - where is 0.01 for every day between the tag timestamp and the commit timestamp (i.e., 0.95 if the commit was 5 days before the tag has been created). For every candidate commit, we use the maximum value in this list as the value for the reachability feature.
The one-hundred days difference we mentioned is heuristic based on the data of (Ponta et al., 2019), from which we could observe that most fix commits fall within a one-hundred days interval before or after the date of a tag (release). Therefore, we decided to provide a higher score for reachable commits within one-hundred days from a version that was mentioned. The commits that are not within one-hundred days but are reachable get the same score as commits that are not reachable. We take this approach as branches with new features are frequently merged with the main branch, whereby all these commits become reachable. This can be seen in the example in Figure 5, where the ’feature b’ branch is merged before tag ’1.8.0’ and the commits in this branch become reachable from ’1.8.0’, whereby almost all commits from the repository have become reachable. Therefore, if we were to assign a score for all reachable commits, the importance of this score might decrease as a large number of commits are reachable.
- Vulnerability timestamp.:
-
The last feature we add is the vulnerability timestamp to allow models to learn a certain development over time, as it can be the case that over time the OSS community has become e.g., faster at fixing vulnerabilities.
4.5. Feature scales and normalization
When the features in the input data have different scales, one feature can have more influence than another feature. Therefore, it is advisable to scale features before providing the data to a ML algorithm. The majority of the features is already a value between 0.0 and 1.0 but for instance the number of hunks is an integer that can be very large. To account for this, we apply the MinMaxScaler from Scikit Learn (Pedregosa et al., 2011). We could apply a vulnerability specific scaling, where we fit-transform the MinMaxScaler for every vulnerability on just the candidate commits for this vulnerability. Hereby, e.g., the largest number of changed files from this candidate commit selection could be ten, would be scaled to 1.0. For another vulnerability, this number could be one-hundred, which would also be scaled to 1.0. For some features this makes sense, such as the lexical similarity features as it might be more valuable to know which of the candidate commits had the highest lexical similarity with the vulnerability description than knowing that it had a relatively high score regarding the lexical similarity for all candidate commits and their vulnerabilities. However, for some features such as the number of changed files, it might make more sense to look universally (all candidates for all vulnerabilities).
Therefore, we take a combination of the two: The features vulnerability ID in message, other vulnerability ID in message, referred to by NVD, referred to by advisories, message contains GitHub issue reference, message contains a reference to a Jira issue, time distance before, and time distance after are already values between 0.0 and 1.0. We scale the features number of hunks, average hunk size, (vulnerability timestamp,) and number of changed files universally, as we regard these features not vulnerability or project specific features. We scale the features path similarity score and the nine lexical similarity features vulnerability specific, as we regard these features to be vulnerability specific as they depend on the vulnerability description.
4.6. Model Training
After we create and scale the feature vectors for the candidate commits, the candidate commits can be ranked based on the scores for these features. This task can be approached as a ML task, by means of predicting the probability of being a fix commit for this vulnerability and sorting the candidates based on this probability score, for which we use the Scikit-Learn predict_proba method (Pedregosa et al., 2011). Our choice of algorithms and the report of their performance are presented in the next section.
5. Empirical Evaluation
5.1. Data Preparation
In order to train a ML model capable of predicting the probability of each candidate to be a fix commit, train and test dataset need to be created. This does not just yield randomly shuffling the vulnerabilities and selecting a subset because of the imbalance of the dataset, as there can be thousands of candidate commits for just one known fix commit. One of the decisions to make is the number of negative samples for every positive instance (Sabetta and Bezzi, 2018). In our research, we use a train and test dataset containing one negative and one positive candidate commit for each vulnerability (from the same repository). We then use this dataset was to train a classifier in classifying feature vectors to either negative or positive. When ranking the candidate commits, we use this classifier to predict for every feature vector the probability of being a fix commit, so we can sort the candidate commits based on this score.
5.2. Experiment Setup
The algorithms we evaluate are Support Vector Machine Classifier (SVC), Logistic Regression (LR), k-Nearest Neighbors Classifier (KNNC), Random Forest (RF), and Adaboost Classifier (AB). For each algorithm, we tune the parameters by means of bayesian optimization (Table 1). Such method is an effective way to optimize functions such as the hyperparameter setting, as the sampling of parameter values does not occur randomly but an acquisition function is used to estimate the likelihood of a sample being worth to evaluate based on uncertainty. The sample that has the highest value for this expected improvement is evaluated, reducing uncertainty in this area. After twenty iterations, the optimal model is returned and it is subsequently used to predict for every feature vector its probability of corresponding to a fix commit. The candidate fix commits are sorted over such probability score. Thereby, the candidate with the highest probability of being a fix commit results to be in the first position. We do this ten times with randomly selected train and test splits, and by using the models from Scikit-Learn (Pedregosa et al., 2011).
| Algorithm | Parameter (Range (scale)) | Parameter (Range (scale)) |
|---|---|---|
| SVC | C (1e-12 - 1e+12 (log)) | gamma (1e-12 - 1e+12 (log)) |
| LR | C (1e-12 - 1e+12 (log)) | l1-ratio (0 - 1 (real)) |
| KNNC | n_neighbors (1 - 200 (int)) | p (1 - 2 (int)) |
| RF | n_estimators (1 - 400 (int)) | max_depth (1 - 20 (int)) |
| AB | n_estimators (1 - 400 (int)) | learning_rate (1e-6 - 2 (real)) |
The selection based on the vulnerability release date results in 2,753,058 candidate commits for 1,248 vulnerabilities, reducing the number of commits to consider to 11.00%. From these 2,753,058 candidate commits, we removed 422,312 commits as they do not change any file with a relevant extension, which reduced the number of candidate commits to 9.32%.
For every candidate commit in the filtered subset, we created a feature vector composed of 23 features. These feature vectors are then used to predict the probability of a candidate commit being a fix commit for a given vulnerability. The results in this section are for the 1,166 vulnerabilities for which the selection includes at least one known fix commit (making it possible to rank). The results have been calculated on the same ten randomly created splits of the data, with 933 vulnerabilities in the training sets and 233 vulnerabilities in the test set (80/20 train/test split). We compare the performance of five different models to the baseline methods described in LABEL:previous_methods: (i) CVE ID in message, (ii) referred to by the NVD, and (iii) (Jimenez et al., 2018). To analyse the extent to which the NVD refers to fix commits for the vulnerabilities in our dataset, we use the NVD CVE data feeds999https://nvd.nist.gov/vuln/data-feeds to extract the URLs that can be found under the section ’References to Advisories, Solutions, and Tools’ on the NVD-page of the vulnerability.
| Method | Top-1 Recall | Top-5 Recall | Top-10 Recall | Top-20 Recall | Avg. Pos. | |
| FixFinder | Adaboost | 62.67 (2.5) | 75.89 (2.81) | 83.26 (2.13) | 87.68 (2.1) | 24.25 (8.86) |
| k-Nearest Neighbors | 18.04 (9.38) | 27.13 (15.24) | 39.22 (14.86) | 54.70 (12.55) | 108.65 (35.5) | |
| Logistic Regression | 65.06 (1.91) | 77.68 (1.41) | 84.03 (1.22) | 88.24 (1.0) | 22.89 (5.47) | |
| Random Forest | 56.77 (1.96) | 73.13 (1.39) | 81.54 (1.58) | 87.58 (1.81) | 18.50 (4.81) | |
| Support Vector Classifier | 61.89 (5.44) | 75.72 (3.65) | 82.64 (2.65) | 87.37 (2.31) | 22.48 (5.83) | |
| Baseline | CVE ID in message | 12.60 (1.93) | ||||
| Referred to by the NVD | 12.04 (2.46) | |||||
| (Jimenez et al., 2018) | 23.24 (2.45) |
5.3. Results of the Model Comparison
Table 2 shows the results. For 65.06% of the vulnerabilities a fix commit is the first result, and for 84.03% at least one fix is in the top ten (using the best-performing model, i.e., logistic regression).
FixFinder outperforms all the considered baselines. Indeed, when looking at our data set, we find that for only 12.60% of the vulnerabilities, at least one fix commit can be found by looking for the CVE ID in the commit messages. By counting how often the first eight characters of the fix commit ID could be found in one of the NVD references, we find that at least one fix commit can be found for only 12.04% of the vulnerabilities in our data. Through applying the approach of Jimenez et al. (Jimenez et al., 2018), we find that for only 279 vulnerabilities 22.36% a fix can be found through looking for the vulnerability identifier in the commit message or following the references in the NVD. This result emphasizes the need for a more reliable method to find security-relevant commits, such as FixFinder. Please consider that all machine learning models but kNN outperform the baselines, suggesting that the feature engineering previously described can significantly improve the performance of the recommendation task.
5.4. Experimental Research Design
With this research, we propose an approach to automate the process of finding fix commits for vulnerabilities in open-source software. As the vulnerability information that can be found on vulnerability knowledge advisories as the NVD contain is not machine readable and needs to be extracted and processed before it can be used for such an automation task, the research was divided in three steps: extract, filter, and rank. In the extract phase, the focus was on extracting valuable information that should be incorporated in the advisory record. In the filtering phase this advisory record was used to come to a selection of candidate commits. In the ranking phase, these candidate commits were ranked based on the probability of being a fix commit for the provided advisory record. To answer the main research question, we created three sub-questions each addressing one of the pillars of this research to test our approach:
How can automation be used to reduce the effort needed in
finding fix commits
for known vulnerabilities in open-source software?
Stemming from this general research question, three more concrete research questions emerge, namely:
-
(1)
What vulnerability information should be extracted from resources as the NVD and used in the advisory record of a vulnerability?
-
(2)
How can the large number of commits in repositories be reduced to a subset of candidate commits through filtering out irrelevant commits?
-
(3)
How to use ML to rank the candidate commits with the fix commits as high as possible?
To answer these questions, we examine the coefficients of the logistic regression model (i.e., the one providing the best predictive performance), which can be found in Table 3. The higher the absolute value of a coefficient, the more this feature is important for predicting. Furthermore, a positive value means that a feature positively contributes to the model, while a negative value implies a negative contribution. In other words, if a feature is positive/negative, a high positive/negative instance value leads to predict a certain commit as a fix.
| Feature | Coefficient |
|---|---|
| Time distance before | 8.189 |
| Time distance after | 8.095 |
| Vulnerability ID in message | 7.363 |
| Referred to by advisories | 5.054 |
| Git diff similarity score | 4.412 |
| Message similarity score | 3.244 |
| Changed files similarity score | 2.831 |
| Referred to by NVD | 2.559 |
| Reachability score | 2.462 |
| Other vulnerability ID in message | -1.994 |
| Message similarity score code tokens | -1.165 |
| Message similarity references content | 1.035 |
| Vulnerability timestamp | 0.969 |
| Number of changed files | 0.526 |
| Path similarity score | -0.483 |
| Message contains Jira reference | 0.283 |
| Git diff similarity score code tokens | -0.274 |
| Number of hunks | -0.111 |
| Git diff similarity references content | -0.110 |
| Average hunk size | -0.100 |
| Changed files similarity references content | -0.097 |
| Changed files similarity score code tokens | 0.090 |
| Message contains Git issue reference | -0.047 |
RQ1: The advisory records contain vulnerability information that was extracted from resources as the NVD and translated into features. The vulnerability release date was used to select a subset of candidate commits and to calculate the features time distance before and time distance after. These two features have the highest positive coefficient and are essential in the ranking procedure. The closer the commit is to the vulnerability publication date, the more likely it is to be a fix commit. Please consider that if the timestamp differs more than two years from the actual date the vulnerability has been published, the fix commit is not even considered a candidate.
The vulnerability description is used for six of the nine lexical similarity features, the path similarity component, and the reachability score component. This reachability score is calculated through extracting the affected versions and calculating the reachability for the commits, and the path similarity score is computed after extracting the paths that are mentioned in the description and calculating the overlap with the paths that are changed by the commit. All of these features have a relatively high coefficient value, except for the path similarity score, whereby the path similarity score does not appear to be a good predictor. The references that are in the advisory record (to which the NVD refers) are used for three lexical similarity features, and for the two ’referred to by’ features. The two referred to features are of high predictive value (as the coefficients are high), so the method of extracting all URLs that are on these sites was a method with a positive effect on the prediction capabilities of the model. Hereby, this has proven to be a relevant addition to the advisory records. The lexical similarity features however have a low or even slightly negative coefficient.
RQ2: As the total number of candidate commits would equal 25,019,400 without filtering, the filtering method used in our implementation reduced this large number to only 11.00% while maintaining a selection recall of 93.59%. After the selection was reduced to 11.00% of the total number of commits, another 15.34 could be discarded through removing commits that do not change a relevant extension. From these 422,312 candidate commits, no commit was known as a fix commit, whereby this was a very effective filtering step. The two steps combined reduced the total number of commits to only 9.32%. Therefore, this filtering procedure was an effective application of our approach, and is discussed more in depth in Section 6.
RQ3: The method of creating feature vectors composed of several features that contain vulnerability specific scores has proven to be very effective, as our implementation ranked a fix in the top-10 for 84.03% of the vulnerabilities.
6. Discussion
6.1. Dataset
Where other research focused on predicting whether a commit is a fix commit or not in a balanced humanly curated dataset, our research was looking for fix commits in real repositories. Where Sabetta et al. (Sabetta and Bezzi, 2018) worked with 456 positive (fixes) and 2,259 negative samples and Sawadogo et al. (Sawadogo et al., 2020) with 2,879 positive and 6,368 negative samples, our research was conducted on a dataset containing 2,391 positive samples and 25,017,005 negative samples. Moreover, their datasets are divided into fix commits for sure and commits that are for sure not fix commit. Our dataset does not have this clear distinction for two reasons. First, there can be more unknown fix commits. When examining the results of FixFinder, it was found that for some vulnerabilities for which the fix commits were not the first ones, other unknown fix commits were at the top, whereby the precision score was falsely reduced. Second, there might be over a hundred-thousand fix commits among this large number of commits, fixing other vulnerabilities than the ones that are queried. Finally, we did not conduct our study on the dataset provided by Li and Paxson (Li and Paxson, 2017) for a two-fold reason. On the one hand, its quality was not manually validated. On the other hand, although the authors searched for fixes of 80,741 CVEs, they could find only 3.094 commits. Therefore, we deem the commits in that dataset not representative of the overall population of fix-commits.
Where the other research was centered around creating statistics that tell something about the probability of a commit being a fix commit, this method does not work for our use case as we are looking for specific fixes for specific vulnerabilities. When looking at the coefficients for the commit statistics features (Table 3), it can be seen that the importance assigned to these features is very small. This can be explained by the fact that there are fix commits in the data with a negative label, as they are not the fixes that were looked for. Moreover, as some vulnerabilities belong to the same repository, the same commit may be a positive sample for one vulnerability, and a negative sample for another. While the total number of candidate commits equals 25,019,400, these candidate commits consist of 906,419 commits. Therefore, using a database was not only beneficial during (iterative) development but also means that there needed to be 67% fewer commit extraction operations. Please consider that although we did not explicitly consider lines of code, these features are in a way correlated with this measure (i.e., number of hunks, average hunk size, and number of changed files).
It is important to observe that there is no one-to-one correspondence between vulnerabilities and commits: a single commit can fix multiple vulnerabilities, and a vulnerability might be addressed by a set commits that, together, represent the fix. Also, the dataset used for our experiments has been manually curated and it may be biased by the purposes for which it was created (that is, to feed the software composition analysis tool Eclipse Steady. As a result, for a given vulnerability there might exist more fixes than captured in the dataset (e.g., coming from other branches than the ones considered when gathering the data).
| Method | Top-1 Recall | Top-5 Recall | Top-10 Recall | Top-20 Recall | Avg. Pos. | |
| FixFinder | Adaboost | 47.85 (8.87) | 65.37 (6.78) | 74.44 (5.76) | 82.46 (4.53) | 35.59 (15.09) |
| k-Nearest Neighbors | 10.38 (1.47) | 12.86 (2.68) | 21.00 (2.74) | 37.16 (3.18) | 166.23 (37) | |
| Logistic Regression | 55.37 (3.92) | 70.78 (3.81) | 78.04 (4.08) | 84.97 (2.15) | 34.37 (16.17) | |
| Random Forest | 45.31 (3.04) | 62.78 (4.58) | 73.74 (4.08) | 82.37 (3.37) | 25.85 (11.54) | |
| Support Vector Classifier | 46.35 (17.17) | 59.60 (20.5) | 68.91 (19.04) | 77.09 (17.29) | 50.78 (52.39) | |
| Baseline | CVE ID in message | 6.49 (6.49) | ||||
| Referred to by the NVD | 9.95 (1.59) | |||||
| (Jimenez et al., 2018) | 16.44 (2.50) |
Please consider that only part of our dataset is publicly available. For the sake of replicability, we repeated our analysis on its publicly available part composed of 1,181 fix commits for 614 vulnerabilities. As in the complete experiment, reported in Section 5, we applied an 80/20 training/testing split, having 123 vulnerabilities in the test split of which on average 115.7 CVEs with at least one known fix commit in the selection. The results, shown in Table 4 show results similar to those previously analyzed and reported in Table 2. The slightly inferior performance can be justified by the smaller training set.
6.2. Filtering
We estimated that an interval of two years before and one-hundred days after the CVE publication date would yield a good interval. However, for repositories that have a large number of commits per year, the number of candidates can be very large. We calculated that selecting all commits within two years before and one hundred days after the CVE publication would result in a total of 4,972,699 commits for all vulnerabilities, and found that this selection would yield a selection recall of 95.35%, meaning that for 95.35% of the vulnerabilities at least one known fix commit would be in the selection.
Another interval to select candidates could be filter out commits that have been committed too far from the CVE publication date by means of number of commits, e.g., it would be unlikely that there have been ten-thousand commits after this commit before the vulnerability was published. We decided that this number should result in a selection with recall similar to the selection by means of the number of days, which could be achieved through selecting five-thousand commits before and one-hundred commits after the CVE publication date. This interval would yield 4,652,884 candidates with a selection recall of 96.07%101010Note that they are not 6.364.800 commits (i.e., 5100 commits for all 1248 vulnerabilities) because some repositories have fewer than 5000 commits before the CVE publication date.. As this was still a large number of commits, we explored a combination of the two: Selecting all commits within two years before and one hundred days after the release date with a maximum number of commits. We found that this combination of the two, selecting all commits within two years before and one hundred days after the release date with a maximum of respectively 5215 and 100 commits, would result in a recall 93.59% but would require 2,753,058 commits. As this selection had less than three percentage lower recall but forty percent less commits, we took this method as a filtering option.
This selection strategy is visualized in Figure 4. An overview of the strategies can be found in Table 5. These numbers have been calculated without accounting for duplicate commits when vulnerabilities belong to the same repository and the commits only need to be added to the database once.
| Method | Selection recall % | n candidate commits |
|---|---|---|
| Time based selection | 95.35 | 4,972,699 |
| Commit based selection | 96.07 | 4,652,884 |
| Combination | 93.59 | 2,753,058 |
As the scope of our research was to explore whether it is possible to find the fix commits in a fully automated manner, this range of two-years before and with a maximum number of 5215 commits, and one-hundred days after with a maximum of 100 commits was taken. When specifying the bounds to be for instance one-thousand commits before the release date and one-hundred after the release date, the selection recall would be 85.82%. When using our approach, one could for instance start with a smaller window and widen this window to see what the best interval is.
In our implementation, another filtering method was evaluated as well. As vulnerability descriptions often mention the software versions that are affected, we assumed that this information could be used to come to a selection of candidate commits. However, when working with a subset of 780 vulnerabilities that at least mentioned one version with digit.digit, recall could not get higher than 67%. We also found that a more sophisticated method yielded lower recall: this was the case when using words as ’through’ or ’including’ to determine whether a given version was the last vulnerable or the first fixed. When analysing manually the cases where this approach would fail, we found that there were too many inconsistencies in the tags in the OSS source repository. Even when considering the entire interval of the first tag of the previous minor version and the last tag of the next minor version (i.e., 4.3.2 is mapped onto 4.2.0 and 4.4.9), recall would not increase. While more and more effort was put in pre-processing tags to account for the lack of semantic versioning, the results on the test set would not improve. While we expected to have a recall of nearly 100% (as every version mentioned in the description was extracted and this was mapped onto a wide interval), only for 67 out of 100 vulnerabilities in an unseen test set a fix commit could be found in the interval. An examination of the 33 instances for which the mapping failed showed that 22 description mentioned the wrong version (which was neither the last vulnerable nor the first fixed), 7 versions mentioned did not match any tag in the repository, 4 fix commits did not have a tag (which is rather a problem of the dataset we used as training data).
This inconsistency in vulnerability descriptions was also found by Dong et al. (Dong et al., 2019), who found that only 58.62% of the CVE summaries have exactly the same vulnerable software versions as those of the of the standardized NVD entries. According to their case study, out of 185 versions that were stated to be vulnerable only 64 were actually vulnerable. They found that one of the causes was typos in the advisory, where, e.g., 0.22 was mentioned instead of the actual vulnerable version 0.2.2, or 0.8.6 instead of 0.6.8.
6.3. Ranking
When comparing our ranking score to the method of Jimenez et al. (Jimenez et al., 2018), who would be able to find a fix for 279 of the vulnerabilities in this dataset and thereby resulting in a precision score of just 22.36%, our implementation has a precision of 65.06%. When used in practice, FixFinder could perform even better: when examining the output of the tool, we found that some fix commits that were not known and thus labelled as a non-fix in the reference training data could actually be found by the tool, reducing the evaluation score.
Not all features that were engineered proved to be valuable. We expected a path being mentioned to be a very good indicator for a commit being a fix commit, however the coefficient of the LR model is negative. From 226 of the 1,248 vulnerabilities a path was extracted, which might be too few to be of great importance in general. It is also possible that there are too many commits that change the paths that are mentioned, therefore this component might not contain relevant information to distinguish among them.
Vulnerability descriptions from the NVD do not always provide enough information such as code constructs whilst the NVD provides a lot of references. Therefore, we assumed that the performance can be improved through extraction textual information from the advisory references. However, as the coefficients of the lexical similarity with the references content indicate, extracting the twenty most occurring words from all references might not be the best method for extracting relevant information from the sites to which the NVD refers. An explanation for this could be that often some of the references are from the same website, whereby the context words that are on this site might end up among the twenty most occurring words.
The message contains git issue reference and message contains Jira references features are two features that are not of prediction value in the current method, as it just reflects whether a commit message refers to an issue. From all candidate commits, 20.71% of the commits refers to a git issue and 53.80% refers to a Jira issue. Therefore, this component does not hold any information of the likeliness of being a fix for the queried vulnerability. Extracting the content from this issue can be valuable, as this can be used for computing the lexical similarity with the vulnerability descriptions. However, as this would mean that the content needs to be extracted for 482,789 GitHub Issue pages and 1,253,889 Jira tickets, we regarded this out of scope for this research.
When computing the lexical similarity between the vulnerability description and the commit message, we added a list of fix indicating words to emphasize the importance of these words in commit messages. Among other words, security and patch are in this list. However, more than thirty-thousand commits contain the word security and over sixty-thousand commits contain the word patch. Hereby, this might introduce noise instead of helping the prediction.
Moreover, the lexical similarity was computed through vectorizing the descriptions using TF-IDF and computing lexical similarity. One could explore the use of embeddings. (Han et al., 2017) tried to predict the severity score of a vulnerability based on only the vulnerability description and found that a shallow CNN trained on word embeddings performs significantly outperforms the classification methods using TF/IDF features or only word embeddings, when trained with as minimal one-thousand vulnerabilities. As the training set for our research consists of 933 vulnerabilities, we decided to stick with the TF-IDF method.
For 732 of the 1,248 vulnerabilities code tokens were extracted from the description. We assumed that this would be a strong indicator for being the fix commit, especially when comparing this with the git diff. That the coefficients for these lexical similarity features are this low can be due to various reasons. Firstly, it could be the case the TF-IDF combined with cosine similarity is not the right method for this comparison e.g., due to size of the git diff. Secondly, as the git diff can have a very large number of lines, only the first ten-thousand lines were considered, therefore the relevant lines might be ignored. Lastly, the output of the git diff command shows the actual lines of code that have been modified, and just a few context lines. These context lines are the lines before and after the changed lines, and this context size can be changed. In our implementation, the context size was set to one (just one line above and one below the changed lines are in the diff), but using larger values might be beneficial.
6.4. Scope of the Study and Threats to Validity
Our results were obtained on a subset of 1,166 vulnerabilities for which the selection yields at least one known fix commit. Though this selection has 93.59% recall, this is a limitation of the ranking results. Therefore, when taking into account that these results have been calculated after the selection with 93.59% recall, the ’real’ ranking precision is 60.89% and the ranking recall in the top ten is 78.64%.
As it is known that there can be a significant delay between the time at which the vulnerability is patched and the time at which a CVE is assigned, our selection method might not be the best. When examining some vulnerabilities for which the selection failed, we found that this is often due to a delay in the vulnerability disclosure. For example, CVE-2020-28724 was published on 18 November 2020 but its fix commit was made on 14 April 2016.
When applying FixFinder in practice, we observed that FixFinder could often find fix commits that would not have been identified easily without the tool, as there were no advisory pages reporting the commit. However, we did not compare the required effort for finding fix commits with using our tool to the human baseline, whereby we cannot quantify the decrease in required effort. This aspect will be the subject of future work.
Furthermore, we recognize that the filtering step could negatively impact the recall of the approach. Researchers and practitioners should find the correct balance between lower recall and higher scalability when filtering commits. In our experiment, we selected all commits within two years before and one hundred days after the release date. This selection strategy reduced the recall to 93.59% but analyzing only 11.00% of commits.
7. Related Work
The lack of information on vulnerabilities of OSS makes it hard to maintain a secure software development supply chain. To account for this lack of information, various researchers have spent their effort using machine learning to analyze source code repositories.
Sabetta and Bezzi (Sabetta and Bezzi, 2018) used an NLP-inspired method to represent commits and to distinguish fix commits (positives) from non-fixes (negatives). For each commit, bag-of-words was created by extracting the named entities from the changed source code, such as the names of classes, functions, parameters, variables. To come to a prediction, these documents were treated as documents written in natural language which were classified using standard document classification methods. The same problem was also tackled by (Zhou and Sharma, 2017) based on a larger dataset, using a set of models arranged in a stacked configuration; however, they did not consider the content of the commit diff (the code changes), but only the natural language content of the commit message.
Where Sabetta and Bezzi (Sabetta and Bezzi, 2018) used a SVM for the classification task at hand, Lozoya et al. (Cabrera Lozoya et al., 2021) investigated how to represent source code in a way that it can be used effectively for deep learning and showed that transfer learning could be effectively used to cope with the scarcity of labeled data.
Sawadogo et al. (Sawadogo et al., 2020) used co-training of two classifiers to automate the identification of source code changes that are security patches. One of the classifiers uses text features based on the meta data in the commit messages, and the other one uses code change details such as the number of lines that have been modified. As they acknowledge themselves as well, their research relies on scarce data, and they are assuming that the labeled dataset is perfect and sufficient. However, during sampling of the negative instances (commits that do not fix a vulnerability) they only sampled commits that do not contain fix indicating words like ”security” or ”vulnerability” in the commit logs, while one of their classifiers is predicting whether a commit is a fix or not based on these commit logs. In the dataset used in this research, only 0.59% of the commits for which the message contains ’security’ is a patch for one of the vulnerabilities in the dataset, which means the dataset used in their research does not reflect the actual world at all.
Previous research mainly focuses on security-relevant classification based on a small, manually curated, balanced dataset. Ponta et al. (Ponta et al., 2019) published a manually curated dataset containing fixes for 624 publicly disclosed vulnerabilities. They reviewed available information and searched for the corresponding fix commits in the code repository, resulting in 862 unique fixes. Please consider that in this paper, we used an extended version of the same dataset that includes data of additional vulnerabilities not covered in (Ponta et al., 2019).
The process of Ponta et al. (Ponta et al., 2019) is a very time consuming process that demonstrates the need for automated tools. Both Perl et al. (Perl et al., 2015) and Jimenez, Traon, and Papadakis (Jimenez et al., 2018) tried to find fixes for specific vulnerabilities directly in the OSS repositories in the same way: through a reference in the NVD or through the CVE ID in the commit message. vulnerabilities and they were able to find 1600 security patches (recall is 57%) via these two steps. Since this research was centered around four OSS projects, it remains unclear whether the recall will remain at this level when looking for security fixes in different repositories.
Although we are not aware of works that focus on devising a ML model to find the fix commit for a specific vulnerability, researchers have applied natural language processing on the vulnerability descriptions for other applications. Wareus and Hell (Wåreus and Hell, 2020) and Elbaz, Rilling, and Morin (Elbaz et al., 2020) both try to devise NLP and ML to automatically label vulnerability descriptions with the Common Platform Enumeration (CPE) labels. The former transforms the vulnerability descriptions in natural language to a machine-readable state using the term frequency-inverse document frequency (TF-IDF). At the same time, the latter applies word embeddings to achieve the same goal. The CPE is an attribute provided by the NVD and is an open framework for communicating the impact of the vulnerabilities and provides information on the affected software version. However, there is a time lag of 35 days on average before the vulnerability is disclosed and this attribute is assigned, leaving automated tools unable to rely on this piece of information.
Han et al. (Han et al., 2017) try to predict a vulnerability severity score for vulnerability descriptions. In their approach, they use word embeddings, and a one-layer shallow Convolutional Neural Network (CNN) is used to automatically capture discriminative word and sentence features.
Similarly, Palacio et al. (Palacio et al., 2019) proposed SecureReqNet, a novel approach to automatically identify security-related content in issue tracking systems using neural networks. First, high dimensional word embeddings are extracted from vulnerability descriptions listed in the CVE database and issue descriptions extracted from open source projects. Then, an ontology represented by these embeddings is used to train a convolutional neural network to predict whether a given issue is security-related.
Some related work shed light on the nature of security patches. Li and Paxson (Li and Paxson, 2017) conducted a large-scale empirical study concerning security patches. Leveraging the National Vulnerability Database (NVD), they analyze the patch development life cycle, the affected software repositories, and security fixes to compare security fixes and non-security bug fixes. Their results show that a third of all security issues were introduced more than three years before their fix. Nearly 5% of security fixes negatively impacted the associated software, and 7% failed to remedy the vulnerability they targeted. Compared to FixFinder, they do not use the CVE publication date but use the earliest reference date, showing that this yields a ’significantly improved disclosure estimation’. Given that the CVE publication is currently a requirement of our approach, we will verify the impact of this finding on FixFinder as future work.
Finally, not all vulnerability types are the same. Therefore, Wang et al. (Wang et al., 2020) conducted an empirical study on vulnerability types, using a large-scale dataset collected from the National Vulnerability Database (NVD). Based on analysis results, they developed a classification model to distinguish the type of security patches.
8. Conclusion
When comparing our method to the only similar method from Jimenez et al. (Jimenez et al., 2018) who would achieve a precision of 22.36% on the data used for this research, which could therefore be regarded as state of the art, our implementation of our method performed substantially better.
Through combining rather simple features that do not provide that much information in itself into a feature vector that can be learned by ML algorithms, we demonstrated that there lies more gain in focusing on feature engineering instead of squeezing out a few percentages through parameter tuning and deep learning algorithms.
The ranking results can easily be improved through adding more features or improving current features as i.e., the lexical similarity features through the usage of deep learning techniques and word embeddings. Furthermore, we presented a general method to search for fix commits in OSS repositories which is independent of the projects and of their programming language. FixFinder, a prototype implementation of our method of mining OSS repositories for fixes for vulnerabilities, represents a concrete first step towards an efficient process for mining vulnerability information in open-source code repositories. FixFinder is freely available as a component of project “KB” and is released under a liberal open-source license.
In the future, we plan to improve the filtering step by providing heuristics to automatically find the best compromise between recall and scalability.
Acknowledgements.
This work was partly funded by project AssureMOSS, funded by the European Commission under grant number 952647.References
- (1)
- Cabrera Lozoya et al. (2021) Rocío Cabrera Lozoya, Arnaud Baumann, Antonino Sabetta, and Michele Bezzi. 2021. Commit2Vec: Learning Distributed Representations of Code Changes. SN Computer Science 2, 3 (19 March 2021), 150. https://doi.org/10.1007/s42979-021-00566-z arXiv: 1911.07605.
- Dong et al. (2019) Ying Dong, Wenbo Guo, Yueqi Chen, Xinyu Xing, Yuqing Zhang, and Gang Wang. 2019. Towards the Detection of Inconsistencies in Public Security Vulnerability Reports. USENIX, 869–885. https://www.usenix.org/conference/usenixsecurity19/presentation/dong
- Elbaz et al. (2020) Clement Elbaz, Louis Rilling, and Christine Morin. 2020. Automated Keyword Extraction from ”One-day” Vulnerabilities at Disclosure. In NOMS 2020 - 2020 IEEE/IFIP Network Operations and Management Symposium. IEEE, Budapest, Hungary, 1–9. https://doi.org/10.1109/NOMS47738.2020.9110460
- ENISA (2020) ENISA. 2020. Vulnerabilities and Exploits. https://www.enisa.europa.eu/topics/csirts-in-europe/glossary/vulnerabilities-and-exploits
- GitHub (2020) GitHub. 2020. The State of the Octoverse. https://octoverse.github.com/
- Han et al. (2017) Z. Han, X. Li, Z. Xing, H. Liu, and Z. Feng. 2017. Learning to Predict Severity of Software Vulnerability Using Only Vulnerability Description. In 2017 IEEE International Conference on Software Maintenance and Evolution (ICSME). IEEE, 125–136. https://doi.org/10.1109/ICSME.2017.52
- Honnibal et al. (2020) Matthew Honnibal, Ines Montani, Sofie Van Landeghem, and Adriane Boyd. 2020. spaCy: Industrial-strength Natural Language Processing in Python. https://doi.org/10.5281/zenodo.1212303
- Jimenez et al. (2018) Matthieu Jimenez, Yves Le Traon, and Mike Papadakis. 2018. Enabling the Continuous Analysis of Security Vulnerabilities with VulData7. Proceedings of the 18th IEEE International Working Conference on Source Code Analysis and Manipulation {SCAM} 2018 (Sept. 2018), 6.
- Li and Paxson (2017) Frank Li and Vern Paxson. 2017. A large-scale empirical study of security patches. In Proceedings of the 2017 ACM SIGSAC Conference on Computer and Communications Security. 2201–2215.
- Palacio et al. (2019) David N Palacio, Daniel McCrystal, Kevin Moran, Carlos Bernal-Cárdenas, Denys Poshyvanyk, and Chris Shenefiel. 2019. Learning to identify security-related issues using convolutional neural networks. In 2019 IEEE International conference on software maintenance and evolution (ICSME). IEEE, 140–144.
- Pedregosa et al. (2011) F. Pedregosa, G. Varoquaux, A. Gramfort, V. Michel, B. Thirion, O. Grisel, M. Blondel, P. Prettenhofer, R. Weiss, V. Dubourg, J. Vanderplas, A. Passos, D. Cournapeau, M. Brucher, M. Perrot, and E. Duchesnay. 2011. Scikit-learn: Machine Learning in Python. Journal of Machine Learning Research 12 (2011), 2825–2830.
- Perl et al. (2015) Henning Perl, Sergej Dechand, Matthew Smith, Daniel Arp, Fabian Yamaguchi, Konrad Rieck, Sascha Fahl, and Yasemin Acar. 2015. VCCFinder: Finding Potential Vulnerabilities in Open-Source Projects to Assist Code Audits. In Proceedings of the 22nd ACM SIGSAC Conference on Computer and Communications Security (CCS ’15). Association for Computing Machinery, Denver, Colorado, USA, 426–437. https://doi.org/10.1145/2810103.2813604
- Ponta et al. (2020) Serena Elisa Ponta, Henrik Plate, and Antonino Sabetta. 2020. Detection, assessment and mitigation of vulnerabilities in open source dependencies. Empirical Software Engineering 25, 5 (01 Sep 2020), 3175–3215. https://doi.org/10.1007/s10664-020-09830-x
- Ponta et al. (2019) Serena Elisa Ponta, Henrik Plate, Antonino Sabetta, Michele Bezzi, and Cédric Dangremont. 2019. A Manually-Curated Dataset of Fixes to Vulnerabilities of Open-Source Software. In 2019 IEEE/ACM 16th International Conference on Mining Software Repositories (MSR). 383–387. https://doi.org/10.1109/MSR.2019.00064 ISSN: 2574-3848.
- Sabetta and Bezzi (2018) Antonino Sabetta and Michele Bezzi. 2018. A Practical Approach to the Automatic Classification of Security-Relevant Commits. In 2018 IEEE International Conference on Software Maintenance and Evolution (ICSME). IEEE, 579–582. https://doi.org/10.1109/ICSME.2018.00058 ISSN: 1063-6773.
- SAP (2020) SAP. 2020. SAP/project-kb. https://github.com/SAP/project-kb original-date: 2019-02-13T16:19:46Z.
- Sawadogo et al. (2020) Arthur D. Sawadogo, Tegawendé F. Bissyandé, Naouel Moha, Kevin Allix, Jacques Klein, Li Li, and Yves Le Traon. 2020. Learning to Catch Security Patches. arXiv:2001.09148 [cs] (Jan. 2020). http://arxiv.org/abs/2001.09148 arXiv: 2001.09148.
- Schryen (2011) Guido Schryen. 2011. Is open source security a myth? Commun. ACM 54, 5 (May 2011), 130–140. https://doi.org/10.1145/1941487.1941516
- Tal (2019) Liran Tal. 2019. The state of open source security report.
- Wang et al. (2020) Xinda Wang, Shu Wang, Kun Sun, Archer Batcheller, and Sushil Jajodia. 2020. A Machine Learning Approach to Classify Security Patches into Vulnerability Types. In 2020 IEEE Conference on Communications and Network Security (CNS). IEEE, 1–9.
- Wåreus and Hell (2020) Emil Wåreus and Martin Hell. 2020. Automated CPE Labeling of CVE Summaries with Machine Learning. In Detection of Intrusions and Malware, and Vulnerability Assessment (Lecture Notes in Computer Science), Clémentine Maurice, Leyla Bilge, Gianluca Stringhini, and Nuno Neves (Eds.). Springer International Publishing, Cham, 3–22. https://doi.org/10.1007/978-3-030-52683-2_1
- Zaffar et al. (2011) Muhammad Adeel Zaffar, Ram L. Kumar, and Kexin Zhao. 2011. Diffusion dynamics of open source software: An agent-based computational economics (ACE) approach. Decis. Support Syst. 51, 3 (2011), 597–608. http://dblp.uni-trier.de/db/journals/dss/dss51.html#ZaffarKZ11
- Zhou and Sharma (2017) Yaqin Zhou and Asankhaya Sharma. 2017. Automated Identification of Security Issues from Commit Messages and Bug Reports. In Proceedings of the 2017 11th Joint Meeting on Foundations of Software Engineering (Paderborn, Germany) (ESEC/FSE 2017). Association for Computing Machinery, New York, NY, USA, 914–919. https://doi.org/10.1145/3106237.3117771
Appendix A Tags to tree visualization
Tags in the repository:
[’3.0-final’, ’3.0.1’, ’3.0.2’, ’3.0B1’, ’3.0M1’, ’3.0M2’, ’3.0M3’, ’3.0M4’, ’3.0M5’, ’3.0M6’, ’3.0RC1’, ’3.0RC2’, ’3.0RC3’, ’3.1.2’, ’3.1.3’, ’3.1B1’, ’3.1B2’, ’3.1M1’, ’3.1M2’, ’3.1M3’, ’4.0’, ’4.0.1’, ’4.0.2’, ’4.0.B1’, ’4.0.B2’, ’4.0.M2’, ’4.0.M3’, ’4.0.M4’, ’4.0.M5’, ’4.0.RC1’, ’4.1’, ’4.1.B1’, ’4.1.B2’, ’4.1.M1’, ’4.1.M2’, ’4.1.RC1’, ’4.1.RC2’, ’4.2.M1’, ’4.2.M2’, ’cayenne-parent-3.1’, ’cayenne-parent-3.1.1’, ’cayenne-parent-3.1B2’, ’cayenne-parent-3.1RC1’, ’cayenne-parent-3.2M1’]
Tags transformed to a tree where all tags with the same major and minor version
are in the same branch, and are then sorted on their timestamp: