A singlet and triplet excited-state dynamics study of the keto and enol tautomers of cytosine
Abstract
The photoinduced excited-state dynamics of the keto and enol forms of cytosine is investigated using ab initio surface hopping in order to understand the outcome of molecular beam femtosecond pump-probe photoionization spectroscopy experiments. Both singlet and triplet states are included in the dynamics. The results show that triplet states play a significant role in the relaxation of the keto tautomer, while they are less important in the enol tautomer. In both forms, the state minimum is found too low in energy to be detected in standard photoionization spectroscopy experiments and therefore experimental decay times should arise from a simultaneous relaxation to the ground state and additional intersystem crossing followed by internal conversion to the state. In agreement with available experimental lifetimes, we observe three decay constants of 7 fs, 270 fs and 1900 fs – the first two coming from the keto tautomer and the longer one from the enol tautomer. Deactivation of the enol form is due to internal conversion to the ground state via two conical intersections of ethylenic type.
I Introduction
Since the advent of ultrafast time-resolved spectroscopy and modern ab initio methods, the electronic structure and excited-state femtosecond nuclear dynamics of the five nucleobases, which are the central building blocks of DNA and RNA, have been studied intensively.1 Understanding these fundamental processes can help unraveling the mechanisms giving DNA and RNA a remarkable resistance against damage from ultraviolet (UV) irradiation. It is generally accepted that all nucleobases undergo an ultrafast (i.e. on a picosecond or shorter timescale) relaxation to the electronic ground state upon excitation by UV light, thereby spreading excess energy among the different degrees of freedom before any harmful reaction can occur.
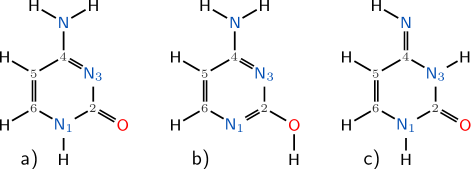
Among the nucleobases, the excited-state dynamics of cytosine has attracted considerable attention. Cytosine exists primarily in three tautomers, the keto, enol and imino-forms, see Fig. 1. Since the keto tautomer is the biologically relevant one and the only one found in aqueous solution and solid state, most spectroscopic efforts focus on identifying the relaxation mechanism of this particular tautomer. However, since the enol form is dominant in gas phase and the imino form can also be present depending on the experimental conditions, the interpretation of studies dealing with the excited-state dynamics of keto cytosine can get severely complicated.
Several experimental and theoretical studies have been aimed at identifying the tautomer ratios in gas phase. Brown et al.2 reported a tautomer ratio of 0.44:0.44:0.12 (keto:enol:imino), determined by microwave spectroscopy. Szczesniak et al.3 detected a ratio of 0.32:0.65:0.03 in matrix-isolation infrared (IR) studies. More recently, Bazsó et al.4 measured the tautomer ratio from matrix-isolation IR and UV spectra, obtaining 0.22:0.70:0.08.
The excited-state lifetime of cytosine in gas phase has been measured in ultrafast molecular beam experiments with quite different outcomes depending on the particular experimental setup. Kang et al.5 (pump: 267 nm, probe: multiphoton 800 nm) observed a single exponentially decaying signal with a time constant of 3.2 ps. Canuel et al.6 (pump: 267 nm, probe: 2400 nm) identified two independent time constants of 160 fs and 1.86 ps. Ullrich et al.7 (pump: 250 nm, probe: 200 nm) even resolved three components, one extremely fast at 50 fs, one at 820 fs and a third one at 3.2 ps. More recently, Kosma et al.8 measured the excited-state lifetime using pump wavelengths between 260 and 290 nm (probe: 3800 nm) and showed that the excited-state lifetime strongly varies with the excitation energy. For short wavelengths (below 280 nm), their results are in line with earlier findings: At 260 nm two transients are identified with an ultrafast decay of 120 fs followed by a slower relaxation path at 3.8 ps; with excitation at 267 nm and 270 nm, similar time scales are found but a third small longer transient is also observed. For wavelengths of 280 and 290 nm, the first transient is below 100 fs, the second is around 1 ps, and the third is very long-lived (55 and above 150 ps, respectively). Lately, Ho et al.9 investigated the different excited-state lifetimes of the three main tautomers using derivate molecules. In 1-methylcytosine (not possessing the enol form) they resolve time constants from 0.4 ps at 260 nm to 3.2 ps at 310 nm, while in 5-fluorocytosine (primarily in enol form) they found one wavelength-independent component of 300 fs along with another timescale of 9.5 to 100 ps, again depending on the pump wavelength. For cytosine itself, at 266 nm they resolved two time constants, one at 500 fs and another at 4.5 ps, while for longer wavelengths (290-300 nm) only one transient at ca 1 ps was found and the long-lived component vanished. In all systems they also detected an initial spike, which could hide a very fast dynamical process but could not be resolved. Kotur et al.10; 11 measured excited state lifetimes of cytosine paying attention to separate different fragment ions and for the parent ion found three time constants at 50, 240 and 2360 fs, using a 262 nm excitation wavelength.
The most recent vertical excitation energies of cytosine tautomers have been reported by Tomić et al.12 (using DFT/MRCI, density functional theory/multireference configuration interaction), Blancafort 13 (CASSCF and CASPT2, complete active space self-consistent field and its second-order perturbation theory variant) and Szalay et al.14; 4 (EOM-CCSD and CC3, equation-of-motion coupled-cluster including singles and doubles and the related coupled-cluster approach including triples) in gas phase, and in solution by Domingo and coworkers 15 (CASPT2). Intensive theoretical work has been devoted to identify conical intersections (CoIns) in the singlet manifold of keto cytosine. The recent studies of Kistler et al. located a number of two-state CoIns16 and three different three-state CoIns17 using MRCI methods. Additionally, Barbatti et al.18 optimized four CoIns and a number of state minima, also at MRCI level. The earlier paper of Tomić et al.12 reports excited-state minima and CoIns at the DFT/MRCI level of theory. Based on quantum chemical results, several deactivation mechanisms for the keto cytosine have been proposed by different authors.19; 20; 21; 22; 23; 24; 25; 26
Only a limited number of dynamical simulations of the excited-state dynamics of the keto tautomer has been conducted. Hudock and Martínez27 used ab initio multiple spawning based on CASSCF(2,2), finding multiple subpisecond pathways involving only two electronic states. Lan and coworkers 28 used surface-hopping with the semiempirical OM2 method considering the two lowest excited singlet states. González-Vázquez and González 29 and independently Barbatti et al.18 performed surface-hopping in an ab initio framework with four singlet states. The first study including triplet states in keto-cytosine was reported by Richter et al.30 who showed that intersystem crossing (ISC) is taking place on an ultrafast time scale. To the best of our knowledge, no dynamics simulations concerning the enol tautomer have been performed so far.
The present work is an attempt to provide new insights into the relaxation process of cytosine by studying the excited-state dynamics of both the keto and the enol tautomers. Regrettably, the imino form could not be included, since preliminary studies suggested that the here employed level of theory for the keto and enol is not able to properly describe the excited states of the imino tautomer. Additionally, the relative abundance of this tautomer is below 10%, justifying the focus on the keto and enol forms. Both the enol and imino tautomers show two rotamers, depending on the orientation of the \ceOH- and the \ceNH-groups. For both tautomers, the lowest energy structure in gas phase4 is shown in Fig. 1. Accordingly, the calculations on the enol tautomer only included this rotamer. Since triplet state formation has been proposed by several studies in keto cytosine,31; 22; 24 the present study also includes the interaction between singlet and triplet states, using a methodology similar to the one employed in Ref. 30. As shown in Section II, the surface-hopping method presented here is more robust in the presence of weak spin-orbit couplings. Since its application leads to small differences with respect to the results discussed in Ref. 30, the dynamics of the keto form is revisited in this paper and compared to that of the enol form.
II Methodology
II.1 Surface hopping including arbitrary couplings
Surface-hopping dynamics as proposed by Tully 32 is usually carried out in a basis of the eigenfunctions of the molecular Coulomb Hamiltonian (MCH). Within the Born-Oppenheimer approximation, the corresponding electronic Hamiltonian contains the electronic kinetic energy and the potential energy arising from the Coulomb interaction of the electrons and nuclei with each other, i.e.,
| (1) |
Standard quantum chemistry programs usually obtain wavefunctions as eigenfunctions of this operator, and a large number of properties can be calculated for these wavefunctions. However, the description of phenomena like light-matter interaction or ISC necessitate the use of additional terms in the Hamiltonian, e.g. dipole couplings or spin-orbit couplings:
| (2) |
Because of the classical approximations inherent to surface-hopping, integration of the nuclear motion should be performed on the potential energy surfaces (PESs) of the eigenfunctions of the total electronic Hamiltonian . However, as these eigenfunctions and their properties are usually not obtainable with quantum chemistry software, in the recently developed Sharc (Surface Hopping including ARbitrary Couplings) methodology 33 we use the eigenfunctions of in the subspace of the few lowest eigenstates of the MCH Hamiltonian. Henceforth, the basis of the eigenfunctions of will be referred to as the diagonal basis, since this Hamiltonian is diagonal in this basis.
In order to obtain surface-hopping probabilities, the electronic wavefunction is expanded as a linear combination of the diagonal basis functions:
| (3) |
Inserting this wavefunction into the time-dependent Schrödinger equation leads to the differential equation governing the evolution of the coefficients:
| (4) |
where the Hamiltonian matrix has elements and the elements of matrix are the non-adiabatic couplings , which in this basis include the transformed coupling .
Since the propagation of the coefficients is not subject to the classical approximation, the solution of equation (4) is independent of the representation of and and thus equation (4) can instead be written as:
| (5) |
where is given by .
In the current version of Sharc, equation (5) is integrated numerically for a small timestep by:
| (6) |
where is the total propagator from time to time . In this way, the transformation of small couplings into highly peaked non-adiabatic couplings is avoided, allowing for a much more stable propagation, compared to Ref. 33. Note that the surface-hopping itself is still performed in the diagonal basis, which is the optimal representation for this step in the algorithm; see also Ref. 34. The corresponding surface-hopping probabilities from the current classical state to another state are then calculated according to:
| (7) |
This is a modification of the equation derived by Granucci et al.35 used in the Local Diabatization algorithm36 available in Newton-X.37 We also include decoherence as proposed in Ref. 38 to the diagonal states.
II.2 Ab initio level of theory and dynamics
For both tautomers, the ground state equilibrium geometry was optimized using MP2/6-311G**39 and harmonic frequencies were obtained at the same level of theory. From the obtained frequencies, a quantum harmonic oscillator Wigner distribution40; 41 was calculated and 2000 (1000 for the enol form) geometries were sampled from the distribution. An absorption spectra is simulated employing the SA10S-CASSCF(12,9)/6-31G* level of theory 29, where SA10S indicates that the calculation is averaged over 10 singlet states for each of the generated geometries.
The most typical excitation wavelength in the available experiments is 267 nm (4.64 eV), corresponding to the maximum of the first absorption band of the cytosine UV spectrum. Therefore, the center of our excitation energy range was chosen to be 5.07 eV, which is the maximum of the simulated composite spectrum given below. The band width was fixed at 0.07 eV, which is the typical energy band width of a 50 fs laser pulse.
From the generated sets of geometries, initial conditions for the dynamics were selected, based on the oscillator strengths and the excitation energy and according to Refs. 42; 37. For the keto tautomer, 68 initial conditions were selected, 30 starting in the , 36 in the and 2 in ; these are the most important states in the chosen energy range. For the enol tautomer, 65 initial conditions were considered (57 in , 8 in ). Subsequently, all 133 initial conditions were propagated with Sharc. Energies, gradients, non-adiabatic couplings and spin-orbit couplings were calculated on-the-fly using the CASSCF(12,9)/6-31G* level of theory. In the case of the enol tautomer, 3 singlet and 4 triplet states were averaged in the on-the-fly CASSCF procedure (denoted as SA3S+4T-CASSCF(12,9)/6-31G*), while for the keto tautomer 4 singlet and 3 triplet states were included (denoted as SA4S+3T-CASSCF(12,9)/6-31G*). The dynamics were simulated for 1000 fs (timestep of 0.5 fs, integration timestep 0.02 fs) or until relaxation to or occurred. The simulations take each of the triplet state components separately into account (i.e. the simulations consider 13 states for the keto form and 15 states for the enol form).
Using the geometries where surface hops between two states occurred, optimizations of CoIns or singlet-triplet crossings in the keto and enol forms of cytosine were carried out using the SA4S+3T- and SA3S+4T-CASSCF(12,9)/6-31G* level of theory, respectively. All the quantum chemical calculations have been carried out with the quantum chemistry package Molpro 2012.1.43; 44; 45; 46 Orbital visualization was done with the Molekel 5.4 software.47
III Results and Discussion
III.1 Spectra
| State | Character | State | Character | |||
| — keto — | ||||||
| 5.13 | 0.0805 | 3.64 | ||||
| 5.26 | 0.0018 | 4.88 | ||||
| 5.59 | 0.0035 | 5.07 | ||||
| 6.30 | 0.0004 | 5.40 | ||||
| — enol — | ||||||
| 5.19 | 0.0444 | 4.28 | ||||
| 5.66 | 0.0146 | 4.95 | ||||
| 6.57 | 0.0004 | 5.30 | ||||
| 5.43 | ||||||
| 6.26 | ||||||
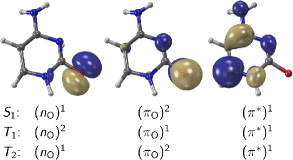
In Table 1, spin-free excitation energies and oscillator strengths of both tautomers calculated at the SA10S+10T-CASSCF(12,9)/6-31G* level of theory are given. The excitation energies obtained are slightly higher than those reported experimentally and than those calculated at a more correlated level of theory. In any case, the state ordering of the lowest singlet states agrees with that predicted both by DFT/MRCI12 as well as by MRCI.18 The brightest state in both tautomers is the , corresponding to a excitation. The remaining calculated singlet states are dark at the Franck-Condon geometry and correlate with transitions. Note that at the Franck-Condon point the and orbitals are mixed and thus we denote the transition simply as . At other geometries (as discussed below) these orbitals do not mix anymore and the particular orbital ( or ) will be specified. Since the in the keto and the in the enol form are well separated from the lower states, singlet states and , respectively, were not considered for the dynamics simulations. For completeness, the lowest triplet states at the equilibrium geometry are also reported in Table 1. In both tautomers, the two lowest triplet states, and , correspond to while the is the state. Again based on the energetic separation, states above in the keto and in the enol tautomer were not included in the dynamics simulations.
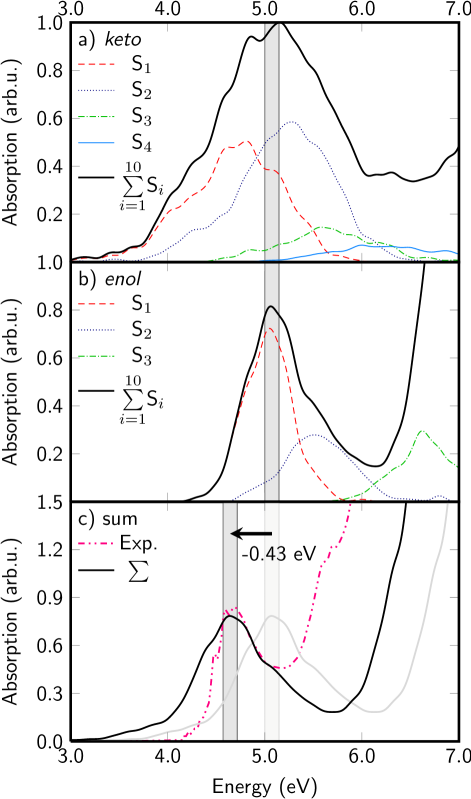
The SA10S-CASSCF(12,9)/6-31G* spectra based on 2000 (1000) geometries of the keto (enol) tautomer are displayed in Fig. 2a (b). The first band of the spectrum of the keto tautomer (Fig. 2a) results mainly from four singlet excited states while three are the most important in the first band of the enol spectrum (Fig. 2b). The keto spectrum shows a much broader absorption band than the enol one. This might be a hint at the larger excited-state gradients in the Franck-Condon region of keto-cytosine. Noteworthy is that the contributions from both and to the keto spectrum are comparably large, indicating that the and states are close in the Franck-Condon region and the state ordering may be easily inverted for different geometries within this region. In the enol spectrum, the contributes strongest and it can be inferred that this lowest excited state corresponds to the bright state at most of the geometries.
Figure 2c shows the experimental spectrum along with a linear combination of the simulated spectra, where the ratio for the contribution of the respective tautomer is 0.24:0.76 (keto:enol). This ratio corresponds to the one in Ref. 4 when ignoring the imino tautomer and assuming that both enol rotamers yield the same spectrum. Since the CASSCF excitation energies are overestimated, the simulated spectrum was shifted by 0.43 eV to obtain the maximum overlap with the experiment. The keto tautomer shows a stronger absorption in the considered energy range (compare Figs. 2a and b), as a direct consequence that the state of the keto is brighter than the one of the enol (see Table 1). Still, the contributions of the keto and enol forms to the total spectrum are comparable due to the higher abundance of the enol form. Moreover, since the oscillator strength of the state of the enol tautomer (see Table 1) is too small at the CASSCF level of theory (compare to e.g. 0.1389 from DFT/MRCI12), the total spectrum should be more dominated by the enol form. (In passing, we note that too small oscillator strengths have no impact on the dynamics simulations.) The composite spectrum (Figure 2c) was generated mainly to assess the energy shift between CASSCF and experiment so that a proper excitation range for the initial condition generation could be chosen. The agreement between the experimental spectrum and the shifted calculated one is otherwise acceptable, considering the level of theory employed.
III.2 Ionization processes
In the following, we discuss how excited-state relaxation can be detected experimentally and how experimental results can be related to our simulations.
In gas-phase ultrafast time-resolved experiments, the excited-state populations are usually detected by means of photoionization. Thus, in order to detect a signal, the energy difference between the ionic state and the populated neutral state (the ionization potential) needs to be smaller than the energy provided by the probe laser. Most of the time-resolved studies 5; 8; 9 on cytosine use a three-photon 800 nm probe, which corresponds to ca. 4.6 eV. Some experiments use two-photon 400 nm6 or 200 nm7 probe pulses instead, which is equivalent to 6.2 eV. In all cases, at the Franck-Condon region all but the ground state is supposed to be detected, so that it is assumed that the time constants measured experimentally correspond exclusively to the relaxation of the excited population to the ground state. The latter assumption includes that all triplet states are also ionized by the probe pulses or that triplet state population is negligible. As we show below, this assumption might not necessarily always be true.
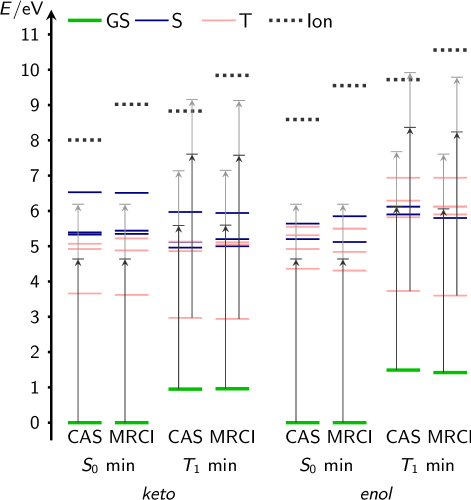
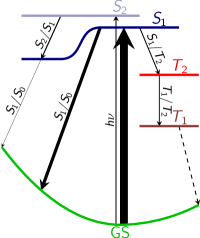
Figure 3 shows the energies of the singlet and triplet states considered in the dynamics as well as the lowest (-1)-electron (ionic) state at the and minima for the keto and enol tautomers, calculated at the CASSCF(12,9)/6-31G* (keto: state-averaging over 4 singlets, 1 doublet and 3 triplets, denoted as SA4S+1D+3T; enol: SA3S+1D+4T) and the internally-contracted MRCI+Q48; 49; 50 level of theory (Q indicating Davidson correction). In the MRCI, all inner shells were kept frozen (8 orbitals) and only doubly external excitation were considered in order to keep the calculations at a reasonable computational cost. Arrows in black and grey indicate probe excitation energies of 4.6 eV (3800 nm) and 6.2 eV (2400 nm), respectively. As it can be seen, the CASSCF and MRCI+Q energies for the neutral excited states are very similar, which justifies performing CASSCF dynamics. On the contrary, the energy of the corresponding ionic state at the MRCI+Q level of theory is strongly destabilized compared with the CASSCF energy. The MRCI+Q values are in good agreement with photoelectron measurements51; 52 and previous calculations.53 According to the more reliable MRCI+Q energies, at the minima of both tautomers, the ground state indeed cannot be ionized by any of the mentioned probe pulses. These geometries correspond to the starting point of the relaxation dynamics and it is thus unimportant that the energy of the probe laser suffices to ionize the since it is not (yet) populated. However, all initially populated excited singlet states can be ionized at the minimum geometry.
As shown by Richter et al.30 and in the present study (see below), the triplet states play a significant role in the relaxation dynamics of cytosine. It is therefore justified to look at the ionization potential at the endpoint of a triplet relaxation pathway: the minimum. At this geometry, the energy of the state is lowered while the ionic state is considerably destabilized. Accordingly, ionization from the minimum should be negligible with the energies of the mentioned experimental setups (see MRCI+Q values) and we expect the population that has flown from the excited singlets to the to be experimentally hardly distinguishable from the population having relaxed to the ground state. Thus, we propose that the transients observed experimentally arise from both the relaxation to the ground state and to the .
III.3 Excited state lifetimes
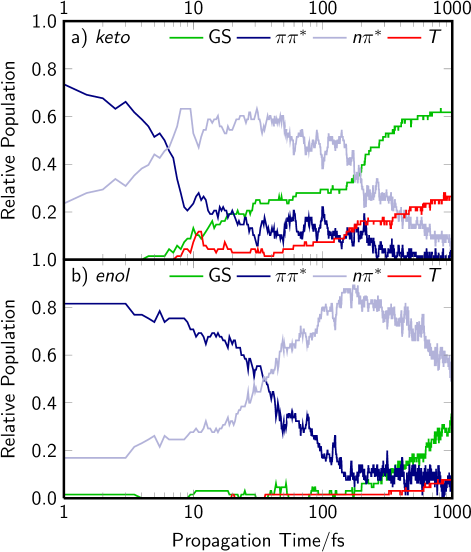
The time-dependent populations of the electronic states are given by the squares of the coefficients , where
| (8) |
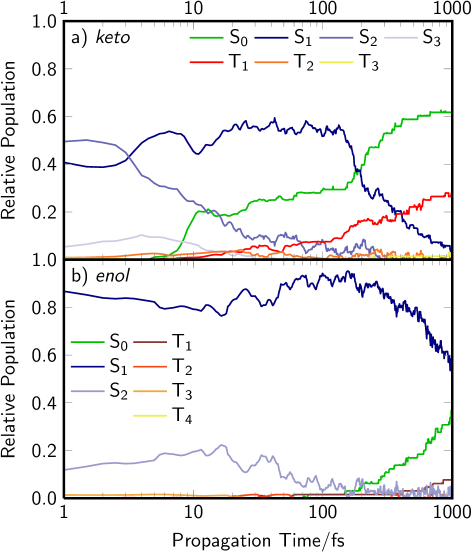
These values are presented in Figure 4a and 4b for the keto and the enol forms, respectively. As can be clearly seen, the excited-state dynamics of the two tautomers differ dramatically.
In the keto tautomer, we observe an ultrafast internal conversion (IC) from the to the and also to , in agreement with previous studies. 29; 18; 30 About 20% of all trajectories return to the ground state in about 10 fs. Within 500 fs, more than 60% return to the ground state. On the same timescale, the is populated as a result of the deactivation cascade by about 25% of all trajectories (see also subsection III.4 below). A small fraction of the population remains in the excited singlet states for more than 1 ps. In comparison to the other states, the and play a minor role in the deactivation mechanism.
The dynamics of enol cytosine is completely different (see Fig. 4b). In this case, the is populated by more than 80% in the beginning and by more than 90% after 100 fs. Compared to the keto form, relaxation to the ground state is much slower (the first trajectory relaxes after 150 fs and after 1 ps only 30% of all trajectories are relaxed). Also differently from the keto form, ISC is considerably less important (ca. 5% in the enol versus ca. 25% in the keto form).
Based on the discussion of subsection III.2, we now present fits of the population decay to the experimentally unobservable states: the and the . Based on the population of Fig. 4a, we anticipate a biexponential decay to the two mentioned states in the keto tautomer:
| (9) |
while the enol tautomer can be treated monoexponentially:
| (10) |
The time constants and fitting parameters according to equations (9) and (10) are collected in Table 2. Since after 1 ps in the keto tautomer a small fraction of the trajectories is still in the , we additionally performed a triexponential fit. In the latter, and remain almost unchanged with respect to the biexponential fit, while the third time constant (, not to be confused with in Eq. (10)) is quite large and also has a large uncertainty (22001700 fs). For completeness, also time constants for the and are given separately. For the in the enol tautomer, the simulation time of 1 ps was not sufficient to extract any meaningful time constant.
| State | (fs) | (fs) | (fs) | |||
|---|---|---|---|---|---|---|
| — keto — | ||||||
| 0.658 | 6 | 0.196 | 230 | – | – | |
| 0.322 | 4 | 0.110 | 350 | – | – | |
| 0.952 | 7 | 0.161 | 270 | – | – | |
| 1.000a | 7 | 0.152 | 260 | 0.774 | 2200 | |
| — enol — | ||||||
| – | – | – | – | – | 2400 | |
| – | – | – | – | – | 1900 | |
aValue of fixed to 1.0 in the fit.
As discussed above, we believe that most experimental time constants should relate to a combined + relaxation pathway and therefore focus on our + fits henceforth. Table 3 summarizes these lifetimes and also contains time constants reported in the literature, both experimentally and theoretically. As it can be seen, the time constants of the present work are in very good agreement with the experimental results, especially given the broad range of the latter. According to our simulations, we assign the faster lifetimes and to the keto tautomer and the slower to the enol form. Such a distinction between the tautomers is difficult in the experiments. Due to the employed pulse durations, none of the experimental studies is able to accurately resolve the shortest time constant , which we determine as 7 fs. However, values of 100 fs8 or 50 fs7; 10 are given in the literature. The second calculated time constant (270 fs) falls within the range of experimental values from 160 fs6 to 820 fs. 7 Similar time constants also have been reported in previous dynamics simulation studies.28; 27; 18 The observed mechanistic details differ considerably in these studies since the employed level of theory for the on-the-fly calculations is different (vide infra). Also the third time constant from the enol at 1.9 ps agrees with the experimental findings. Kotur et al.11; 10; 54 attributed a comparable time constant (2.3 ps) to the relaxation of the keto tautomer. Similar to what was done in Ref. 18, we can also obtain a ps lifetime in the keto form (2200 fs) so that relaxation of this tautomer on this timescale cannot be completely ruled out. However, we believe that the experimentally observed timescale of a few ps should be attributed primarily to the enol tautomer, based on its higher relative abundance. This assignment is in line with ultrafast experiments conducted with lower pump energies,8; 9 in which the enol tautomer is not excited and consequently the slow (ps) component vanishes.
| Study | Setup | (fs) | (fs) | (fs) |
|---|---|---|---|---|
| — This work — | ||||
| keto | + | 7 | 270 | (2200)a |
| enol | + | – | – | 1900 |
| — Experimental — | ||||
| Ref. 5 | 800 nm | – | – | 3200 |
| Ref. 6 | 2400 nm | – | 160 | 1860 |
| Ref. 7 | 200 nm | 50 | 820 | 3200 |
| Ref. 8 | 3800 nm | 100 | 210 | 2200 |
| Ref. 9 | 3800 nm | – | 500 | 4500 |
| Ref. 11, 10 | 780 nm | 50 | 240 | 2360 |
| — Theoretical — | ||||
| Ref. 28 | SH: OM2/MRCI | 40 | 370 | – |
| Ref. 27 | AIMS: CAS(2,2) | 20 | 800 | – |
| Ref. 18 | SH: CAS(14,10) | 9 | 527 | 3080 |
aThe value in parenthesis correspond to the triexponential fit reported in Table II.
| Tautomer | Ground state | Triplet | ||
|---|---|---|---|---|
| keto | ||||
| enol |
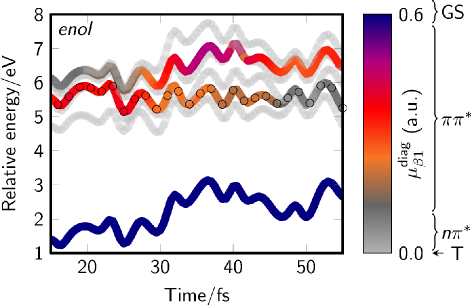
In order to better explain the spectroscopic observations, which do not only depend on the populations of the electronic states but also on transition dipole moments, an analysis of the involved excited states has been performed. Spectroscopic results are often discussed in terms of diabatic states, where the wavefunction character and thus properties like the transition dipole moments change as little as possible. However, our trajectories are calculated in the basis of the eigenfunctions of a Hamiltonian operator and these eigenfunctions change the wavefunction character. Since the diabatic (“spectroscopic”) state populations cannot be obtained from our simulations, we used the transition dipole moments to calculate approximate spectroscopic populations as explained below.
For all trajectories, the occupied state was classified as ground state (GS), , or triplet (T) on the basis of the transition dipole moment between the state where the trajectory is moving and the state lowest in energy (transformed into the diagonal basis, see section II). Table 4 gives the magnitudes of the transition dipole moments used for this classification. Note that these values are based on a qualitative examination of the trajectories and thus the assignment cannot be considered strict. Figure 5 shows a snapshot of the potential energies vs. time of one exemplary trajectory of the enol tautomer, where the trajectory starts on the lowest excited singlet surface. The curves are colored according to the magnitude of the transition dipole moment ; note that corresponds to the permanent dipole moment of the electronic ground state. As it can be seen, the magnitude of is a convenient indicator of the wavefunction character. Triplet states show virtually no transition dipole moments and are given in light grey. We choose comparably small values of (see Tab. 4) to be attributed to dark states (dark grey), while the bright state is identified by comparably large values (given as shades of red). With this classification it can be seen how this particular trajectory is initially in a state with character and after 50 fs has continuously evolved to a dark configuration, while one of the upper states becomes the bright state.
Using the information obtained from the transition dipole moments, the evolution of the number of trajectories in each of the defined “spectroscopic” classes (GS, , and T), which we will refer to as populations of the spectroscopic states, are depicted in Fig. 6. Comparing with the populations in Fig. 4, the ground state and triplet states are well identified, since the spectroscopic and the actual populations of these states are roughly the same.
For the keto tautomer, one should be careful not to make a correspondence between the states and in the MCH basis (recall Fig. 2a) and the spectroscopic states and . As already discussed, and are close in energy at the Franck-Condon region and since this region comprises a range of geometries, and may strongly mix and thus both exhibit character. This mixing together with the uncertainty of the classification scheme explains the initial population of the state given in Fig. 6.
For the enol tautomer, the assignment of the states and clearly changes over time. While in the beginning mostly corresponds to and to , this is quickly reversed with a time constant of approximately 40 fs, suggesting an adiabatic change of the wavefunction character. Since it has been shown before55; 56 that the excited-state wavefunction character may strongly influence ionization yields, the conversion is a possible explanation for the shortest time constant observed in the various experiments.8; 9; 10
III.4 Relaxation mechanism of keto cytosine
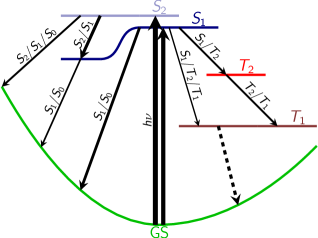
The dynamics simulations of the keto tautomer show ultrafast IC processes, as found in previous studies.28; 27; 29; 18; 30 Moreover, we observe ISC processes, which will be discussed below. The different relaxation pathways are summarized in Figure 7.
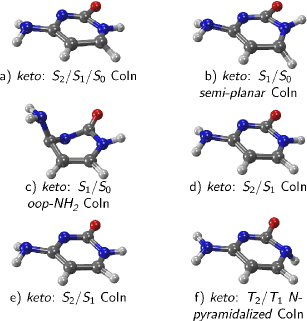
We observed three different relaxation cascades from the and excited states to the . The population in is deactivated directly (), while that in either relaxes by first decaying to the and later to the () or directly via a three-state CoIn (). 29 These relaxation cascades employ a number of CoIns, which are depicted in Figure 8a-e. Out of all trajectories decaying to the ground state during the course of the keto simulation, the ones giving rise to the time constant (25% of all trajectories) relax exclusively via two CoIns: the three-state CoIn (Fig. 8a) and the semi-planar CoIn (Fig. 8b). The labelling of the two-state CoIns follows the nomenclature of Ref. 18. Both the three-state CoIn 21; 17; 29 and the semi-planar CoIn19; 27; 20; 23; 13; 16; 18 have been reported by several groups previously. Compared to the ground state geometry, both CoIns are characterized primarily by an elongated \ceC2=O and \ceC5-C6 bond and a compressed \ceC2-N3 bond while mostly retaining ring planarity (see Fig. 1a for atom labeling).
The semi-planar CoIn is also employed by keto cytosine to relax to the at later times, contributing to (17% of all trajectories). The remaining trajectories (20%) returning to the do so via another CoIn, the oop-\ceNH2 CoIn (Fig. 8c), which shows a semi-twisted ring structure with puckering at \ceN3 and \ceC4 and a strong out-of-plane distortion of the amino-group. Only one trajectory relaxed through the so-called \ceC6-puckered CoIn,18 which was therefore not optimized. Rapid interconversion between and (usually in less than 30 fs) is facilitated by two more CoIns, given in Fig. 8d and 8e. Both CoIns were reported by Kistler et al.,16 with the names (Fig. 8d) and (Fig. 8e). Based on our dynamics simulations, (Fig. 8d) seems to be the major funnel for interconversion.
The deactivation mechanism described above is similar to the one obtained by Barbatti et al. 18 using CASSCF(14,10) in the singlet manifold only. Their simulations also find the semi-planar CoIn to be important in the early (16%) and late (52%) deactivation from the . An explanation why in our simulations this CoIn is less accessed at a later time (only 17%) is that part of the population is transferred to the triplet states. Additionally, Barbatti et al. 18 observe the oop-\ceNH2 (7%) and the \ceC6-puckered CoIn (8%) CoIns, while we only find the former, probably because of the level of theory employed. The multiple spawning dynamics of Hudock and Martínez27 based on CASSCF(2,2), in contrast, finds the oop-\ceNH2 CoIn to be the most important deactivation channel (65%), while the semiempirical surface-hopping dynamics simulations at the OM2 level of theory of Lan and coworkers 28 only see deactivation to the state via the \ceC6-puckered CoIn. Fair to say, however, is that all the electronic structure calculations in the dynamical simulations up to date do not include dynamical correlation (e.g. at CASPT2 level of theory or MRCI), which could in principle change the shape of the PESs. That said, the CASPT2 calculations of Blancafort 13 indicate that the \ceC6-puckered CoIn is more accessible than what is expected at CASSCF level of theory, see also Ref. 57 Similarly, the structure optimized for the semi-planar CoIn is higher in energy when dynamical correlation is included13; 17; 21 which implies that the time scales obtained for the in the present work and the other dynamical studies 27; 28; 18 could be underestimated.
One important finding in our simulations is that ISC in keto cytosine is ultrafast and competes with IC, in agreement with the previous simulations of Richter et al.30 However, while in the latter study most ISC hops were observed already after 10 fs, here ISC takes place on a timescale of few hundreds of fs. This slower ISC is because propagating in the MCH basis (see Section IIA) makes the algorithm much more stable in the case of weakly coupled surfaces, as it is the case for small spin-orbit couplings (SOCs). The here predicted ISC time scale is slower than the conversion and therefore ISC only occurs from the lowest singlet surface. Despite the minor differences with respect to the findings of Richter et al.,30, this work confirms that the main ISC path is and that the involved triplet IC () is extremely fast.
As depicted in Fig. 7, a second ISC path is the direct transition. However, as both processes (direct and indirect ) employ the same near-degeneracy, the two pathways are mechanistically very similar. Interestingly, efficient ISC proceeds via a three-state near-degeneracy of the , and states and not at singlet-triplet crossings involving only two states. and have mainly character (see Fig. 9) at the points where both states cross. In accordance with the El-Sayed rule,58 SOCs between the and states are usually very small (below 10 cm-1). However, at the three-state near-degeneracy acquires a minor contribution of character coming from the state, enhancing the SOCs to 30 cm-1 on average and a maximum of more than 40 cm-1. Such strong SOCs together with the small energy differences between and lead to a significant singlet-triplet mixing, so that the resulting states are neither pure singlets (total spin expectation value =0.0) nor pure triplets (=2.0). For the keto tautomer, which shows strong mixing, the values of are in the range 0.1 and 1.9 (in atomic units) for approximately 7% of the simulation time. The finding that the state is a precursor to triplet formation was already suggested by Hare et al.,59 although their work focused on excited-state dynamics in solution.
The analysis of all the geometries at which ISC takes place also reveals that an elongated \ceC2=O bond and a short \ceC2-N3 bond seems to be the key feature of the singlet-triplet crossings, while pyramidalization of the amino group – albeit present – is not important. A pyramidalization of the \ceN1 atom may also be relevant. Richter et al.30 also stated that pyramidalization at the amino group and at the \ceN1 atom is a key element in the ISC process. However, their analysis is based on all geometries which exhibited a very small singlet-triplet gap, regardless whether an actual hop occurred. In the current work, all singlet-triplet hops were analyzed case-by-case, giving a much more detailed picture of the ISC path. This examination showed that amino group pyramidalization does occur, but is probably coincidental and not responsible for the interaction of singlet and triplet states. Instead, we find that all geometries where ISC occurred show an elongated \ceC2=O bond and a short \ceC2-N3 bond. Interestingly, the hopping geometries possess \ceC2=O and \ceC2-N3 bond lengths similar to the semi-planar and CoIns. Since in the case of keto cytosine ISC necessitates the near-degeneracy of three states (, and ), optimization of either or crossings did not lead to geometries representative of the ISC mechanism. Nevertheless, we successfully optimized a crossing, see Fig. 8f. At this geometry, is only 0.05 eV above and and SOCs are large (26 and 37cm-1), as discussed above. This geometry is characterized by a pyramidalization at the \ceN1 atom, and it is therefore labelled \ceN1-pyramidalized CoIn.
As previously found by Richter et al.,30 the ISC pathway discussed above differs from the one predicted by quantum chemistry by Merchán et al.22, which was proposed to be . In the same paper, it is already discussed that the SOC enhancement is due to a / mixing. They proposed that this mixing is induced by the pyramidalization of \ceC6. Even though we find that SOC is indeed enhanced by such a mixing, we cannot confirm the importance of the \ceC6 pyramidalization. Here instead, the singlet-triplet crossing are mediated by the elongation of the \ceC2=O bond and a shortening of the \ceC2-N3 bond, as discussed above. The same authors 22 calculate an ISC probability as 0.1% per passage of the singlet-triplet crossing region along their pathway by means of a Landau-Zener type model. In this model,60 is given by:
| (11) | ||||
| (12) |
where is the gradient difference vector, is the velocity vector of the nuclei and their scalar product is the change in energy difference with respect to time . Based on energetic arguments,22 Merchán et al. estimate =0.1 eV/fs, which assumes that the system is moving perpendicular to the singlet-triplet seam. Our simulations reveal that the system is instead moving along the singlet-triplet seam for an extended time; accordingly, we expect to be much smaller. In such a case, the ISC probability corresponding to a single passage of the singlet-triplet crossing region would result well above 1%. Over the course of many such passages and combined with the apparent irreversibility of ISC (we do not observe transitions) population steadily accumulates in the triplet states.
III.5 Relaxation mechanism of enol cytosine
As already discussed above enol cytosine shows a dramatically different dynamics than keto cytosine. Figure 10 collects the observed relaxation pathways, revealing a less complicated behaviour compared to the keto tautomer. To the best of our knowledge, there are no CoIns reported for the enol tautomer. Therefore, special attention was put to analyze all relaxation pathways and optimize the related CoIns and singlet-triplet crossings (at the SA3S+4T-CASSCF(12,9)/6-31G* level of theory).
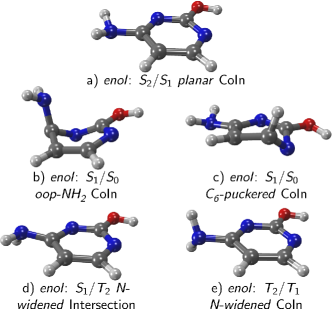
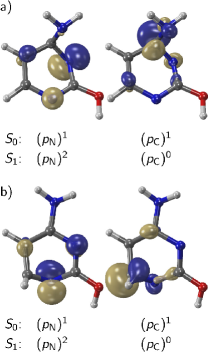
The deactivation of the population proceeds via a cascade of CoIn, first going to the and from the to the . The geometry of the CoIn responsible for interconversion (Fig. 11a) very much resembles the ground state minimum and it is labelled planar CoIn. The two involved electronic states are of () and () character, thus the IC is part of the transition discussed in section III.3. Two CoIns have been identified as responsible for the relaxation from the state to the ground state. The first one (Fig. 11b) is termed oop-\ceNH2 CoIn, in analogy to the CoIn of keto cytosine. It is characterized by a semi-twist geometry with puckering of atoms \ceN3 and \ceC4, as well as a strong out-of-plane deformation of the amino-group.The relevant orbitals for the and states are given in Fig. 12a. This CoIn is similar to the one of ethylene, where the twist around the double bond and pyramidalization at one \ceC atom leads to the crossing of ground and excited state. The minimum of the intersection seam was optimized at 4.34 eV, which is much lower than the excitation energy, making the CoIn accessible. The second CoIn (Fig. 11c) is the equivalent of the \ceC6-puckered CoIn in the keto tautomer, with puckering of the atoms \ceN1 and \ceC6. The orbitals are given in Fig. 12b, showing that this CoIn is also equivalent to an ethylenic CoIn, but here the twist does not involve the C-C bond but the C-N one. Even though this CoIn is higher in energy than the oop-\ceNH2 CoIn (4.64 vs. 4.34 eV), it accounts for the majority of relaxing trajectories (70% of the trajectories reaching the ground state within 1 ps). One reason might be the fact that \ceN1 and \ceC6 carry very light or no side groups, giving the twist-\ceN1C6 normal mode a lower reduced mass and a higher oscillation period. Thus, the \ceC6-puckered CoIn can be approached more often and this relaxation pathway becomes more important.
Compared to the keto tautomer, ISC is much slower in the enol form. This is because there are no extended areas on the PES where singlets and triplets are close to each other. Additionally, the enol form lacks the carbonyl group which is responsible for the large SOCs in the keto tautomer. As a consequence, the average SOCs are smaller by a factor of more than two in the enol form and / mixing is much less pronounced, with between 0.1 and 1.9 (in atomic units) only for 1% of the simulation time (compare to 7% for the keto). Yet the ISC pathway contributes to a minor extent. The geometry of the \ceN-widened crossing (Fig. 11d) is planar and shows comparably large \ceC6-N1-C2 and \ceC2-N3-C4 angles. The interacting states and are of and character, respectively. The energy of this crossing was found to be 4.79 eV and SOCs are close to 10cm-1. In all the simulations, this ISC was followed by triplet IC () within 40 fs on average, facilitating a change of wavefunction character from to . The relevant CoIn, depicted in Fig. 11e, shows a similar ring structure as the crossing geometry (Fig. 11d), albeit with slightly smaller angles at the nitrogen atoms. The CoIn in the enol tautomer was predicted at 4.40 eV.
IV Conclusion
We present results of ab initio surface-hopping dynamics including singlet and triplet states to unravel the relaxation mechanism of the keto and enol tautomers of cytosine after light irradiation. The simulations show an approximately biexponential decay with time constants of 6 and 230 fs for the keto tautomer and a monoexponential decay with a time constant of 2400 fs for the enol tautomer.
It is proposed in this work that the state of both tautomers lie too low in energy to be detected by usual probe laser setups (e.g. 3800 nm ionization). Thus, the experimentally measured decay rates arise from the simultaneous decay to the ground state and ISC followed by IC to . Under this premise, for the keto tautomer the two decay constants are 7 and 270 fs, where the second is an effective time constant for both processes. The relaxation of the enol tautomer is still monoexponential with a time constant of 1900 fs. Additionally, for the enol form it is found that the state changes with a time constant of 40 fs from bright to dark, which is due to an adiabatic change of wavefunction character from to . The calculated decay times (7, 270 and 1900 fs) agree well with the available experimental results. It is therefore proposed that while the keto tautomer is responsible for the reported ultrafast transients, the enol tautomer could contribute to the ps time scale measured experimentally.
For the keto tautomer, a number of IC and ISC competing processes are found. The relaxation mechanism involving triplet states was found to be . Even though both and states are predominantly of character, SOC between the two states can be dramatically increased if additional states are close allowing for mixing with character. Additionally, the small energy differences between and of less than 0.01 eV allow for effective ISC to take place. One unambiguously identified structural feature promoting ISC is the stretching of the \ceC=O group.
The relaxation mechanism of enol cytosine is considerably simpler than the keto counterpart and ground state repopulation is significantly slower than in keto cytosine. Even though the enol form exhibits the \ceC6-puckered CoIn, it lacks the carbonyl group and thus the very efficient pathway associated with the stretching of the \ceC=O bond. Also due to the missing carbonyl group, there is no efficient ISC channel found in enol cytosine.
Acknowledgements
This work is supported by the Deutsche Forschungsgemeinschaft (DFG) within the Project GO 1059/6-1 and by the German Federal Ministry of Education and Research within the Research Initiative PhoNa. Generous allocation of computer time at the Vienna Scientific Cluster (VSC) is gratefully acknowledged. The authors wish to thank Tom Weinacht for useful discussions.
Supporting information
V Optimized Geometries
V.1 Keto tautomer
Ground state minimum from MP2/6-311G**:
13
keto cytosine, S0 minimum
C -0.068773583  2.644406855 -0.017986395
C -1.217618868  1.778517632 -0.069019606
C -0.954950130  0.443464687 -0.074742685
N  0.330827750  0.015058300 -0.026586955
C  1.457239615  0.878304672  0.028936022
N  1.177876864  2.231412989  0.022285695
O  2.570795443  0.392123670  0.068829626
N -0.276445039  3.999250355  0.054355190
H -1.124704501  4.356775579 -0.356071716
H  0.550514655 -0.971271203 -0.029503369
H -2.230607364  2.158058927 -0.090139977
H -1.726612162 -0.318669951 -0.112825632
H  0.555433319  4.545287487 -0.120546198
Triplet minimum from SA4S+3T-CASSCF(12,9)/6-31G*:
13
keto cytosine, T1 minimum
C -0.155431664  2.663756914 -0.060533707
C -1.217459954  1.785980393 -0.009540096
C -0.976302678  0.322212442  0.008572157
N  0.373013888 -0.009261542  0.063766077
C  1.400362047  0.889012469 -0.072594365
N  1.130514120  2.255109708 -0.111011737
O  2.548185488  0.508610768 -0.134948306
N -0.339914463  4.043258092 -0.152964581
H -1.107538117  4.394659490  0.378046722
H  0.648739212 -0.965379403  0.074841606
H -2.227609632  2.145273300 -0.042475023
H -1.630095777 -0.310222691  0.582978603
H  0.499252796  4.546469965  0.043969268
conical intersection (equivalent to semi-planar18 or (ci01)’16, also found in Refs. 13; 27; 20; 23; 19) from SA4S+3T-CASSCF(12,9)/6-31G* ( displayed in the paper in Figure 8 b)):
13
keto cytosine, S1/S0 CoIn semi-planar
C -0.166396960  2.640760894 -0.079394749
C -1.192810242  1.779684135 -0.173074550
C -0.951578474  0.337422016 -0.133105868
N  0.398924317 -0.012994102  0.058264395
C  1.324761162  0.965285998 -0.001526212
N  1.214951868  2.182753340 -0.162727951
O  2.531287750  0.261401662 -0.022012719
N -0.226595732  4.008665477  0.174147530
H -1.133114629  4.403857555  0.035658729
H  0.633042609 -0.841855865  0.559662143
H -2.210994922  2.123427874 -0.146118115
H -1.555836958 -0.369128226 -0.669576111
H  0.465534794  4.512510469 -0.341611237
conical intersection (equivalent to oop-\ceNH218 or (ci01)16) from SA4S+3T-CASSCF(12,9)/6-31G* (displayed in the paper in Figure 8 c)):
13
keto cytosine, S1/S0 CoIn oop-NH2
C -0.203970465  2.727356856 -0.383211967
C -1.325375587  1.801421910 -0.144453849
C -0.969223920  0.549275706  0.220007610
N  0.378205602  0.160706084  0.284467185
C  1.394703115  1.009498485 -0.118412326
N  0.870812295  2.021274691 -0.942208223
O  2.551907818  0.828359921  0.106215686
N  0.137804078  3.637156589  0.633581946
H  0.750785095  4.361500435  0.317502996
H  0.646017785 -0.560401498  0.916486860
H -2.350495248  2.116971290 -0.150898418
H -1.676090982 -0.216689427  0.474761683
H -0.661639361  4.038674752  1.079074339
conical intersection (equivalent to (ci012)17, also found in Refs. 21; 29) from SA4S+3T-CASSCF(12,9)/6-31G* (optimized as CoIn, displayed in the paper in Figure 8 a)):
13
keto cytosine, S2/S1/S0 CoIn
C -0.261439224  2.664725400  0.054200961
C -1.265412911  1.799284410  0.080040150
C -0.956569139  0.334325871  0.177939405
N  0.372862542  0.063676246 -0.006735474
C  1.282220844  1.026515156  0.010256654
N  1.141836817  2.266708140  0.040109599
O  2.525958770  0.337847195 -0.041301157
N -0.344624335  4.041831255  0.089946437
H -1.218022027  4.430105730 -0.192364480
H  0.707582112 -0.877872174 -0.019819596
H -2.288473732  2.118574384  0.133300383
H -1.637603083 -0.426674264 -0.149825303
H  0.436617774  4.483078555 -0.346405359
conical intersection (equivalent to (ci12)16) from SA4S+3T-CASSCF(12,9)/6-31G* (displayed in the paper in Figure 8 d)):
13
keto cytosine, S2/S1 CoIn Rx(ci12)
C -0.149370274  2.678410912  0.015783698
C -1.205967219  1.831835630 -0.080894267
C -0.964238436  0.416235123 -0.113392905
N  0.356222646  0.035935168 -0.056733508
C  1.343226236  0.955580018  0.034615799
N  1.190981536  2.222580917  0.074306490
O  2.543743488  0.361351984  0.078599886
N -0.237921995  4.060335838  0.129872648
H -1.062845499  4.460854378 -0.262232201
H  0.626336764 -0.921633594 -0.075489298
H -2.215274002  2.194774217 -0.116693675
H -1.708546500 -0.344936807 -0.183183716
H  0.587698934  4.517013432 -0.195492554
conical intersection (equivalent to (ci12)’16) from SA4S+3T-CASSCF(12,9)/6-31G* (displayed in the paper in Figure 8 e)):
13
keto cytosine, S2/S1 CoIn Rx(ci12)’
C -0.187608306  2.693660927 -0.034300984
C -1.233389808  1.820140729 -0.065640134
C -0.974744749  0.421394812 -0.059158764
N  0.341022247 -0.011546732 -0.127368846
C  1.409876157  0.857221764  0.023840874
N  1.102522343  2.147911136  0.052207979
O  2.548444403  0.400405770  0.117565055
N -0.235655190  4.081893960  0.049556768
H -1.122571101  4.456578018 -0.213060947
H  0.564099281 -0.976966949 -0.032296910
H -2.246086930  2.174692340 -0.090583877
H -1.735842196 -0.327702079 -0.037524089
H  0.496372989  4.521795555 -0.470340399
conical intersection from SA4S+3T-CASSCF(12,9)/6-31G* (displayed in the paper in Figure 8 f)):
13
keto cytosine, T2/T1 CoIn N-pyramidalized
C -0.089596812  2.668085713  0.050209979
C -1.179344329  1.768997116 -0.040720322
C -0.942732156  0.427634092 -0.119732290
N  0.393733641 -0.086690561 -0.039519900
C  1.341083046  0.936068683  0.023448638
N  1.194638688  2.178587886  0.024328469
O  2.606879229  0.476202182  0.244287131
N -0.224401703  4.042977997  0.078907222
H  0.589361321  4.605753197  0.137930080
H  0.588253733 -0.754201858 -0.757671993
H -2.190562081  2.129928302 -0.033322784
H -1.709414850 -0.317876679 -0.159502431
H -1.086567565  4.479574366 -0.134406515
V.2 Enol tautomer
Ground state minimum from MP2/6-311G**:
13
enol cytosine, S0 minimum
C  0.010625510  1.766522530  0.006612200
C -2.351501000  0.536787460 -0.009538460
C -2.294608210 -2.077209830 -0.011090920
C  1.965306570 -2.029622620 -0.004959960
N  2.185931430  0.479640730  0.013035510
N -0.136759500 -3.421963010 -0.012856160
N  0.211629730  4.355569160 -0.107217780
O  4.173197140 -3.292874090 -0.002123440
H  1.940634190  5.001467260  0.380212980
H -1.244475120  5.349830620  0.615080210
H -4.116243340  1.576035790 -0.028768870
H -4.036258760 -3.168440630 -0.015561430
H  3.686570600 -5.050999310 -0.008886730
Triplet minimum from SA3S+4T-CASSCF(12,9)/6-31G*:
13
enol cytosine, T1 minimum
C  0.075811830  0.978202089  0.074726012
C -1.233845434  0.320292344  0.238339781
C -1.262467895 -1.096970361 -0.117484128
C  0.998015466 -1.109436149  0.192452434
N  1.150510272  0.285061248  0.007920082
N -0.183158735 -1.796628489 -0.184064280
N  0.089943272  2.344567037 -0.127690583
O  2.104094655 -1.816422755 -0.102489975
H  1.005543173  2.740161530 -0.086794785
H -0.573972377  2.864221410  0.405452301
H -2.136005944  0.892368209  0.327075565
H -2.196083640 -1.570959723 -0.360977993
H  2.848420810 -1.229311101 -0.064943926
conical intersection (equivalent to oop-\ceNH218 or (ci01)16) from SA3S+4T-CASSCF(12,9)/6-31G* (displayed in the paper in Figure 11 b)):
13
enol cytosine, S1/S0 CoIn oop-NH2
C -0.038436380  0.980182354 -0.434852906
C -1.350283143  0.306708928 -0.224081598
C -1.239981620 -0.954355639  0.257346915
C  1.032346993 -1.026127374 -0.080495536
N  0.858178803  0.028641156 -0.948198860
N  0.005449774 -1.598417717  0.426929157
N  0.454502002  1.687084920  0.682530738
O  2.249367213 -1.557436180 -0.017644652
H -0.246493322  2.233488430  1.139539029
H  1.239013912  2.265850689  0.459166660
H -2.288385862  0.825666585 -0.275998791
H -2.089261540 -1.544003481  0.542393979
H  2.186902596 -2.377930095  0.459800540
conical intersection (equivalent to \ceC6-puckered18 or (ci01)16) from SA3S+4T-CASSCF(12,9)/6-31G* (displayed in the paper in Figure 11 c)):
13
enol cytosine, S1/S0 CoIn C6-puckered
C -0.080344470  0.887657845 -0.017436774
C -1.289403885  0.263338890 -0.052368262
C -1.159845161 -1.179485616  0.233822828
C  1.111240830 -1.081875281 -0.011282940
N  1.145078352  0.184443933  0.141650860
N -0.064441447 -1.627150810 -0.493821746
N  0.121715425  2.251762149 -0.148699921
O  2.222215172 -1.811343424  0.039880656
H  0.954291743  2.571355938  0.297525897
H -0.669802671  2.820931925  0.060909518
H -2.217839364  0.800585928 -0.050519164
H -1.218341526 -1.493135739  1.272105888
H  2.030917671 -2.707896804 -0.206212829
conical intersection from SA3S+4T-CASSCF(12,9)/6-31G* (displayed in the paper in Figure 11 a)):
13
enol cytosine, S2/S1 CoIn planar
C -0.026790111  0.946653018 -0.010610954
C -1.271718210  0.295706614 -0.002721522
C -1.279297066 -1.136601501 -0.024759159
C  1.070143536 -1.086769538 -0.051369587
N  1.154663446  0.238841708 -0.051463563
N -0.063837079 -1.787716919 -0.035686683
N  0.112087082  2.321372596 -0.064265465
O  2.220822122 -1.755515465 -0.068726004
H  1.012783253  2.639467537  0.224416193
H -0.627078841  2.843440771  0.354401580
H -2.187735625  0.854761206  0.005452497
H -2.162380236 -1.735471503  0.027833850
H  2.027839514 -2.685391116 -0.075515400
intersection from SA3S+4T-CASSCF(12,9)/6-31G* (displayed in the paper in Figure 11 a)):
13
enol cytosine, S1/T2 In N-widened
C -0.058318459  0.962672094 -0.046222626
C -1.263764473  0.295666889 -0.100567801
C -1.256172437 -1.103341970 -0.018251284
C  1.116306760 -1.148474943  0.091613178
N  1.075157953  0.153462630  0.035445844
N -0.022240460 -1.752015986  0.040877979
N  0.184114678  2.342056939  0.001196759
O  2.279543593 -1.773657058  0.183316676
H -0.663020101  2.862446079  0.023757858
H  0.735676195  2.657308754 -0.769432194
H -2.186586241  0.842515491 -0.180636639
H -2.124276021 -1.721355705 -0.030588070
H  2.112437670 -2.707810984  0.209922950
conical intersection from SA3S+4T-CASSCF(12,9)/6-31G* (displayed in the paper in Figure 11 e)):
13
enol cytosine, T2/T1 CoIn N-widened
C -0.014436349  0.984136324 -0.027760212
C -1.190329903  0.363885161  0.355802568
C -1.206674696 -1.023842817  0.512020065
C  1.054764580 -1.183508330 -0.071290605
N  1.095810940  0.137052237 -0.234598094
N -0.038928880 -1.765153007  0.288854810
N  0.131426673  2.367729979 -0.227957888
O  2.176266760 -1.858047984 -0.295481979
H  0.394111518  2.580785566 -1.171593384
H  0.826303176  2.759032951  0.379074486
H -2.065997294  0.960056132  0.524952285
H -2.070141781 -1.582254685  0.802396469
H  2.001762739 -2.780481702 -0.147990232
References
- (1) C. E. Crespo-Hernández, B. Cohen, P. M. Hare, B. Kohler, Chem. Rev. 2004, 104, 1977–2020.
- (2) R. D. Brown, P. D. Godfrey, D. McNaughton, A. P. Pierlot, J. Am. Chem. Soc. 1989, 111, 2308–2310.
- (3) M. Szczesniak, K. Szczepaniak, J. S. Kwiatkowski, K. KuBulat, W. B. Person, J. Am. Chem. Soc. 1988, 110, 8319–8330.
- (4) G. Bazsó, G. Tarczay, G. Fogarasi, P. G. Szalay, Phys. Chem. Chem. Phys. 2011, 13, 6799–6807.
- (5) H. Kang, K. T. Lee, B. Jung, Y. J. Ko, S. K. Kim, J. Am. Chem. Soc. 2002, 124, 12958–12959.
- (6) C. Canuel, M. Mons, F. Piuzzi, B. Tardivel, I. Dimicoli, M. Elhanine, J. Chem. Phys 2005, 122, 074316–074316–6.
- (7) S. Ullrich, T. Schultz, M. Z. Zgierski, A. Stolow, Phys. Chem. Chem. Phys. 2004, 6, 2796–2801.
- (8) K. Kosma, C. Schröter, E. Samoylova, I. V. Hertel, T. Schultz, J. Am. Chem. Soc. 2009, 131, 16939–16943.
- (9) J.-W. Ho, H.-C. Yen, W.-K. Chou, C.-N. Weng, L.-H. Cheng, H.-Q. Shi, S.-H. Lai, P.-Y. Cheng, J. Phys. Chem. A 2011, 115, 8406–8418.
- (10) M. Kotur, T. Weinacht, C. Zhou, S. Matsika, IEEE J. Sel. Top. Quant. Electron. 2012, 18, 187 –194.
- (11) M. Kotur, T. C. Weinacht, C. Zhou, K. A. Kistler, S. Matsika, J. Chem. Phys. 2011, 134, 184309.
- (12) K. Tomić, J. Tatchen, C. M. Marian, J. Phys. Chem. A 2005, 109, 8410–8418.
- (13) L. Blancafort, Photochem. Photobiol. 2007, 83, 603–610.
- (14) A. Tajti, G. Fogarasi, P. G. Szalay, ChemPhysChem 2009, 10, 1603–1606.
- (15) A. Domingo, A. Rodríguez-Fortea, C. de Graaf, J. Chem. Theory Comput. 2012, 8, 235–244.
- (16) K. A. Kistler, S. Matsika, J. Phys. Chem. A 2007, 111, 2650–2661.
- (17) K. A. Kistler, S. Matsika, J. Chem. Phys. 2008, 128, 215102–215102–14.
- (18) M. Barbatti, A. J. A. Aquino, J. J. Szymczak, D. Nachtigallová, H. Lischka, Phys. Chem. Chem. Phys. 2011, 13, 6145–6155.
- (19) N. Ismail, L. Blancafort, M. Olivucci, B. Kohler, M. A. Robb, J. Am. Chem. Soc. 2002, 124, 6818–6819.
- (20) M. Merchán, L. Serrano-Andrés, J. Am. Chem. Soc. 2003, 125, 8108–8109.
- (21) L. Blancafort, M. A. Robb, J. Phys. Chem. A 2004, 108, 10609–10614.
- (22) M. Merchán, L. Serrano-Andrés, M. A. Robb, L. Blancafort, J. Am. Chem. Soc. 2005, 127, 1820–1825.
- (23) L. Blancafort, B. Cohen, P. M. Hare, B. Kohler, M. A. Robb, J. Phys. Chem. A 2005, 109, 4431–4436.
- (24) R. González-Luque, T. Climent, I. González-Ramírez, M. Merchán, L. Serrano-Andrés, J. Chem. Theory Comput. 2010, 6, 2103–2114.
- (25) A. L. Sobolewski, W. Domcke, Phys. Chem. Chem. Phys. 2004, 6, 2763–2771.
- (26) M. Z. Zgierski, S. Patchkovskii, T. Fujiwara, E. C. Lim, J. Phys. Chem. A 2005, 109, 9384–9387.
- (27) H. R. Hudock, T. J. Martínez, ChemPhysChem 2008, 9, 2486–2490.
- (28) Z. Lan, E. Fabiano, W. Thiel, J. Phys. Chem. B 2009, 113, 3548–3555.
- (29) J. González-Vázquez, L. González, ChemPhysChem 2010, 11, 3617–3624.
- (30) M. Richter, P. Marquetand, J. González-Vázquez, I. Sola, L. González, J. Phys. Chem. Lett. 2012, 3, 3090–3095.
- (31) E. Nir, M. Müller, L. Grace, M. de Vries, Chem. Phys. Lett. 2002, 355, 59–64.
- (32) J. C. Tully, J. Chem. Phys. 1990, 93, 1061–1071.
- (33) M. Richter, P. Marquetand, J. González-Vázquez, I. Sola, L. González, J. Chem. Theory Comput. 2011, 7, 1253–1258.
- (34) G. Granucci, M. Persico, G. Spighi, J. Chem. Phys. 2012, 137, 22A501.
- (35) G. Granucci, M. Persico, A. Toniolo, J. Chem. Phys. 2001, 114, 10608–10615.
- (36) F. Plasser, G. Granucci, J. Pittner, M. Barbatti, M. Persico, H. Lischka, J. Chem. Phys. 2012, 137, 22A514–22A514–13.
- (37) M. Barbatti, G. Granucci, M. Ruckenbauer, F. Plasser, J. Pittner, M. Persico, H. Lischka, NEWTON-X: a package for Newtonian dynamics close to the crossing seam, version 1.2, www.newtonx.org 2011.
- (38) G. Granucci, M. Persico, J. Chem. Phys 2007, 126, 134114.
- (39) R. Krishnan, J. S. Binkley, R. Seeger, J. A. Pople, J. Chem. Phys. 1980, 72, 650–654.
- (40) R. Schinke, Photodissociation Dynamics: Spectroscopy and Fragmentation of Small Polyatomic Molecules, Cambridge University Press 1995.
- (41) J. P. Dahl, M. Springborg, J. Chem. Phys. 1988, 88, 4535–4547.
- (42) M. Barbatti, G. Granucci, M. Persico, M. Ruckenbauer, M. Vazdar, M. Eckert-Maksić, H. Lischka, J. Photochem. Photobiol. A 2007, 190, 228–240.
- (43) H.-J. Werner, P. J. Knowles, G. Knizia, F. R. Manby, M. Schütz, WIREs Comput. Mol. Sci. 2012, 2, 242–253.
- (44) H.-J. Werner, P. J. Knowles, G. Knizia, F. R. Manby, M. Schütz, P. Celani, T. Korona, R. Lindh, A. Mitrushenkov, G. Rauhut, K. R. Shamasundar, T. B. Adler, R. D. Amos, A. Bernhardsson, A. Berning, D. L. Cooper, M. J. O. Deegan, A. J. Dobbyn, F. Eckert, E. Goll, C. Hampel, A. Hesselmann, G. Hetzer, T. Hrenar, G. Jansen, C. Köppl, Y. Liu, A. W. Lloyd, R. A. Mata, A. J. May, S. J. McNicholas, W. Meyer, M. E. Mura, A. Nicklass, D. P. O’Neill, P. Palmieri, D. Peng, K. Pflüger, R. Pitzer, M. Reiher, T. Shiozaki, H. Stoll, A. J. Stone, R. Tarroni, T. Thorsteinsson, M. Wang, Molpro, version 2012.1, a package of ab initio programs 2012, see http://www.molpro.net.
- (45) H.-J. Werner, P. J. Knowles, J. Chem. Phys. 1985, 82, 5053.
- (46) P. J. Knowles, H.-J. Werner, Chem. Phys. Lett. 1985, 115, 259–267.
- (47) U. Varetto, MOLEKEL 5.4, Swiss National Supercomputing Centre: Lugano (Switzerland).
- (48) P. J. Knowles, H.-J. Werner, Chem. Phys. Lett. 1988, 145, 514–522.
- (49) H.-J. Werner, P. J. Knowles, J. Chem. Phys. 1988, 89, 5803–5814.
- (50) P. J. Knowles, H.-J. Werner, Theor. Chim. Acta 1992, 84, 95–103.
- (51) D. Dougherty, S. P. McGlynn, J. Chem. Phys. 1977, 67, 1289–1290.
- (52) C. Yu, S. Peng, I. Akiyama, J. Lin, P. R. LeBreton, J. Am. Chem. Soc. 1978, 100, 2303–2307.
- (53) O. Dolgounitcheva, V. G. Zakrzewski, J. V. Ortiz, J. Phys. Chem. A 2003, 107, 822–828.
- (54) M. Kotur, Strong-field Dissociative Ionization as a Probe of Molecular Dynamics and Structure, Ph.D. thesis, Stony Brook University 2012.
- (55) M. Spanner, S. Patchkovskii, C. Zhou, S. Matsika, M. Kotur, T. C. Weinacht, Phys. Rev. A 2012, 86, 053406.
- (56) M. Kotur, C. Zhou, S. Matsika, S. Patchkovskii, M. Spanner, T. C. Weinacht, Phys. Rev. Lett. 2012, 109, 203007.
- (57) M. Merchán, R. González-Luque, T. Climent, L. Serrano-Andrés, E. Rodríguez, M. Reguero, D. Peláez, J. Phys. Chem. B 2006, 110, 26471–26476.
- (58) M. A. El-Sayed, J. Chem. Phys. 1963, 38, 2834–2838.
- (59) P. M. Hare, C. E. Crespo-Hernández, B. Kohler, Proc. Natl. Am. Soc. 2007, 104, 435–440.
- (60) M. Riad Manaa, D. R. Yarkony, J. Chem. Phys. 1991, 95, 1808–1816.