Pinning-induced folding-unfolding asymmetry in adhesive creases
Abstract
The compression of soft elastic matter and biological tissue can lead to creasing, an instability where a surface folds sharply into periodic self-contacts. Intriguingly, the unfolding of the surface upon releasing the strain is usually not perfect: small scars remain that serve as nuclei for creases during repeated compressions. Here we present creasing experiments with sticky polymer surfaces, using confocal microscopy, which resolve the contact line region where folding and unfolding occurs. It is found that surface tension induces a second fold, at the edge of the self-contact, which leads to a singular elastic stress and self-similar crease morphologies. However, these profiles exhibit an intrinsic folding-unfolding asymmetry that is caused by contact line pinning, in a way that resembles wetting of liquids on imperfect solids. Contact line pinning is therefore a key element of creasing: it inhibits complete unfolding and gives soft surfaces a folding memory.
Creases are ubiquitous to nature and can readily be observed by closing ones’ hand or bending ones’ arm: Soft tissue responds to compression by folding into deep valleys of self-contacting skin gent1999rubber ; hong2009formation ; dervaux2012review . The morphology of mammalian brains tallinen2014gyrification ; mota2015cortical ; tallinen2016cortical ; karzbrun2018organoids or tumors dervaux2011tumors is dominated by creases that emerge from tissue growth under constraint conditions. Similarly, polymer coatings in technological applications may suffer from creasing due to swelling onuki1989theory ; tanaka1994swelling ; trujillo2008hydrogels ; kim2009patterns ; benamar2010swelling , but also compressed elastomers gent1999rubber ; ghatak2007kink ; mora2011instability ; cai2012elastomer and viscoelastic liquids mora2011instability display this instability.
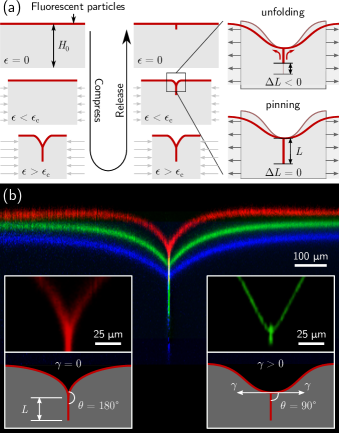
The canonical creasing behavior can be realized by uniaxially compressing a slab of a soft material (Figure 1 a). Sharp creases form via a sub-critical bifurcation after a reaching a critical strain gent1999rubber ; hong2009formation . When subsequently releasing the strain to below , the length of the crease is only gradually reduced. This implies bistability since either creased or homogeneous states can be found, depending on the deformation history yoon2010swelling ; chen2012surface ; karpitschka2017 . Recent studies clarified the onset of creasing hong2009formation ; ciarletta2018matched ; ciarletta2019nucleation , invoking surface tension yoon2010swelling ; chen2012surface ; liu2019elastocapillary or the presence of a skin hohlfeld2011unfolding to explain the observed bistability.
Interestingly, a microscopic residual crease typically remains even after the strain is fully released to (Figure 1 a). This small feature, referred to as a “scar”, is of great significance, since it serves as a nucleus for creases when repeating the compression trujillo2008hydrogels ; yoon2010swelling ; chen2012surface . As such, these scars endow soft materials with mechanical memory trujillo2008hydrogels ; yoon2010swelling , offering a potential of dynamic programmability of surface folds. Despite their importance, scars have remained somewhat enigmatic. It was found that scars are not due to material failure, and their persistence was argued to originate from adhesion yoon2010swelling ; chen2012surface ; cai2012elastomer . However, it is not clear whether adhesion and surface tension can actually lead to a reduction of surface energy compared to the flat, scarless state. Recent work focused on the consequences of surface tension to the onset bifurcation of creasing liu2019elastocapillary , but it is not known how surface tension affects folding and unfolding at the microscale.
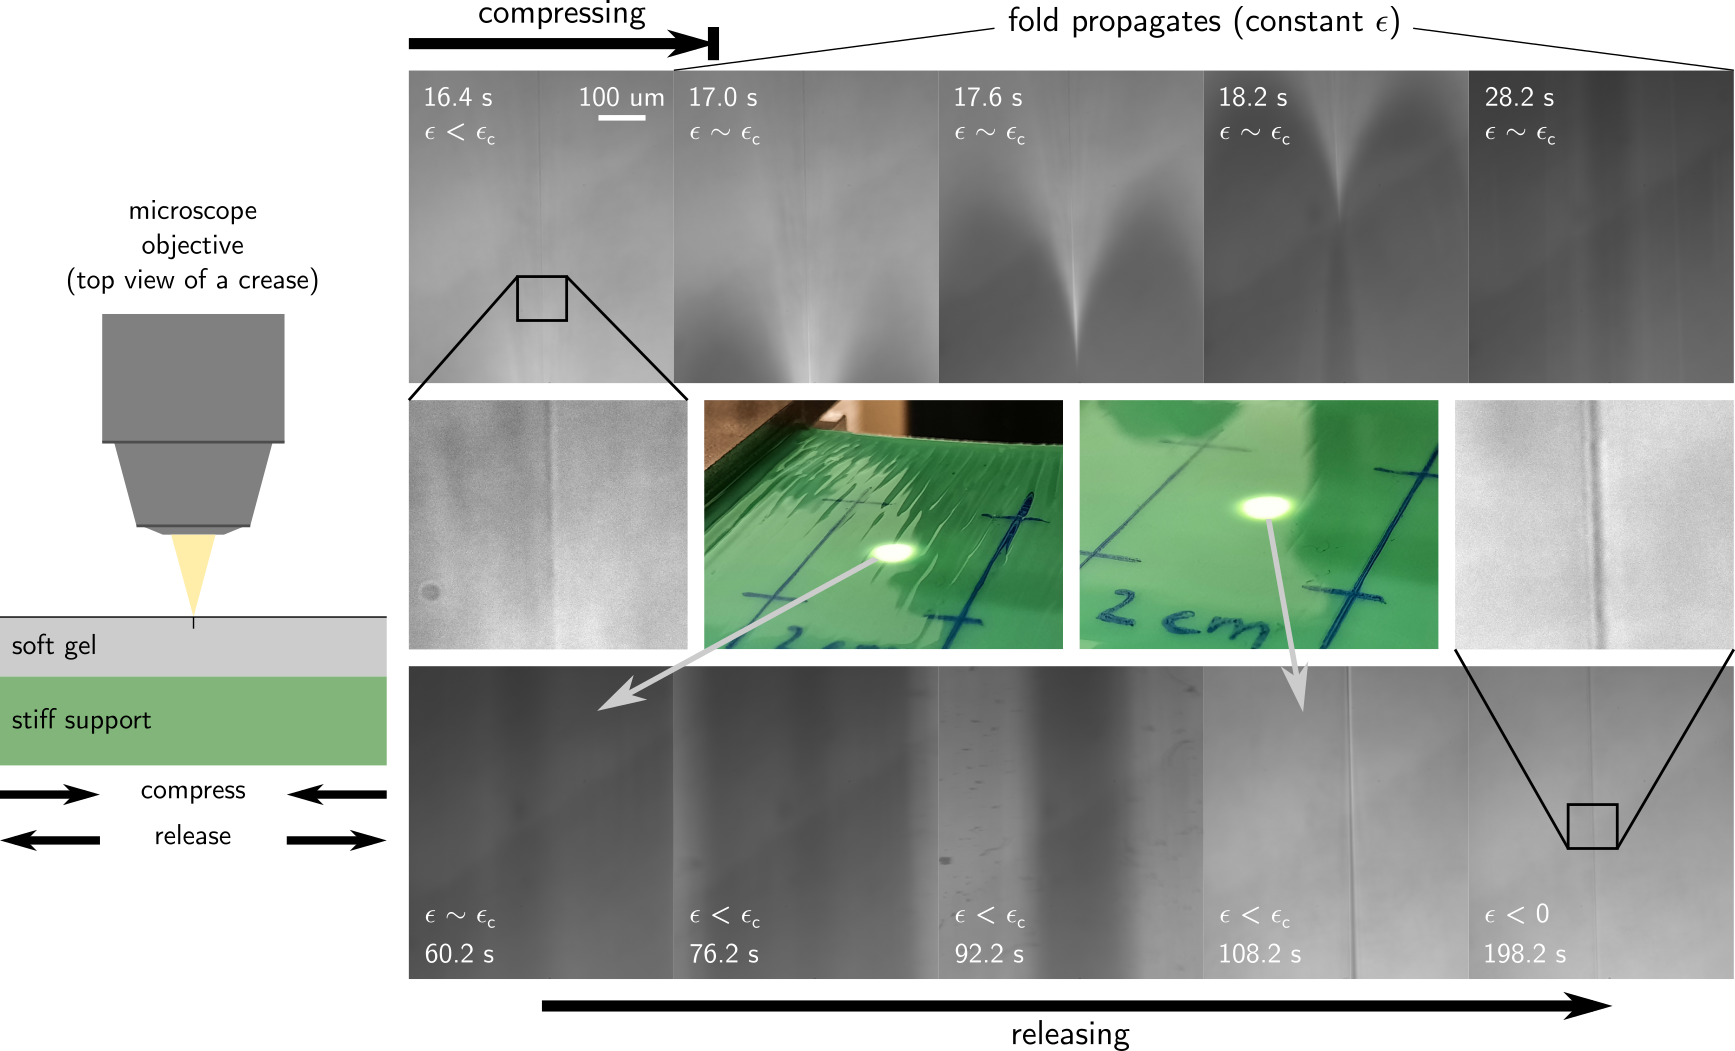
In this Letter we resolve the micro- and macro-morphology of adhesive creases by confocal microscopy (Figure 1 b), and identify the role of surface tension (), inside the self-contact. It is found that surface tension induces a second fold at the edge of the self contact, turning the surface into a T-shaped profile (Figure 1 b, bottomright). This involves a change of the contact angle from for to for . Further, we show that folding and unfolding the crease are, at the microscale, intrinsically asymmetric processes. The unfolding is inhibited, and ultimately prevented, by contact line pinning. This pinning-induced hysteresis implies a new type of bistability, even far above the onset of creasing, and offers a natural explanation for the formation of scars.
Experimental
A layer of a soft polymer gel (Dow Corning CY52-276, components A:B mixed 1:1 or 1.4:1 to obtain different shear moduli, thickness to ) was prepared on top of a stiff, uniaxially pre-stretched PVS rubber sheet (Zhermack Elite Double 20). To compress the gel layer, the pre-stretch of the support was slowly released by a micrometer mora2011instability ; cai2012elastomer . Fluorescent particles (Invitrogen FluoSpheres, diameter) were added to the bottom and top surface of the gel. Gel thickness and top surface morphology were measured with an upright confocal microscope (Leica TCS-SP2) with 10X and 40X magnification. To image the self-contact through the free surface with minimal optical artifacts, we used index-matched immersion liquids. The immersion also offers a way to tune the gel surface tension: We measured for the immersion with a long-chain silicone oil (Wacker, ) and for a water-glycerol mixture cai2012elastomer . The relative importance of surface tension to shear modulus is quantified by the elastocapillary length, . Importantly, these liquids caused virtually no swelling of the gel, as was tested by prolonged immersion. The typical compression protocol of an experiment is sketched in Figure 1 a. First we increased the strain in small steps, recording after each step and a prolonged waiting time (, much larger than the material relaxation time ) the free-surface morphology by an xyz-scan. After creases had formed we compressed a bit further, then repeated this procedure while decreasing again. Further experimental details can be found in the supplemental material suplmat .
Elastocapillary self-contact
We first quantify the morphology of the elastocapilary self-contact, and how it is altered by surface tension. Figure 1 b shows creased surface profiles from three experiments with different elastocapillary lengths: (red), (green, ), and (blue, ). Increasing the elastocapillary length amplifies the relative importance of surface tension, which on the macroscale leads to shallower indentations.
However, the most important consequence of is reflected in the micro-morphology of the contact region (high magnification data, insets of Figure 1 b). The angle that the surface describes at the contact line changes from a gentle touchdown with for , to for . Hence, besides the fold at the bottom of the crease, there is a second fold a the top of the self-contact where the surface profile acquires a T-shape. On scales much smaller than , capillarity will be dominant over elasticity and we expect the contact angle to be given by Neumann’s law Karpitschka:SM2016 ; Xu:NC2017 ; Pandey:PRX2020 . In case of perfect self-adhesion, which is expected for soft polymer gels, the surface tension in the self-contact vanishes completely. The remaining balance of gel-vapor surface tensions implies the fold of (Figure 1 b), in good agreement with our experiments.
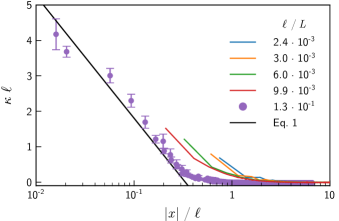
Consequential to this second fold is a strong curvature of the free surface near the contact line. When attempting to quantify this curvature, however, it turns out that does not reach a well-defined limiting value. Rather, it still grows as we reach our measurement resolution, which is well below the elastocapillary length. Figure 2 (purple markers) shows the measured curvature as a function of the distance to the contact line, for . Surprisingly, the data suggest a logarithmic divergence of as the contact line is approached.
The logarithmic singularity of curvature is caused by the capillary boundary condition, which forces the material into a angle. Analogous to the bottom of the crease hong2009formation ; karpitschka2017 ; ciarletta2018matched , a fold of angle introduces a weak (logarithmic) stress singularity. For a neo-Hookean solid the stress singularity reads singh1965note , where is the fold angle in radians and a gauge pressure. At the bottom of the self contact, where the crease was initiated, the fold has an angle . In contrast, the two folds at the contact line involve an angle , connecting the self-contact to the free surface in a T-shape. Thus the elastic stress must be balanced by the Laplace pressure , which for a right angle gives the elastocapillary balance
| (1) |
valid at distances . Here we absorbed the gauge pressure into a dimensionless constant . The prediction (1) is shown as the solid line in Figure 2, in excellent agreement with the experimental data. We only adjusted the value of , which cannot be derived by the local analysis of the singularity: it reflects a gauge pressure that is inherited from the full solution, invoking scales larger than .
To explore this effect, we performed finite element simulations of elastocapillary creases, assuming a neo-Hookean solid with constant surface tension (see supplemental material for details suplmat ). Numerical results are obtained for various ratios of , where is the crease length. All numerical results exhibit the logarithmic divergence of curvature (Figure 2, lines), following the prediction (1). The fact that the data are shifted laterally reflects the non-universality of . Still, the numerical data gradually approach the experimental data as approaches the experimental value.
Thus we conclude that the capillary nature of adhesive creases has two important consequences at the microscale: (i) it governs the contact angle , implying a second fold at the top of the crease where the surface is T-shaped. (ii) the fold, in turn, introduces a logarithmic singularity of the elastic stress and the surface curvature at the edge of the self-contact.
Intermediate asymptote
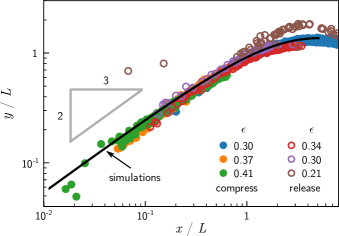
Contrarily, for , we expect capillary effects to play no role and hence, the problem should be described by a purely elastic solid mechanics. Then the crease length becomes the relevant scale, and the morphology of the free surface was predicted to exhibit the scaling karpitschka2017
| (2) |
where is the vertical coordinate of the contact line. This intermediate asymptote is expected to be valid whenever . Figure 3 shows the collapse of simulations and measurements for and various , and confirms the 2/3 exponent.
Folding-unfolding asymmetry
Elastocapillary (inner) and elastic (intermediate) regions can be collapsed simultaneously by choosing the appropriate scales and on each axis. The inner, elastocapillary morphology (1), requires to collapse the data. The scaling behavior of the intermediate region (2), requires . Both requirements are fulfilled simultaneously by choosing
| (3) |

In Figure 4, the original interface profiles (left panels) are shown next to the profiles as rescaled by the prediction (3) (right panels). The simulation data (top) almost collapse on a single curve, where the remaining difference can be attributed to the non-universal gauge pressure. The experimental data (bottom), by contrast, clusters into two groups. Filled symbols correspond to measurements after has been increased and form the upper master curve (folding). Open symbols correspond to measurements after has been decreased and form the lower master curve (unfolding).
The experiments show that the history of the crease is important for the observed morphology, even for where only the creased state is stable. The interface profiles observed during folding are manifestly different from the profiles during unfolding, the latter being more shallow. This asymmetry between folding and unfolding is not observed in the simulations. For a given set of parameters, the numerical minimisation of elastocapillary energy selects a unique crease morphology. Clearly, an element beyond equilibrium elastocapillary mechanics is required to properly interpret the experiments, which originates from contact line physics.
Contact line pinning
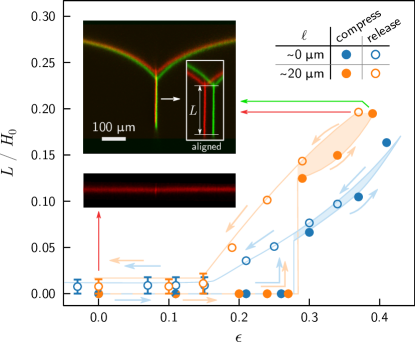
The difference in morphologies upon switching from compression to expansion is visualized in the inset of Figure 5. The green profile is taken during the compression phase, while the red profile is obtained after a subsequent release of strain. Clearly, the global indentation of the free surface decreased upon reducing , while the crease length remained identical up to the measurement resolution. This offers direct evidence for contact line pinning, where there is no “unfolding” at all, i.e. no change of material points at the contact line (cf. sketch in Figure 1 a).
In the present context, the morphological hysteresis readily impacts the crease length , which is no longer a pure function of the imposed strain . This is shown in Figure 5 (main plot), reporting versus . While bistability is well-known below the onset of creasing, we here find an additional bistability that is caused by contact line pinning: the shaded area shows that, even well above the onset of creasing, the crease length still exhibits a history dependence. After increasing , smaller are selected, rather than after decreasing , especially for (orange curve, same data as in Figure 4). For , the measurement error is comparable to the detected hysteresis, and no definitive statement on its existence can be made. Due to experimental limitations we can only give an upper bound for the scar length . However, the fact that this hysteresis loop becomes more pronounced for larger suggests a capillary origin of contact line pinning.
The observed contact line pinning is analogous to the wetting of liquids on solid surfaces BonnRevModPhys2009 . In that case, the motion of solid/liquid/vapor three-phase contact lines is arrested by pinning on heterogeneities of the solid surface. Such heterogeneities lead to a complicated energy landscape which allows for a range of stable liquid morphologies, leading to a range of contact angles. The pinning observed for creasing could be of similar origin as in wetting, where an energetic barrier is required to move the contact line across features of the surface topography. We therefore expect a range of mechanically stable crease lengths of the order of . This ultimately prevents complete unfolding: the remaining elastic energy is not sufficient to overcome this pinning-barrier. This explanation for scars is similar to that given in chen2012surface , which was phrased in terms of an energy release rate rather than . From our findings, however, is clear that the energy release rate for unfolding an adhesive crease cannot be given by the reversible work of self-adhesion, based on surface energies, as that would not offer a mechanism for contact line pinning. Indeed, our finite element simulations (with reversible adhesion) do not give a folding-unfolding asymmetry. They lack the new bistability indicated by the shaded areas in Figure 5, and do not admit any scars. To exclude the tracer particles as cause for the scars in our experiments, we also tested an uncoated specimen by brightfield reflection microscopy, finding the same behavior (see supplemental material suplmat ). Our explanation in terms of contact line pinning is also consistent with the observation of scar-annealing on long timescales cai2012elastomer ; chen2012surface : once again, this resembles the case of liquid wetting, where contact line pinning can indeed be overcome by thermal activation Rolley:PRL2007 ; Snoeijer:ARFM2013 ; Perrin:PRL2016 .
Outlook
Our confocal microscopy experiments have revealed an intrinsic folding-unfolding asymmetry, induced by contact line pinning, that offers a natural explanation for scars. Pinning is therefore a central element in creasing that needs to be accounted for in theory and simulations, and offers a way to articulate the role of “defects”. In addition, we have shown that surface tension dictates the mechanics at scales below the elastocapillary length, folding the solid into well-defined contact angles. As such, the crease morphology opens a new route to quantify solid-solid interfacial mechanics, in line with recent developments for solid-liquid interfaces Xu:NC2017 ; Andreotti:ARFM2020 . Understanding the interfacial micro-mechanics of soft materials unfolds their potential as programmable matter Hawkes:PNAS2010 , impacting for instance soft robotics Rus:N2015 , biomolecular patterning kim2009patterns , or smart textiles Persson:AM2018
Acknowledgements.
S.K. acknowledges funding from the German research foundation (DFG, project no. KA4747/2-1), and M.H.E. and J.H.S. from NWO through VICI Grant No. 680-47-632.References
- (1) A. N. Gent and I. S. Cho, “Surface instabilities in compressed or bent rubber blocks,” Rubber Chemistry and Technology, vol. 72, no. 2, pp. 253–262, 1999.
- (2) W. Hong, X. Zhao, and Z. Suo, “Formation of creases on the surfaces of elastomers and gels,” Applied Physics Letters, vol. 95, no. 11, p. 111901, 2009.
- (3) J. Dervaux and M. Ben Amar, “Mechanical instabilities of gels,” Annual Review of Condensed Matter Physics, vol. 3, no. 1, pp. 311–332, 2012.
- (4) T. Tallinen, J. Y. Chung, J. S. Biggins, and L. Mahadevan, “Gyrification from constrained cortical expansion,” Proceedings of the National Academy of Sciences, vol. 111, no. 35, pp. 12667–12672, 2014.
- (5) B. Mota and S. Herculano-Houzel, “Cortical folding scales universally with surface area and thickness, not number of neurons,” Science, vol. 349, no. 6243, pp. 74–77, 2015.
- (6) T. Tallinen, J. Y. Chung, F. Rousseau, N. Girard, J. Lefèvre, and L. Mahadevan, “On the growth and form of cortical convolutions,” Nature Physics, vol. 12, no. 6, pp. 588–593, 2016.
- (7) E. Karzbrun, A. Kshirsagar, S. R. Cohen, J. H. Hanna, and O. Reiner, “Human brain organoids on a chip reveal the physics of folding,” Nature Physics, vol. 14, no. 5, pp. 515–522, 2018.
- (8) J. Dervaux, Y. Couder, M.-A. Guedeau-Boudeville, and M. Ben Amar, “Shape transition in artificial tumors: From smooth buckles to singular creases,” Physical Review Letters, vol. 107, no. 1, p. 018103, 2011.
- (9) A. Onuki, “Theory of pattern formation in gels: Surface folding in highly compressible elastic bodies,” Physical Review A, vol. 39, no. 11, pp. 5932–5948, 1989.
- (10) H. Tanaka and T. Sigehuzi, “Surface-pattern evolution in a swelling gel under a geometrical constraint: Direct observation of fold structure and its coarsening dynamics,” Physical Review E, vol. 49, no. 1, pp. R39–R42, 1994.
- (11) V. Trujillo, J. Kim, and R. C. Hayward, “Creasing instability of surface-attached hydrogels,” Soft Matter, vol. 4, no. 3, pp. 564–569, 2008.
- (12) J. Kim, J. Yoon, and R. C. Hayward, “Dynamic display of biomolecular patterns through an elastic creasing instability of stimuli-responsive hydrogels,” Nature Materials, vol. 9, no. 2, pp. 159–164, 2009.
- (13) M. Ben Amar and P. Ciarletta, “Swelling instability of surface-attached gels as a model of soft tissue growth under geometric constraints,” Journal of the Mechanics and Physics of Solids, vol. 58, no. 7, pp. 935–954, 2010.
- (14) A. Ghatak and A. L. Das, “Kink instability of a highly deformable elastic cylinder,” Physical review letters, vol. 99, no. 7, p. 076101, 2007.
- (15) S. Mora, M. Abkarian, H. Tabuteau, and Y. Pomeau, “Surface instability of soft solids under strain,” Soft Matter, vol. 7, no. 22, p. 10612, 2011.
- (16) S. Cai, D. Chen, Z. Suo, and R. C. Hayward, “Creasing instability of elastomer films,” Soft Matter, vol. 8, no. 5, pp. 1301–1304, 2012.
- (17) J. Yoon, J. Kim, and R. C. Hayward, “Nucleation, growth, and hysteresis of surface creases on swelled polymer gels,” Soft Matter, vol. 6, no. 22, pp. 5807–5816, 2010.
- (18) D. Chen, S. Cai, Z. Suo, and R. C. Hayward, “Surface energy as a barrier to creasing of elastomer films: An elastic analogy to classical nucleation,” Physical review letters, vol. 109, no. 3, p. 038001, 2012.
- (19) S. Karpitschka, J. Eggers, A. Pandey, and J. H. Snoeijer, “Cusp-shaped elastic creases and furrows,” Physical review letters, vol. 119, no. 19, p. 198001, 2017.
- (20) P. Ciarletta, “Matched asymptotic solution for crease nucleation in soft solids,” Nature communications, vol. 9, no. 1, pp. 1–7, 2018.
- (21) P. Ciarletta and L. Truskinovsky, “Soft nucleation of an elastic crease,” Physical Review Letters, vol. 122, no. 24, p. 248001, 2019.
- (22) Q. Liu, T. Ouchi, L. Jin, R. Hayward, and Z. Suo, “Elastocapillary crease,” Physical review letters, vol. 122, no. 9, p. 098003, 2019.
- (23) E. Hohlfeld and L. Mahadevan, “Unfolding the sulcus,” Physical Review Letters, vol. 106, no. 10, p. 105702, 2011.
- (24) Supplementary material available at http://...
- (25) S. Karpitschka, L. van Wijngaarden, and J. H. Snoeijer, “Surface tension regularizes the crack singularity of adhesion,” Soft Matter, vol. 12, pp. 4463–4471, 2016.
- (26) Q. Xu, K. E. Jensen, R. Boltyanskiy, R. Sarfati, R. W. Style, and E. R. Dufresne, “Direct measurement of strain-dependent solid surface stress,” Nature Communications, vol. 8, pp. 1–6, sep 2017.
- (27) A. Pandey, B. Andreotti, S. Karpitschka, G. J. van Zwieten, E. H. van Brummelen, and J. H. Snoeijer, “Singular nature of the elastocapillary ridge,” Phys. Rev. X, vol. 10, no. 3, p. 031067, 2020.
- (28) M. Singh and A. C. Pipkin, “Note on ericksen’s problem,” Zeitschrift für angewandte Mathematik und Physik ZAMP, vol. 16, no. 5, pp. 706–709, 1965.
- (29) D. Bonn, J. Eggers, J. Indekeu, J. Meunier, and E. Rolley, “Wetting and spreading,” Rev. Mod. Phys., vol. 81, no. 2, pp. 739–805, 2009.
- (30) E. Rolley and C. Guthmann, “Dynamics and hysteresis of the contact line between liquid hydrogen and cesium substrates,” Physical Review Letters, vol. 98, no. 16, p. 166105, 2007.
- (31) J. H. Snoeijer and B. Andreotti, “Moving contact lines: Scales, regimes, and dynamical transitions,” Annual Review of Fluid Mechanics, vol. 45, no. 1, pp. 269–292, 2013.
- (32) H. Perrin, R. Lhermerout, K. Davitt, E. Rolley, and B. Andreotti, “Defects at the nanoscale impact contact line motion at all scales,” Physical Review Letters, vol. 116, no. 18, p. 184502, 2016.
- (33) B. Andreotti and J. H. Snoeijer, “Statics and dynamics of soft wetting,” Annual Review of Fluid Mechanics, vol. 52, no. 1, pp. 285–308, 2020.
- (34) E. Hawkes, B. An, N. M. Benbernou, H. Tanaka, S. Kim, E. D. Demaine, D. Rus, and R. J. Wood, “Programmable matter by folding,” Proceedings of the National Academy of Sciences, vol. 107, no. 28, pp. 12441–12445, 2010.
- (35) D. Rus and M. T. Tolley, “Design, fabrication and control of soft robots,” Nature, vol. 521, no. 7553, pp. 467–475, 2015.
- (36) N.-K. Persson, J. G. Martinez, Y. Zhong, A. Maziz, and E. W. H. Jager, “Actuating textiles: Next generation of smart textiles,” Advanced Materials Technologies, vol. 3, no. 10, p. 1700397, 2018.
- (37) M. Heil and A. Hazel, “oomph-lib – an object-oriented multi-physics finite-elementlibrary,” in Fluid-Structure Interaction (M. Schäfer and H.-J. Bungartz, eds.), pp. 19–49, Springer, 2006.
Supplemental Material
Appendix A Experimental
The stiff support layer was made of Zermack Elite Double 20 in a 1:1 ratio, resulting in a shear modulus of , which was two orders larger than the stiffness of the soft layer. The layer was cured in a oven at after degassing in vacuum. Then, the support layer was coated with fluorescent particles (Invitrogen FluoSpheres, orange fluorescent, diameter) at low coverage, to label the support-gel interface. Prior to applying the the soft layer, the support layer was clamped in a movable stage and stretched by .
The soft layer was made of a polydimethylsiloxane gel (Dow Corning CY52-276, components A and B) and was poured after degassing in vacuum onto the pre-stretched stiff layer. The sample was then heat-cured in an oven at for three hours. Two types of soft layers were prepared: a 1:1 mixing ratio of components A and B resulted in . A mixing ratio of 1.4:1 (A:B) resulted in . All moduli were measured with an Anton Paar MCR502 Rheometer and a parallel plate geometry. After curing, a layer of fluorescent tracer particles (Invitrogen FluoSpheres, orange fluorescent, diameter) was deposited onto the soft layer.
Two immersion liquids were used during the experiments: Wacker silicon oil was used for the measurements, whereas an index-matched water/glycerol mixture to obtain . Prior to measurement, the liquid was put onto the soft layer and covered by a large microscope cover slide to prevent evaporation and observation through a curved meniscus. The slide rested on small glass beads of 2 mm diameter to keep it separated from the sample.
An upright confocal microscope (Leica TCS-SP2) was used for imaging, operating with either a 10X or a 40X objective. Scanning volumes were (10X objective) and (40X objective), where the last number refers to the vertical axis.
We performed another experiment on a similar specimen, but without the tracer particles, using brightfield reflection microscopy, where the (residual) creases induce contrast by refraction at the gel surface. Figure S1 shows micrographs of scars and creases during the second compression, together with macro images of the specimen.
Appendix B Numerical methods
The numerical simulations of the adhesive crease are performed using the Finite Elements Method (FEM) library oomph-liboomph . These simulations are based on those in karpitschka2017 , with the addition of surface tension. A square slab of material of Lagrangian height and width is compressed in horizontal directions. The material is simulated using a refineable mesh of Neo-Hookean solid elements, refined according to a fixed refinement pattern. Around the self-contact, the the mesh resolution was finest () and increased toward the domain boundaries to . Non-dimensionalisation using the crease length allows us to probe the full range of solutions by variation of and only.
The bottom surface is constrained in the vertical direction and has a no-shear condition in the horizontal direction. The left edge of the material is constrained to the symmetry axis in horizontal direction, with a no strain (symmetry) condition in the vertical direction. Similarly, the right edge has a no-shear condition in vertical direction, but is constrained to a variable position horizontal direction to impose the global compression through Lagrange multipliers. The top surface is split into two parts: will be part of the self-contact, and will form the free surface. For details, we refer to karpitschka2017 . On the free surface the Laplace pressure is applied, with a contact angle of 90 degrees at either side. The self contact is subject to a no-shear condition in vertical direction, and is constrained to the symmetry axis by Lagrange multipliers.
A small cutout is made at the interface between the left boundary and the self contact, as detailed in karpitschka2017 , to avoid the stress singularity at the sharp fold singh1965note . Such a cutout cannot be used at the interface between the self-contact and the free surface, as the morphology of the free surface at this point is of particular interest. Therefore, the elements neighboring the singularity are formulated in polar coordinates around the contact line. In the vertical direction, the residual at the contact line is only controlled by surface tension and an imposed force that reflects any residual bulk elastic stresses. The latter force is an unknown of the problem, and determined in order to fulfill a bulk element with a angle at the contact line, ensuring a symmetry necessary to find a consistent solution Pandey:PRX2020 . This force scales approximately as for various mesh sizes and should hence be seen as a consequence of the finite resolution of a numerical simulation. Finally, the location of the right boundary is controlled by requiring a contact angle.