Orcid ID: 0000-0001-8326-9846
A polynomial in transverse momentum manifesting thermalisation in nuclear collisions
Abstract
A specific value of light front variable of the inclusively produced hadrons in a relativistic nuclear collision is constructed as a polynomial in transverse momentum of the particle within the UrQMD transport model. It is shown that those particles with the absolute value of their light front variable greater than the corresponding follow a Fermi-Dirac or Bose-Einstein distribution depending upon the spin of the particle.
The light front variables introduced by Dirac [1] can be written for the particles produced in a hadron-hadron or nucleus-nucleus collision in the following scale and Lorentz invariant form:
| (1) |
where, is the Mandelstam variable, is the z-component of the momentum and is the energy of the particle with the positive and negative signs corresponding to the two hemispheres [2, 3, 4, 5, 6]. A constant value of corresponds to a paraboloid in the phase space of the particles. It was observed in the earlier studies with the experimental data that a certain constant value of the light front variable denoted by can be used to select a group of particles that supposedly has reached thermal equilibrium [2, 3, 4, 5, 6]. In the work presented here, we show that the transverse momentum () dependence of the can be quantified to select a group of thermalised particles in a pseudorapidity region of in the phase space.
Fifty five thousand minimum bias Au-Au collisions are simulated at GeV using the Ultrarelativistic Quantum Molecular Dynamics (UrQMD-version 3.4) model of heavy ion collisions for this purpose [7, 8]. The distributions are made for , , , , and
with in different intervals. Taking in to account the constraints on and , these distributions are fitted with the following equation
| (2) |
while has the Fermi-Dirac form () for the baryons and Bose-Einstein form () for the mesons. The upper limit of the integral in Eq.(2) is given by
| (3) |
The lowest value of down to which the fit can be successfully performed is taken as for the range with which the distribution is made for. If the and polar angle distributions of the particles with can also be described with the respective form of , then is assigned as the constant for the range. If the does not follow this condition, then a larger value of is considered as the new and the procedure is repeated until a is found for the range of under consideration. A detailed analysis of the similar kind within a single range with a cut on can be seen in [9]. The procedure is repeated in several ranges for each of the species. From this analysis, an approximate polynomial relationship of the form
| (4) |
between and is constructed. Thus for a specific particle, we have a from Eq.(1) and a . from Eq.(4). In the next step, we make the distributions of those particles with their . The resulting distributions are found to be describable with the following equation
| (5) |
taking into account the kinematic constraints from and cuts. The upper limit of the integral in Eq.(5) is given by
| (6) |
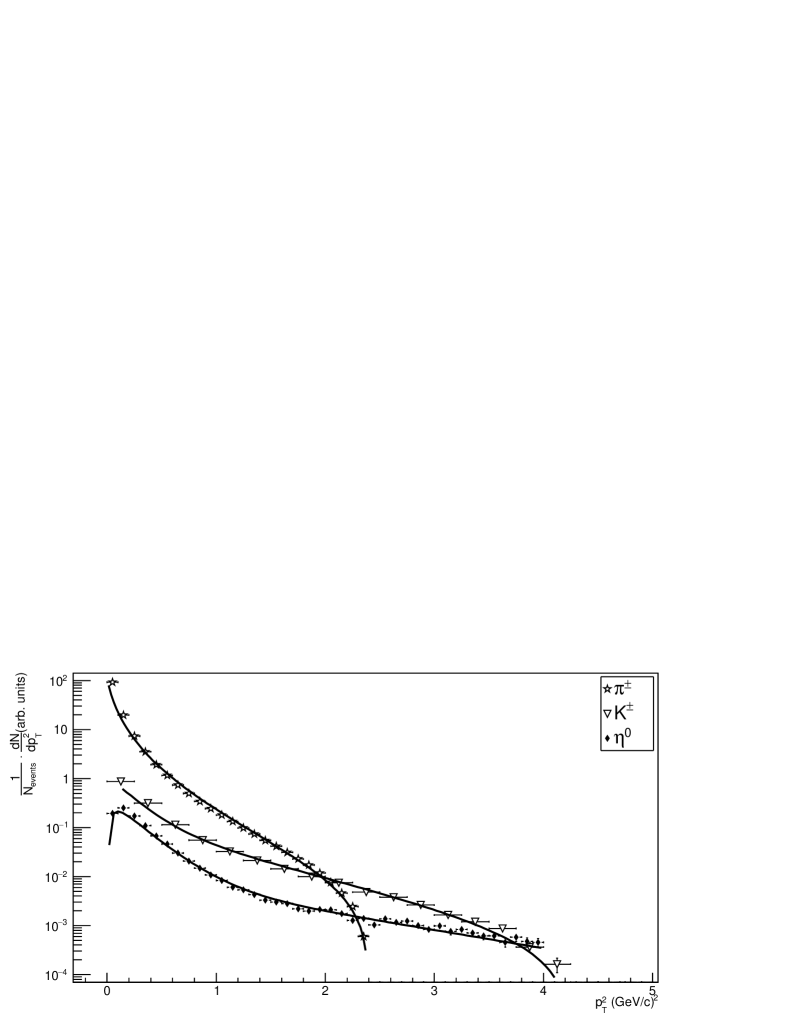
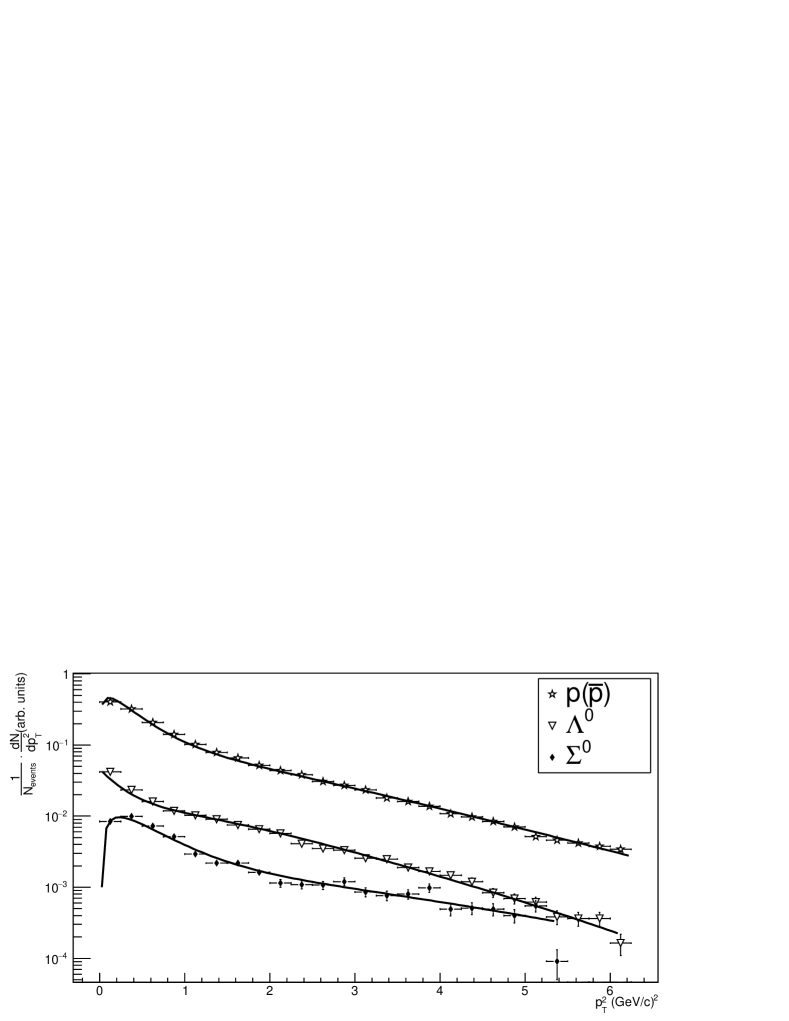
Note that the in Eq.(6) are the polynomials in Eq.(4) with the coefficients as given in TABLE 1 for various species. The temperatures obtained from the fit for various species of hadrons are reported in TABLE.1. The results of the fit for the distributions of mesons are shown in FIG. 1 and those for the baryons are shown in FIG. 2. The uncertainties in the distributions are statistical. ROOT (version- 6) software package [10] is used for making kinematical distributions from the simulated data, performing the integration and fitting.
| Species | T(MeV) | |||||
|---|---|---|---|---|---|---|
| - | - | 1704 | 10/22 | |||
| - | - | 1996 | 4/14 | |||
| - | - | 1852 | 40/38 | |||
| - | - | 2323 | 12/23 | |||
| - | 2194 | 10/22 | ||||
| - | - | 2335 | 20/19 |
It is therefore concluded that within the context of the UrQMD microscopic transport model of relativistic heavy-ion collisions, we can establish a polynomial in for a certain constant value of the light front variable which can select a thermalised group of inclusively produced hadrons. This effect establishes two paraboloids for a specific particle. One corresponding to the value of the particle and the second corresponding to the of the particle. Thus a grouping of thermalised particles is made depending upon the relative position of the two paraboloids in the phase space for a given particle. In this sense, the existence of in the phase space is analogous to the general theory of relativity where the observed dynamics is governed by geometrical entities. It also suggests that there exist a non-trivial integral relation between the transverse and longitudinal components of the momentum of these hadrons. The measured temperatures for the particles are larger than the Hagedorn temperature and lattice QCD predictions of temperatures about the phase transition [11, 12] which hints towards the possible existence of a deconfined state of quarks and gluons in the medium where the hadrons are emitted from. Hence this kind of analysis may be used to test the presence of a thermalised quark-gluon plasma in the heavy-ion collisions at RHIC and LHC from the maximum entropy principle itself. The exact reason for the origin of this effect in high energy nucleus-nucleus collisions, experimental verification and the extent of its profoundness has to be explored further. Performing the same analysis with experimental data at very high values of transverse momentum, carrying out the HBT interferometry, two-particle correlation and collectivity studies for the particles with and might be handy in this respect [13, 14, 15]. A similar analysis with the hadrons produced in hadron-hadron collisions at LHC might be helpful in better understanding the observed collectivity [16, 17] in such systems. The conclusions are drawn within the context of a phenomenological model and it is imperative to perform the analysis with the experimental data available at RHIC and LHC.
I would like to thank Prof. Marcus Bleicher (UrQMD collaboration) for the consent to use the UrQMD source code. I thank Dr Bharati Naik (IIT, Bombay), Prof. Kajari Mazumdar(TIFR, Mumbai), Dr Preeti Dhankher (University of California, Berkeley) and Dr Souvik Priyam Adhya (Charles University, Prague) for helping me with the computational resources.
References
- Dirac [1949] P. A. M. Dirac, Rev. Mod. Phys. 21, 392 (1949).
- Abesalashvili et al. [1978] L. N. Abesalashvili et al., JETP Lett. 28, 162 (1978).
- Abesalashvili et al. [1979] L. N. Abesalashvili et al., JETP Lett. 30, 448 (1979).
- Amaglobeli et al. [1999] N. S. Amaglobeli et al., Eur. Phys. J. C 8, 603 (1999).
- Djobava et al. [2003] T. Djobava et al., Phys. Part. Nucl. 34, 526 (2003).
- Chkhaidze et al. [2006] L. Chkhaidze et al. (Egypt, 2006) p. 548, proceedings of the Fifth Nuclear and Particle Physics Conference (NUPPAC-2005).
- Bass et al. [1998] S. Bass et al., Prog. Part. Nucl. Phys. 41, 255 (1998).
- Bleicher et al. [1999] M. Bleicher et al., J. Phys. G: Nucl. Part. Phys. 25, 1859 (1999).
- Nair [2021] R. R. Nair, A feasibility study of the light front analysis of ultrarelativistic nuclear collisions in ALICE at LHC (2021), arXiv:2103.04932 [hep-ph] .
- Brun and Rademakers [1997] R. Brun and F. Rademakers, Nucl. Inst. and Meth. in Phys. Res. A 389, 81 (1997), new Computing Techniques in Physics Research V.
- Gaździcki and Gorenstein [2016] M. Gaździcki and M. I. Gorenstein, Hagedorn’s hadron mass spectrum and the onset of deconfinement, in Melting Hadrons, Boiling Quarks - From Hagedorn Temperature to Ultra-Relativistic Heavy-Ion Collisions at CERN: With a Tribute to Rolf Hagedorn, edited by J. Rafelski (Springer International Publishing, Cham, 2016) pp. 87–92.
- Ratti [2018] C. Ratti, Reports on Progress in Physics 81, 084301 (2018).
- Heinz and Jacak [1999] U. Heinz and B. V. Jacak, Annu. Rev. Nucl. Part. Sci. 49, 529 (1999).
- Wiedemann and Heinz [1999] U. A. Wiedemann and U. W. Heinz, Phys. Rept. 319, 145 (1999), arXiv:nucl-th/9901094 .
- Heinz and Snellings [2013] U. Heinz and R. Snellings, Annu. Rev. Nucl. Part. Sci. 63, 123 (2013).
- Nagle and Zajc [2018] J. L. Nagle and W. A. Zajc, Annu. Rev. Nucl. Part. Sci. 68, 211 (2018).
- Bhalerao [2020] R. S. Bhalerao, Collectivity in large and small systems formed in ultrarelativistic collisions (2020), arXiv:2009.09586 [nucl-th] .