The bursty origin of the Milky Way thick disc
Abstract
We investigate thin and thick stellar disc formation in Milky-Way-mass galaxies using twelve FIRE-2 cosmological zoom-in simulations. All simulated galaxies experience an early period of bursty star formation that transitions to a late-time steady phase of near-constant star formation. Stars formed during the late-time steady phase have more circular orbits and thin-disc-like morphology at , whilst stars born during the bursty phase have more radial orbits and thick-disc structure. The median age of thick-disc stars at correlates strongly with this transition time. We also find that galaxies with an earlier transition from bursty to steady star formation have a higher thin-disc fractions at . Three of our systems have minor mergers with LMC-size satellites during the thin-disc phase. These mergers trigger short starbursts but do not destroy the thin disc nor alter broad trends between the star formation transition time and thin/thick disc properties. If our simulations are representative of the Universe, then stellar archaeological studies of the Milky Way (or M31) provide a window into past star-formation modes in the Galaxy. Current age estimates of the Galactic thick disc would suggest that the Milky Way transitioned from bursty to steady phase 6.5 Gyr ago; prior to that time the Milky Way likely lacked a recognisable thin disc.
keywords:
methods: numerical – galaxies: disc – galaxies: formation – galaxies: evolution – galaxies: star formation1 Introduction
Milky-Way-mass disc galaxies in the local Universe, including our own, are often characterised by a thin disc component embedded within a thicker disc, which accounts for 1015% of total disc luminosity (van der Kruit & Freeman, 2011). The Milky Way itself has a distribution of disc stars that can be decomposed into thin and thick components spatially (Gilmore & Reid, 1983; Jurić et al., 2008; Bensby et al., 2011; Bovy & Rix, 2013), though there does not appear to be a bi-modality that defines a clearly distinct thick disc in the Milky Way in terms of age or chemical abundance (Bovy et al., 2012; Hayden et al., 2015). Whether the there are two distinct components or not, we can use the qualitative terms "thick disc" and "thin disc" as a shorthand classification, one that helps us compare and contrast stars with more eccentric orbits that take them farther from the disc plane to those with more circular orbits that align tightly within it.
In the Milky Way today, the thin disc is home to recent star formation. Thicker-disc stars tend to be older, more metal poor, and more alpha-enhanced (Fuhrmann, 1998; Haywood et al., 2013; Recio-Blanco et al., 2014; Hayden et al., 2015; Mackereth et al., 2017; Hayden et al., 2017; Sharma et al., 2019). These characteristics may be loosely interpreted as evidence that thick disc stars formed early and rapidly, perhaps in a series of bursts (e.g. van der Kruit & Freeman, 2011). Snaith et al. (2014) use elemental abundances of long-lived stars to derive a star-formation history for a selection of old, alpha-enhanced stars they associate with the Milky Way thick disc. They conclude that these stars emerged during an early, elevated period of star formation – and that the Galactic thick disc may be comparable in mass (not luminosity) to the young (< 8 Gyr old) thin disc.
Despite years of study, an understanding of how thick and thin discs arise within the broader story of galaxy formation remains a key question. One of the most enduring ideas is that pre-existing thin discs are heated in mergers with small satellite galaxies to create a vertically extended component (Quinn et al., 1993; Kazantzidis et al., 2008; Purcell et al., 2009). In fact, the phase-space structure of stars in the solar neighborhood provides some evidence that such a event – the Gaia-Enceladus Sausage merger – may have been significant enough to heat a proto Milky Way disc, under the assumption that a thin disc existed at this early time (Belokurov et al., 2018; Helmi et al., 2018). However, as hinted above, the chemical abundance structure of the Milky Way disfavours the idea that thick-disc formation is associated with a single discrete event (Freudenburg et al., 2017). Rather, these data favour an “upside down” formation scenario – first predicted by cosmological simulations (Brook et al., 2004, 2006; Brook et al., 2012; Bird et al., 2013) – where stars are born in relatively thick discs at early times, and only later form in thin discs.
Many recent cosmological simulations naturally produce discs with young stars concentrated in a thinner component than old stars (e.g. Ma et al., 2017b; Navarro et al., 2018; Grand et al., 2018; Pillepich et al., 2019; Bird et al., 2021; Park et al., 2020). These same simulations at high redshift produce discs that are systematically thicker and clumpier than those at low redshift, as observed in nearly all deep, high-resolution imaging studies of galaxies (Elmegreen & Elmegreen, 2006; Elmegreen et al., 2007; Shapiro et al., 2008; Genzel et al., 2008; Overzier et al., 2010; Elmegreen et al., 2017). The observed transition from thick irregular galaxies at high redshift to thin rotation-dominated discs at low redshift is well established, and often referred to as “disc settling” (Kassin et al., 2012).
| Simulation | thick disc | thick disc | Reference | ||||||||
|---|---|---|---|---|---|---|---|---|---|---|---|
| Name | [kpc] | [kpc] | [Gyr] | ( weighted) | ( weighted) | [Gyr] | [Gyr] | ||||
| Romeo | 7.41010 | 13.3 | 1.01012 | 317 | 3500 | 6.52 | 0.45 | 0.70 | 8.96 | 6.16 | A |
| m12b* | 8.11010 | 9.8 | 1.11012 | 335 | 7070 | 6.32 | 0.37 | 0.64 | 7.34 | 2.72 | A |
| Remus | 5.11010 | 12.3 | 9.71012 | 320 | 4000 | 5.88 | 0.36 | 0.62 | 8.22 | 4.88 | B |
| Louise | 2.91010 | 12.0 | 8.51011 | 310 | 4000 | 5.56 | 0.32 | 0.65 | 8.11 | 4.06 | A |
| m12f* | 8.61010 | 11.0 | 1.31012 | 355 | 7070 | 5.01 | 0.38 | 0.65 | 6.28 | 2.62 | C |
| Romulus | 1.01011 | 14.2 | 1.51012 | 375 | 4000 | 4.90 | 0.37 | 0.69 | 7.37 | 4.92 | B |
| Juliet | 4.21010 | 9.6 | 8.51011 | 302 | 3500 | 4.40 | 0.30 | 0.62 | 6.74 | 4.66 | A |
| m12m | 1.11011 | 11.3 | 1.21012 | 342 | 7070 | 3.81 | 0.34 | 0.58 | 6.07 | 3.24 | E |
| m12c* | 6.01010 | 9.7 | 1.11012 | 328 | 7070 | 3.70 | 0.32 | 0.62 | 5.39 | 2.30 | A |
| m12i | 6.41010 | 9.2 | 9.01011 | 314 | 7070 | 3.14 | 0.32 | 0.59 | 6.18 | 3.50 | D |
| Thelma* | 7.91010 | 12.4 | 1.11012 | 332 | 4000 | 2.57 | 0.27 | 0.57 | 4.73 | 1.95 | A |
| m12w | 5.81010 | 8.7 | 8.31011 | 301 | 7070 | 0.0 | 0.24 | 0.43 | 4.38 | 1.13 | F |
Whilst upside-down disc formation is seen regularly in simulations, the physical origin of this thick-to-thin transition has been hard to distill. One idea is that discs are born thick during an early period of gas-rich mergers (Brook et al., 2004). At high redshift, high star-formation rate densities, high gas fractions, and feedback-induced turbulence can also contribute to an initially hot disc (Lehnert et al., 2014). An alternative possibility is that stars are initially born in thin discs, but are quickly and continuously heated owing to chaotic accretion of gas (Meng & Gnedin, 2021). In some simulations, most stars are born kinematically hotter at early times and subsequently heated after birth on a short timescale (Ma et al., 2017b; Bird et al., 2021).
In this paper, we explore the transition from thick to thin disc formation in twelve Milky-way-mass galaxies drawn from FIRE-2 cosmological zoom-in simulations. As seen in previous work (Brook et al., 2004; Bird et al., 2013; Ma et al., 2017b; Navarro et al., 2018; Bird et al., 2021; Park et al., 2020), our discs tend to form upside down, with the thick discs in place early and the thin disc forming at late times. One new finding in our work is that the transition from thick to thin-disc formation correlates with a transition in star formation mode, from an early, elevated bursty phase with highly time-variable star formation rate, to a late-time steady phase of near-constant star formation rate. Thin-disc stars tend to be born during the late-time steady phase, whilst thick-disc stars are associated with the latter part of the bursty phase. Galaxies with older thick-disc populations have an earlier transition from bursty to steady star formation. The earlier the transition time, the more dominant the thin disc is at .
A transition from bursty to steady star formation has been reported previously in the FIRE simulations, at in Milky-Way-mass haloes (Muratov et al., 2015; Sparre et al., 2017; Anglés-Alcázar et al., 2017a, b; Faucher-Giguère, 2018). In particular, Stern et al. (2020) show that the transition to steady star formation coincides with the virialisation of the inner circumgalactic medium (CGM). Specifically, when haloes in FIRE cross a characteristic mass scale ( M⊙), the cooling time of shocked gas in the inner halo ( Rvir) exceeds the local free-fall time. This creates a hot confining medium, with high and nearly uniform thermal pressure. After this time, Stern et al. (2020) observes that star formation becomes less bursty and gaseous discs become more rotationally supported. This steady, settled disc phase may be enabled by the hot, pressurised inner CGM itself, which may prevent supernova-driven outflows from repeatedly blowing out the interstellar medium (ISM) in a way that would otherwise might perturb disc structure (e.g. Martizzi, 2020).
Of particular relevance is work by Ma et al. (2017b), who used a slightly lower resolution FIRE-1 zoom-in simulation to show that disc stars at large scale-height (thick disc stars) form primarily during an early chaotic bursty mode, whilst younger stars were formed in a more stable disc. In what follows, we perform a more systematic analysis using a larger, higher resolution sample of FIRE-2 haloes and confirm that this result is more general. This motivates us to suggest that the physical transition from bursty to steady star formation also coincides with a shift from thick-disc to thin-disc formation in Milky-Way-mass galaxies. If this is true in the real Universe, then stellar archaeological studies of the Milky Way could provide a window into past star-formation modes, as well as the build-up of the Galactic CGM.
Below we elect to define thick and thin disc populations using a purely kinematic definition based on each star particle’s circularity (Abadi et al., 2003). Whilst it is common in Milky Way studies to use elemental abundances to divide thin and thick disc populations, we adopt this kinematic definition in order to fully decouple our selection from the nature of star formation. Specifically, alpha enhancement correlates with starburst activities, so we would like to avoid using abundance ratios when looking for distinct correlations related to star formation history. The fact that we find correlations between kinetically-defined thick-disc populations and the mode of star formation suggests that the correlation between thick disc formation and star formation activity is non-trivial. Moreover, the previous work by Ma et al. (2017b) finds qualitatively similar results using more traditional observationally-oriented definitions of the thick disc based on a vertical density profile, suggesting that the result is insensitive to selection choices.
The outline of this manuscript is as follows. In Section 2 we provide an overview of our simulations and present our kinematic definition of thin and thick disc stars. Section 3 presents results focusing for two illustrative cases (3.1) and then on to explore general trends for all galaxies in our sample (3.3). We conclude and discuss our results in the context of the Milky Way in Section 4.
2 Simulations and methods
2.1 FIRE-2 simulations of Milky-Way-mass galaxies
Our analysis utilises cosmological zoom-in simulations performed with the multi-method gravity plus hydrodynamics code GIZMO (Hopkins, 2015) from the Feedback In Realistic Environments (FIRE) project111https://fire.northwestern.edu/. We rely on the FIRE-2 feedback implementation (Hopkins et al., 2018) and the mesh-free Lagrangian Godunov (MFM) method. The MFM approach provides adaptive spatial resolution and maintains conservation of mass, energy, and momentum. FIRE-2 includes radiative heating and cooling for gas across a temperature range of K. Heating sources include an ionising background (Faucher-Giguère et al., 2009), stellar feedback from OB stars, AGB mass-loss, type Ia and type II supernovae, photoelectric heating, and radiation pressure – with inputs taken directly from stellar evolution models. The simulations self-consistently generate and track 11 elemental abundances (H, HE, C, N, O, Ne, Mg, Si, S, Ca, and Fe), and include sub-grid diffusion of these elements in gas via turbulence (Hopkins, 2016; Su et al., 2017; Escala et al., 2018). Star formation occurs in gas that is locally self-gravitating, sufficiently dense ( cm-3), Jeans unstable and molecular (following Krumholz & Gnedin 2011). Locally, star formation efficiency is set to per free-fall time; i.e., . Gas particles are converted to stars at this rate stochastically (Katz et al., 1996). Note that this does not imply that the global efficiency of star formation is within a giant-molecular cloud (or across larger scales). Self-regulated feedback limits star formation to 1-10% per free-fall time (Faucher-Giguère et al., 2009; Hopkins, 2017; Orr et al., 2018).
In this work, we analyse 12 Milky-Way-mass galaxies (Table 1). These zoom simulations are initialised following Oñorbe et al. (2014). Six of these galaxies (with names following the convention m12*) are isolated and part of the Latte suite (Wetzel et al., 2016; Garrison-Kimmel et al., 2017; Hopkins, 2017; Garrison-Kimmel et al., 2019a). Six, with names associated with famous duos (e.g. Romeo and Juliet), are part of the ELVIS on FIRE project (Garrison-Kimmel et al., 2019a, b) and are set in Local-Group-like configurations, as in the ELVIS suite (Garrison-Kimmel et al., 2014). This suite includes three simulations, containing two MW/M31-mass galaxies each. The main haloes were selected so that they have similar relative separations and velocities as of the MW-M31 pair in the Local Group (LG). Table 1 lists the initial baryonic particle masses for each simulation. Latte gas and star particles have initial masses of , whilst ELVIS on FIRE has better mass resolution (). Gas softening lengths are fully adaptive down to 0.51 pc. Star particle softening lengths are 4 pc physical and a dark matter force softening is 40 pc physical.
2.2 Defining thin and thick discs
There are multiple ways to separate a “thick disc” from a “thin disc” population in observations (Martig et al., 2016). The physical characteristics authors use to define the thick disc include geometric morphology, kinematics, chemical abundances, and age. The geometric/morphological definition is the natural choice for distant galaxies, where detailed chemical and/or age information is harder to extract. In this theoretical analysis, we adopt a simple kinematic definition that allows us to identify thin and thick disc populations cleanly, and which also produces disc populations that follow the qualitative geometric expectations for thin and thick discs. We elect to avoid definitions based on chemical-enrichment history because we are exploring correlations with star-formation burstiness, and we opt to avoid any selection effects such a choice might impose.
Our categorisation is based on each star particle’s circularity, , defined as the ratio of each particle’s angular momentum to that of a circular orbit with the same energy (Abadi et al., 2003). The angular momentum direction is set by total stellar angular momentum within kpc of each galaxy’s center. We categorise star particles with as thin disc stars, and those with as thick disc stars. Our classification is motivated by past explorations (e.g. Abadi et al., 2003; Okamoto et al., 2010; Knebe et al., 2013), which find that circularity correlates well with standard morphological definitions of thin and thick disc populations.
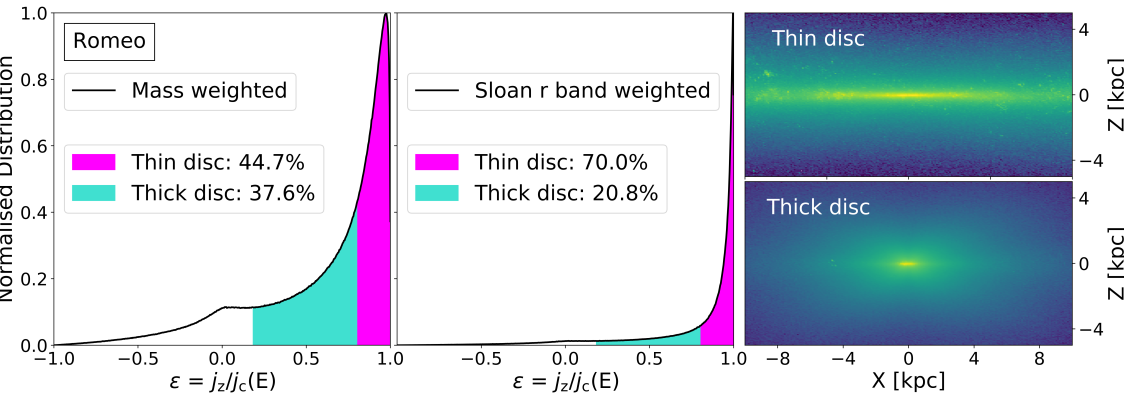
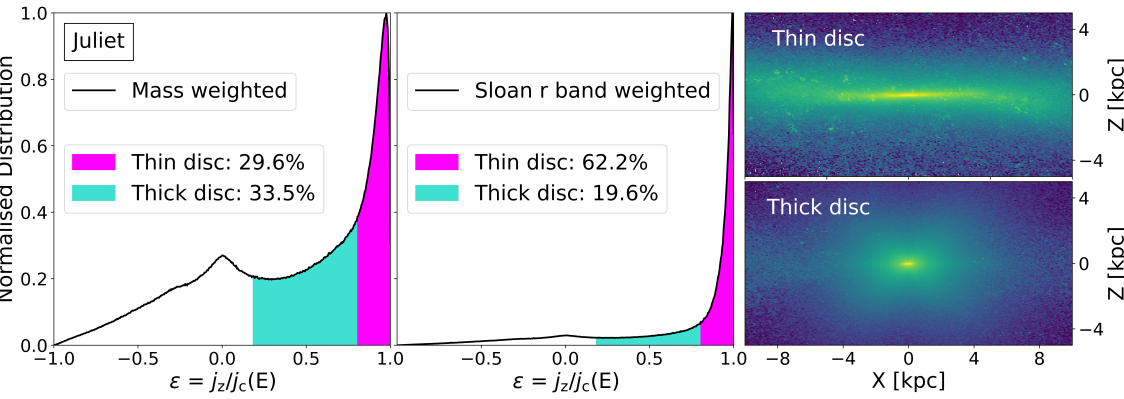
The left and middle panels of Figure 1 illustrate our circularity-based definitions for two specific simulations: Romeo (top) and Juliet (bottom). The left panels show the mass-weighted circularity distributions and the middle panels show the luminosity-weighted circularity distributions for each galaxy. By our definitions, the magenta regions correspond to thin-disc stars, whilst the cyan regions correspond to thick-disc stars. Note that whilst the mass-weighted distributions yield approximately equal thin and thick disc populations, the luminosity-weighted distributions assign 6070% to the thin disc. The right panels show luminosity-weighted images of the thin and thick disc populations for each galaxy, which illustrate that our orbit-based definitions yield spatial distributions that look qualitatively like discs that are indeed thin and thick.
We find that our -based classification scheme results in thin and thick disc populations with vertical density profiles (in the direction) resembling those of traditional morphologically identified thin and thick discs. Whilst some of our galaxies have vertical profiles better fit by exponential forms, the majority prefers fits. At mock solar locations (8 kpc from the galactic centre), fits to the resultant thin-disc populations yield scale heights for our 12 galaxies that range from 250 pc to 800 pc for luminosity-density profiles (in Sloan r band); and from 500 pc to 950 pc for mass-density profiles. Similar fits to our thick-disc populations have scale heights that range from 1.21.5 kpc for luminosity-density profiles. These results are consistent with previous analysis (e.g. Ma et al., 2017b; Sanderson et al., 2020). We find that dividing populations in this manner yields scale-height results in line with those we obtain with more traditional (purely spatially-based) two-component fits. We also find that our simple -based classification yields thick disc populations that are older, more metal poor, and more alpha enhanced than the thin discs we identify.
We note that there can be a non-trivial fraction of stars that exist at very low or negative circularities (), which would naturally be associated with a spheroidal component. For example, in Figure 1, for Romeo (Juliet), this component represents 17% (37%) of the mass and 6.8% (13%) of the light. We generally find that these spheroidal stars tend to form in the earliest periods of galaxy assembly, whilst thick-disc stars form later. Since the focus of this paper is on thin/thick disc formation, we have largely ignored low/negative angular momentum stars in what follows, though further investigation into the origin of the inner spheroid as it relates to star formation in the early galaxy is warranted. Such an exploration would require a more sophisticated kinematic disc/spheroidal classifications of stars with overlapping ranges. We have performed a simple check of the sensitivity of our main results to the presence of bulge stars by neglecting all stars that sit within 1 kpc of the galactic center of each galaxy and find that this does not change our results substantially. The fraction of stars that have and that sit within 1 kpc is relatively small in all of our galaxies and, when either excluded or included, have only a minor effect on the age distributions of our "thick disc" stars.
3 Results
3.1 Two Illustrative Cases: Romeo and Juliet
3.1.1 Bursty phase, steady phase, and age distributions
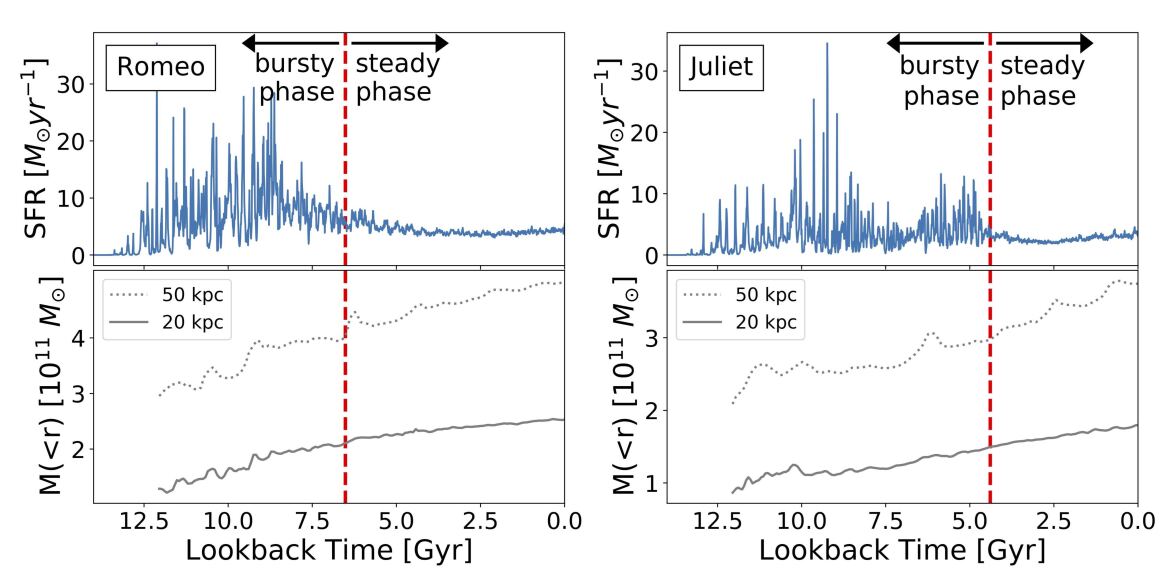
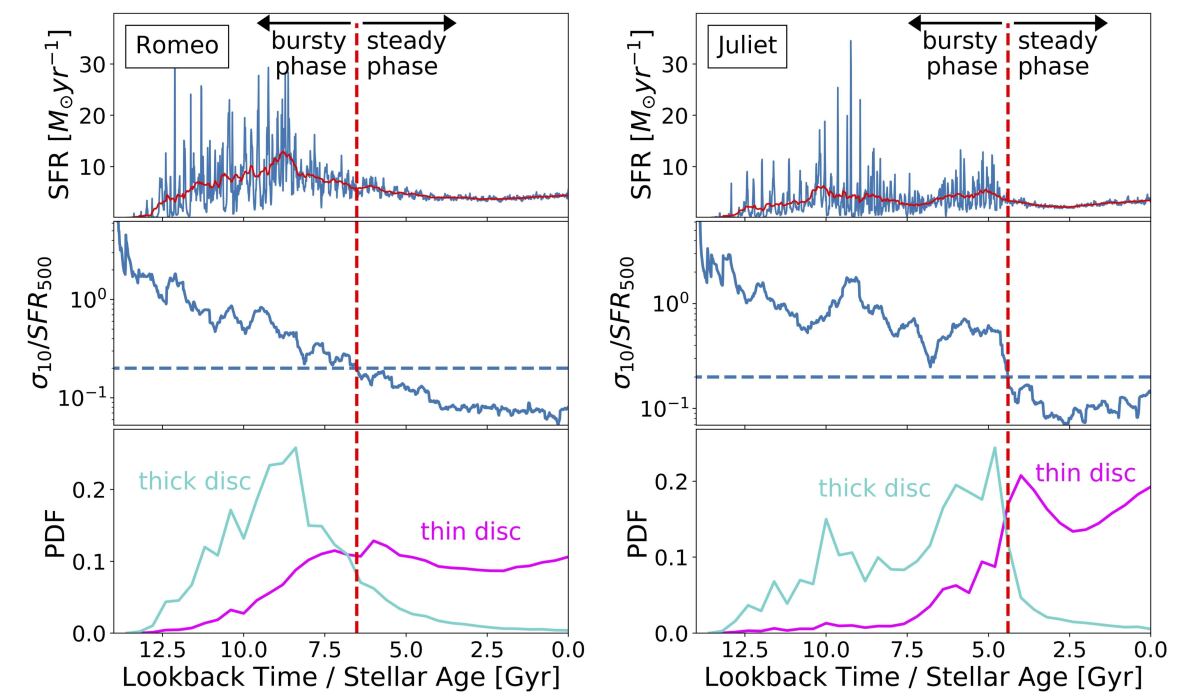
The top panels in Figure 2 show the star formation histories of Romeo (left) and Juliet (right) as a function of lookback time. The star formation rate 222These star formation histories are measured for all particles that were born within 20 kpc of the most massive progenitor. (SFR) displayed is averaged over both a short timescale of Myr (SFR10, blue) and a longer timescale of Myr (SFR500, red). The middle panel shows the variance in “instantaneous” SFR, , divided by the average SFR500 as a function of lookback time. We define as the variance in SFR10 over a time range spanning Myr. We see that the relative variance is much larger at early times than at late times, consistent with previous studies (e.g. Stern et al., 2020; Flores Velázquez et al., 2021) that have shown that star formation in massive FIRE-2 galaxies tends to transition from bursty to steady as we approach the present day.
While the transition from bursty to steady is not always sharp, the trend is quasi-monotonic, with the the ratio SFR500 generally decreasing with time. For the sake of simplicity in this analysis, we find it useful to divide the star formation history of each galaxy into two distinct phases: an early bursty phase and a late-time steady phase. We define the bursty phase to end at a lookback time when the variance in “instantaneous” star-formation rate first falls below times the time-averaged star formation rate:
| (1) |
We use this definition to assign a specific bursty-phase timescale to each galaxy’s star formation history. Our qualitative results are not sensitive to the precise choice of on the right-hand side of Equation 1. Larger choices () tend to push the bursty phase slightly earlier and smaller choices () tend to push the burst phase slightly later. By our adopted definition, Romeo has a bursty-phase lookback time of Gyr and Juliet has a bursty phase that ends more recently at Gyr. The vertical, red-dashed lines in Figure 2 mark these times. Table 1 provides bursty-phase lookback times for our simulated galaxies.
The bottom panels in Figure 2 show the age distributions of thick-disc stars (cyan) and thin-disc stars (magenta). Thick-disc ages tend to track the bursty-phase star formation, whilst the thin disc stars closely track the steady phase in each case. We emphasize again that in defining a specific value for we do not mean to suggest that there is always a razor-sharp phase-change in star formation activity (or in disc thickness) but rather to assign a specific timescale to each galaxy that reasonably marks a qualitative transition. We note that age-overlap of thick and thin disc stars in Romeo is much more significant than it is in Juliet. This mirrors the more gradual decrease in relative SFR variance in Romeo, compared to the sharp transition near seen in Juliet. Nevertheless, the broad tendency for typical thick disc stellar ages to correlate with bursty-phase lookback times is seen for every galaxy in our sample (as we show in Section 3.3 below).
3.1.2 Morphology with time
Figure 3 and 4 show images of Romeo and Juliet at three specific times in the past: 8.4, 4.7, and 2.7 Gyr ago, which also illustrate how stars that formed at these epochs are spatially distributed today. The top row (a) shows the star formation rate versus time. The arrow symbols on the time axis indicate the specific lookback times visualized beneath. Row (b) shows luminosity-weighted images of the main progenitor of each galaxy at the specified times. Each snapshot is viewed edge-on with respect to the stellar angular momentum axis at that time. Row (c) includes images of the young stellar populations, corresponding to stars born within the last 100 Myr of the indicated times. Lastly, row (d) shows the current location () of the young stars shown in (c). Note that rows (c) and (d) are similar to Figure 1 in Ma et al. (2017b).
Figure 3 shows that, Gyr ago (prior to the end of the bursty phase) Romeo resembled a thick disc embedded within a significant spheroid. The stars forming at this time (panel c, far left) are not very well ordered into a thin disc, but do exhibit some coherence. Those stars today are arranged in a thick-disc like configuration (d, far left). Conversely, at Gyr and Gyr (after the steady phase has commenced) Romeo’s thin disc has fully emerged. Young stars at those times are situated in thin discs (c, middle and right) and remain in relatively thin configurations at (d, middle and right).
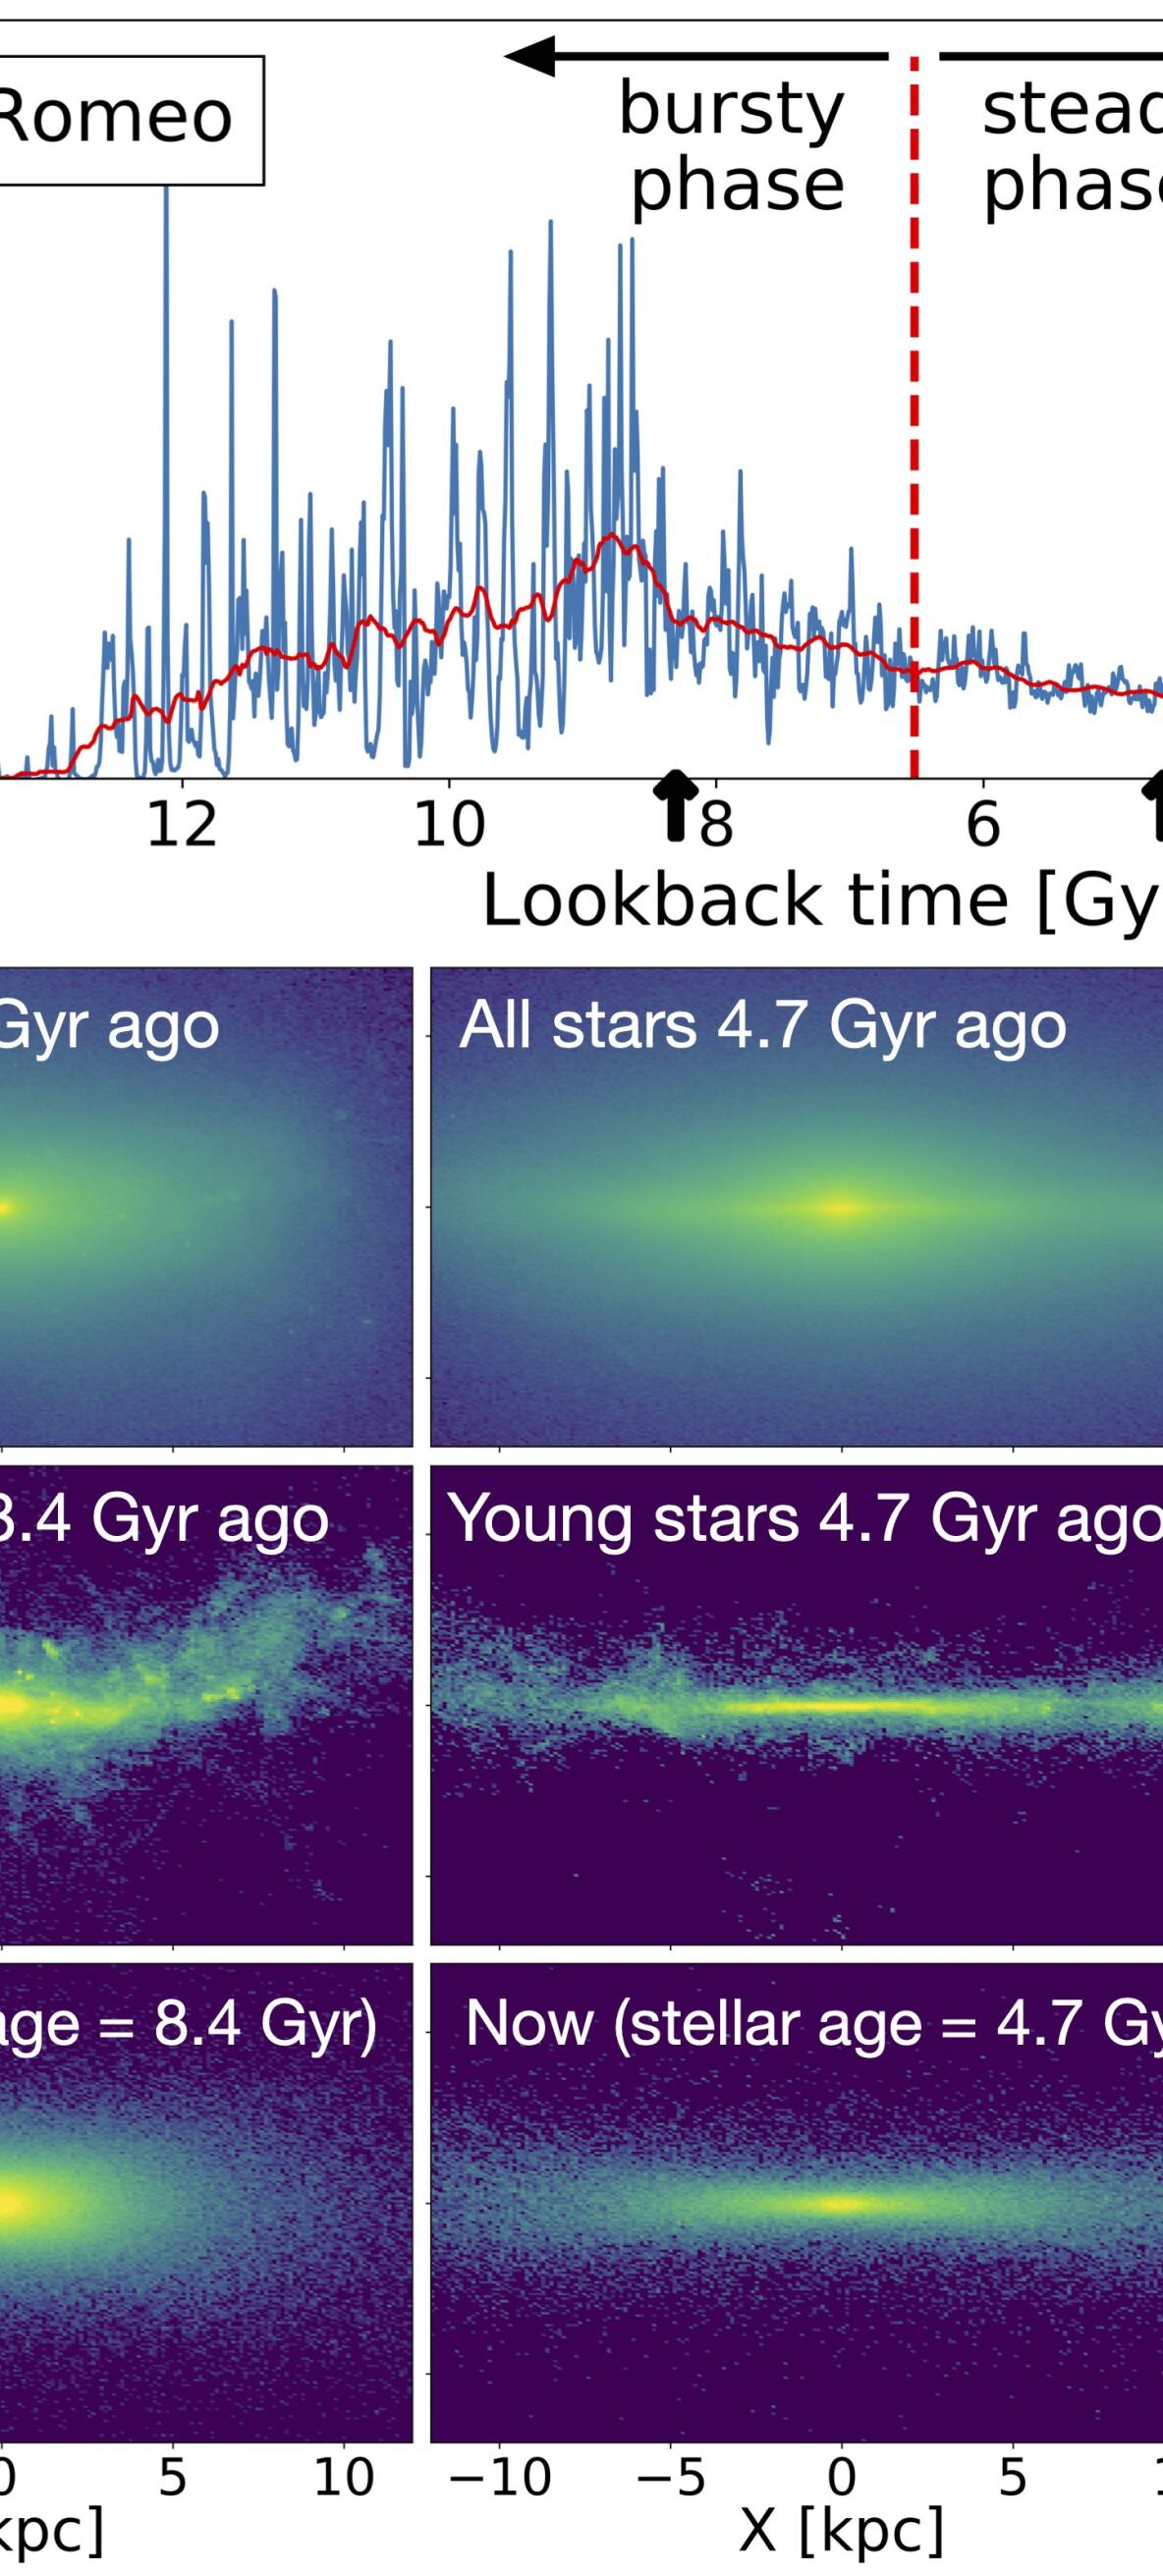
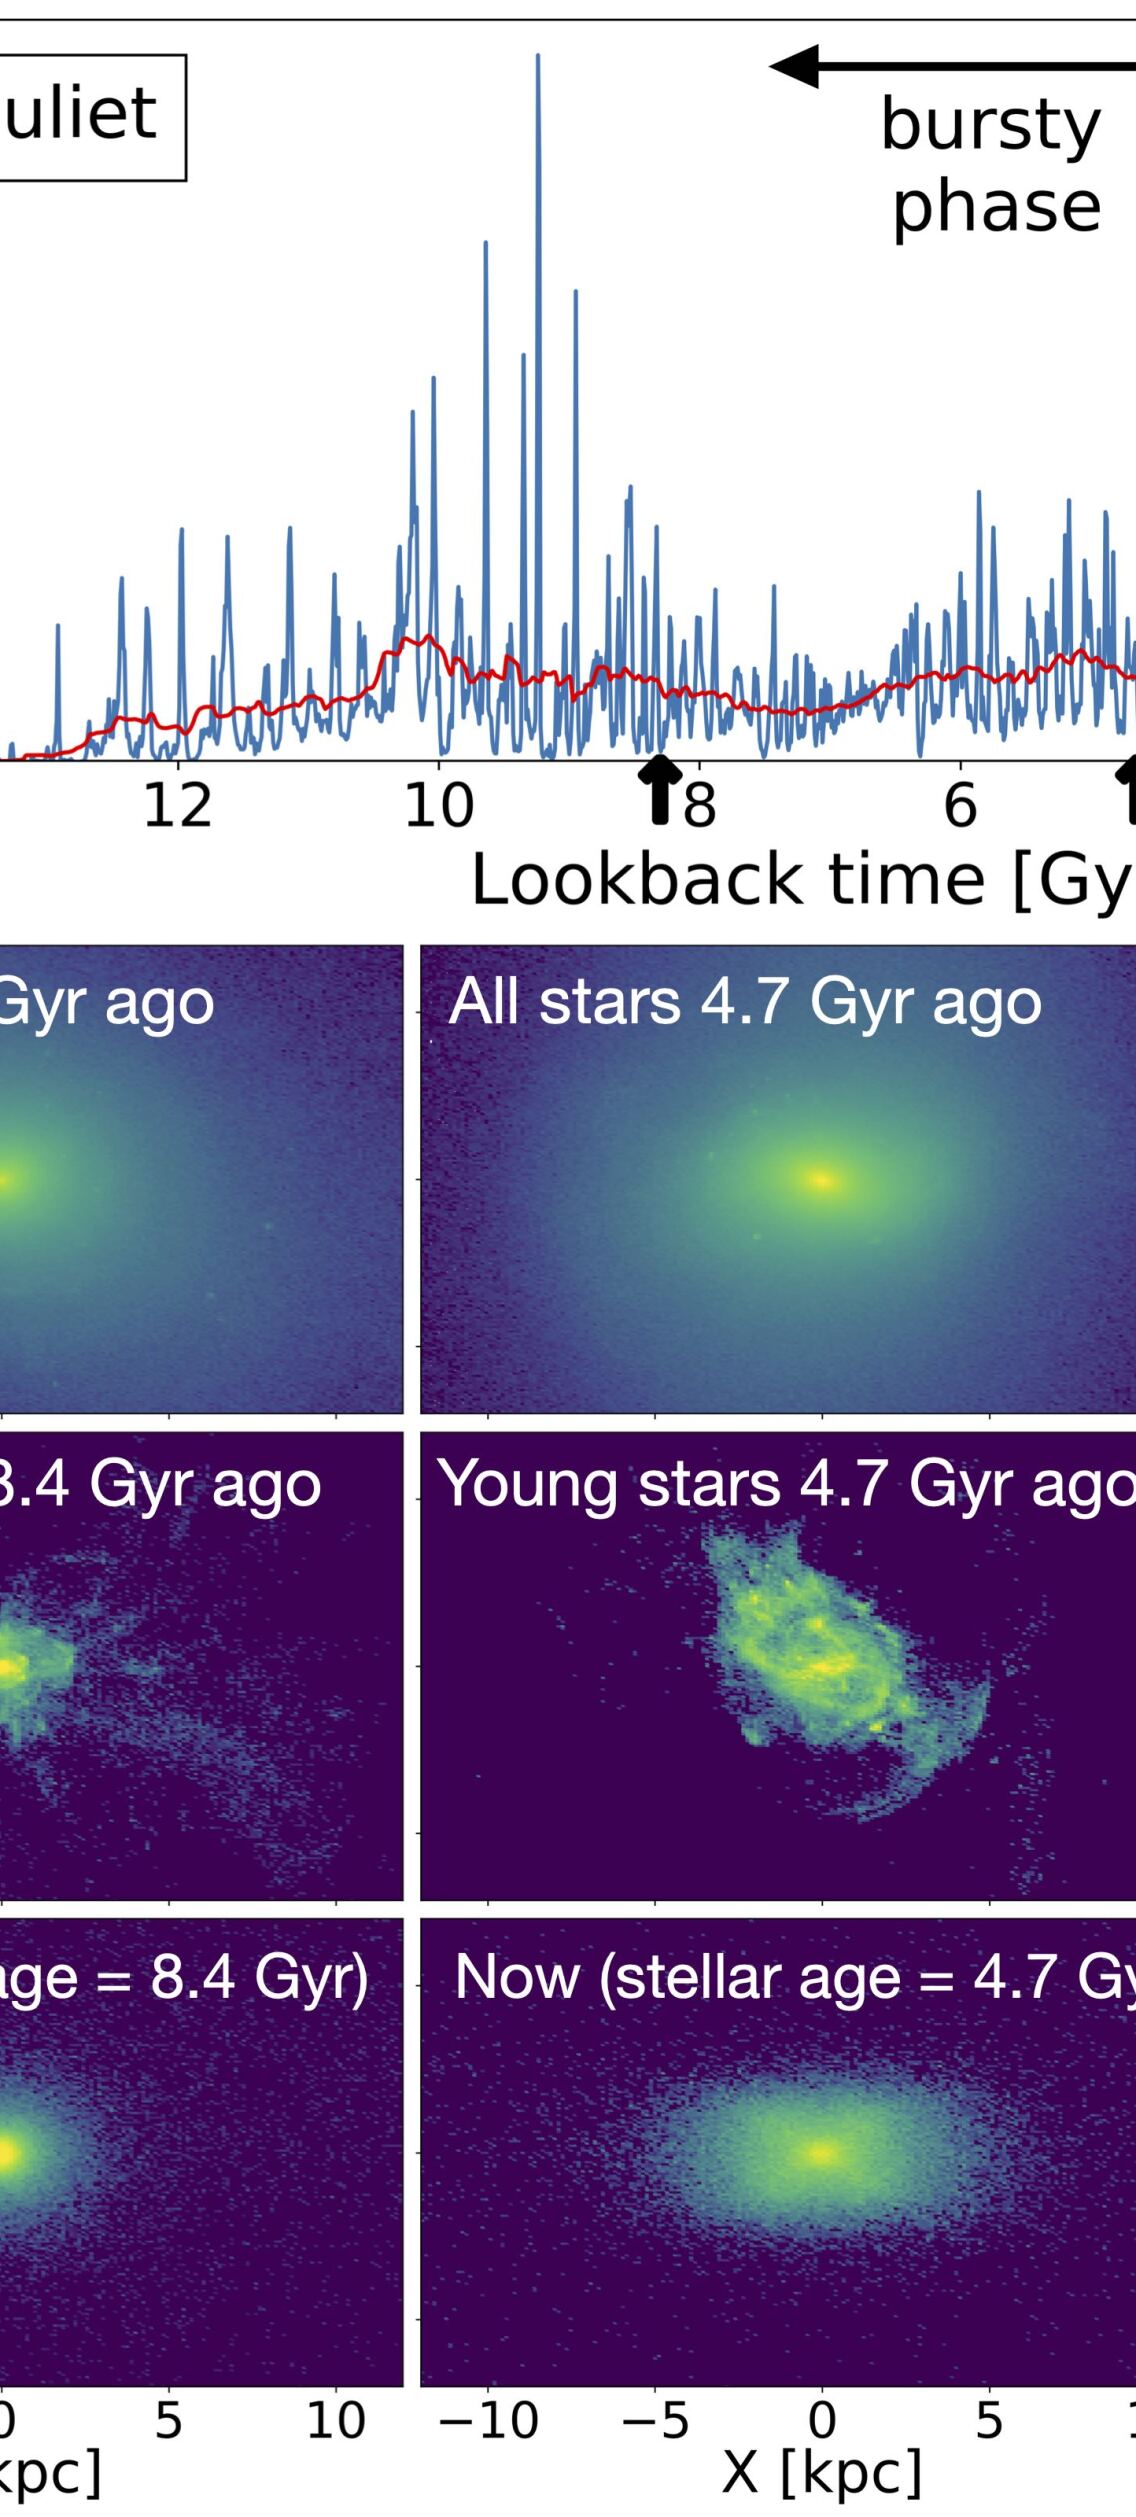
Figure 4 shows that Juliet exhibits a transition from thick to thin, which happens later than Romeo’s. Concretely, whilst Romeo had a pronounced thin disc component Gyr ago, Juliet had no thin disc at that time. Only in the most recent image (2.7 Gyr) does Juliet begin to resemble a thin disc. This difference in morphological structure with time mirrors the difference we see in the transition to steady star formation. Juliet has a bursty phase that ends only at a lookback time of Gyr, compared to Romeo, which ended its bursty phase Gyr ago. At Gyr, Juliet happens to have just experienced a rapid inflow of cool gas, some of which has formed stars in the thick, rotating structure we see in row (c), middle panel. Those stars end up in a thick disc component at (row d, bottom).
The 8.4 Gyr and 4.7 Gyr panels in Figure 4 for Juliet show differences in morphology with time that are representative across our larger simulated sample. Specifically, we find that the bursty phase itself can be further divided into two periods of morphological development: 1) a very early, chaotic bursty phase, where even the youngest stars ( Myr) have angular momenta that are misaligned with the existing stars in the galaxy; and 2) a later, quasi-stable “bursty-disc" phase, where some short-lived angular momentum cohesion exists. As shown with an example in the next section, we find that stars that are born very early on, when the SFR is very bursty, tend to be born with spheroidal-type orbits (with peaks in the distribution ranging from ). Stars that are made during the later, quasi-stable bursty-disc phase, tend to be fairly coherent for a short period of time, with circularity distributions within 50 Myr of their birth that straddle thin/thick disc characteristics (peaking with ). These bursty-disc stars are quickly heated to thicker-disc orbits within 100 Myr (similar to the behavior reported by Meng & Gnedin, 2021). This later heating appears to be a result of bursty feedback and chaotic accretion. Similar components could also be found based on stellar populations at using a Gaussian mixture model (Nikakhtar et al., in preparation).
Because this paper focuses on thin- and thick-disc formation, we have refrained from presenting results on early in-situ spheroid formation, though this would be an interesting topic for future work. It is worth noting that, when weighted by luminosity, the spheroidal components contribute minimally to the total light in our galaxies at .
3.1.3 Kinematic classification with time
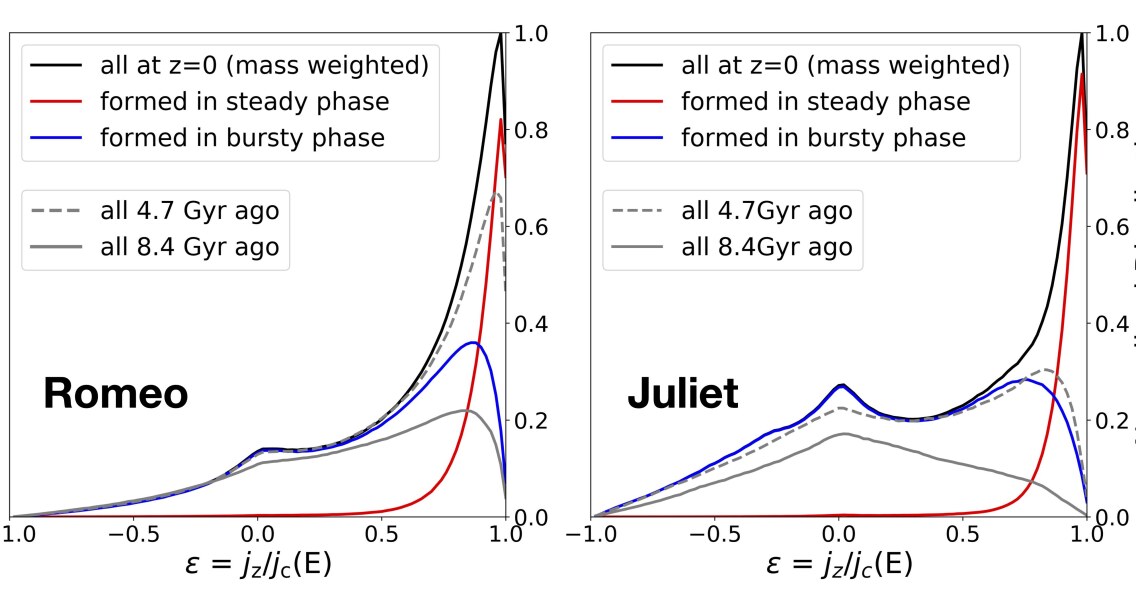
Figure 5 shows mass-weighted circularity distributions for star particles in Romeo (left) and Juliet (right). The black solid lines indicate distributions for all stars within of each galaxy at . The blue lines indicate the circularities for stars that formed during the early, bursty phase (), whilst the red lines refer to those formed during the later steady phase. Stars that formed during the steady phase are much more circular (thin-disc like) in each case, peaking close to . The stars that formed during the early bursty phase show much less coherence in angular momentum, with high- peaks closer to , indicative of thick-disc kinematics. Note that the distributions are normalised such that the sum of the red and blue lines equals the black lines.
The gray curves in Figure 5 show the distributions for all stars in the main progenitor of each galaxy at two different lookback times: 8.4 Gyr ago (gray solid) and 4.7 Gyr ago (gray dashed). These are the same times visualised in the lower left and lower middle panels of Figures 3 and 4. Romeo, which had just finished its bursty phase by Gyr ago, had a fairly prominent peak at high circularity at that time. Juliet, which was still in its bursty phase at that time, had a less well-ordered angular momentum distribution. Both galaxies were systematically less well-ordered 8.4 Gyr ago than they were 4.7 Gyr ago. Whilst Romeo had a small peak near , more characteristic of a thick disc component, Juliet had a distribution peaked near , as expected for a spheroidal system. These differences in angular momentum structure mirror the morphological differences between these two galaxies at the same times shown in Figures 3 and 4.
3.2 Late-time mergers and starbursts
Three of our twelve galaxies (m12b, m12c, and m12f) experience late-time mergers after the steady phase has commenced (see Appendix A for details). We define a merger to be an event that impacts the central galaxy (< 20 kpc) with a satellite that had a total mass (baryons and dark matter) greater than when it crossed the inner kpc. We record this as the merger time. Additionally, seven of our other galaxies have mergers of comparable sizes during the bursty phase, but these mergers do not correlate with disc properties in significant ways (see Appendix A).
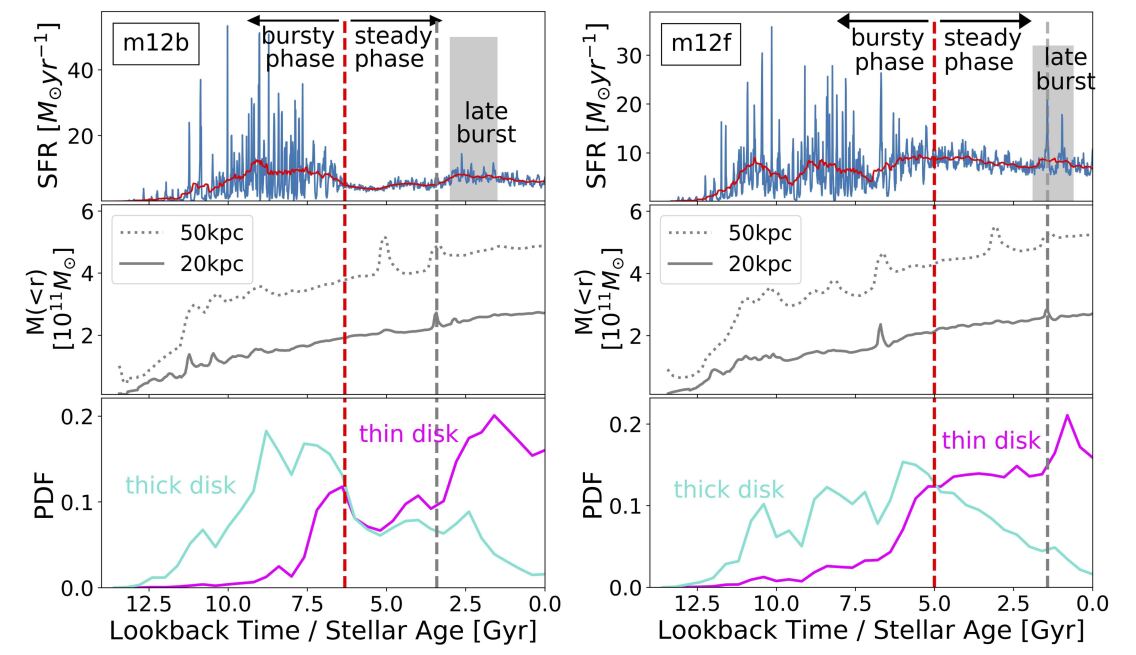
Figure 4 illustrates the star formation histories (top panels), total mass (dark matter plus baryons within kpc and kpc) evolution (middle panels), and disc component age distributions (bottom panels) associated with m12b (left) and m12f (right). The bottom panel splits the age distribution into thin (cyan) and thick (magenta) disc stars. m12b experiences a polar-orbit merger with a gas-rich, LMC-size satellite ( in baryons, in dark matter) that coalesces at the time of the late-burst marked. The more prominent late-burst in m12f is associated with a merger with a satellite of a similar mass, but this time on a prograde orbit.
These late-time mergers and associated bursts do not change broad correlations we find between bursty-phase lookback time and thin-disc fractions and median thick-disc ages. However, they do enhance the age distribution of the youngest thick-disc stars. The lower panels of Figure 4 include examples of this effect, where the thick-disc age distributions are not as sharply truncated after the bursty phase as they are in Figure 2. This seems mostly to arise from heating associated with the merger, but feedback from the burst could also contribute. Interestingly, the burst also coincides with a peak in the thin-disc stellar age distribution. Many of the stars that form in these bursts apparently retain thin-disc orbits. That gas-rich mergers can promote stellar-disc formation is a well-known phenomenon (Robertson et al., 2006). Santistevan et al. (2021) use the same simulations we analyze here to show that existing metal-poor stars and low-metallicity gas deposited in LMC-size mergers can explain the existence of low-metallicity prograde stars in the Milky Way (Sestito et al., 2020).
One of our twelve galaxies (Thelma) experiences a late-time burst (1 Gyr lookback time) that is not associated with a merger. This appears to be a stochastic event associated with the fact that Thelma has only recently settled down to at Gyr. Unlike the majority of our galaxies, Thelma does not settle down to a variance much smaller than ; so the “burst” by our formal definition looks more like a stochastic event. Only one other galaxy in ours sample, m12w, never really settles down ( Gyr) – its variance in instantaneous SFR around is still .
3.3 Sample-wide trends
3.3.1 Thick disc age
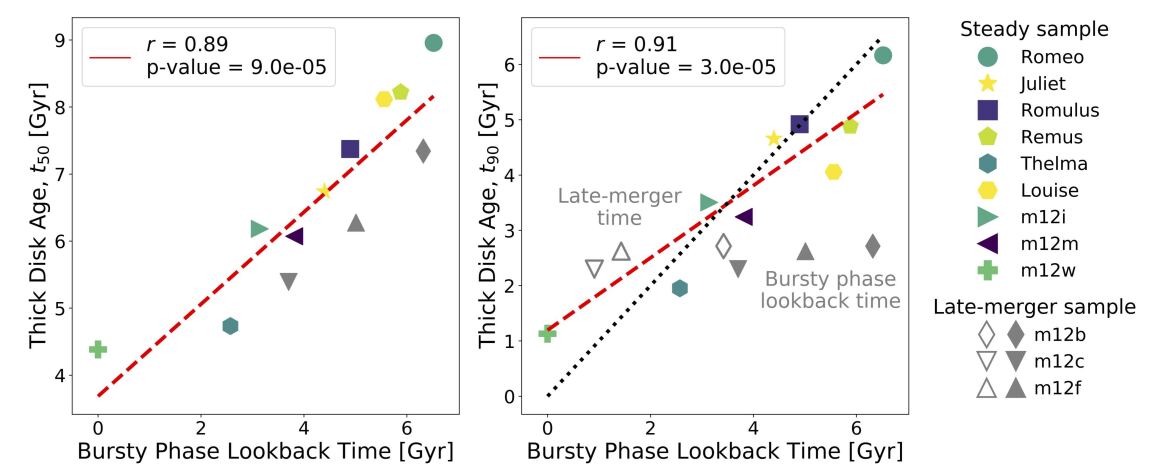
Using four illustrative examples, Figures 2 and 4 suggest that the ages of kinematically-identified thick-disc stars at tend to track the period of bursty star formation in these galaxies. The left panel of Figure 7 demonstrates that these trends hold for our entire sample. Displayed is the median age of thick-disc stars () versus the bursty-phase lookback time () for each galaxy. The correlation is quite tight, with more recent bursty phases associated with younger thick-disc ages. Note that along the horizontal axis is determined entirely from the star formation history of the galaxy and includes no dynamical information whatsoever, and thus the observed correlation is nontrivial. For example, if thick discs were formed primarily from initially thin discs that were heated by mergers, we would expect no such correlation.
The typical (median) thick-disc star was formed approximately 3 Gyr prior to the end of the bursty phase. The red-dashed line shows the best-fit linear relation:
| (2) |
where times are assumed to be in units of Gyr. The Pearson correlation coefficient for the points in the left panel is with p-value = . Although not shown, we find that that the average age of thick disc stars produces a very similar trend with bursty-phase lookback time as the median age displayed here. Given that the thick-disc population is primarily born during the bursty phase, it is natural to ask if the youngest thick-disc stars allow us to age-date the end of the bursty phase in a one-to-one way. We find that this is true only for the nine of our twelve galaxies that do not have a late-time merger during the steady phase.
The right panel of Figure 7 shows the age of the ninetieth percentile oldest thick-disc star () versus the bursty-phase lookback time (solid points). The dotted gray line shows the one-to-one relation for reference. The gray symbols refer to galaxies with late-time mergers, which clearly deviate from the trend. The one galaxy in our sample that experiences a late-time burst not triggered by a merger (Thelma, coloured pentagon) does not deviate significantly. The open gray symbols use the lookback time to the late-time merger as the horizontal coordinate. With this choice, the points fall along a fairly tight relation (with Pearson correlation coefficient of and p-value = ). The dashed red line shows a linear fit to the coloured and open points (with solid gray points ignored):
| (3) |
where times are assumed to be in unites of Gyr.
The gray points in the left panel of Figure 7 represent galaxies with late-time mergers. This group tends to track the relation, but also tend to lie systematically below the average trend with respect to median age. This is consistent with the interpretation that the young-star tail of the thick-disc population has been populated by stars formed after the end of the bursty phase. Nevertheless, the fraction of stars populated in this way is small enough () that the broad trend with median age and bursty phase lookback time is preserved.
Given that the youngest thick-disc stars may be associated with either the end of the bursty phase or a late-time merger, it maybe be difficult to use the age of the youngest stars to easily date the end of the bursty phase. In principle, one could look for features in the age distribution of thick-disc stars to gain insight on these questions (see Figure 4 where the bursty lookback time does seem to imprint a feature in the age distribution of thick-disc stars). However, it will likely be more straightforward to use the typical age (median or average) of thick-disc stars to estimate the lookback time corresponding to the end of the bursty phase and the beginning of the steady phase (independent of the recent merger activities).
3.3.2 Thin disc fraction
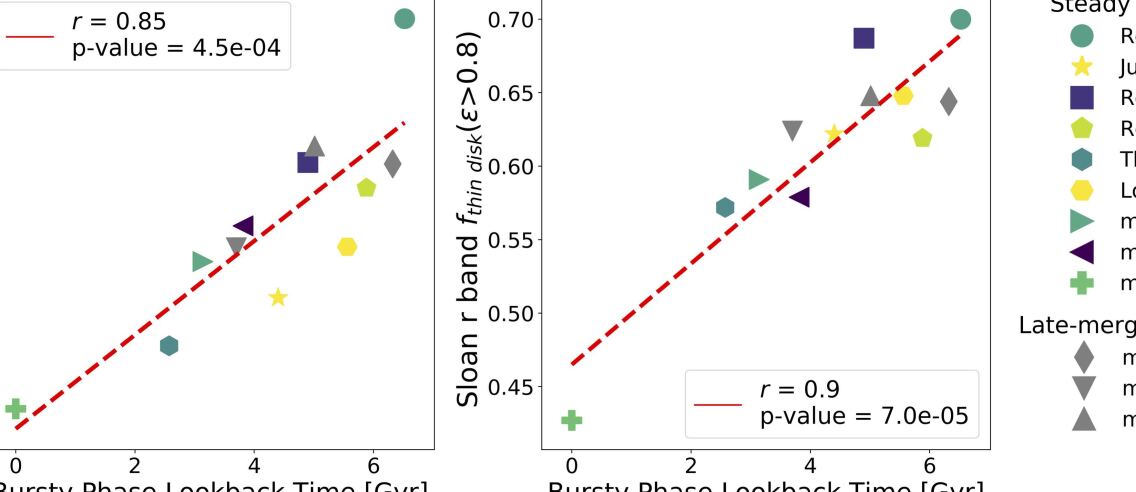
Figure 8 shows the correlation between bursty-phase lookback time and thin-disc fraction, with each symbol type mapped to a specific galaxy name (far-right legend). The left panel employs a mass-weighted thin-disc fraction, whilst the right panel uses as luminosity-weighted thin-disc fraction. The red lines show linear fits to the data points. In each case, the correlation is strong, but with scatter, with Pearson correlation coefficients of (mass weighted) and (luminosity weighted). Both p-values ( and , respectively) are much less than the significance level.
We see that the earlier the lookback time to the transition, the more prominent the thin disc is. It makes qualitative sense that the longer stars are created in the “settled” phase, the larger the fraction of thin disc stars we would see. At fixed thin-disc fraction, we see Gyr scatter in the lookback time to the bursty phase. It would be surprising, however, if this relation were any tighter, as it contains no information on the absolute star formation rates in either phase. Specifically, at fixed lookback time to the transition, the higher the average star formation rate during the thin-disc/steady phase compared to the thick-disc/bursty phase, the more prominent the thin disc would be. We see that this trend generally holds for our galaxies. For example, if we examine the star formation histories in Figure 4 for galaxies m12b and m12f, we see that m12b has a higher smoothed-average star formation rate during the bursty phase than it does during the steady phase. Conversely, m12f has a similar smoothed-average star formation rate before and after the transition. This means that m12b will be making fewer thin-disc stars per unit time during the steady phase than m12f. This explains why m12b has a thin-disc fraction (0.64 in luminosity) that is slightly lower than m12f (0.65), even though its steady phase lasts more than one billion years longer (7.34 Gyr vs. 6.28 Gyr).
3.3.3 CGM virialisation and steady star formation
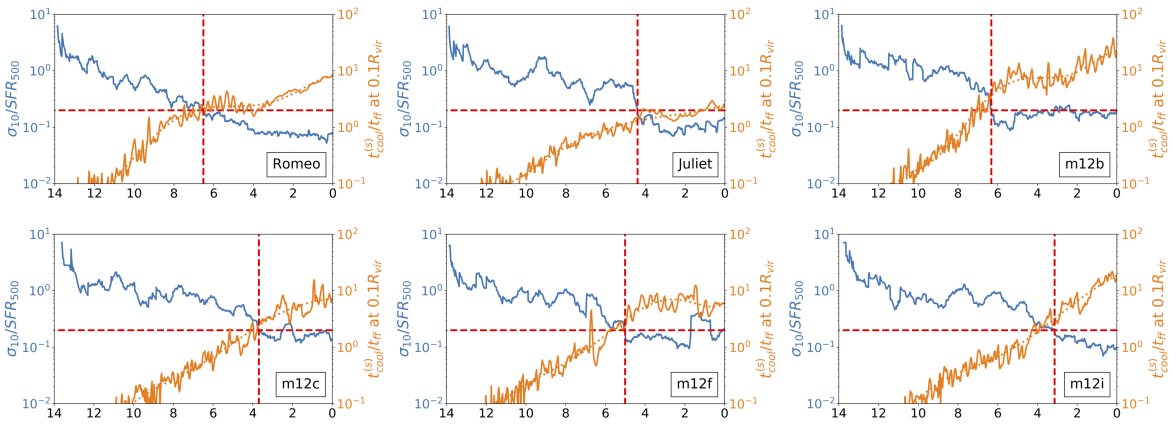
The physical origin of the progression from early, bursty and less kinematically-ordered star formation to late-time, steady star formation in thin discs is not clear. An important clue comes from the work of Stern et al. (2020), who used FIRE-2 simulations to show that the bursty to steady transition in galaxy star formation coincides with virialisation of the inner CGM. They quantify inner CGM virialisation using the ratio of the cooling time of shocked gas to the free-fall time at an inner radius . When the inner CGM is smooth and largely supported by thermal pressure. In contrast, when , the inner CGM has large pressure fluctuations and is highly dynamic. Using a sample of sixteen zoom simulations with halo masses ranging from Mhalo M⊙, Stern et al. (2020) shows that gaseous discs become rotationally supported and star formation transitions from bursty to steady at roughly the time when the ratio first becomes . Their sample included four of the twelve galaxies we consider here.
In this brief subsection, we extend the Stern et al. (2020) analysis to the additional haloes in our sample and confirm their reported trends. Using the same definitions of free-fall time and cooling time described in section 2.1 of their paper, we show that inner CGM virialisation at the time when generally coincides with our bursty to steady SFR transition at SFR (Eq. 1). This is demonstrated in Figure 9, where we show the evolution of the inner virialisation parameter (right axis, orange line) and the burstiness parameter (left axis, blue line) as functions of lookback time for six example haloes. Not only do the transition timescales coincide in each case, but the monotonic progressions of each parameter tends to evolve inversely with the other in time. At early times, when gas flows are prone to cooling instabilities and clumpy accretion, the star formation is more bursty. At late times, when cooling times are long and the flow can be relatively smooth and well-mixed, star formation tends to be more constant. We find similar behaviors hold for every halo in our sample.
The proceeding analysis demonstrates that as the inner CGM of our galaxies virialises, the star formation becomes less bursty (Fig. 9). This is also the time when stars tend to be formed with thin-disc kinematics (Fig. 7). One hypothesis that explains this, suggested by Stern et al. (2020), is that a virialised inner CGM enables the formation of stable discs because a hot and uniform halo can pressure-confine disruptive superbubbles driven by clustered supernovae. Another possibility is that smooth and well-mixed accretion enables more coherently aligned angular momentum at the time of accretion onto the galaxy (Hafen et al., in preparation). These issues are important topics for further exploration.
4 Discussion and Conclusions
We investigate the formation of the stellar thin and thick disc components using twelve FIRE-2 zoom-in simulations of Milky-Way-mass galaxies. Our main findings include the following:
-
•
Each galaxy experiences an early period of bursty star formation that transitions into a steady phase, with a relatively constant star formation rate at late times. The transition time corresponds to the time when the inner CGM becomes sub-sonic and virialises (Figure 9).
- •
-
•
The lookback time to the end of bursty phase ranges from Gyr in our sample. This time correlates strongly with the median age of thick disc stars at (Figure 7).
-
•
Galaxies with longer steady phases (larger ) tend to have higher thin-disc fractions (Figure 8).
Three of our twelve simulations have appreciable late-time mergers that occur after the steady (thin-disc) phase has commenced. These mergers are not responsible for the bulk of thick-disc stars, though they do heat some disc stars and populate the young-star tail of the thick disc population demonstrated in Figure 4 and the right panel of Figure 7.
The fact that our discs emerge thick and become thinner over cosmic time is consistent with previous findings of “upside-down” disc formation (Brook et al., 2004; Brook et al., 2012; Bird et al., 2013; Navarro et al., 2018; Bird et al., 2021; Ma et al., 2017b; Park et al., 2020). However, our result that the transition is associated with a transition in star formation activity – from bursty to steady – adds a new element to this discussion. That FIRE simulations of Milky-Way-mass haloes experience such a transition in star formation activity is not a new result (Muratov et al., 2015; Sparre et al., 2017; Anglés-Alcázar et al., 2017b; Faucher-Giguère, 2018). The onset of the steady phase appears to be related to the virialisation of the inner CGM (Stern et al., 2020, and Figure 9). A hot, pressurised CGM may stabilise the disc against supernovae-driven outflows and enable thin-disc formation (Stern et al., 2020). If correct, this interpretation opens the possibility of using stellar archaeology to learn about the origin of the Milky Way’s CGM and its associated history of star-formation modes.
Whilst a more observationally-oriented comparison is required to interpret our results for the Milky Way confidently, it is tempting to explore some potential implications based on naïve comparisons to published estimates of the Galactic thick-disc age distribution (Haywood et al., 2013; Snaith et al., 2014; Martig et al., 2016; Hayden et al., 2017; Sharma et al., 2019). Most estimates suggest that the Milky Way thick-disc has a median age of Gyr, with few stars younger than Gyr. Such an age distribution is most similar to our Romeo simulation (Figure 2), which transitioned from bursty to steady star formation Gyr ago. This simple comparison would suggest that the Milky Way transitioned at a similar time, commensurate with the virialisation of its inner hot halo. If this is the case, then prior to that time, the Milky Way lacked a dominant thin disc component, was forming stars in a bursty manner, and had non-virialised inner CGM.
Related to our analysis, Bellardini et al. (2021), using the same set of simulations, finds that gas disc metallicity in-homogeneity was dominated by azimuthal variations at high redshift but then transitioned to being dominated by radial gradients at lower redshifts, which has also been reported in the previous analysis in the FIRE-1 simulations across a much wider galaxy mass range (Ma et al., 2017a). The transition epochs after which radial variations dominate over azimuthal scatter agree broadly well with our measurement of the transitions from bursty to steady phase. Although there is significant scatter and some time delay between the measurements of two transition times, it shows some potential observable implications of the bursty/steady transition for galactic archaeology.
Some cosmological galaxy formation simulations, including those that demonstrate upside-down disc formation (e.g. Park et al., 2020), do not have early bursty star formation phases of the kind we witness in our models. This may partially be due to star formation threshold employed. Burstiness is suppressed in simulations with modest threshold densities ( cm-3) for star formation, whereas our simulations require cm-3 (see Benítez-Llambay et al., 2019; Dutton et al., 2019, for a related discussion). Given this, chemical tracers among the various Galactic kinematic components may provide a means to test star formation prescriptions. Other factors like the ISM model, local star formation efficiency and the stellar feedback model might also play a role. Future work in this direction will be illuminating.
Acknowledgements
SY and JSB were supported by NSF grants AST-1910346 and AST-1518291. CK was supported by a National Science Foundation Graduate Research Fellowship Program under grant DGE-1839285. JS is supported also by the German Science Foundation via DIP grant STE 1869/2-1 GE 625/17-1 AW received support from NASA through ATP grants 80NSSC18K1097 and 80NSSC20K0513; HST grants GO-14734, AR-15057, AR-15809, and GO-15902 from STScI; a Scialog Award from the Heising-Simons Foundation; and a Hellman Fellowship. Support for JM is provided by the NSF (AST Award Number 1516374). ZH was supported by a Gary A. McCue postdoctoral fellowship at UC Irvine. ABG was supported by an NSFGRFP under grant DGE-1842165 and was additionally supported by NSF grants DGE-0948017 and DGE-145000. Support for PFH was provided by NSF Research Grants 1911233 & 20009234, NSF CAREER grant 1455342, NASA grants 80NSSC18K0562, HST-AR-15800.001-A. Numerical calculations were run on the Caltech compute cluster “Wheeler,” allocations FTA-Hopkins/AST20016 supported by the NSF and TACC, and NASA HEC SMD-16-7592. CAFG was supported by NSF through grants AST-1715216 and CAREER award AST-1652522; by NASA through grant 17-ATP17-0067; by STScI through grant HST-AR-16124.001-A; and by a Cottrell Scholar Award and a Scialog Award from the Research Corporation for Science Advancement. RF acknowledges financial support from the Swiss National Science Foundation (grant no 157591 and 194814). We ran simulations using: XSEDE, supported by NSF grant ACI-1548562; Blue Waters, supported by the NSF; Pleiades, via the NASA HEC program through the NAS Division at Ames Research Center.
References
- Abadi et al. (2003) Abadi M. G., Navarro J. F., Steinmetz M., Eke V. R., 2003, ApJ, 597, 21
- Anglés-Alcázar et al. (2017a) Anglés-Alcázar D., Faucher-Giguère C.-A., Kereš D., Hopkins P. F., Quataert E., Murray N., 2017a, MNRAS, 470, 4698
- Anglés-Alcázar et al. (2017b) Anglés-Alcázar D., Faucher-Giguère C.-A., Quataert E., Hopkins P. F., Feldmann R., Torrey P., Wetzel A., Kereš D., 2017b, MNRAS, 472, L109
- Bellardini et al. (2021) Bellardini M. A., Wetzel A., Loebman S. R., Faucher-Giguère C.-A., Ma X., Feldmann R., 2021, arXiv e-prints, p. arXiv:2102.06220
- Belokurov et al. (2018) Belokurov V., Erkal D., Evans N. W., Koposov S. E., Deason A. J., 2018, MNRAS, 478, 611
- Benítez-Llambay et al. (2019) Benítez-Llambay A., Frenk C. S., Ludlow A. D., Navarro J. F., 2019, MNRAS, 488, 2387
- Bensby et al. (2011) Bensby T., Alves-Brito A., Oey M. S., Yong D., Meléndez J., 2011, ApJ, 735, L46
- Bird et al. (2013) Bird J. C., Kazantzidis S., Weinberg D. H., Guedes J., Callegari S., Mayer L., Madau P., 2013, ApJ, 773, 43
- Bird et al. (2021) Bird J. C., Loebman S. R., Weinberg D. H., Brooks A. M., Quinn T. R., Christensen C. R., 2021, MNRAS,
- Bovy & Rix (2013) Bovy J., Rix H.-W., 2013, ApJ, 779, 115
- Bovy et al. (2012) Bovy J., Rix H.-W., Hogg D. W., 2012, ApJ, 751, 131
- Brook et al. (2004) Brook C. B., Kawata D., Gibson B. K., Freeman K. C., 2004, ApJ, 612, 894
- Brook et al. (2006) Brook C. B., Kawata D., Martel H., Gibson B. K., Bailin J., 2006, ApJ, 639, 126
- Brook et al. (2012) Brook C. B., et al., 2012, MNRAS, 426, 690
- Dutton et al. (2019) Dutton A. A., Macciò A. V., Buck T., Dixon K. L., Blank M., Obreja A., 2019, MNRAS, 486, 655
- Elmegreen & Elmegreen (2006) Elmegreen B. G., Elmegreen D. M., 2006, ApJ, 650, 644
- Elmegreen et al. (2007) Elmegreen D. M., Elmegreen B. G., Ravindranath S., Coe D. A., 2007, ApJ, 658, 763
- Elmegreen et al. (2017) Elmegreen B. G., Elmegreen D. M., Tompkins B., Jenks L. G., 2017, ApJ, 847, 14
- Escala et al. (2018) Escala I., et al., 2018, MNRAS, 474, 2194
- Faucher-Giguère (2018) Faucher-Giguère C.-A., 2018, MNRAS, 473, 3717
- Faucher-Giguère et al. (2009) Faucher-Giguère C.-A., Lidz A., Zaldarriaga M., Hernquist L., 2009, ApJ, 703, 1416
- Flores Velázquez et al. (2021) Flores Velázquez J. A., et al., 2021, MNRAS, 501, 4812
- Freudenburg et al. (2017) Freudenburg J. K. C., Weinberg D. H., Hayden M. R., Holtzman J. A., 2017, ApJ, 849, 17
- Fuhrmann (1998) Fuhrmann K., 1998, A&A, 338, 161
- Garrison-Kimmel et al. (2014) Garrison-Kimmel S., Boylan-Kolchin M., Bullock J. S., Lee K., 2014, MNRAS, 438, 2578
- Garrison-Kimmel et al. (2017) Garrison-Kimmel S., et al., 2017, MNRAS, 471, 1709
- Garrison-Kimmel et al. (2019a) Garrison-Kimmel S., et al., 2019a, MNRAS, 487, 1380
- Garrison-Kimmel et al. (2019b) Garrison-Kimmel S., et al., 2019b, MNRAS, 489, 4574
- Genzel et al. (2008) Genzel R., et al., 2008, ApJ, 687, 59
- Gilmore & Reid (1983) Gilmore G., Reid N., 1983, MNRAS, 202, 1025
- Grand et al. (2018) Grand R. J. J., et al., 2018, MNRAS, 474, 3629
- Hayden et al. (2015) Hayden M. R., et al., 2015, ApJ, 808, 132
- Hayden et al. (2017) Hayden M. R., Recio-Blanco A., de Laverny P., Mikolaitis S., Worley C. C., 2017, A&A, 608, L1
- Haywood et al. (2013) Haywood M., Di Matteo P., Lehnert M. D., Katz D., Gómez A., 2013, A&A, 560, A109
- Helmi et al. (2018) Helmi A., Babusiaux C., Koppelman H. H., Massari D., Veljanoski J., Brown A. G. A., 2018, Nature, 563, 85
- Hopkins (2015) Hopkins P. F., 2015, MNRAS, 450, 53
- Hopkins (2016) Hopkins P. F., 2016, MNRAS, 455, 89
- Hopkins (2017) Hopkins P. F., 2017, MNRAS, 466, 3387
- Hopkins et al. (2018) Hopkins P. F., et al., 2018, MNRAS, 480, 800
- Jurić et al. (2008) Jurić M., et al., 2008, ApJ, 673, 864
- Kassin et al. (2012) Kassin S. A., et al., 2012, ApJ, 758, 106
- Katz et al. (1996) Katz N., Weinberg D. H., Hernquist L., 1996, ApJS, 105, 19
- Kazantzidis et al. (2008) Kazantzidis S., Bullock J. S., Zentner A. R., Kravtsov A. V., Moustakas L. A., 2008, ApJ, 688, 254
- Knebe et al. (2013) Knebe A., et al., 2013, MNRAS, 428, 2039
- Krumholz & Gnedin (2011) Krumholz M. R., Gnedin N. Y., 2011, ApJ, 729, 36
- Lehnert et al. (2014) Lehnert M. D., Di Matteo P., Haywood M., Snaith O. N., 2014, ApJ, 789, L30
- Ma et al. (2017a) Ma X., Hopkins P. F., Feldmann R., Torrey P., Faucher-Giguère C.-A., Kereš D., 2017a, MNRAS, 466, 4780
- Ma et al. (2017b) Ma X., Hopkins P. F., Wetzel A. R., Kirby E. N., Anglés-Alcázar D., Faucher-Giguère C.-A., Kereš D., Quataert E., 2017b, MNRAS, 467, 2430
- Mackereth et al. (2017) Mackereth J. T., et al., 2017, MNRAS, 471, 3057
- Martig et al. (2016) Martig M., Minchev I., Ness M., Fouesneau M., Rix H.-W., 2016, ApJ, 831, 139
- Martizzi (2020) Martizzi D., 2020, MNRAS, 492, 79
- Meng & Gnedin (2021) Meng X., Gnedin O. Y., 2021, MNRAS, 502, 1433
- Muratov et al. (2015) Muratov A. L., Kereš D., Faucher-Giguère C.-A., Hopkins P. F., Quataert E., Murray N., 2015, MNRAS, 454, 2691
- Navarro et al. (2018) Navarro J. F., et al., 2018, MNRAS, 476, 3648
- Oñorbe et al. (2014) Oñorbe J., Garrison-Kimmel S., Maller A. H., Bullock J. S., Rocha M., Hahn O., 2014, MNRAS, 437, 1894
- Okamoto et al. (2010) Okamoto T., Frenk C. S., Jenkins A., Theuns T., 2010, MNRAS, 406, 208
- Orr et al. (2018) Orr M. E., et al., 2018, MNRAS, 478, 3653
- Overzier et al. (2010) Overzier R. A., Heckman T. M., Schiminovich D., Basu-Zych A., Gonçalves T., Martin D. C., Rich R. M., 2010, ApJ, 710, 979
- Park et al. (2020) Park M. J., et al., 2020, arXiv e-prints, p. arXiv:2009.12373
- Pillepich et al. (2019) Pillepich A., et al., 2019, MNRAS, 490, 3196
- Purcell et al. (2009) Purcell C. W., Kazantzidis S., Bullock J. S., 2009, ApJ, 694, L98
- Quinn et al. (1993) Quinn P. J., Hernquist L., Fullagar D. P., 1993, ApJ, 403, 74
- Recio-Blanco et al. (2014) Recio-Blanco A., et al., 2014, A&A, 567, A5
- Robertson et al. (2006) Robertson B., Bullock J. S., Cox T. J., Di Matteo T., Hernquist L., Springel V., Yoshida N., 2006, ApJ, 645, 986
- Samuel et al. (2020) Samuel J., et al., 2020, MNRAS, 491, 1471
- Sanderson et al. (2020) Sanderson R. E., et al., 2020, ApJS, 246, 6
- Santistevan et al. (2021) Santistevan I. B., Wetzel A., Sanderson R. E., El-Badry K., Samuel J., Faucher-Giguère C.-A., 2021, arXiv e-prints, p. arXiv:2102.03369
- Sestito et al. (2020) Sestito F., et al., 2020, MNRAS, 497, L7
- Shapiro et al. (2008) Shapiro K. L., et al., 2008, ApJ, 682, 231
- Sharma et al. (2019) Sharma S., et al., 2019, MNRAS, 490, 5335
- Snaith et al. (2014) Snaith O. N., Haywood M., Di Matteo P., Lehnert M. D., Combes F., Katz D., Gómez A., 2014, ApJ, 781, L31
- Sparre et al. (2017) Sparre M., Hayward C. C., Feldmann R., Faucher-Giguère C.-A., Muratov A. L., Kereš D., Hopkins P. F., 2017, MNRAS, 466, 88
- Stern et al. (2020) Stern J., et al., 2020, arXiv e-prints, p. arXiv:2006.13976
- Su et al. (2017) Su K.-Y., Hopkins P. F., Hayward C. C., Faucher-Giguère C.-A., Kereš D., Ma X., Robles V. H., 2017, MNRAS, 471, 144
- Wetzel et al. (2016) Wetzel A. R., Hopkins P. F., Kim J.-h., Faucher-Giguère C.-A., Kereš D., Quataert E., 2016, ApJ, 827, L23
- van der Kruit & Freeman (2011) van der Kruit P. C., Freeman K. C., 2011, ARA&A, 49, 301
Appendix A Merger histories
As discussed in Section 3.2, we have explored the importance of mergers in shaping thin/thick disc formation in our simulations. In particular, we focus on merging events that perturb the total mass content within kpc by more than in the final coalescence of a satellite and that the merging satellite crossed within the kpc sphere for the first time with more than of total mass (which includes both dark matter and baryons). We have made these choices because only above these thresholds do we discern any correlated activity that influences star formation or disc structure.
Figure 4 showed the mass accretion histories (middle panels) for two galaxies that experience late-time mergers by this definition. These mergers happened after the steady phase has commenced and appear to trigger late-time starbursts and also to add to the young-start tail of the age distribution of thick-disc stars. Figure 11 shows example mass growth histories for two galaxies without such mergers. They also show star formation histories, specifically for Romeo (left) and Juliet (right). The lower panels show total mass within kpc (dotted) and 20 kpc (solid) for each galaxy. We see that the central galaxies themselves experience little in the way of merger activity that perturbs their overall masses going back prior to the time the steady phase began (red dashed lines). Nevertheless the transition from bursty to steady phase is sharp, and these transition times correlate with thick-disc ages (Fig. 7) and thin-disc fractions (Fig. 8).
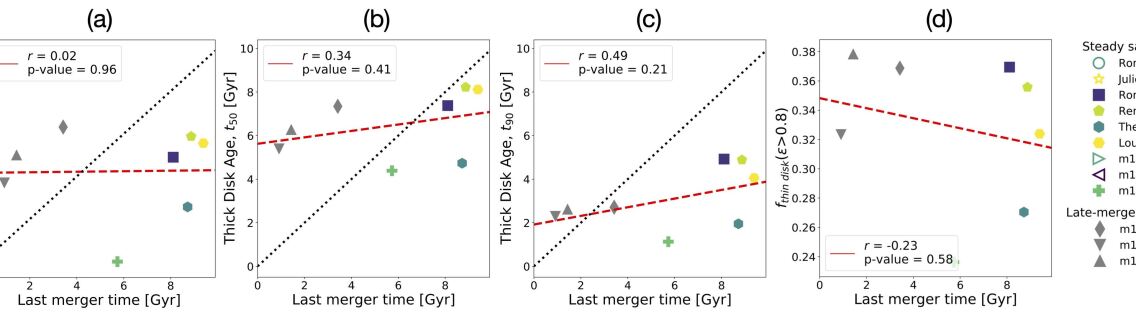
We have tabulated the lookback times of the last mergers in each of our simulated galaxies. Figure 10 shows these times plotted against the bursty-phase lookback time, thick disc age, and thin-disc fraction for our galaxies. Four galaxies, Romeo, Juliet, m12i, and m12m, experience no such merger over their lifetimes and are not plotted. We find no correlation between the last merger time and bursty-phase lookback time (left panel). We find, at best, weak correlations with thick disc age. A more detailed analysis of possible correlations between mergers and bursty/steady transition is deferred for future work.