Building a testable shear viscosity across the QCD phase diagram
Abstract
Current experiments at the Relativistic Heavy Ion Collider (RHIC) are probing finite baryon densities where the shear viscosity to enthalpy ratio of the Quark Gluon Plasma remains unknown. We use the Hadron Resonance Gas (HRG) model with the most up-to-date hadron list to calculate at low temperatures and at finite baryon densities . We then match to a QCD-based shear viscosity calculation within the deconfined phase to create a table across for different cross-over and critical point scenarios at a specified location. We find that these new values would require initial conditions at significantly larger , compared to ideal hydrodynamic trajectories, in order to reach the same freeze-out point.
I Introduction
Relativistic heavy-ion collisions at the Large Hadron Collider (LHC) and Relativistic Heavy-Ion Collider (RHIC) have successfully reproduced the phase transition from the Quark Gluon Plasma into a hadron resonance gas in the laboratory. Since 2006 it has been understood that this phase transition is a smooth cross-over Aoki et al. (2006); Borsanyi et al. (2010a, b); Bazavov et al. (2014); Borsanyi et al. (2020); Ratti (2018); Guenther (2020). For this reason, the definition of the pseudo-critical temperature is not unique, but rather depends on the observable considered. If Quantum Chromodynamics (QCD) exhibits a critical point at large baryon densities, one expects the different pseudo-critical temperatures to converge to the critical temperature Endrodi et al. (2011); Rougemont et al. (2017); Grefa et al. (2021); Bellwied et al. (2019); Noronha-Hostler et al. (2016a) at the critical point. However, it also possible that there is no critical point and only a cross-over is seen at larger baryon densities.
One crucial achievement of heavy-ion collisions has been the discovery that the Quark Gluon Plasma is a nearly perfect fluid with a shear viscosity to entropy density ratio which at is close to the KSS limit Kovtun et al. (2005) (that we now know is no longer a strict bound Kats and Petrov (2009); Brigante et al. (2008a, b); Buchel et al. (2009); Brigante et al. (2008b); Critelli et al. (2014); Finazzo et al. (2016)). Due to the extremely short lifetime of the produced Quark Gluon Plasma, relativistic viscous hydrodynamic calculations have been vital to understand the dynamics of this cross-over phase transition. It is common practice in the field to use as a free parameter, and extract its value from experimental data by comparing flow harmonics to theoretical predictions from relativistic hydrodynamics Romatschke and Romatschke (2007); Bozek (2012); Heinz and Snellings (2013); Luzum and Petersen (2014); Niemi et al. (2016); Noronha-Hostler et al. (2016b); McDonald et al. (2017); Bernhard et al. (2019); Alba et al. (2018a). However, since there are many other free parameters that influence the extraction of , this is not a trivial task.
Ideally, would be calculated directly from lattice QCD but this turns out to be an ill-posed problem, as it involves inversion methods over a discrete set of lattice points for the correlator of the energy-momentum tensor. Besides, the signal for this specific correlator is dominated by the high- part of the spectral function Aarts and Martinez Resco (2002); Borsanyi et al. (2018), which makes the inversion even harder. For these reasons, one must turn to alternative approaches such as the hadron resonance gas (HRG) model Noronha-Hostler et al. (2009); Pal (2010); Khvorostukhin et al. (2010); Tawfik and Wahba (2010); Alba et al. (2015); Ratti et al. (2011); Tiwari et al. (2012); Noronha-Hostler et al. (2012); Kadam and Mishra (2014, 2015, 2016); Kadam and Pawar (2019); Mohapatra et al. (2019), transport theory Wesp et al. (2011); Ozvenchuk et al. (2013); Rose et al. (2018); Rais et al. (2020), holography Kovtun et al. (2005), Color String Percolation Model Sahu and Sahoo (2020), linear sigma model Heffernan et al. (2020) or QCD-motivated alternatives Haas et al. (2014); Christiansen et al. (2015); Dubla et al. (2018); Ghiglieri et al. (2018), to name a few. These calculations are often only performed at . Hence, they would be appropriate primarily for LHC and top RHIC energies, but not for large baryon densities.
While calculations currently exist from some of these models at finite baryon densities, there are difficulties in systematically studying 111Note that at finite the enthalpy is used rather than entropy for different types of phase transitions (cross-over vs. a critical point within the dynamical H or B university classes) since some of these models are only applicable within the hadronic phase (e.g. HRG model Denicol et al. (2013); Kadam and Mishra (2014), UrQMD Demir and Bass (2009), and SMASH Rose et al. (2018) calculations), or they are beholden to dynamic university class of the model itself (e.g. holography in Universality class B Rougemont et al. (2017); Critelli et al. (2017), which is also limited to a constant for current studies at finite 222Alternatives to exist Kats and Petrov (2009); Brigante et al. (2008a, b); Buchel et al. (2009) at vanishing baryon densities where an action is formulated that allows for derivatives up to the 4th order. However, these calculations have not yet been incorporated into non-conformal AdS. Since non-conformality is vital for understanding the QCD phase transition, the current framework cannot provide non-trivial information about at a critical point.). Furthermore, at larger baryon densities repulsive interactions have been shown to be more relevant Vovchenko et al. (2017a); Huovinen and Petreczky (2018), which should be taken into account in the hadronic phase.
In this paper we establish a framework for combining in the confined phase – from an interacting hadron resonance gas (HRG) – and in the deconfined phase – with a QCD-based assumption – in the presence of a cross-over phase transition. The key element is that we use the finite behavior from the HRG model to construct across the phase diagram relevant to heavy-ion collisions. We note that the framework is generic enough to be easily updated if more realistic QCD-based calculations become available at finite . We use an interacting hadron resonance gas with the most up-to-date particle resonance list from the Particle Data Group (PDG16+) Alba et al. (2017), which was shown to be a reasonable fit compared to lattice QCD data, can describe net-Kaon fluctuations Bellwied et al. (2019), off-diagonal susceptibilities Bellwied et al. (2020), thermal fits Alba et al. (2020), and works well within relativistic viscous hydrodynamic calculations Alba et al. (2018a). We base the treatment of the deconfined phase on the parametrized version of from Ref. Dubla et al. (2018), which is adjusted to match the hadron resonance gas model at the phase transition assuming a minimum value . In this work we construct four different profiles for : we first consider the cases of a smooth or sharp crossover, then the case with a critical point, first at MeV – to match to the publicly available BEST collaboration EoS Parotto et al. (2020), then at MeV – matching the prediction from holography in Ref. Critelli et al. (2017)333We remind the reader that, while the result in Ref. Critelli et al. (2017) is a prediction on the location of the critical point, the BEST collaboration EoS allows the user to pick its location, and the one mentioned here is the one used in Ref. Parotto et al. (2020) for illustration purposes..
II Hadron Resonance Gas Model
With the HRG model one can calculate the pressure, energy density and total particle density of species assuming that the hadrons are point like particles:
| (1) | |||||
| (2) | |||||
| (3) |
where
| (4) |
and is the degeneracy of each hadron, is the mass, and , , and are the baryon number, strangeness and electric charge carried by each hadron. Additionally, , , and are the corresponding chemical potentials for each conserved charge.
The other thermodynamic quantities follow
| (5) |
where is the entropy, where is the net density, and is the energy density. Note that for the rest of the paper we will abbreviate .
In this paper we first compare two different lists of hadrons from the Particle Data Group, one from 2005 (PDG05) and another developed in Ref. Alba et al. (2017) from 2016 that includes all *-**** states (PDG16+).
II.1 Excluded Volume
One method for taking into account repulsive interactions is the excluded volume approach Rischke et al. (1991) wherein each hadron is delegated a volume , and the excluded volume pressure can then be written as
| (6) |
which can be solved analytically using the Lambert W function
| (7) |
where is defined in Eq. (3). The remaining thermodynamic quantities can be obtained using the thermodynamic relationships from Eq. (5) and are denoted with a subscript for excluded volume. Here we are assuming that all particles have the same volume. In fact, one could relax that assumption as in Ref. Albright et al. (2014) or even consider a multicomponent van der Waals Vovchenko et al. (2017b), but we leave this for future work.
We obtain the effective hard-core volume from , where is the effective core radius. The point-like thermodynamic properties in Eqs. (1-5) can be then restored with .
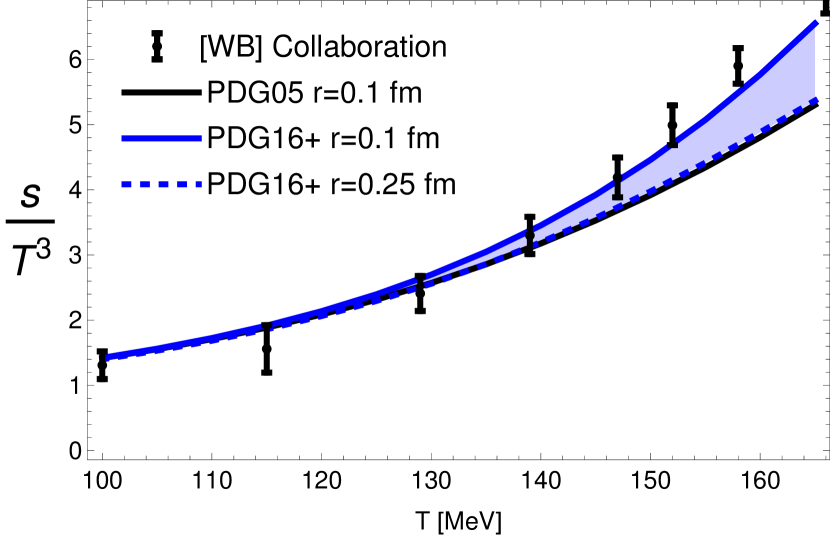
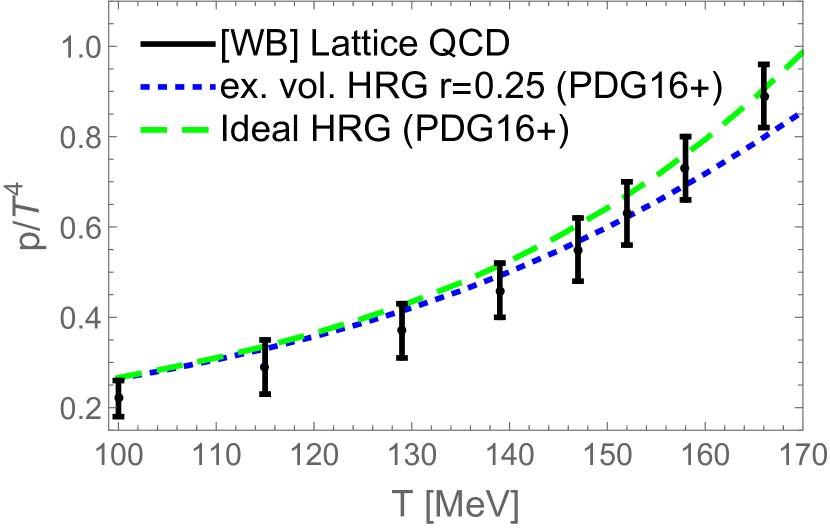
In the excluded volume calculations, there is always the issue of constraining the volume size, since it is an unconstrained free parameter. In an attempt to constrain the hard core radius, we vary such that is fits within lattice QCD error-bars up to MeV using the entropy from lattice QCD results shown in Fig. 1 for the entropy and in Fig. 2 for the pressure. We find that, for the PDG05, there are so few resonances that the largest possible excluded volume that we can use corresponds to a radius fm, whereas for the PDG16+ we have significantly more resonances and we can accommodate an excluded volume with a radius up to fm. Beyond this value, we can no longer reproduce the lattice QCD results within error bars. A quick comment on this result compared to previous papers Gorenstein et al. (2007); Noronha-Hostler et al. (2012) is that here we use the most up-to-date lattice QCD results, whereas in previous work Gorenstein et al. (2007) the lattice QCD results were not yet in the continuum limit and were, therefore, much lower in the confined phase (see e.g., Fig 18 from Borsanyi et al. (2010a)) yielding a larger extracted excluded volume. With current continuum extrapolated lattice results and the most up-to-date particle list, we do not find a need for a large excluded volume. Additionally, in Ref. Noronha-Hostler et al. (2012) Hagedorn resonances were added beyond the PDG, which required a larger excluded volume. This result still holds: if more resonances were eventually measured, a larger excluded would become necessary. While in this work we only explore a single excluded volume, other types of interactions and/or volumes that vary with the hadron mass or flavor content Alba et al. (2018b) would lead to different conclusions and may be relevant at large . We leave this extension for future work.
II.2 Shear Viscosity
At vanishing baryon density, an excluded volume description has been used in Refs. Gorenstein et al. (2007); Noronha-Hostler et al. (2012) to estimate within the hadronic phase. We extend here this formalism to finite :
| (8) |
assuming – as mentioned earlier – a single radius for all species. Note that, in this case, the following relationship between number densities holds:
| (9) |
i.e., one can exchange the excluded volume number density ratio and the ideal gas number density ratio. If this assumption is relaxed, and must be used in Eq. (8).
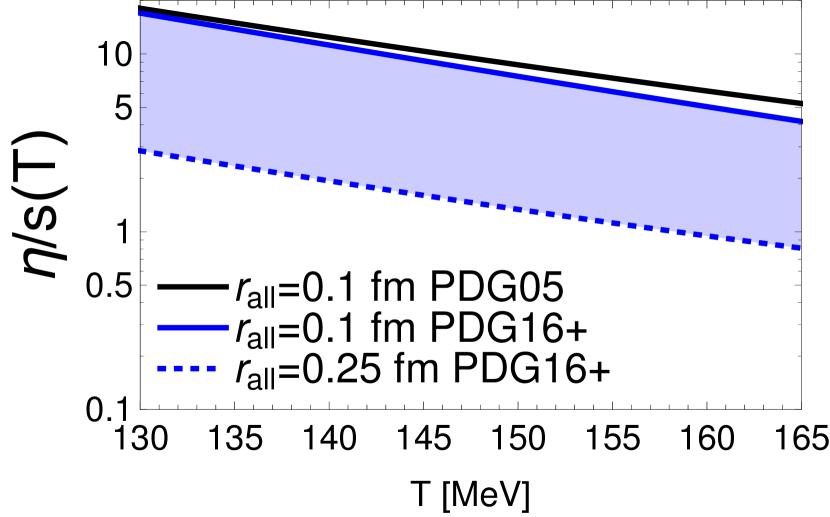
After constraining the radius , it is possible to calculate as shown in Fig. 3. Using the PDG05 list, we find that is extremely large and is not remotely able to reach the estimate from the KSS bound Kovtun et al. (2005). Because of the larger number of states present in the PDG16+ list, a significant decrease in occurs, which brings it down to at T=165 MeV and at T=199 MeV.
Our next step is to connect to the deconfined phase from Refs. Christiansen et al. (2015); Dubla et al. (2018). In order to avoid confusion, we first define the following temperatures:
-
•
: Pseudo-critical temperature, i.e., the temperature where the minimum of is reached for a fixed ;
-
•
: Switching temperature where the connection between and occurs. This might correspond to a lower temperature ;
-
•
: Chiral transition line temperature, which varies with . At vanishing chemical potential one has ;
- •
-
•
: critical temperature, in the case where there is a critical point (the critical point has a corresponding as well).
Since the value is still larger than what one would expect from comparisons of viscous hydrodynamics to experimental data Bernhard et al. (2016), we propose the following solution:
-
•
Assume a higher pseudo-critical temperature for shear viscosity. This is not an unreasonable assumption in light of Refs. Christiansen et al. (2015); Rougemont et al. (2017); Dubla et al. (2018); Everett et al. (2020), wherein the minimum is found around MeV. This leads to a lower in the hadronic phase of ;
-
•
Renormalize the minimum to ;
-
•
Utilize the parametrized from Ref. Dubla et al. (2018) above , which we also normalize to . Then, in the deconfined phase we have:
(10) where the function reads:
(11) the constants , , , and the exponents , , (where is the number of flavors), and is an overall normalization constant that we need to ensure the correct normalization at and .
This allows us to build a at that has a temperature dependence at least motivated by the HRG model (even if the overall magnitude is not).
We must also implement a finite dependence, which is somewhat non-trivial because it depends on the existence and location of a critical point. Subtle differences appear when only a cross-over or a critical point are present in the phase diagram. We also must state quite clearly, that we do not incorporate any critical scaling of the shear viscosity within this framework. However, since the shear viscosity scales as where is the number of spatial dimensions (in comparison the bulk viscosity scales as Monnai et al. (2017)), we argue that criticality would not considerably affect the shear viscosity. What in turn will affect the shear viscosity is the exact profile of the line of pseudo-critical temperatures , i.e. the location of the minimum of across the phase diagram. For this reason, in the following we consider very different choices depending on whether only a cross-over or a critical point are present.
II.3 Cross-over
The implementation of a cross-over phase transition is straightforward. We test two different approaches: a sharp cross-over vs. a smooth cross-over. In both cases we connect to .
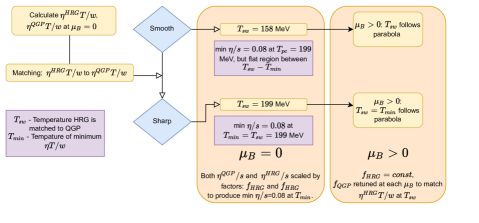
One of the main purposes of this work is to construct a temperature-dependent shear viscosity over enthalpy ratio (recall , which simplifies to at ). In fact, we would like to construct a shear viscosity that can vary across the entire 4-dimensional QCD phase diagram relevant to heavy-ion collisions, i.e. spanning over . Unfortunately, such a model does not exist in the QGP phase beyond Ref. Rougemont et al. (2017), although the authors of Ref. Christiansen et al. (2015) may eventually incorporate a dependence on the baryon chemical potential, which would be quite useful. For this reason, in this paper we let the behavior of the HRG model drive the -dependence of the shear viscosity as follows (a flow chart of this procedure is shown in Fig. 4). We reserve for future work the extension to the full , which we can anticipate will further influence hydrodynamic trajectories Monnai et al. (2021).
First, we calculate the excluded volume shear viscosity across . The enthalpy is then calculated once again in the HRG model with the mass-dependent volume corrections. With the simple assumption one finds that, at large , there is a suppression in , which has already been demonstrated in a number of previous papers Denicol et al. (2013); Kadam and Mishra (2014).
As previously discussed, we do not have a good theory to describe the shear viscosity of the QGP phase across . Thus, we simply take the same parameterization form as in Eq. (10), and vary the overall magnitude as well as the switching temperature with . Everything remains the same as in Eq. (10), except for and . In order to determine and we need to determine the temperature at which the matching of the in the confined and deconfined phases occurs. We use a Taylor expansion for the switching temperature such that:
| (12) |
Note that this has the same format as what is used in the lattice QCD community for the chiral phase transition. The values we employ for the chiral phase transition are Bellwied et al. (2015); Borsanyi et al. (2020): , , and . However, there is no reason to assume that the minimum of should occur exactly at the chiral transition temperature ; we then study two different scenarios with a cross-over phase transition. First, we define a “smooth" cross-over in which we identify exactly with the chiral transition line, which in turn leads to a flat region at . Second, we contrast this with a “sharp" cross-over where we set , which leads to a clear kink in at .
| Transition Parameter Values | |||||
| Transition | |||||
| CO smooth | Crossover | 158 | 158 | 0.0149 | 0.00032 |
| CO sharp | Crossover | 199 | 158 | 0.0149 | 0.00032 |
| CP(143,350) | Crossover | 199 | 199 | 0.08 | 0.005 |
| First Order | 158 | 158 | 0.0149 | 0.001 | |
| CP(89,724) | Crossover | 199 | 199 | 0.038 | 0.0005 |
| First Order | 158 | 158 | 0.0149 | 0.00032 | |
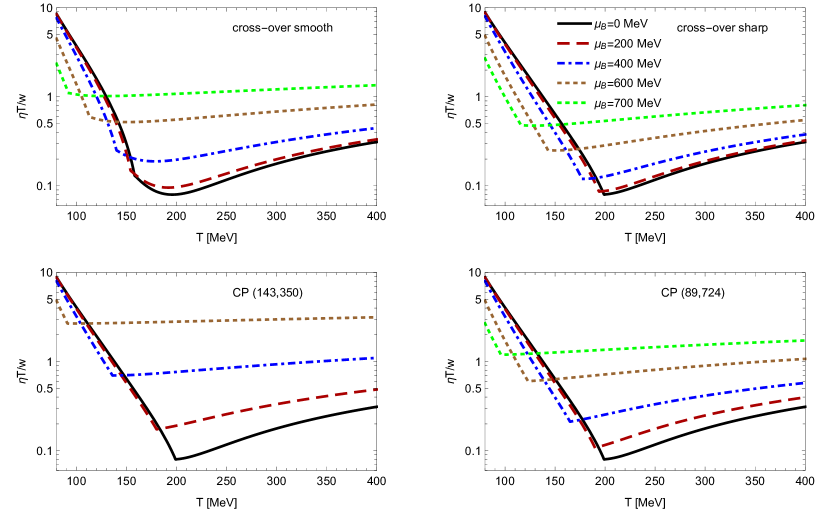
The final results for are shown in Fig. 5. We can clearly see that, at vanishing chemical potential, the has a longer flat region in the case of a “smooth” crossover. This small difference at has large effects at finite as well. In fact, the smooth crossover leads to a much larger across all values, because the matching to the HRG occurs at lower temperatures, hence leading to a strong -dependence. In contrast, matching the HRG model results at higher temperatures (as in the case of a sharp cross-over) leads to a weaker -dependence, which in turn significantly decreases at large . This can be seen even more clearly in Fig. 6, where the minimum value of is approximately twice as large for the smooth cross-over than for the sharp one at around MeV. This indicates that the exact temperature for the switch from the deconfined to a confined phase has a significant effect on . In other words, the transition line for the minimum of , specifically how that varies with , plays a large role in the overall magnitude of .
II.4 Critical point
In the case of a critical point, we need two separate descriptions: one for the cross-over regime and one for the first-order phase transition line. At low , in the cross-over phase, we use MeV from Eq. (12), but adjust the and parameters to ensure that the minimum of hits the critical point. Once the first-order phase transition is reached, we readjust the parameters in Eq. (12) such that the first-order phase transition falls onto the chiral transition line described by MeV, , and .
The results for our critical point scenarios are shown in Fig. 5. The closer the critical point lies to , the more steeply the minimum of must drop to reach the critical point. Since the low-T region of has a stronger dependence on , the magnitude of must increase dramatically. We conclude that if a critical point is present at low , the shear viscosity (at least with our setup) must be quite large. In contrast, if the critical point is far from the axis, such as in Ref. Critelli et al. (2017), then the minimum of can decrease more gradually across , which in turn leads to a smaller overall at finite . It is suggestive to compare the minimum of across for our two setups with a critical point, as shown in Fig. 6. We observe that the critical point at low has a significantly larger minimum . The kink in Fig. 6 arises at the critical point because the transition line changes to the chiral transition one once the first-order regime is reached.
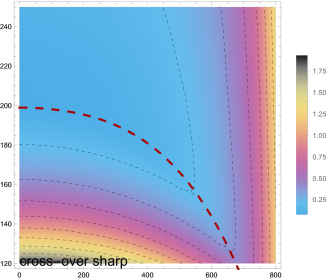
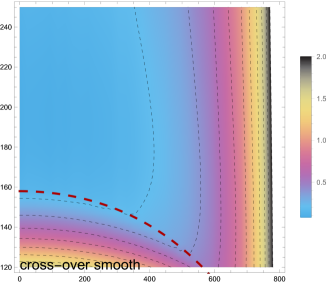
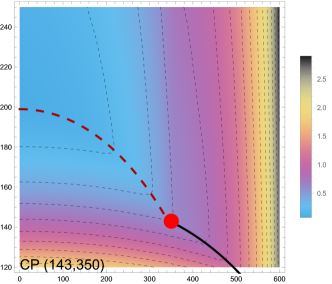
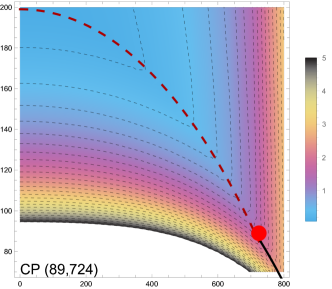
Finally, in Fig. 7 we show density plots of to illustrate its different profiles. In the two cross-over setups, one can see clear differences in the trajectories of the minimum of across the phase diagram. In the two cases with a critical point (shown as a red dot), one can clearly see the difference in the transitions lines between the cross-over and the first order phase transition line.
 |
 |
 |
 |
III Fluctuating Hydrodynamics at GeV
Because of event-by-event fluctuations from the initial conditions, large variations in the local temperature in a quickly expanding and cooling QGP droplet, and entropy creation due to viscosity, it can be somewhat misleading to argue that a specific beam energy only probes a single isentropic (where the ratio of entropy over baryon number ) trajectory Dore et al. (2020). Rather the expanding, cooling fireball probes a range of temperatures over time as shown in Ref. Shen and Schenke (2019). Furthermore, it has been argued that applying different cuts in rapidity could provide a method for fine tuning at a fixed beam energy Brewer et al. (2018). Thus, in order to determine the ranges explored at a set beam energy, we first determine the path across taken by AuAu collision with energy GeV.
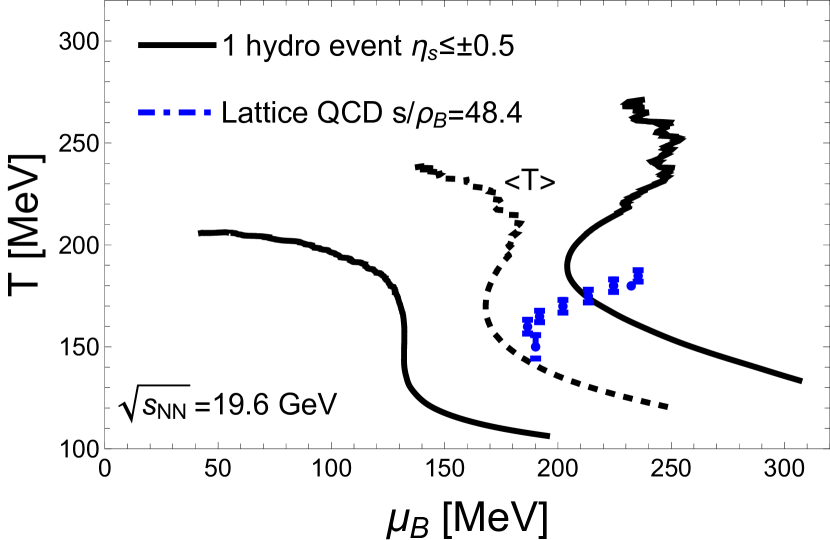
First, we compare the commonly used isentropes calculated from lattice QCD to the evolution of a single hydrodynamic event from Ref. Shen and Schenke (2019) at GeV. From hydrodynamics it is possible to calculate the evolution of the mean temperature and chemical potential , which is shown in Fig. 8. Realistically, entropy is produced because of the finite viscosity of the Quark Gluon Plasma (both bulk and shear viscosity contribute to entropy production), so one does not expect the relationship to actually hold. Close to the phase transition a minimum of is present, so it is not surprising that exactly at this point the lattice QCD isentrope most closely matches the hydrodynamic calculation. It appears that the lattice QCD isentropes can provide reasonable estimates at the phase transition, but not at higher temperatures.
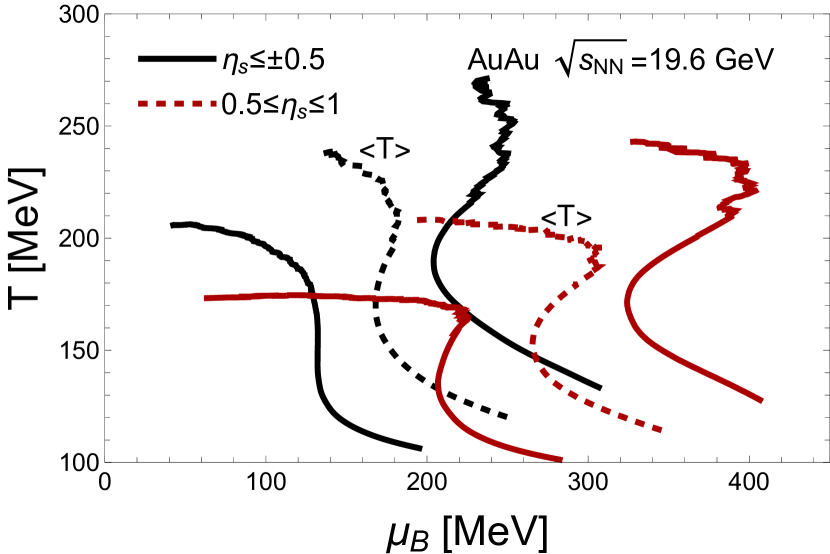
Additionally, in Ref. Brewer et al. (2018) it was pointed out that forward rapidity can be used to fine tune in order to refine the search for the critical point. This does indeed appear to be the case, as shown in Fig. 9, so we expect to also see changes in the ranges scanned at forward rapidity. In Fig. 9, two different rapidity cuts are shown: and (note that rapidity is typically denoted , so we add the subscript to indicate spacetime rapidity and avoid confusion with viscosity).
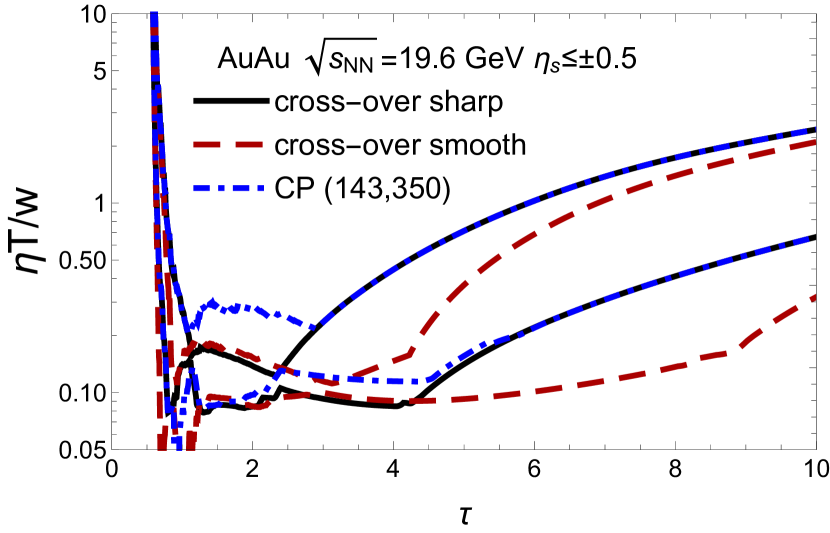
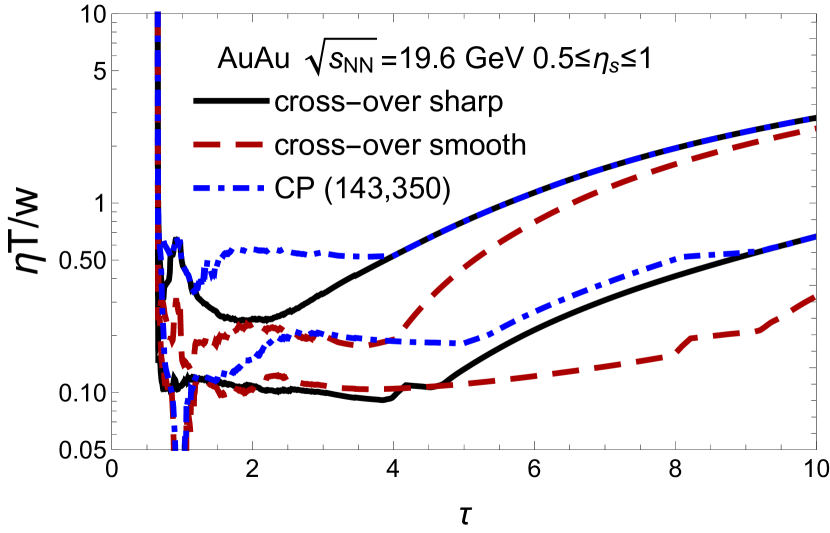
Finally, in Fig. 10 we compare the values of probed across standard deviations from the mean and at the rapidity cuts and . Here we only compare our setups with a crossover and that with the critical point from Ref. Parotto et al. (2020). We find that, because the average is still relatively low (approximately MeV), the location of the minimum is relatively compatible between the different cases. Because of the longer flat region, the smooth cross-over actually sees a smaller over a longer period of time. In contrast, in the case with a critical point we observe a larger . We find that, at forward rapidity, the Quark Gluon Plasma sees a slightly higher at around fm. Thus we expect that, while forward rapidity does reach large , we also anticipate that it would be farther from equilibrium.
.
IV Influence on trajectories
In this section we give a qualitative idea of the effect of using different profiles on the trajectories taken through the QCD phase diagram by the expanding hydrodynamic system. Here, we only explore the effect of a crossover transition. The hydrodynamic setup is identical to Ref. Dore et al. (2020), other than a replacement of the EoS with the one developed in Ref. Noronha-Hostler et al. (2019) with . This is done in order to compare the effect specifically with a crossover transition. The EoS used here is directly obtained from lattice QCD through a Taylor expansion of the pressure in powers of . The bulk viscosity has the form
| (13) |
so that all of its functional dependence on thermodynamic variables enters through the speed of sound. The hydrodynamic equations exhibit Bjorken symmetry and are readily solved as a set of coupled ODE’s. We compare the sharp vs. smooth cross-over form of to either a constant or an ideal hydrodynamic expansion. For an ideal fluid, entropy is conserved so one can describe that expansion through isentropic trajectories.
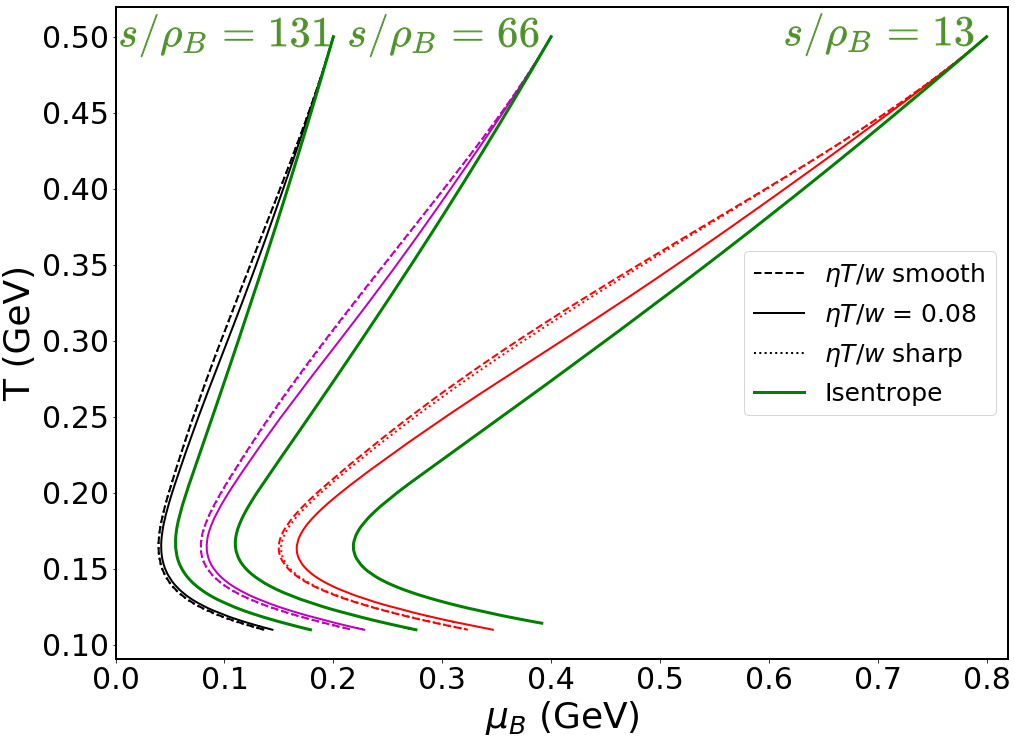
The effect on the trajectories can be seen in Fig. 11, where they all begin at a temperature of MeV, and a chemical potential of MeV. The green lines are isentropes produced by running ideal hydrodynamics given the same initial conditions. The results are consistent with what is shown in Fig. 5. At lower T and , the smooth and sharp shear viscosities behave very similarly, and one would expect the associated hydrodynamic trajectories to look similar if initialized in this region. Hydrodynamic runs that begin at large , on the other hand, are more strongly influenced by the actual profile of , which leads to different trajectoriesDore et al. (2020).
We note that the effect of is mainly to shift the trajectories towards , such that a very small initial is necessary in order to see dramatic effects around the phase transition. For example, we reach here a similar freeze-out point with the initial condition for both crossover profiles, as the hydrodynamic simulation shown in Fig. 8 where the isentropic trajectory corresponded to . This is not surprising, because ideal hydrodynamics has maximum entropy, whereas a viscous system produces entropy over time, so that entropy production drives the system from a smaller to a larger .
We also compare to a constant to show the overall effect of having a dependence on and . It can be seen in Fig. 11 that, the higher the initial chemical potentials, the more the associated trajectories deviate from each other. It becomes apparent that, at higher , one becomes more sensitive to the and dependence of as well. Nonetheless, any viscosity (even constant ) causes substantial deviations from the isentropic lines. We conclude that heavy-ion collisions at low beam energies are more affected by the and dependence of and we anticipate large deviations from isentropic trajectories, especially if the profile deviates substantially from a constant value. There are some indications of this from Bayesian analyses Auvinen et al. (2018), which imply that extreme caution should be exercised about any conclusions drawn from work based on ideal hydrodynamics at large baryon densities (see Ref. Dexheimer et al. (2020) for further discussion).
V Conclusions
We used a hadron resonance gas picture with a state-of-the-art list of resonances to study the QCD shear viscosity at large baryon densities. We developed a phenomenological approach to produce profiles of on the QCD phase diagram, which can be used in relativistic viscous hydrodynamic codes simulating collisions at the RHIC Beam Energy Scan. We considered four variations: a “smooth” or “sharp” crossover, and a critical point at MeV or MeV. We have demonstrated that the trajectories followed by hydrodynamic evolution are sensitive to different behavior in the shear viscosity. It is clear that a shear viscosity with a functional dependence on thermodynamic variables may probe different areas of the phase diagram than a constant one, especially if the differences are large at early times. We note that this framework does not incorporate critical scaling in , since this is expected to be extremely small Monnai et al. (2017), but does ensure that its inflection point (i.e. minimum of ) does converge to the critical point.
Using this framework we found that the minimum increases with and that this effect is strongly influenced by the exact location of the transition line one chooses for the minimum of . For instance, a critical point at low would dramatically increase the magnitude of compared to a critical point at larger . We showed that the trajectories from heavy-ion collisions that pass through the QCD phase diagram would have significant deviations from isentropic lines, the larger the chemical potential is. The effect of viscosity is mainly to push the trajectories towards lower at freeze-out. This implies that a significantly smaller value of is needed as an initial condition, in order to reach the same point of freeze-out compared to an ideal hydrodynamics system. We only consider a cross-over phase transition for this particular part of the study but the presence of a critical point would only enhance this effect due to the critical scaling of bulk viscosity, as shown already in Ref. Dore et al. (2020). We also expect early times ( fm/c) to be the regime probing the minimum of .
VI Acknowledgements
This material is based upon work supported by the National Science Foundation under grant no. PHY-1654219 and by the U.S. Department of Energy, Office of Science, Office of Nuclear Physics, within the framework of the Beam Energy Scan Theory (BEST) Topical Collaboration. We also acknowledge the support from the Center of Advanced Computing and Data Systems at the University of Houston. J.N.H. acknowledges support from the US-DOE Nuclear Science Grant No. DE-SC0020633 and from the Illinois Campus Cluster, a computing resource that is operated by the Illinois Campus Cluster Program (ICCP) in conjunction with the National Center for Supercomputing Applications (NCSA), and which is supported by funds from the University of Illinois at Urbana-Champaign. E.M. was supported by the National Science Foundation via grant PHY-1560077. P.P. acknowledges support by the DFG grant SFB/TR55.
References
- Aoki et al. (2006) Y. Aoki, Z. Fodor, S. D. Katz, and K. K. Szabo, Phys. Lett. B 643, 46 (2006), arXiv:hep-lat/0609068 .
- Borsanyi et al. (2010a) S. Borsanyi, G. Endrodi, Z. Fodor, A. Jakovac, S. D. Katz, S. Krieg, C. Ratti, and K. K. Szabo, JHEP 11, 077 (2010a), arXiv:1007.2580 [hep-lat] .
- Borsanyi et al. (2010b) S. Borsanyi, Z. Fodor, C. Hoelbling, S. D. Katz, S. Krieg, C. Ratti, and K. K. Szabo (Wuppertal-Budapest), JHEP 09, 073 (2010b), arXiv:1005.3508 [hep-lat] .
- Bazavov et al. (2014) A. Bazavov et al. (HotQCD), Phys. Rev. D 90, 094503 (2014), arXiv:1407.6387 [hep-lat] .
- Borsanyi et al. (2020) S. Borsanyi, Z. Fodor, J. N. Guenther, R. Kara, S. D. Katz, P. Parotto, A. Pasztor, C. Ratti, and K. K. Szabo, Phys. Rev. Lett. 125, 052001 (2020), arXiv:2002.02821 [hep-lat] .
- Ratti (2018) C. Ratti, Rept. Prog. Phys. 81, 084301 (2018), arXiv:1804.07810 [hep-lat] .
- Guenther (2020) J. N. Guenther, (2020), arXiv:2010.15503 [hep-lat] .
- Endrodi et al. (2011) G. Endrodi, Z. Fodor, S. D. Katz, and K. K. Szabo, JHEP 04, 001 (2011), arXiv:1102.1356 [hep-lat] .
- Rougemont et al. (2017) R. Rougemont, R. Critelli, J. Noronha-Hostler, J. Noronha, and C. Ratti, Phys. Rev. D 96, 014032 (2017), arXiv:1704.05558 [hep-ph] .
- Grefa et al. (2021) J. Grefa, J. Noronha, J. Noronha-Hostler, I. Portillo, C. Ratti, and R. Rougemont, (2021), arXiv:2102.12042 [nucl-th] .
- Bellwied et al. (2019) R. Bellwied, J. Noronha-Hostler, P. Parotto, I. Portillo Vazquez, C. Ratti, and J. M. Stafford, Phys. Rev. C 99, 034912 (2019), arXiv:1805.00088 [hep-ph] .
- Noronha-Hostler et al. (2016a) J. Noronha-Hostler, R. Bellwied, J. Gunther, P. Parotto, A. Pasztor, I. Portillo Vazquez, and C. Ratti, (2016a), arXiv:1607.02527 [hep-ph] .
- Kovtun et al. (2005) P. Kovtun, D. T. Son, and A. O. Starinets, Phys. Rev. Lett. 94, 111601 (2005), arXiv:hep-th/0405231 .
- Kats and Petrov (2009) Y. Kats and P. Petrov, JHEP 01, 044 (2009), arXiv:0712.0743 [hep-th] .
- Brigante et al. (2008a) M. Brigante, H. Liu, R. C. Myers, S. Shenker, and S. Yaida, Phys. Rev. D 77, 126006 (2008a), arXiv:0712.0805 [hep-th] .
- Brigante et al. (2008b) M. Brigante, H. Liu, R. C. Myers, S. Shenker, and S. Yaida, Phys. Rev. Lett. 100, 191601 (2008b), arXiv:0802.3318 [hep-th] .
- Buchel et al. (2009) A. Buchel, R. C. Myers, and A. Sinha, JHEP 03, 084 (2009), arXiv:0812.2521 [hep-th] .
- Critelli et al. (2014) R. Critelli, S. I. Finazzo, M. Zaniboni, and J. Noronha, Phys. Rev. D 90, 066006 (2014), arXiv:1406.6019 [hep-th] .
- Finazzo et al. (2016) S. I. Finazzo, R. Critelli, R. Rougemont, and J. Noronha, Phys. Rev. D 94, 054020 (2016), [Erratum: Phys.Rev.D 96, 019903 (2017)], arXiv:1605.06061 [hep-ph] .
- Romatschke and Romatschke (2007) P. Romatschke and U. Romatschke, Phys. Rev. Lett. 99, 172301 (2007), arXiv:0706.1522 [nucl-th] .
- Bozek (2012) P. Bozek, Phys. Rev. C 85, 034901 (2012), arXiv:1110.6742 [nucl-th] .
- Heinz and Snellings (2013) U. Heinz and R. Snellings, Ann. Rev. Nucl. Part. Sci. 63, 123 (2013), arXiv:1301.2826 [nucl-th] .
- Luzum and Petersen (2014) M. Luzum and H. Petersen, J. Phys. G 41, 063102 (2014), arXiv:1312.5503 [nucl-th] .
- Niemi et al. (2016) H. Niemi, K. J. Eskola, and R. Paatelainen, Phys. Rev. C 93, 024907 (2016), arXiv:1505.02677 [hep-ph] .
- Noronha-Hostler et al. (2016b) J. Noronha-Hostler, M. Luzum, and J.-Y. Ollitrault, Phys. Rev. C 93, 034912 (2016b), arXiv:1511.06289 [nucl-th] .
- McDonald et al. (2017) S. McDonald, C. Shen, F. Fillion-Gourdeau, S. Jeon, and C. Gale, Phys. Rev. C 95, 064913 (2017), arXiv:1609.02958 [hep-ph] .
- Bernhard et al. (2019) J. E. Bernhard, J. S. Moreland, and S. A. Bass, Nature Phys. 15, 1113 (2019).
- Alba et al. (2018a) P. Alba, V. Mantovani Sarti, J. Noronha, J. Noronha-Hostler, P. Parotto, I. Portillo Vazquez, and C. Ratti, Phys. Rev. C 98, 034909 (2018a), arXiv:1711.05207 [nucl-th] .
- Aarts and Martinez Resco (2002) G. Aarts and J. M. Martinez Resco, JHEP 04, 053 (2002), arXiv:hep-ph/0203177 .
- Borsanyi et al. (2018) S. Borsanyi, Z. Fodor, M. Giordano, S. D. Katz, A. Pasztor, C. Ratti, A. Schaefer, K. K. Szabo, and C. Toth, Balint, Phys. Rev. D 98, 014512 (2018), arXiv:1802.07718 [hep-lat] .
- Noronha-Hostler et al. (2009) J. Noronha-Hostler, J. Noronha, and C. Greiner, Phys. Rev. Lett. 103, 172302 (2009), arXiv:0811.1571 [nucl-th] .
- Pal (2010) S. Pal, Phys. Lett. B 684, 211 (2010), arXiv:1001.1585 [nucl-th] .
- Khvorostukhin et al. (2010) A. S. Khvorostukhin, V. D. Toneev, and D. N. Voskresensky, Nucl. Phys. A 845, 106 (2010), arXiv:1003.3531 [nucl-th] .
- Tawfik and Wahba (2010) A. Tawfik and M. Wahba, Annalen Phys. 522, 849 (2010), arXiv:1005.3946 [hep-ph] .
- Alba et al. (2015) P. Alba, R. Bellwied, M. Bluhm, V. Mantovani Sarti, M. Nahrgang, and C. Ratti, Phys. Rev. C 92, 064910 (2015), arXiv:1504.03262 [hep-ph] .
- Ratti et al. (2011) C. Ratti, S. Borsanyi, Z. Fodor, C. Hoelbling, S. D. Katz, S. Krieg, and K. K. Szabo (Wuppertal-Budapest), Nucl. Phys. A 855, 253 (2011), arXiv:1012.5215 [hep-lat] .
- Tiwari et al. (2012) S. K. Tiwari, P. K. Srivastava, and C. P. Singh, Phys. Rev. C 85, 014908 (2012), arXiv:1111.2406 [hep-ph] .
- Noronha-Hostler et al. (2012) J. Noronha-Hostler, J. Noronha, and C. Greiner, Phys. Rev. C 86, 024913 (2012), arXiv:1206.5138 [nucl-th] .
- Kadam and Mishra (2014) G. P. Kadam and H. Mishra, Nucl. Phys. A 934, 133 (2014), arXiv:1408.6329 [hep-ph] .
- Kadam and Mishra (2015) G. P. Kadam and H. Mishra, Phys. Rev. C 92, 035203 (2015), arXiv:1506.04613 [hep-ph] .
- Kadam and Mishra (2016) G. P. Kadam and H. Mishra, Phys. Rev. C 93, 025205 (2016), arXiv:1509.06998 [hep-ph] .
- Kadam and Pawar (2019) G. Kadam and S. Pawar, Adv. High Energy Phys. 2019, 6795041 (2019), arXiv:1802.01942 [hep-ph] .
- Mohapatra et al. (2019) R. K. Mohapatra, H. Mishra, S. Dash, and B. K. Nandi, (2019), arXiv:1901.07238 [hep-ph] .
- Wesp et al. (2011) C. Wesp, A. El, F. Reining, Z. Xu, I. Bouras, and C. Greiner, Phys. Rev. C 84, 054911 (2011), arXiv:1106.4306 [hep-ph] .
- Ozvenchuk et al. (2013) V. Ozvenchuk, O. Linnyk, M. I. Gorenstein, E. L. Bratkovskaya, and W. Cassing, Phys. Rev. C 87, 064903 (2013), arXiv:1212.5393 [hep-ph] .
- Rose et al. (2018) J. B. Rose, J. M. Torres-Rincon, A. Schäfer, D. R. Oliinychenko, and H. Petersen, Phys. Rev. C 97, 055204 (2018), arXiv:1709.03826 [nucl-th] .
- Rais et al. (2020) J. Rais, K. Gallmeister, and C. Greiner, Phys. Rev. D 102, 036009 (2020), arXiv:1909.04522 [hep-ph] .
- Sahu and Sahoo (2020) D. Sahu and R. Sahoo, (2020), arXiv:2006.04185 [hep-ph] .
- Heffernan et al. (2020) M. Heffernan, S. Jeon, and C. Gale, Phys. Rev. C 102, 034906 (2020), arXiv:2005.12793 [hep-ph] .
- Haas et al. (2014) M. Haas, L. Fister, and J. M. Pawlowski, Phys. Rev. D 90, 091501 (2014), arXiv:1308.4960 [hep-ph] .
- Christiansen et al. (2015) N. Christiansen, M. Haas, J. M. Pawlowski, and N. Strodthoff, Phys. Rev. Lett. 115, 112002 (2015), arXiv:1411.7986 [hep-ph] .
- Dubla et al. (2018) A. Dubla, S. Masciocchi, J. M. Pawlowski, B. Schenke, C. Shen, and J. Stachel, Nucl. Phys. A 979, 251 (2018), arXiv:1805.02985 [nucl-th] .
- Ghiglieri et al. (2018) J. Ghiglieri, G. D. Moore, and D. Teaney, JHEP 03, 179 (2018), arXiv:1802.09535 [hep-ph] .
- Denicol et al. (2013) G. S. Denicol, C. Gale, S. Jeon, and J. Noronha, Phys. Rev. C 88, 064901 (2013), arXiv:1308.1923 [nucl-th] .
- Demir and Bass (2009) N. Demir and S. A. Bass, Phys. Rev. Lett. 102, 172302 (2009), arXiv:0812.2422 [nucl-th] .
- Critelli et al. (2017) R. Critelli, J. Noronha, J. Noronha-Hostler, I. Portillo, C. Ratti, and R. Rougemont, Phys. Rev. D 96, 096026 (2017), arXiv:1706.00455 [nucl-th] .
- Vovchenko et al. (2017a) V. Vovchenko, M. I. Gorenstein, and H. Stoecker, Phys. Rev. Lett. 118, 182301 (2017a), arXiv:1609.03975 [hep-ph] .
- Huovinen and Petreczky (2018) P. Huovinen and P. Petreczky, Phys. Lett. B 777, 125 (2018), arXiv:1708.00879 [hep-ph] .
- Alba et al. (2017) P. Alba et al., Phys. Rev. D 96, 034517 (2017), arXiv:1702.01113 [hep-lat] .
- Bellwied et al. (2020) R. Bellwied, S. Borsanyi, Z. Fodor, J. N. Guenther, J. Noronha-Hostler, P. Parotto, A. Pasztor, C. Ratti, and J. M. Stafford, Phys. Rev. D 101, 034506 (2020), arXiv:1910.14592 [hep-lat] .
- Alba et al. (2020) P. Alba, V. M. Sarti, J. Noronha-Hostler, P. Parotto, I. Portillo-Vazquez, C. Ratti, and J. M. Stafford, Phys. Rev. C 101, 054905 (2020), arXiv:2002.12395 [hep-ph] .
- Parotto et al. (2020) P. Parotto, M. Bluhm, D. Mroczek, M. Nahrgang, J. Noronha-Hostler, K. Rajagopal, C. Ratti, T. Schäfer, and M. Stephanov, Phys. Rev. C 101, 034901 (2020), arXiv:1805.05249 [hep-ph] .
- Rischke et al. (1991) D. H. Rischke, M. I. Gorenstein, H. Stoecker, and W. Greiner, Z. Phys. C 51, 485 (1991).
- Albright et al. (2014) M. Albright, J. Kapusta, and C. Young, Phys. Rev. C 90, 024915 (2014), arXiv:1404.7540 [nucl-th] .
- Vovchenko et al. (2017b) V. Vovchenko, A. Motornenko, P. Alba, M. I. Gorenstein, L. M. Satarov, and H. Stoecker, Phys. Rev. C 96, 045202 (2017b), arXiv:1707.09215 [nucl-th] .
- Gorenstein et al. (2007) M. I. Gorenstein, M. Hauer, and O. N. Moroz, , 214 (2007), arXiv:0708.0137 [nucl-th] .
- Alba et al. (2018b) P. Alba, V. Vovchenko, M. I. Gorenstein, and H. Stoecker, Nucl. Phys. A 974, 22 (2018b), arXiv:1606.06542 [hep-ph] .
- Bernhard et al. (2016) J. E. Bernhard, J. S. Moreland, S. A. Bass, J. Liu, and U. Heinz, Phys. Rev. C 94, 024907 (2016), arXiv:1605.03954 [nucl-th] .
- Everett et al. (2020) D. Everett et al. (JETSCAPE), (2020), arXiv:2011.01430 [hep-ph] .
- Monnai et al. (2017) A. Monnai, S. Mukherjee, and Y. Yin, Phys. Rev. C 95, 034902 (2017), arXiv:1606.00771 [nucl-th] .
- Monnai et al. (2021) A. Monnai, B. Schenke, and C. Shen, (2021), arXiv:2101.11591 [nucl-th] .
- Bellwied et al. (2015) R. Bellwied, S. Borsanyi, Z. Fodor, J. Günther, S. D. Katz, C. Ratti, and K. K. Szabo, Phys. Lett. B 751, 559 (2015), arXiv:1507.07510 [hep-lat] .
- Dore et al. (2020) T. Dore, J. Noronha-Hostler, and E. McLaughlin, Phys. Rev. D 102, 074017 (2020), arXiv:2007.15083 [nucl-th] .
- Shen and Schenke (2019) C. Shen and B. Schenke, Nucl. Phys. A 982, 411 (2019), arXiv:1807.05141 [nucl-th] .
- Brewer et al. (2018) J. Brewer, S. Mukherjee, K. Rajagopal, and Y. Yin, Phys. Rev. C 98, 061901 (2018), arXiv:1804.10215 [hep-ph] .
- Noronha-Hostler et al. (2019) J. Noronha-Hostler, P. Parotto, C. Ratti, and J. M. Stafford, Phys. Rev. C 100, 064910 (2019), arXiv:1902.06723 [hep-ph] .
- Auvinen et al. (2018) J. Auvinen, J. E. Bernhard, S. A. Bass, and I. Karpenko, Phys. Rev. C 97, 044905 (2018), arXiv:1706.03666 [hep-ph] .
- Dexheimer et al. (2020) V. Dexheimer, J. Noronha, J. Noronha-Hostler, C. Ratti, and N. Yunes, (2020), arXiv:2010.08834 [nucl-th] .
- Bazavov et al. (2019) A. Bazavov et al. (HotQCD), Phys. Lett. B 795, 15 (2019), arXiv:1812.08235 [hep-lat] .