Lyman continuum leakage from low-mass galaxies with 108 M⊙
Abstract
We present observations with the Cosmic Origins Spectrograph onboard the Hubble Space Telescope of nine low-mass star-forming galaxies at redshifts, , in the range 0.3179 – 0.4524, with stellar masses 108 M⊙ and very high specific star-formation rates sSFR 150 – 630 Gyr-1, aiming to study the dependence of leaking Lyman continuum (LyC) emission on stellar mass and some other characteristics of the galaxy. We detect LyC emission in four out of nine galaxies with escape fractions, (LyC), in the range of 11 – 35 per cent, and establish upper limits for (LyC) in the remaining five galaxies. We observe a narrow Ly emission line with two peaks in seven galaxies and likely more complex Ly profiles in the two remaining galaxies. The velocity separation between the peaks varies in the range from 229 km s-1 to 512 km s-1. Our additional data on low-mass galaxies confirm and strengthen the tight anti-correlation between (LyC) and found for previous low-redshift galaxy samples with higher stellar masses. remains the best indirect indicator of LyC leakage. It is better than O32 on which (LyC) depends weakly, with a large scatter. Finally, contrary to expectations, we find no increase of (LyC) with decreasing galaxy stellar mass .
keywords:
(cosmology:) dark ages, reionisation, first stars — galaxies: abundances — galaxies: dwarf — galaxies: fundamental parameters — galaxies: ISM — galaxies: starburst1 Introduction
The nature of the main contributors to the reionisation of the Universe at redshift 6 is still unknown. Two main types of objects have been proposed, active galactic nuclei (Madau & Haardt, 2015) and star-forming galaxies (SFGs) (e.g. Stark, 2016, and references therein). Several recent studies (Hassan et al., 2018; Mitra, Ferrara & Choudhury, 2013, 2018; Matsuoka et al., 2018; Kulkarni, Worseck & Hennawi, 2019; Wang et al., 2019; Shen et al., 2020) have found that the contribution of AGNs is small. It has been generally thought that, at high redshifts, numerous faint low-mass SFGs were responsible for the bulk of the ionising radiation (Ouchi et al., 2009; Wise & Chen, 2009; Mitra, Ferrara & Choudhury, 2013; Yajima, Choi & Nagamine, 2011; Bouwens et al., 2015; Finkelstein et al., 2019; Lewis et al., 2020), whereas the number of relatively bright SFGs is insufficient to fully ionise the Universe (Steidel, Pettini & Adelberger, 2001; Cowie, Barger & Trouille, 2009; Iwata et al., 2009; Robertson et al., 2013). However, recently Naidu et al. (2020), based on an empirical model of reionisation have found that 5 per cent of bright galaxies with 18 mag and stellar masses /M⊙ 108 contribute 80 per cent of the ionising luminosity, whereas lower-mass galaxies have a minor effect. On the other hand, Meyer et al. (2020), based on the correlation of foreground galaxies with the intergalactic medium (IGM) transmission toward background QSO at the end of reionisation, found that a contribution from faint galaxies is necessary to reproduce the observed decreasing IGM opacity and that reionisation might be driven by different sub-populations of Lyman-break galaxies (LBGs) and Lyman-alpha emitters (LAEs) at .
Additional conditions for galaxies to reionise the Universe require that the escape fraction of their Lyman continuum (LyC) is of the order of 10 – 20 per cent or higher (e.g. Ouchi et al., 2009; Robertson et al., 2013; Dressler et al., 2015; Robertson et al., 2015; Khaire et al., 2016) and that the ionising photon production is 1025.2 Hz erg-1 (e.g. Robertson et al., 2013). One of the differences between these studies and the one by Naidu et al. (2020) is that the former authors assume a constant (LyC), whereas the latter allowed (LyC) to scale with various galaxy properties, e.g. SFR surface density and stellar mass. Finkelstein et al. (2019) looked at how variations in the galaxy properties can translate into different reionisation histories. Specifically, they found that variations in the strongly favour low mass galaxies as the source of reionisation with (LyC) values as low as 5 per cent. Thus, scaling relations with galaxy properties are highly uncertain and adopting different ones can completely change the reionisation history of the Universe. Studying these limitations, e.g. how the escape fraction of the ionising radiation depends on the galaxy’s stellar mass, is among the main motivations of the present study.
The most reliable LyC leakers detected at high redshifts thus far appear to fulfill the condition that (LyC) 10 – 20 per cent. They are the objects Ion2 ( = 3.212, Vanzella et al., 2015; de Barros et al., 2016) with a relative escape fraction (LyC) = 64 per cent, Q1549-C25 ( = 3.212, Shapley et al., 2016) with (LyC) 51 per cent, A2218-Flanking ( 2.5, Bian et al., 2017) with (LyC) 28 – 57 per cent, Ion3 ( 4.0, Vanzella et al., 2018) with (LyC) 60 per cent, Sunburst Arc ( 2.37, Rivera-Thorsen et al., 2019) with (LyC) 20 per cent, a 1.4 galaxy with (LyC) 20 per cent (Saha et al., 2020), two 3.5 galaxies with (LyC) 5 – 73 per cent (Meštric et al., 2020) and two GRB galaxies at 3 with (LyC) 35 and 8 per cent (Vielfaure et al., 2020). Recently, Fletcher et al. (2019) have shown that fifteen 3.1 LyC leakers have escape fractions ranging from 2 per cent to 82 per cent. Marchi et al. (2017, 2018) and Steidel et al. (2018) report LyC detection in stacked spectra of 3 spectra, after careful removal of possible interlopers with the help of HST imaging.
Thus, a small sampling of galaxies near the peak of cosmic star formation history empirically shows that galaxies can emit sufficient ionising photons to reionise the high-redshift Universe.
| Name | R.A.(2000.0) | Dec.(2000.0) | a | b | 12+logO/Hc | O32c | |
|---|---|---|---|---|---|---|---|
| J02320426 | 02:32:16.09 | 04:26:26.72 | 0.45236 | 2539 | 1204 | 7.88 | 14.2 |
| J09194906 | 09:19:55.78 | 49:06:08.75 | 0.40512 | 2227 | 1128 | 7.77 | 11.5 |
| J10465827 | 10:46:01.98 | 58:27:56.95 | 0.39677 | 2172 | 1114 | 8.01 | 4.7 |
| J11213806 | 11:21:18.22 | 38:06:42.80 | 0.31788 | 1675 | 965 | 7.96 | 7.3 |
| J11274610 | 11:27:21.00 | 46:10:42.49 | 0.32230 | 1702 | 974 | 7.84 | 6.0 |
| J12334959 | 12:33:30.78 | 49:59:49.45 | 0.42194 | 2337 | 1156 | 8.11 | 11.0 |
| J13495631 | 13:49:55.10 | 56:31:10.90 | 0.36366 | 1960 | 1054 | 7.91 | 4.0 |
| J13551457 | 13:55:53.46 | 14:57:01.48 | 0.36513 | 1970 | 1057 | 7.77 | 6.1 |
| J14556107 | 14:55:59.57 | 61:07:19.70 | 0.36793 | 1987 | 1062 | 7.91 | 4.1 |
aLuminosity distance in Mpc (NED, Wright, 2006).
bAngular size distance in Mpc (NED, Wright, 2006).
cDerived in this paper from the SDSS spectrum.
| Name | SDSS | GALEX | WISE | ||||||||||
|---|---|---|---|---|---|---|---|---|---|---|---|---|---|
| FUV | NUV | ||||||||||||
| (err) | (err) | (err) | (err) | (err) | (err) | (err) | (err) | (err) | (err) | (err) | |||
| J02320426 | 23.38 | 22.13 | 21.93 | 20.85 | 21.59 | … | 21.26 | … | … | … | … | ||
| (0.73) | (0.11) | (0.11) | (0.06) | (0.45) | (…) | (0.09) | (…) | (…) | (…) | (…) | |||
| J09194906 | 22.33 | 21.97 | 21.95 | 20.78 | 22.32 | 22.54 | 21.92 | … | … | … | … | ||
| (0.27) | (0.08) | (0.10) | (0.06) | (0.62) | (0.21) | (0.12) | (…) | (…) | (…) | (…) | |||
| J10465827 | 21.20 | 21.07 | 21.23 | 20.55 | 20.57 | 21.30 | 21.02 | 17.70 | … | … | … | ||
| (0.09) | (0.04) | (0.06) | (0.05) | (0.16) | (0.03) | (0.02) | (0.18) | (…) | (…) | (…) | |||
| J11213806 | 22.18 | 22.05 | 21.19 | 22.75 | 21.19 | … | … | … | … | … | … | ||
| (0.17) | (0.07) | (0.05) | (0.28) | (0.26) | (…) | (…) | (…) | (…) | (…) | (…) | |||
| J11274610 | 21.97 | 22.31 | 21.63 | 23.31 | 21.63 | … | 22.22 | … | … | … | … | ||
| (0.21) | (0.11) | (0.11) | (0.61) | (0.52) | (…) | (0.39) | (…) | (…) | (…) | (…) | |||
| J12334959 | 21.70 | 21.92 | 21.90 | 20.80 | 21.48 | … | 21.91 | … | … | … | … | ||
| (0.16) | (0.08) | (0.11) | (0.06) | (0.41) | (…) | (0.12) | (…) | (…) | (…) | (…) | |||
| J13495631 | 22.48 | 22.45 | 22.08 | 23.00 | 22.25 | 22.24 | 22.14 | 17.96 | 16.89 | … | … | ||
| (0.29) | (0.11) | (0.11) | (0.38) | (0.61) | (0.36) | (0.32) | (0.19) | (0.27) | (…) | (…) | |||
| J13551457 | 22.05 | 21.62 | 21.40 | 21.66 | 20.73 | … | 21.13 | … | … | … | … | ||
| (0.15) | (0.05) | (0.05) | (0.09) | (0.14) | (…) | (0.10) | (…) | (…) | (…) | (…) | |||
| J14556107 | 21.84 | 21.51 | 21.33 | 21.37 | 21.56 | 21.52 | 21.70 | … | … | … | … | ||
| (0.17) | (0.05) | (0.07) | (0.10) | (0.39) | (0.39) | (0.39) | (…) | (…) | (…) | (…) | |||
| Galaxy | |||||||||||
| Line | J02320426 | J09194906 | J10465827 | J11213806 | J11274610 | ||||||
| a | EWb | a | EWb | a | EWb | a | EWb | a | EWb | ||
| Mg ii | 2796 | 15.84.7 | 10 | 25.86.7 | 19 | 29.64.6 | 11 | 20.74.1 | 10 | 34.48.0 | 26 |
| Mg ii | 2803 | 14.94.7 | 9 | 19.26.3 | 14 | 23.84.3 | 9 | 15.33.6 | 10 | 12.46.6 | 10 |
| O ii | 3727 | 44.56.9 | 68 | 55.04.6 | 127 | 130.68.9 | 101 | 83.66.8 | 130 | 89.316. | 72 |
| H12 | 3750 | 3.83.8 | 5 | 4.21.5 | 17 | 5.64.7 | 4 | … | … | … | … |
| H11 | 3771 | 5.04.3 | 6 | 7.62.0 | 21 | 7.05.5 | 4 | … | … | … | … |
| H10 | 3798 | 6.93.6 | 14 | 6.72.1 | 20 | 7.64.5 | 7 | … | … | … | … |
| H9 | 3836 | 11.14.1 | 21 | 9.71.9 | 28 | 13.04.6 | 19 | 10.33.6 | 16 | 12.27.4 | 13 |
| Ne iii | 3869 | 37.46.5 | 46 | 54.24.5 | 153 | 51.15.3 | 40 | 49.15.1 | 88 | 43.211. | 49 |
| H8+He i | 3889 | 17.85.5 | 23 | 25.33.3 | 55 | 21.26.3 | 15 | 19.44.8 | 87 | 28.59.0 | 40 |
| H7+Ne iii | 3969 | 30.36.7 | 40 | 33.03.5 | 96 | 37.36.0 | 38 | 34.95.1 | 60 | 33.39.7 | 51 |
| H | 4101 | 28.35.7 | 87 | 22.62.9 | 71 | 32.35.4 | 39 | 28.94.8 | 51 | 29.39.5 | 37 |
| H | 4340 | 40.57.5 | 54 | 45.44.2 | 118 | 47.66.0 | 66 | 47.05.2 | 94 | 50.812. | 72 |
| O iii | 4363 | 12.34.3 | 17 | 15.32.6 | 44 | 9.72.8 | 11 | 10.22.7 | 19 | 10.06.3 | 16 |
| He i | 4471 | 6.42.9 | 18 | … | … | … | … | 4.82.3 | 7 | … | … |
| H | 4861 | 100.011. | 227 | 100.06.5 | 435 | 100.08.2 | 170 | 100.08.1 | 317 | 100.017. | 158 |
| O iii | 4959 | 219.616. | 480 | 209.910. | 992 | 199.611. | 358 | 212.612. | 703 | 169.823. | 201 |
| O iii | 5007 | 632.435. | 1977 | 635.022. | 2547 | 613.423. | 1116 | 616.223. | 2222 | 531.745. | 685 |
| He i | 5876 | 10.64.2 | 37 | 10.42.4 | 69 | 12.03.0 | 67 | … | … | … | … |
| H | 6563 | 255.623.c | 472 | 279.214. | 2250 | 259.116.c | 851 | 274.517. | 901 | 273.833. | 1038 |
| N ii | 6583 | … | … | 7.32.0 | 76 | 5.32.8 | 15 | 6.12.4 | 36 | … | … |
| S ii | 6717 | … | … | … | … | … | … | … | … | … | … |
| S ii | 6731 | … | … | … | … | … | … | … | … | … | … |
| (H)intd | 0.0500.109 | 0.0750.061 | 0.0500.074 | 0.0500.074 | 0.0500.156 | ||||||
| (H)MWe | 0.029 | 0.020 | 0.011 | 0.028 | 0.025 | ||||||
| EW(H)b | 22726 | 43526 | 17040 | 31734 | 15826 | ||||||
| (H)f | 4.40.5 | 5.10.4 | 8.80.7 | 7.90.6 | 4.80.8 | ||||||
| Galaxy | |||||||||||
| Line | J12334959 | J13495631 | J13551457 | J14556107 | |||||||
| a | EWb | a | EWb | a | EWb | a | EWb | ||||
| Mg ii | 2796 | 17.63.5 | 10 | 12.74.7 | 14 | 32.97.2 | 28 | 32.26.2 | 13 | ||
| Mg ii | 2803 | 9.63.0 | 4 | 15.15.2 | 9 | 34.87.4 | 15 | 11.64.9 | 11 | ||
| O ii | 3727 | 60.85.9 | 66 | 144.813. | 158 | 100.54.8 | 162 | 140.26.5 | 212 | ||
| H12 | 3750 | … | … | … | … | 4.11.2 | 7 | … | … | ||
| H11 | 3771 | … | … | … | … | 4.41.4 | 8 | … | … | ||
| H10 | 3798 | … | … | … | … | 8.11.6 | 16 | 6.31.5 | 11 | ||
| H9 | 3836 | … | … | … | … | 8.91.6 | 23 | 10.51.8 | 21 | ||
| Ne iii | 3869 | 51.45.4 | 46 | 47.97.2 | 98 | 49.53.3 | 61 | 54.13.8 | 78 | ||
| H8+He i | 3889 | 20.24.5 | 26 | 23.66.5 | 43 | 21.52.2 | 36 | 28.12.8 | 47 | ||
| H7+Ne iii | 3969 | 31.35.4 | 39 | 28.98.2 | 35 | 31.42.7 | 51 | 28.12.8 | 47 | ||
| H | 4101 | 27.94.6 | 49 | 22.95.4 | 55 | 28.52.4 | 86 | 27.52.9 | 67 | ||
| H | 4340 | 50.56.0 | 80 | 44.18.1 | 77 | 47.03.1 | 117 | 48.34.1 | 157 | ||
| O iii | 4363 | 8.52.6 | 11 | 10.93.9 | 13 | 15.31.9 | 41 | 11.31.7 | 29 | ||
| He i | 4471 | … | … | … | … | … | … | 3.91.3 | 7 | ||
| H | 4861 | 100.07.9 | 305 | 100.012. | 172 | 100.04.8 | 265 | 100.05.3 | 278 | ||
| O iii | 4959 | 223.712. | 542 | 190.216. | 450 | 202.77.4 | 597 | 193.17.8 | 747 | ||
| O iii | 5007 | 667.225. | 1424 | 579.432. | 1649 | 614.316. | 1714 | 578.417. | 2049 | ||
| He i | 5876 | … | … | 16.14.9 | 47 | 11.31.8 | 59 | 9.82.0 | 26 | ||
| H | 6563 | 275.117. | 1469 | 282.624. | 1326 | 280.611. | 1851 | 281.912. | 839 | ||
| N ii | 6583 | 11.63.1 | 59 | 7.54.1 | 10 | … | … | … | … | ||
| S ii | 6717 | … | … | 17.55.6 | 41 | 7.51.7 | 49 | 7.32.0 | 18 | ||
| S ii | 6731 | … | … | 13.05.0 | 32 | 5.61.6 | 35 | 8.52.1 | 21 | ||
| (H)intd | 0.0500.073 | 0.1100.100 | 0.1350.045 | 0.0900.050 | |||||||
| (H)MWe | 0.023 | 0.013 | 0.028 | 0.018 | |||||||
| EW(H)b | 30530 | 17236 | 26512 | 27810 | |||||||
| (H)f | 8.70.7 | 5.00.5 | 12.80.6 | 8.70.4 | |||||||
a=100()/(H), where () and (H) are fluxes of emission lines, corrected for both the Milky Way and internal extinction.
bRest-frame equivalent width in Å.
cClipped line.
dInternal galaxy extinction coefficient.
eMilky Way extinction coefficient from the NED.
fExtinction-corrected flux but not corrected for (LyC), in 10-16 erg s-1 cm-2.
| Galaxy | J02320426 | J09194906 | J10465827 | J11213806 | J11274610 |
|---|---|---|---|---|---|
| (O iii), K | 149802380 | 166601440 | 137801680 | 140101580 | 148902300 |
| (O ii), K | 139902070 | 148101190 | 132301510 | 133901410 | 139401750 |
| (S ii), cm-3 | 1010 | 1010 | 1010 | 1010 | 1010 |
| O+/H+105 | 0.500.12 | 0.520.06 | 1.780.31 | 1.100.18 | 1.020.38 |
| O2+/H+105 | 7.050.48 | 5.400.17 | 8.360.57 | 8.110.49 | 5.890.71 |
| O/H105 | 7.550.50 | 5.920.18 | 10.140.65 | 9.200.52 | 6.920.81 |
| 12+log O/H | 7.880.03 | 7.770.01 | 8.010.03 | 7.960.02 | 7.840.05 |
| N+/H+106 | … | 0.550.16 | 0.510.29 | 0.560.24 | … |
| ICF(N)a | … | 10.22 | 5.41 | 7.59 | … |
| N/H106 | … | 5.621.86 | 2.741.63 | 4.281.99 | … |
| log N/O | … | 1.020.14 | 1.570.26 | 1.330.20 | … |
| Ne2+/H+105 | 1.000.24 | 1.080.11 | 1.770.32 | 1.610.27 | 1.180.46 |
| ICF(Ne)a | 1.01 | 1.03 | 1.09 | 1.04 | 1.06 |
| Ne/H105 | 1.010.24 | 1.110.12 | 1.920.35 | 1.670.28 | 1.250.48 |
| log Ne/O | 0.870.11 | 0.730.05 | 0.720.08 | 0.740.08 | 0.740.17 |
| Mg+/H+106 | 0.270.09 | 0.320.10 | 0.600.15 | 0.380.09 | 0.420.19 |
| ICF(Mg)a | 22.89 | 19.23 | 10.47 | 14.24 | 12.13 |
| Mg/H106 | 6.231.96 | 6.171.93 | 6.311.57 | 5.411.32 | 5.112.27 |
| log Mg/O | 1.060.14 | 1.100.14 | 1.190.11 | 1.210.11 | 1.110.20 |
| Galaxy | J12334959 | J13495631 | J13551457 | J14556107 | |
| (O iii), K | 126001490 | 148602420 | 169401090 | 150301060 | |
| (O ii), K | 123401380 | 139202120 | 14920900 | 14020920 | |
| (S ii), cm-3 | 1010 | 77130 | 7659 | 1151305 | |
| O+/H+105 | 1.060.22 | 1.680.35 | 0.930.07 | 1.780.14 | |
| O2+/H+105 | 11.751.04 | 6.500.47 | 5.020.11 | 6.330.21 | |
| O/H105 | 12.811.06 | 8.180.58 | 5.950.13 | 8.110.25 | |
| 12+log O/H | 8.110.04 | 7.910.03 | 7.770.01 | 7.910.01 | |
| N+/H+106 | 1.290.37 | 0.640.37 | … | … | |
| ICF(N)a | 10.21 | 4.73 | … | … | |
| N/H106 | 1.310.44 | 3.051.83 | … | … | |
| log N/O | 0.990.15 | 1.430.26 | … | … | |
| Ne2+/H+105 | 2.380.49 | 1.320.30 | 0.940.08 | 1.440.14 | |
| ICF(Ne)a | 0.99 | 1.11 | 1.07 | 1.12 | |
| Ne/H105 | 2.370.49 | 1.460.33 | 1.010.08 | 1.610.16 | |
| log Ne/O | 0.730.10 | 0.750.10 | 0.770.04 | 0.700.05 | |
| Mg+/H+106 | 0.410.12 | 0.260.10 | 0.470.13 | 0.400.12 | |
| ICF(Mg)a | 19.25 | 9.55 | 12.08 | 8.84 | |
| Mg/H106 | 7.952.24 | 2.510.94 | 5.621.58 | 3.521.07 | |
| log Mg/O | 1.190.13 | 1.510.17 | 1.030.12 | 1.360.13 |
aIonisation correction factor.
Direct observations of high-redshift galaxies are difficult for several reasons, including their faintness, the increase of IGM opacity, and contamination by lower-redshift interlopers (e.g. Vanzella et al., 2010, 2012; Inoue et al., 2014; Grazian et al., 2016). Therefore, it is important to identify and study local proxies of this galaxy population. It has been argued that low-mass compact galaxies at low redshifts 1 with very active star formation may be promising candidates for escaping ionising radiation (Jaskot & Oey, 2013; Nakajima & Ouchi, 2014). Low-redshift galaxies, because of their proximity, can be studied in more detail than high-redshift ones and their (LyC) can be derived with a higher reliability. In particular, the intrinsic LyC flux produced by hot stars in a low-redshift galaxy can directly be derived from the observable H flux, and together with the observed LyC flux, allows the direct determination of (LyC). This technique, which is not possible for most of high-redshift galaxies because of the unobservable H emission, has been applied in particular by Izotov et al. (2016a, b, 2018a, 2018b).
The general characteristic of compact SFGs is the presence of strong emission lines in the optical spectra of their H ii regions, powered by numerous O-stars, which produce plenty of ionising radiation. Different subsets of compact SFGs, depending on redshift, photometric characteristics and luminosities, have been variously called “blue compact dwarf” (BCD) galaxies (e.g. Thuan & Martin, 1981; Izotov et al., 1994, 2018c), “blueberry” galaxies (Yang et al., 2017b), “green pea” (GP) galaxies (Cardamone et al., 2009) or “luminous compact” star-forming galaxies (LCGs) (Izotov et al., 2011).
Stellar masses, star formation rates (SFR) and metallicities of compact SFGs vary in wide ranges and they are similar to those of high-redshift star-forming galaxies including Lyman-alpha emitting galaxies (Izotov et al., 2015). Many low-redshift compact SFGs are characterised by high line ratios O32 = [O iii]5007/[O ii]3727 4 – 5, reaching values of up to 60 in some galaxies (Stasińska et al., 2015). These high values are not yet observed in high- galaxies, However, their Spitzer colours suggest strong [O iii] + H equivalent widths (Labbé et al., 2013; Smit et al., 2014; de Barros et al., 2019; Endsley et al., 2021). Such high values may indicate that the ISM is predominantly ionised, allowing the escape of Lyman continuum photons (Jaskot & Oey, 2013; Nakajima & Ouchi, 2014). Indeed, Izotov et al. (2016a, b, 2018a, 2018b) obtained HST/COS observations of eleven compact SFGs at redshifts 0.3 – 0.4 and with O32 = 5 – 28 and 6107 – 6109 M⊙, and found all these galaxies to be leaking LyC radiation, with an escape fraction in the range of 2 – 72 per cent. We note that recent X-shooter observations of one of the strong high- leakers, Ion2, reveal the emission-line characteristics in the optical range to be similar to those of 0.3 – 0.4 LyC leakers, in particular, a high O32 9 (Vanzella et al., 2020). Furthermore, the Ly profile of ten galaxies shows a double peak with one having a triple peak. All these profiles show a small velocity separation of the peaks ( 450 km s-1), as predicted by Verhamme et al. (2015) for low H i column densities.
Finally, an analysis of UV absorption lines, including hydrogen lines of the Lyman series and heavy element lines such as Si ii can provide a consistent and accurate measure of the Lyman continuum escape fraction (e.g. Gazagnes et al., 2018; Chisholm et al., 2018; Gazagnes et al., 2020). Mg ii 2796, 2803 emission provides also a strong constraint of the LyC escape and the doublet ratio can be used to infer the neutral gas column density (Henry et al., 2018; Chisholm et al., 2020).
The goal of this paper is to determine (LyC) for nine low-mass galaxies with 108 M⊙. We wish to extend the range of stellar masses down to 107 M⊙ as high-redshift galaxies, at the epoch of reionisation, are thought to be low-mass objects. We also wish to enlarge the known sample of low-redshift LyC leakers and to search for reliable diagnostics for the indirect determination of (LyC).
Izotov et al. (2018b) using the sample of known low-redshift LyC leakers have considered three indicators for diagnostics, the velocity separation between the Ly peaks, the O32 ratios and the stellar mass . They have found a tight anti-correlation between (LyC) and , making one of the best indirect indicators for escaping ionising radiation.
As mentioned before, a high O32 ratio has been suggested to be a promising indirect indicator of escaping LyC emission in galaxies at any redshift. Although Izotov et al. (2018b) and Nakajima et al. (2020) did find some trend of increasing (LyC) with increasing O32, the dependence is weak, with a large scatter.
It has also been suggested that (LyC) tends to be higher in low-mass galaxies (Wise et al., 2014; Trebitsch et al., 2017). Stellar masses, , are available for a large number of star-forming galaxies because ground-based observations are sufficient for their determination. Izotov et al. (2018b) found only a relatively weak anti-correlation between (LyC) and . However, this conclusion is based mostly on objects with 108 M⊙, with the exception of one galaxy. Intriguingly, the unique galaxy in the LyC leaker sample with a stellar mass 108 M⊙, J12434646, is also the one with the highest (LyC), equal to 72 per cent. The question then arises: are lower mass compact galaxies stronger LyC leakers?
Fletcher et al. (2019) have found more LyC leakers at 3.1 with 108 M⊙. However, they derived from UV rest-frame photometry, which is dominated by the radiation from hot massive stars, while the stellar masses of low-redshift LyC leakers are derived from the rest-frame spectra in the optical range which also includes the emission of lower-mass cooler stars. Furthermore, the stellar masses derived by Fletcher et al. (2019) are up to 1.5 dex lower than the values derived by Nakajima et al. (2018) for the same galaxies. Therefore, the of Fletcher et al. (2019) might be underestimated.
| Name | a | log b | log b | log b | log (H)c | d | SFRe | sSFRf | g | h | ||
|---|---|---|---|---|---|---|---|---|---|---|---|---|
| J02320426 | 19.17 | 7.49 | 7.40 | 6.76 | 41.53 | 4.4 | 7.5 | 250 | 0.47 | 0.13 | 10.8 | 141 |
| J09194906 | 19.15 | 7.51 | 7.46 | 6.57 | 41.48 | 2.6 | 8.4 | 250 | 0.59 | 0.12 | 6.1 | 148 |
| J10465827 | 20.11 | 7.89 | 7.84 | 6.88 | 41.70 | 4.8 | 11.0 | 160 | …k | …k | …k | …k |
| J11213806 | 18.85 | 7.20 | 7.14 | 6.32 | 41.42 | 2.7 | 10.0 | 630 | 0.46 | 0.16 | 8.9 | 73 |
| J11274610 | 19.00 | 7.44 | 7.36 | 6.66 | 41.22 | 4.7 | 4.2 | 160 | 0.52 | 0.15 | 4.4 | 52 |
| J12334959 | 19.97 | 7.79 | 7.57 | 7.38 | 41.75 | 3.3 | 14.4 | 250 | 0.59 | 0.17 | 11.5 | 139 |
| J13495631 | 18.76 | 7.36 | 7.29 | 6.58 | 41.36 | 4.7 | 5.1 | 200 | 0.39 | 0.19 | 10.7 | 45 |
| J13551457 | 19.96 | 7.74 | 7.61 | 7.13 | 41.77 | 3.6 | 13.1 | 250 | 0.34 | 0.21 | 36.0 | 95 |
| J14556107 | 19.77 | 7.90 | 7.54 | 7.65 | 41.61 | 3.3 | 9.1 | 250 | 0.39 | 0.15 | 19.1 | 129 |
aAbsolute FUV magnitude derived from the intrinsic rest-frame SED in mag.
b, , are the masses of young, old stellar populations, and total stellar mass ( ).
c(H) is the H luminosity corrected for the Milky Way and internal extinction in erg s-1.
d is the starburst age in Myr.
eStar-formation rate corrected for the Milky Way and internal extinction, and escaping LyC radiation in M⊙ yr-1.
fSpecific star-formation rate in Gyr-1.
gExponential disc scale length in kpc.
hGalaxy radius, at which NUV intensity equal to half of maximal intensity in kpc.
iStar-formation rate surface density assuming galaxy radius equal to in M⊙ yr-1kpc-2.
jStar-formation rate surface density assuming galaxy radius equal to in M⊙ yr-1kpc-2.
kAcquisition image not obtained.
| Exposure time (s) | ||||
| Name | Date | (Central wavelength (Å)) | ||
| MIRRORA | G140L | G160M | ||
| J02320426 | 2019-09-25 | 2800 | 8211 | 3410 |
| (800) | (1623) | |||
| J09194906 | 2020-04-30 | 2900 | 8641 | 3499 |
| (800) | (1611) | |||
| J10465827 | 2019-10-08 | 20a | 7407b | 3910 |
| (800) | (1600) | |||
| J11213806 | 2020-04-16 | 2900 | 5551b | 3326 |
| (800) | (1533) | |||
| J11274610 | 2020-01-10 | 2900 | 8641 | 3497 |
| (800) | (1533) | |||
| J12334959 | 2020-01-17 | 2900 | 8641 | 3497 |
| (800) | (1623) | |||
| J13495631 | 2020-03-12 | 2800 | 8953 | 3916 |
| (800) | (1577) | |||
| J13551457 | 2020-05-28 | 2800 | 8232 | 3436 |
| (800) | (1577) | |||
| J14556107 | 2020-03-09 | 2900 | 9019 | 3760 |
| (800) | (1577) | |||
aFailed exposure.
bPartially executed observation.

In this paper, we present new HST/COS observations of the LyC in 9 compact SFGs, with the lowest 108 M⊙ ever observed at 0.3 – 0.4. We wish to detect their ionising radiation, and examine its behaviour over a wide range of stellar masses. The properties of the selected SFGs derived from observations in the optical range are presented in Section 2. The HST observations and data reduction are described in Section 3. The surface brightness profiles in the UV range are discussed in Section 4. In Section 5, we compare the HST/COS spectra with the extrapolation of the modelled SEDs to the UV range. Ly emission is considered in Section 6. The escaping Lyman continuum emission is discussed in Section 7 together with the corresponding escape fractions. The indirect indicators of escaping LyC emission are considered in Section 8. We summarize our findings in Section 9.
2 Properties of selected galaxies derived from observations in the optical range
We selected a sample of local compact low-mass SFGs ( 108 M⊙) to observe their Ly and LyC emission with HST/COS. The sources are selected from SDSS in the redshift range , which allows efficient observations of the LyC with COS. They are also chosen to be the brightest and have the highest O32 ratios and the highest equivalent widths EW(H) of the H emission line so that a galaxy can be acquired and observed with low- and medium-resolution gratings in one visit, consisting of 5 orbits. These selection criteria yield a total sample of 9 galaxies. They are listed in Table 1. The important features of the objects in this sample compared to the previous ones are 1) the lower stellar masses, extending the mass range down to 2107 M⊙, which is more typical of high- star-forming galaxies; 2) the large range of O32 4 – 14, similar to that of the LyC leakers of Izotov et al. (2016a, b, 2018a, 2018b); and 3) the fainter UV absolute magnitudes –19 - –20 mag, whereas the galaxies in Izotov et al. (2016a, b, 2018a, 2018b) are generally brighter, with –20 - –21 mag. This is fainter than the characteristic –21 mag for galaxies at 6. Thus, our galaxies represent the faint end of the luminosity function. It is also worth noting that all objects from the selected sample have low metallicities (the range of oxygen abundances is 7.8 – 8.1) and high equivalent widths of the H emission line (158 - 435 Å). All galaxies are nearly unresolved by the SDSS -band images, which have FWHMs of 1.0 – 1.6 arcsec, so that all the galaxy’s light falls within the 2.5 arcsec diameter COS aperture, ensuring that global quantities can be derived.
The SDSS, GALEX and WISE apparent magnitudes of the selected galaxies are shown in Table 2, indicating that these SFGs are among the faintest low-redshift LyC leaker candidates selected for HST observations. In fact, only four out of nine galaxies have been detected in the FUV range and only two galaxies are present in the AllWISE catalogue.
To derive absolute magnitudes and other integrated parameters we adopted luminosity and angular size distances (NASA Extragalactic Database (NED)111NASA/IPAC Extragalactic Database (NED) is operated by the Jet Propulsion Laboratory, California Institute of Technology, under contract with the National Aeronautics and Space Administration., Wright, 2006) with the cosmological parameters =67.1 km s-1Mpc-1, =0.682, =0.318 (Ade et al., 2014). These distances are presented in Table 1.
2.1 Interstellar extinction and element abundances
Internal interstellar extinction has been derived from the observed decrement of all hydrogen emission lines, which are measurable in the SDSS spectra (Izotov, Thuan & Lipovetsky, 1994). First, the emission-line fluxes in the observed SDSS spectra, uncorrected for redshift, were corrected for the Milky Way extinction with from the NED, adopting the Cardelli, Clayton & Mathis (1989) reddening law and = 3.1. Second, the fluxes of emission lines at the rest-frame wavelengths were corrected for the internal extinction of galaxies with and = 3.1, where = (H)int/1.47 (Aller, 1984). Finally, the extinction-corrected emission lines are used to derive ionic and total element abundances following the methods described in Izotov et al. (2006) and Guseva et al. (2013).
The emission-line fluxes () relative to the H flux corrected for both the Milky Way and internal extinctions, the rest-frame equivalent widths, the Milky Way ((H)MW) and internal ((H)int) extinction coefficients, and extinction-corrected H fluxes are shown in Table 3. We note that H emission lines in SDSS spectra of two galaxies, J02320426 and J10465827 are clipped and therefore their fluxes are lower than the theoretical recombination values. Consequently, we excluded these lines from the determination of internal extinctions in J02320426 and J10465827. The fluxes and the direct method are used to derive the physical conditions (electron temperature and electron number density) and the element abundances in the H ii regions. These quantities are shown in Table 4. The oxygen abundances are comparable to those in known low-redshift LyC leakers by Izotov et al. (2016a, b, 2018a, 2018b). The ratios of the -element (neon and magnesium) abundances to oxygen abundance are similar to those in dwarf emission-line galaxies (e.g. Izotov et al., 2006; Guseva et al., 2013). On the other hand, the nitrogen-to-oxygen abundance ratios in some galaxies are somewhat elevated, similar to those in other LyC leakers at 0.3.
| Name | (Ly)MWa | b | log c | EWd | e | blue/redf | (Ly)g |
|---|---|---|---|---|---|---|---|
| J02320426 | 0.106 | 43.56.4 | 42.53 | 90.61.8 | 446.051.8 | 9.8 | 42.55.3 |
| J09194906 | 0.110 | 81.79.5 | 42.68 | 219.53.7 | 369.244.9 | 11.6 | 68.78.9 |
| J10465827 | 0.059 | 65.38.2 | 42.57 | 65.32.2 | 512.658.7 | 19.0 | 31.84.3 |
| J11213806 | 0.154 | 79.58.6 | 42.43 | 142.32.9 | 229.379.5 | 23.1 | 43.25.2 |
| J11274610 | 0.123 | 44.45.6 | 42.18 | 94.32.2 | 259.451.8 | 28.8 | 39.78.5 |
| J12334959 | 0.124 | 83.69.7 | 42.74 | 152.06.7 | 271.927.6 | 16.9 | 41.23.9 |
| J13495631 | 0.070 | 47.05.6 | 42.33 | 95.13.2 | 386.556.3 | 9.1 | 40.34.4 |
| J13551457 | 0.152 | 68.97.3 | 42.50 | 151.62.9 | 430.469.1 | 63.3 | 23.12.8 |
| J14556107 | 0.098 | 74.08.4 | 42.54 | 144.02.7 | 388.941.5 | 41.5 | 36.54.5 |
aMilky Way extinction at the observed wavelength of the Ly emission line in mags
adopting Cardelli et al. (1989) reddening law with =3.1.
bFlux in 10-16 erg s-1 cm-2 measured in the COS spectrum and corrected for the Milky Way extinction.
c is Ly luminosity in erg s-1 corrected for the Milky Way extinction.
dRest-frame equivalent width in Å.
eLy peak separation in km s-1.
fFlux ratio of blue-to-red peaks in per cent.
gLy escape fraction in per cent.
2.2 Absolute magnitudes, H luminosities and stellar masses
For absolute FUV magnitudes, we do not use the observed GALEX FUV apparent magnitudes for two reasons: 1) only four galaxies are detected by GALEX in the FUV range; 2) for the remaining galaxies, FUV magnitudes are given for emission at somewhat different wavelengths. Therefore, for homogeneity, we derive absolute magnitudes from the fluxes of the extinction-corrected spectral distribution (SED) at the rest-frame wavelength = 1500 Å. We designate these absolute magnitudes as . They are, on average, 0.7 mag fainter than s for other 0.3 – 0.4 LyC leakers.
The H luminosity (H) and the corresponding star-formation rates SFR were obtained from the extinction-corrected H fluxes, using the relation of Kennicutt (1998) for the SFR. SFRs are increased by a factor 1/[1 (LyC)] to take into account the escaping ionising radiation which is discussed later. The SFRs corrected for escaping LyC radiation are shown in Table 5. They are somewhat below the range of 14 – 80 M⊙ yr-1 for the other LyC leakers studied by Izotov et al. (2016a, b, 2018a, 2018b), presumably because of their smaller stellar masses. On the other hand, their specific star formation rates, sSFR = SFR/, are 150 Gyr-1, with the highest value of Gyr-1 for J1121+3806, which has also the lowest stellar mass (Table 5). These sSFR are among the largest sSFR for dwarf SFGs at any redshift and they are significantly higher than the sSFRs observed in other LyC leakers (Izotov et al., 2016a, b, 2018a, 2018b).
We use the SDSS spectra of our LyC leakers to fit the SED and derive their stellar masses. The fitting method, using a two-component model, is described in Izotov et al. (2018a, b). Spectral energy distributions of instantaneous bursts in the range between 0 and 10 Gyr with evolutionary tracks of non-rotating stars by Girardi et al. (2000) and a combination of stellar atmosphere models (Lejeune, Buser & Cuisiner, 1997; Schmutz, Leitherer & Gruenwald, 1992) are used to produce the integrated SED for each galaxy. The adoption of other sets of evolutionary tracks of rotating and non-rotating stars and stellar atmosphere models would, in particular, change the level of Lyman continuum by 10 per cent at most (Izotov et al., 2016a). The star formation history is approximated by a young burst with a randomly varying age in the range 10 Myr, and a continuous star formation for older ages between times and , randomly varying in the range 10 Myr - 10 Gyr, and adopting a constant SFR. The contribution of the two components is determined by randomly varying the ratio of their stellar masses, = , in the range 0.1 – 1000, where and are the masses of the old and young stellar populations.
The nebular continuum emission, including free-free and free-bound hydrogen and helium emission, and two-photon emission, is also taken into account using the observed H flux, the ISM temperature and density. The fraction of nebular emission in the observed continuum near H is determined by the ratio of the observed H equivalent width EW(H)obs, reduced to the rest frame, to the equivalent EW(H)rec for pure nebular emission. EW(H)rec varies from 900Å to 1100Å, for electron temperatures in the range = 10000 – 20000K. For example, the fraction of nebular continuum near H in J09194906 with EW(H)obs = 435Å (Table 3) is 40 per cent and the remaining 60 per cent of emission in the continuum is stellar. We note that non-negligible nebular emission, including both the continuum and emission lines, is produced only by the burst.
The Salpeter initial mass function (IMF) is adopted, with a slope of –2.35, upper and lower mass limits and of 100 M⊙ and 0.1 M⊙, respectively. A minimisation technique was used 1) to fit the continuum in such parts of the wavelength range 3600 – 6500Å, where the SDSS spectrum is least noisy and free of nebular emission lines, and 2) to reproduce the observed H and H equivalent widths.
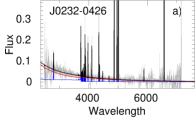
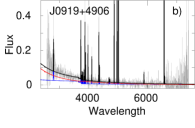
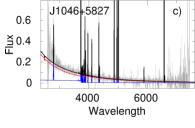
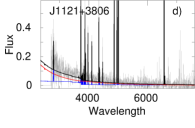
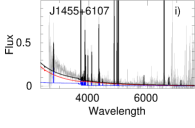
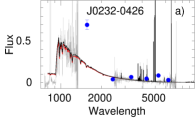
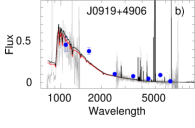
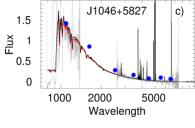
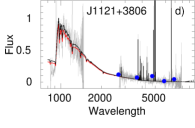
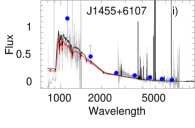
To illustrate the quality of our SED fitting, Fig. 1 shows the modelled stellar, nebular and total SEDs superposed upon the rest-frame extinction-corrected SDSS spectra. For all galaxies we find good agreement. The masses of young () and old () stellar populations, and total stellar masses ( = + ) of our LyC leakers derived from SED fitting are presented in Table 5. They are derived in exactly the same way as the stellar masses for the other LyC leakers studied by our team (Izotov et al., 2016a, b, 2018a, 2018b), permitting a direct comparison. They are considerably lower, being all less than 108 M⊙.
We find that the masses of the old stellar population are lower or similar to those of the young stellar population. However, the determination of the mass of the old stellar population is very uncertain because of the strong dominance of the young stellar population in the SDSS optical spectrum. For example, the luminosity of a young stellar population with an age of 3 Myr at the wavelength 5000Å is 250 times higher than the luminosity of an old population with an age of 1 Gyr. Therefore, to have a non-negligible contribution of 5 per cent to emission at 5000Å, the mass of the old stellar population should be 10 times that of the young stellar population, corresponding to 10. The SED at lower is not sensitive to the presence of the old stellar population. On the other hand, the stellar mass of the young stellar population is reliable because it is primarily determined by the H luminosity. We also note that the SFR derived from the H emission line is similar to the value / obtained from our modelled SEDs (see Table 5). However, the derived SFRs and sSFRs are just an indication of the galaxy properties. They are not used for SED fitting and thus have no impact on the determination of the LyC escape fraction.
| Name | a | (LyC)MWb | c,d | (total)c,e | (total)c,f | g | h |
|---|---|---|---|---|---|---|---|
| (Å) | (mag) | (per cent) | (per cent) | ||||
| J02320426 | 870-890 | 0.203 | 16.831.92 | 0.58i | 0.70 | 4.2 | 1.6 |
| J09194906 | 890-910 | 0.144 | 44.353.70 | 6.30 | 7.19 | 16.2 | 15.1 |
| J10465827 | 890-910 | 0.080 | 46.654.87 | 0.80i | 0.86 | 1.8 | 1.0 |
| J11213806 | 880-900 | 0.210 | 60.695.30 | 17.53 | 21.25 | 35.0 | 25.1 |
| J11274610 | 870-900 | 0.165 | 29.003.02 | 2.76 | 3.22 | 11.1 | 6.1 |
| J12334959 | 890-910 | 0.158 | 66.816.51 | 7.00 | 8.09 | 12.1 | 9.5 |
| J13495631 | 850-870 | 0.098 | 17.221.87 | 1.05i | 1.15 | 6.7 | 2.2 |
| J13551457 | 850-870 | 0.208 | 86.018.77 | 0.85i | 1.03 | 1.2 | 0.9 |
| J14556107 | 850-870 | 0.133 | 69.426.97 | 1.36i | 1.54 | 2.2 | 1.9 |
aRestframe wavelength range in Å used to determine the LyC flux.
bMilky Way extinction at the mean observed wavelengths of the range used to determine the LyC flux.
The Cardelli et al. (1989) reddening law with = 3.1 is adopted.
cLyC flux in 10-18 erg s-1cm-2Å-1.
dLyC flux derived from the modelled SED.
eObserved LyC flux derived from the spectrum with shadow exposure, excluding J10465827, where measurements are from
the spectrum with total exposure.
fLyC flux which is corrected for the Milky Way extinction.
g(LyC) = (total)/, where is derived from SED (first method).
h(LyC) = (total)/, where is derived from H flux (second method).
i1 confidence upper limit.
3 HST/COS observations and data reduction
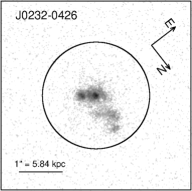
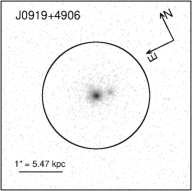
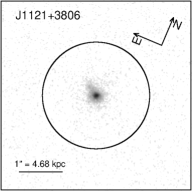
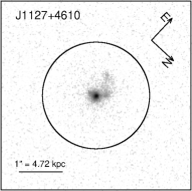
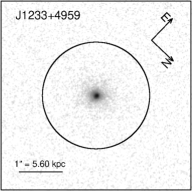
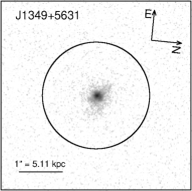
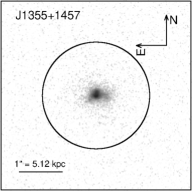
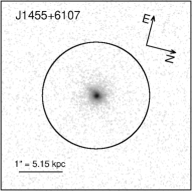
HST/COS spectroscopy of the nine LyC leaker candidates was obtained in program GO 15639 (PI: Y. I. Izotov) during the period September 2019 – May 2020. The observational details are presented in Table 6. As in our previous programs (Izotov et al., 2016a, b, 2018a, 2018b), the galaxies were directly acquired by COS near ultraviolet (NUV) imaging. The NUV-brightest region of each target was centered in the 2.5 arcsec diameter spectroscopic aperture (Fig. 2). Although the galaxies show generally a compact star-forming region superimposed upon an extended low-surface-brightness (LSB) component and, in the case of J02320426, several star-forming knots, their sizes are smaller than the central unvignetted arcsec diameter region of the spectroscopic aperture (Fisher et al., 2018), except for J02320426. However, even for this galaxy more than 90 per cent of the emission is concentrated in the arcsec diameter region. Hence, the galaxy quantities derived from the COS spectra do not require corrections for vignetting. We note, however, that the acquisition exposure failed for J10465827. Therefore, no acquisition image is available for this galaxy (Fig. 2). Furthermore, the location of this galaxy inside the spectroscopic aperture is not known, introducing uncertainties in the fluxes of the COS spectra of J10465827. The only way to estimate these uncertainties is to compare the observed COS spectrum with the extrapolation of the SED, obtained from fitting the SDSS optical spectrum, to the UV range (see Sect. 5).
The spectra were obtained at COS Lifetime Position 4 with the low-resolution grating G140L and medium-resolution grating G160M, applying all four focal-plane offset positions. The 800Å setup was used for the G140L grating (COS Lifetime Position 4: wavelength range 770–1950 Å, resolving power at 1150 Å) to include the redshifted LyC emission for all targets. We obtained resolved spectra of the galaxies’ Ly emission lines with the G160M grating ( at 1600 Å), varying the G160M central wavelength with galaxy redshift to cover the emission line and the nearby continuum on a single detector segment. The G140L observations of J10465827 and J11213806 were partially executed due to technical problems (Table 6).
The individual exposures were reduced with the calcos pipeline v3.2.1, followed by accurate background subtraction and co-addition with custom software (Worseck et al., 2016). We used the same methods and extraction aperture sizes as in Izotov et al. (2018a, b) to achieve a homogeneous reduction of the galaxy sample observed in multiple programs. We checked the accuracy of our custom correction for scattered light in COS G140L data by comparing the LyC fluxes obtained in the total exposure and in orbital night, respectively. An exception is the galaxy J10465827, for which no orbital night exposures were obtained.
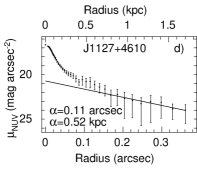
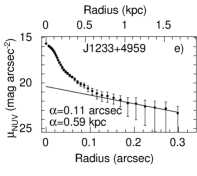
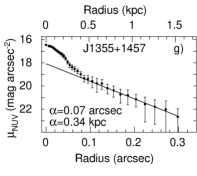
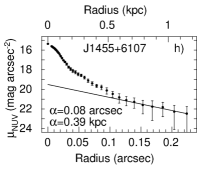
4 Surface brightness distribution in the NUV range
The surface brightess (SB) profiles of our galaxies, in accord with previous studies by Izotov et al. (2016a, b, 2018a, 2018b), are derived using the COS NUV acquisition images and the routine ellipse in iraf222iraf is distributed by the National Optical Astronomy Observatories, which are operated by the Association of Universities for Research in Astronomy, Inc., under cooperative agreement with the National Science Foundation./stsdas333stsdas is a product of the Space Telescope Science Institute, which is operated by AURA for NASA.. However, we note that the images of our galaxies are not as deep as those in Izotov et al. (2016a, b, 2018a, 2018b) because of lower exposure times. The profiles were scaled to magnitudes per square arcsec using the ratios of the uncalibrated galaxy fluxes in the COS NUV images, measured with the routine apphot in iraf, to the fluxes corresponding to the respective apparent GALEX NUV magnitudes. An exception is the galaxy J11213806, for which no GALEX data are available. For this galaxy, we adopt a magnitude derived from extrapolation of the attenuated SED obtained from the SDSS spectrum. There is no SB profile for the galaxy J10465827 because its acquisition exposure failed, as noted before.
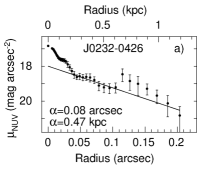
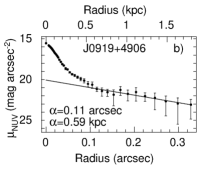
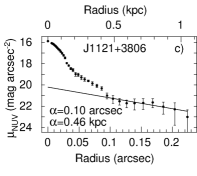
As found before by Izotov et al. (2016a, b, 2018a, 2018b), the outer parts of our galaxies are characterised by a linear decrease in SB (in mag per square arcsec scale), characteristic of a disc structure, while the central part with the bright star-forming region(s) shows a sharp increase (Fig. 3).
The scale lengths of our galaxies, defined in Eq. 1 of Izotov et al. (2016b), are in the range 0.3 – 0.6 kpc (Fig. 3), lower than = 0.6 – 1.8 kpc in other LyC leakers (Izotov et al., 2016a, b, 2018a, 2018b) and indicating a lower mass and a more compact structure for our galaxies. The corresponding surface densities of star-formation rate in the studied galaxies = SFR/() are similar to those of other LyC leakers. Because the bright star-forming regions are very compact with sharply rising brightness profiles, the half-light radii of our galaxies in the NUV are similar but considerably smaller than (see Table 5). Adopting as a measure of the size of these galaxies, the corresponding s are typically two orders of magnitude larger, and are comparable to those found for SFGs at high redshifts (Curtis-Lake et al., 2016; Paulino-Afonso et al., 2018; Bouwens et al., 2017). The values in Table 5 are similar to those found by Kim et al. (2020) for GPs and Lyman Break Analogs.
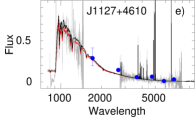
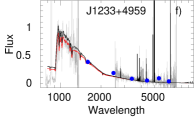
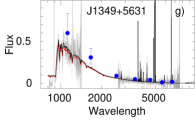
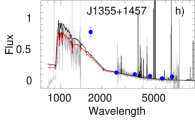
5 Comparison of the HST/COS spectra with the modelled SEDs in the UV range
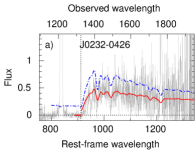
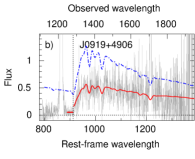
To derive the fraction of the escaping ionising radiation, the two methods, which we use (e.g. Izotov et al., 2018a), are based on the comparison between the observed flux in the Lyman continuum range and the intrinsic flux produced by stellar populations in the galaxy. The intrinsic LyC flux can be obtained from SED fitting of the SDSS spectra or from the flux of the H emission line. To verify the quality of our SED fitting, we extrapolate the attenuated SEDs to the UV range and compare them with the observed COS spectra in Fig. 4. For comparison, we also show with blue filled circles the GALEX FUV and NUV fluxes and the fluxes in the SDSS filters. We find that the spectroscopic and photometric data in the optical range are consistent, indicating that almost all the emission of our galaxies is inside the spectroscopic aperture. Therefore, aperture corrections are not needed. On the other hand, considerable deviations of GALEX FUV and NUV fluxes to brighter values from both the observed COS spectra and attenuated SED extrapolations are found for many of galaxies, most strikingly for J02320426. These deviations in the FUV could in part be explained by the redshifted Ly. However, no such deviation is seen in the spectrum of J09194906 with the highest EW(Ly). Furthermore, no bright emission lines fall into the NUV range despite large deviations from the observed spectra and modelled SEDs. Therefore, these systematic deviations indicate high uncertainties of the GALEX FUV and NUV fluxes, at least for faint objects.
The modelled intrinsic SEDs in Fig. 4 are attenuated by adopting the extinction coefficients (H)MW and (H)int (Table 3) and the reddening law by Cardelli et al. (1989) with = 3.1 and = 2.7 (black solid lines and red solid lines, respectively).
It is seen in Fig. 4 that the models reproduce the SDSS spectra quite well and do not depend on the adopted because of low extinction. There is a stronger dependence of the attenuated SEDs on in the UV range, but differences of the attenuated SEDs with = 3.1 and = 2.7 are still small (black and red lines in Fig. 4), because of small extinction coefficients (H)int. However, the attenuated SEDs with = 2.7 reproduce on average somewhat better the observed COS spectra.
6 Ly emission
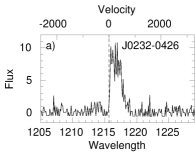
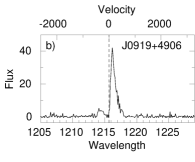
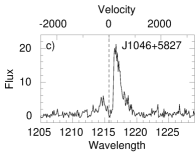
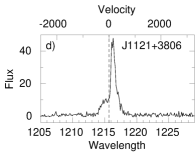
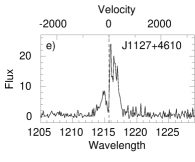
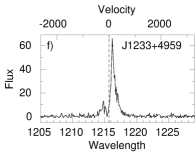
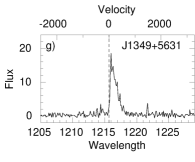
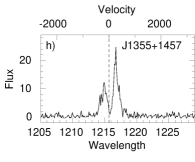
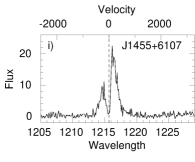
A resolved Ly 1216 Å emission line is detected in the medium-resolution spectra of all galaxies (Fig. 5), whereas this line is unresolved in the low-resolution spectra. The shape of the resolved Ly line is similar to that observed in most known LyC leakers (Izotov et al., 2016a, b, 2018a, 2018b) and in some other galaxies (Jaskot & Oey, 2014; Henry et al., 2015; Yang et al., 2017a; Izotov et al., 2020). In the present sample, profiles with two peaks are detected in the spectra of seven galaxies. The signal-to-noise ratio in the spectrum of J02320426 is too low to definitely derive the profile of its Ly emission line. The Ly profile of J11274610 may show more than two peaks, but the S/N 5 even in undersampled spectra is too low to definitely determine that, similar to the data of J02320426. The parameters of Ly emission are shown in Table 7.
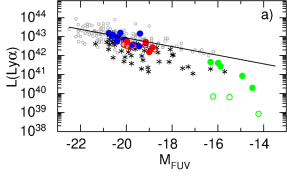
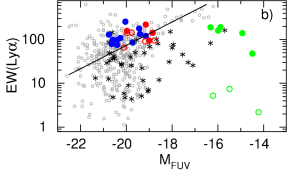
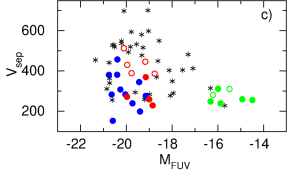
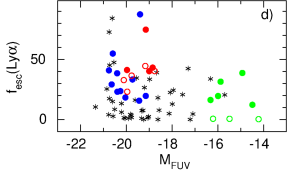
We show in Fig. 6 the dependences of some Ly characteristics on absolute FUV magnitude. Our galaxies with detected LyC emission are shown by red filled circles and those with upper limits of LyC emission are represented by red open circles. All our low-mass galaxies are characterised by moderate Ly luminosities in a narrow range between 1042.19 and 1042.74 erg s-1 (Fig. 6a), that are slightly below the values for confirmed LyC leakers (blue filled circles) by Izotov et al. (2016a, b, 2018a, 2018b) and high-redshift galaxies (grey open circles) by Ouchi et al. (2008), Hashimoto et al. (2017), Jiang et al. (2018), Matthee et al. (2017, 2018), Sobral et al. (2018), but are 1 order of magnitude higher than those for GPs (black asterisks, Henry et al., 2015; Jaskot & Oey, 2014; Jaskot et al., 2017; McKinney et al., 2019; Yang et al., 2017a). Our low-mass galaxies have high EW(Ly) 65 – 220Å (Table 7, red symbols in Fig. 6b), similar to those in other LyC leakers (blue symbols in Fig. 6b). They are at the high end of the EW(Ly) values for high- LAEs by Ouchi et al. (2008), Hashimoto et al. (2017), Jiang et al. (2018), Harikane et al. (2018), Caruana et al. (2018), Pentericci et al. (2018), Matthee et al. (2017, 2018), Sobral et al. (2018) (grey open circles) and GPs (black asterisks). However, contrary to expectations for galaxies with lower stellar masses and, likely, lower masses of the neutral gas, the separation between the Ly peaks is on average similar to that in higher-mass LyC leakers (Fig. 6c), and it is higher in galaxies with upper limits of LyC emission ( 400 km s-1, red open circles). Ly escape fractions (Ly) in low-mass galaxies are also similar to those in higher-mass LyC leakers, and they are lower in galaxies with upper limits of LyC emission (red open circles in Fig. 6d). We also note that the average ratio of blue and red peak fluxes of 25 per cent (Table 7) is somewhat lower than the value of 30 per cent quoted by Hayes et al. (2021) for 0 galaxies.
For comparison, we also show by green filled circles in Fig. 6 the extreme-O32 low-redshift ( 0.07) compact star-forming galaxies with high EW(Ly) and by green open circles the galaxies with weak Ly emission on top of broad Ly absorption profiles. It is seen that low- SFGs with high EW(Ly) are shifted from relations for high- LAEs (black solid lines) to lower (Ly) (Fig. 6a) and EW(Ly) (Fig. 6b), despite similar excitation conditions, as indicated by comparable O32 and EW(H) values.
Izotov et al. (2020) discussed this feature of low- CSFGs and suggested that it could be due to the presence of an extended Ly halo with an angular diameter considerably larger than the 2.5 arcses in diameter COS spectroscopic aperture, making some Ly emission unobservable, although there is no direct evidence for that from the HST observations. Furthermore, the Ly escape fraction (Ly) in these galaxies is somewhat lower than that in LyC leakers (Figs. 6d), supporting the idea of the extended Ly halo, exceeding the size of the COS spectroscopic aperture, corresponding to a linear radius of 0.6 - 1.7 kpc at the redshifts of low- CSFGs. This results in a loss of some emission and, consequently, in a reduced derived value of (Ly). However, the linear radius inside the COS spectroscopic aperture at redshift 0.3 is 5 kpc and, likely, is larger than the extent of Ly emission, implying that most of Ly emission is inside the COS aperture, despite the fact that the luminosity of Ly in LyC leakers (red and blue circles in Fig. 6) is several times higher than that in low- CSFGs with extreme O32.
7 Escaping Lyman continuum radiation
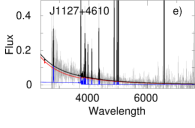
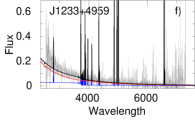
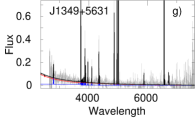
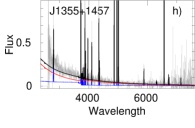
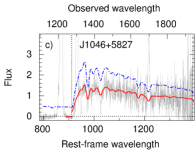
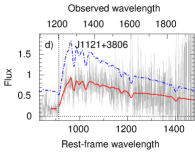
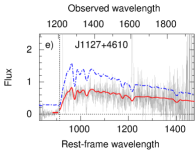
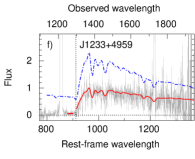
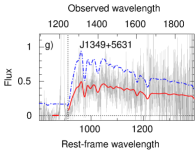
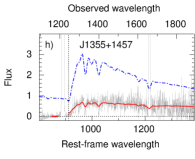
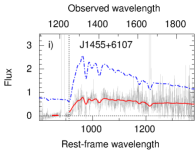
The observed G140L total-exposure spectra with the LyC spectral region (grey lines) and predicted intrinsic SEDs (blue dash-dotted lines) are shown in Fig. 7, together with the attenuated intrinsic SEDs (red solid lines). The predicted intrinsic SEDs are obtained from fitting the optical SDSS spectra, corrected for the Milky Way extinction at observed wavelengths, and adopting from the NED, and for the internal extinction at restframe wavelengths, the UV attenuation law with = 2.7, and the extinction coefficients (H)int derived from the hydrogen Balmer decrement.
The level of the observed LyC continuum is indicated by horizontal red lines shortward of the vertical dotted line showing the Lyman series limit. The Lyman continuum emission is detected in the spectra of four galaxies, J09194906, J11213806, J1127+4610 and J1233+4959, and only upper limits are derived in the spectra of the remaining galaxies. The measurements are summarised in Table 8. Due to the faintness of the targets, we adopted the LyC fluxes measured during orbital night (except for J10465827) to minimise residual uncertainties in the scattered light correction.
Izotov et al. (2016a, b, 2018a, 2018b) used the ratio of the escaping fluxes to the intrinsic fluxes of the Lyman continuum to derive (LyC):
| (1) |
where is the mean wavelength of the range used for averaging of the LyC flux density (see Table 8). Izotov et al. (2016b) proposed two methods to derive iteratively the intrinsic fluxes and, correspondingly, the LyC escape fractions (LyC): 1) from the SED fitting and 2) from the equivalent width of the H emission line and its extinction-corrected flux and adopting relations between (H)/ and EW(H) from the models of photoionised H ii regions (equation 4 for instantaneous burst in Izotov et al., 2016b). We use both methods in this paper.
The escape fraction (LyC), in the range between 11 and 35 per cent, is derived in four out of nine galaxies (Table 8). For the remaining galaxies, only upper limits of (LyC) were derived. We note that the (LyC)s derived by the second method are somewhat lower than those derived by the first method, but are consistent within the errors for most galaxies.
8 Indicators of high LyC escape fraction
The direct detection of LyC emission in low-redshift star-forming galaxies is a difficult task. At the moment, only HST can be used for that purpose. Therefore, reasonable indirect indicators of LyC leakage at low redshift are needed to build a larger sample for statistical studies.
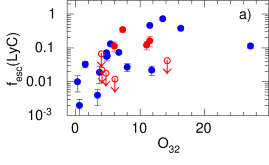
Jaskot & Oey (2013) and Nakajima & Ouchi (2014) proposed a high O32 ratio as an indication of escaping ionising radiation. We have in hand, with our new LyC leakers, a sample of twenty five galaxies with a wide range of O32 0.5 – 27 and directly derived (LyC) (Leitet et al., 2013; Borthakur et al., 2014; Leitherer et al., 2016; Izotov et al., 2016a, b, 2018a, 2018b). The (LyC) values for several LyC leakers from Leitet et al. (2013) and Leitherer et al. (2016) are discrepant. Therefore, for these galaxies, we have used the (LyC) values re-analysed by Chisholm et al. (2017). The relation between (LyC) and O32 is presented in Fig. 8a. It has been discussed before by Faisst (2016) and Izotov et al. (2018b). There is a trend of increasing (LyC) with increasing of O32, but with a substantial scatter, at large O32 values. The large scatter is due to the dependence of O32 on other parameters such as metallicity, hardness of ionising radiation and ionisation parameter. Additionally, the spread of (LyC) can also be caused by inhomogeneous leakage through channels with low optical depth and their orientation relative to the observer. Therefore, a high O32 is not a very certain indicator of high (LyC) and it is only a necessary condition for escaping radiation (Izotov et al., 2018b; Nakajima et al., 2020). The only definite result from Fig. 8a is that (LyC) is very low in objects with O32 4.
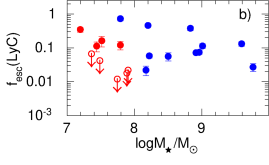
It has also been suggested that (LyC) tends to be higher in low-mass galaxies (Wise et al., 2014; Trebitsch et al., 2017). Our new nine galaxies with 108 M⊙ considerably extend the mass range down to a stellar mass of 107 M⊙, similar to the lowest-mass known of high- leakers (Vanzella et al., 2020). Previous observations have shown a slight tendency for (LyC) to increase with decreasing stellar mass, albeit with a large intrinsic scatter. We present in Fig. 8b the relation between (LyC) and stellar mass , including our new data. The added data shows, on the contrary, that there is no clear correlation between (LyC) and . This is one of the important findings of this study: contrary to expectation, there is no clear trend of increasing (LyC) with decreasing . However, we caution that might be higher than those derived from SED fitting because of uncertainties in the determination of the mass of the old stellar population.
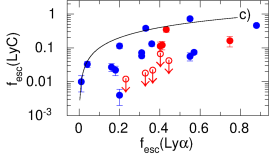
In Fig. 8c, we show the relation (LyC) – (Ly) for the 0.45 LyC leakers observed by Izotov et al. (2016a, b, 2018a, 2018b). There is a tendency for (LyC) to increase with increasing (Ly). However, the spread of the data is large. The only important results are: 1) (LyC) (Ly) for the majority of galaxies, in agreement with theoretical predictions (Dijkstra, Gronke & Venkatesan, 2016) and 2) (LyC) is very low for (Ly) 20 per cent.
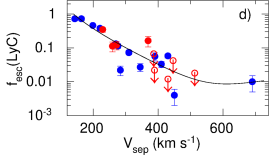
The profile of the Ly emission line can also be used as an indirect indicator of the LyC leakage. This indicator is most useful because it can be applied to nearby low-mass galaxies, for which direct observations of the LyC with HST/COS are not possible because of their low redshift. Verhamme et al. (2017) and Izotov et al. (2018b) found a tight dependence of (LyC) on the separation between the peaks of the Ly emission line in LyC leakers. The new low-mass LyC leakers discussed in this paper also follow the relation discussed by Izotov et al. (2018b), shown by the solid line in Fig. 8d. There is no new galaxy having a peak separation less than 230 km s-1. For comparison, the lowest peak separation in the sample of low- leakers (Izotov et al., 2018b), is that of J12434646, 150 km s-1. We note that Meyer et al. (2021) have recently reported the discovery of a double-peak Ly profile in the galaxy A370p_z1, at the epoch of reionisation ( = 6.803), with the extremely low peak separation of 110 km s-1, implying an extremely high LyC escape fraction.
The relation between and (LyC), as shown in Fig. 8d, is a consequence of the fractions of LyC and Ly escaping radiation being determined by the column density of the neutral gas along the line of sight in LyC leaking galaxies (e.g. Verhamme et al., 2015, 2017). The majority of the new observations of low-mass galaxies (red symbols) support previous findings. However, there is one galaxy, J09194906, which deviates significantly from the relation of Izotov et al. (2018b). It has a (LyC) corresponding to of 250 km s-1 derived from the relation, compared to the measured value of 370 km s-1. The cause of this deviation is not clear.
This relation should constitute a strong constraint for constructing radiative transfer and kinematical models which simultaneously reproduce (LyC) and the Ly profile.
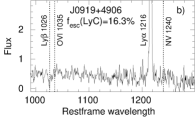
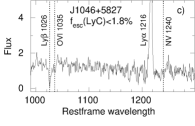
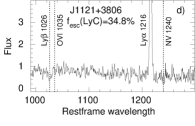
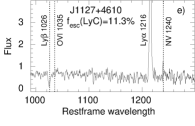
Izotov et al. (2018b) considered also another potential indicator of escaping LyC radiation. They found that the stellar line O vi 1035Å with a P-Cygni profile is seen in the spectra of most LyC leaking galaxies observed by Izotov et al. (2016a, b, 2018a, 2018b), indicative of hot most massive stars with masses of 100 M⊙. It is likely that stellar winds from these hot stars produce channels with ionised gas, through which ionising radiation escapes the galaxy.
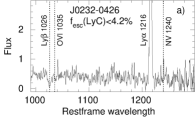
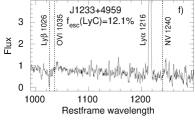
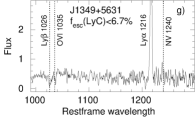
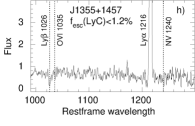
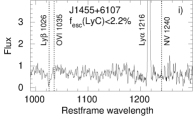
In Fig. 9 we present segments of COS G140L spectra of the LyC leakers studied in this paper, in the wavelength range 1000 – 1300Å, which includes the stellar lines O vi 1035Å and N v 1240Å. At variance with the results of Izotov et al. (2016a, b, 2018a, 2018b), the O vi 1035Å lines are not seen in spectra of our galaxies, including the galaxy J11213806 with the highest (LyC) = 35.0 per cent. Hints of this line are likely seen in the spectra of J10465827, J13495632, and J12334959 with (LyC) 1.8 per cent, 6.7 per cent, and 12.1 per cent, respectively.
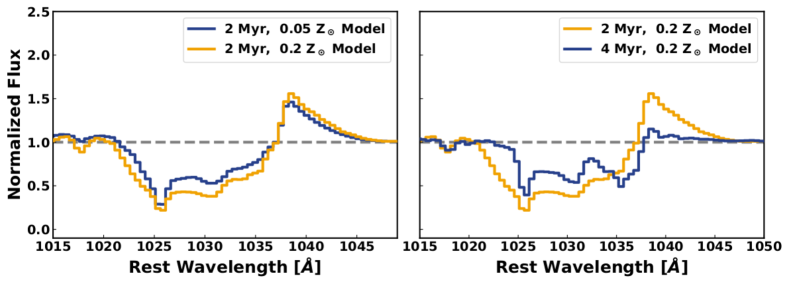
The spectral differences between the galaxies studied by Izotov et al. (2016a, b, 2018a, 2018b) and in this paper could be caused by the lower stellar masses of the present sample. Stellar winds are less likely in low-metallicity massive stars with more transparent interiors. Furthermore, it is possible that there is a fundamental difference in the formation of the most massive stars in galaxies with different stellar masses. The O vi 1035Å spectral feature arises from the stellar winds in the most massive stars. The left panel of Fig. 10 shows the O vi profile for two starburst99 stellar populations (Leitherer et al., 2010) with metallicities of 0.2 Z⊙ (similar to the median gas-phase metallicity of this sample) and 0.05 Z⊙. This O vi 1035Å profile takes on a classic P-Cygni feature with blueshifted absorption and redshifted emission for very young stellar populations. While the O vi absorption is slightly metallicity dependent, the redshifted emission profile is nearly constant at these metallicities and fixed ages.
However, the right panel of Fig. 10 shows the extreme sensitivity of the O vi profile to stellar population age (or equivalently the upper end of the IMF), where O vi emission disappears (equal to the grey dashed line) for stellar populations with ages greater than 4 Myr, once stars with masses greater than 60 M⊙ move off the main-sequence (Meynet et al., 1994), or for younger stellar populations with upper stellar mass truncated at 60 M⊙. The stark lack of O vi emission in the observed stellar populations implies that these low galaxies do not likely have the most massive stars (60M⊙). This could arise from slightly older stellar populations than the previous sample, the IMF of the lower mass sample may not be sufficiently populated, or the O vi profile may not be fully formed in these stellar populations. Thus, high LyC leakage is not necessarily linked to the presence of O vi 1035Å emission, as in the case of J11213806.
9 Conclusions
We present new Hubble Space Telescope (HST) Cosmic Origins Spectrograph (COS) observations of nine compact star-forming galaxies (SFG), with low stellar masses 108 M⊙ and in the redshift range = 0.3179 – 0.4524. We use these data to study the Ly emission and the escaping Lyman continuum (LyC) radiation of these SFGs. This study is an extension of the work reported earlier in Izotov et al. (2016a, b, 2018a, 2018b). Our main results are summarised as follows:
1. Emission of Lyman continuum radiation is detected in four out of the nine galaxies with the escape fraction (LyC) in the range between 11 4 per cent (J11274610) and 35 6 per cent (J11213806). Only upper limits of (LyC) between 1 and 7 per cent are obtained for the remaining five galaxies.
2. A Ly emission line with two peaks is observed in the spectra of seven galaxies, whereas the Ly profile in one galaxy, J11274610, may show more than two peaks, but the S/N 5 even in undersampled spectra is too low to definitely determine that. The signal-to-noise ratio of the J02320426 spectrum is also too low to make definite conclusions about the shape of Ly. The flux minimum between the two peaks approaches the zero value in eight galaxies. However, the flux between the peaks of one galaxy, J11213806, with the highest (LyC), is far above the zero value indicating that a considerable fraction of its Ly emission escaped through low-density ionised channels (holes) in the neutral ISM along the line of sight. A strong anti-correlation between (LyC) and the peak velocity separation of the Ly profile is found, confirming the finding of Izotov et al. (2018b) and making the most robust indirect indicator of Lyman continuum radiation leakage.
3. Other characteristics such as O32 ratio, (Ly) and the stellar mass show weak or no correlations with (LyC), with a high spread of values. In particular, our new observations of low-mass LyC leaker candidates, with 108 M⊙, do not confirm the slight trend of increasing (LyC) with decreasing found by Izotov et al. (2018b) for LyC leakers with higher stellar masses.
4. A bright compact star-forming region (with the exception of J02320426, which shows several knots of star formation) superimposed on a low-surface-brightness component, is seen in the COS near ultraviolet (NUV) acquisition images of all eight galaxies (one image is missing due to technical problems). The surface brightness at the outskirts of our galaxies can be approximated by an exponential disc, with a scale length of 0.34 – 0.59 kpc. This is 4 times lower than the scale lengths of the LyC leakers observed by Izotov et al. (2016a, b, 2018a, 2018b), indicating that our new LyC candidates have much lower masses. However, part of this difference may be explained by acquisition exposure times that are 1.5 times lower for the present sample, resulting in less deep images.
5. The star formation rates in the range SFR 4 – 14 M⊙ yr-1 of our low-mass galaxies, with stellar masses 108 M⊙, are several times lower than those in the LyC leakers studied by Izotov et al. (2016a, b, 2018a, 2018b). However, their specific star formation rates of 150 Gyr-1 are higher than those found in low-redshift LyC leakers. The metallicities of our new galaxies, ranging from 12 + logO/H = 7.77 to 8.11, are similar to those for LyC leakers studied by Izotov et al. (2016a, b, 2018a, 2018b).
6. At variance with the LyC leakers studied by Izotov et al. (2016a, b, 2018a, 2018b), the O vi 1035Å line is not seen in the spectra of our low-mass galaxies. These spectral differences can be caused by the lower stellar masses and lower metallicities of the galaxies in the present sample. The absence of the O vi 1035Å line implies that these galaxies do not contain the most massive stars.
Acknowledgements
Based on observations made with the NASA/ESA Hubble Space Telescope, obtained from the data archive at the Space Telescope Science Institute. STScI is operated by the Association of Universities for Research in Astronomy, Inc. under NASA contract NAS 5-26555. Support for this work was provided by NASA through grant number HST-GO-15639.002-A from the Space Telescope Science Institute, which is operated by AURA, Inc., under NASA contract NAS 5-26555. Y.I. and N.G. acknowledge support from the National Academy of Sciences of Ukraine by its priority project No. 0120U100935 “Fundamental properties of the matter in the relativistic collisions of nuclei and in the early Universe”. Funding for SDSS-III has been provided by the Alfred P. Sloan Foundation, the Participating Institutions, the National Science Foundation, and the U.S. Department of Energy Office of Science. The SDSS-III web site is http://www.sdss3.org/. SDSS-III is managed by the Astrophysical Research Consortium for the Participating Institutions of the SDSS-III Collaboration. GALEX is a NASA mission managed by the Jet Propulsion Laboratory. This research has made use of the NASA/IPAC Extragalactic Database (NED) which is operated by the Jet Propulsion Laboratory, California Institute of Technology, under contract with the National Aeronautics and Space Administration.
Data availability
The data underlying this article will be shared on reasonable request to the corresponding author.
References
- Ade et al. (2014) Ade P. A. R. et al., 2014, A&A, 571, A16
- Aller (1984) Aller L. H., 1984, Physics of Thermal Gaseous Nebulae. Dordrecht: Reidel
- Bian et al. (2017) Bian F., Fan X., McGreer I., Cai Z., Jiang L., 2017, ApJ, 837, 12
- Borthakur et al. (2014) Borthakur S., Heckman T. M., Leitherer C., Overzier R. A., 2014, Science, 346, 216
- Bouwens et al. (2015) Bouwens R. J., Illingworth G. D., Oesch P. A., Caruana J., Holwerda B., Smit R., Wilkins S., 2015, ApJ, 811, 140
- Bouwens et al. (2017) Bouwens R. J., Illingworth G. D., Oesch P. A., Atek H, Lam D, Stefanon M., 2017, ApJ, 843, 41
- Cardamone et al. (2009) Cardamone C. et al., 2009, MNRAS, 399, 1191
- Cardelli et al. (1989) Cardelli J. A., Clayton G. C., Mathis J. S., 1989, ApJ, 345, 245
- Caruana et al. (2018) Caruana J. et al., 2018, MNRAS, 473, 30
- Chisholm et al. (2017) Chisholm J., Orlitová I., Schaerer D., Verhamme A., Worseck G., Izotov Y. I., Thuan T. X., Guseva N. G., 2017, A&A, 605, A67
- Chisholm et al. (2018) Chisholm J. et al., 2018, A&A, 616, 30
- Chisholm et al. (2020) Chisholm J., Prochaska J. X., Schaerer D., Gazagnes S., Henry A., 2020, MNRAS, 498, 2554
- Cowie et al. (2009) Cowie L. L., Barger A. J., Trouille L., 2009, ApJ, 692, 1476
- Curtis-Lake et al. (2016) Curtis-Lake E. et al., 2016, MNRAS, 457, 440
- de Barros et al. (2016) de Barros S. et al., 2016, A&A, 585, A51
- de Barros et al. (2019) de Barros S., Oesch P. A., Labbé I., Stefanon M., González V., Smit R., Bouwens R. J., Illingworth G. D., 2019, MNRAS, 489, 2355
- Dijkstra et al. (2016) Dijkstra M., Gronke M., Venkatesan A., 2016, ApJ, 828, 71
- Dressler et al. (2015) Dressler A., Henry A., Martin C. L., Sawicki M., McCarthy P., Villaneuva E., 2015, ApJ, 806, 19
- Endsley et al. (2021) Endsley R., Stark D. P., Chevallard J., Charlot S., 2021, MNRAS, 500, 5229
- Faisst (2016) Faisst A. L., 2016, ApJ, 829, 99
- Finkelstein et al. (2019) Finkelstein S. L. et al., 2019, ApJ, 879, 36
- Fisher et al. (2018) Fischer W. J. et al., 2018, Cosmic Origins Spectrograph Instrument Handbook, Version 10.0. Baltimore: STScI
- Fletcher et al. (2019) Fletcher T. J., Tang M., Robertson B. E., Nakajima K., Ellis R. S., Stark D. P., Inoue A., 2019, ApJ, 878, 87
- Gazagnes et al. (2018) Gazagnes S., Chisholm J., Schaerer D., Verhamme A., Rigby J. R., Bayliss M., 2018, A&A, 616, 29
- Gazagnes et al. (2020) Gazagnes S., Chisholm J., Schaerer D., Verhamme A., Izotov Y., 2020, A&A, 639, 85
- Girardi et al. (2000) Girardi L., Bressan A., Bertelli G., Chiosi C., 2000, A&AS, 141, 371
- Grazian et al. (2016) Grazian A. et al., 2016, A&A, 585, A48
- Guseva et al. (2013) Guseva N. G., Izotov Y. I., Fricke K. J., Henkel C., 2013, A&A, 555, A90
- Harikane et al. (2018) Harikane Y. et al., 2018, ApJ, 859, 84
- Hashimoto et al. (2017) Hashimoto T. et al., 2017, A&A, 608, 10
- Hassan et al. (2018) Hassan S., Davé R., Mitra S., Finlator K., Ciardi B., Santos M. G., 2018, MNRAS, 473, 227
- Hayes et al. (2021) Hayes M. J., Runnholm A., Gronke M., Scarlata C., 2021, ApJ, 908, 36
- Henry et al. (2015) Henry A., Scarlata C., Martin C. S., Erb D., 2015, ApJ, 809, 19
- Henry et al. (2018) Henry A., Berg D. A., Scarlata C., Verhamme A., Erb D., 2018, ApJ, 855, 96
- Inoue et al. (2014) Inoue A. K., Shimizu I., Iwata I., Tanaka M., 2014, MNRAS, 442, 1805
- Iwata et al. (2009) Iwata I. et al., 2009, ApJ, 692, 1287
- Izotov et al. (1994) Izotov Y. I., Thuan T. X., Lipovetsky V. A., 1994, ApJ, 435, 647
- Izotov et al. (2006) Izotov Y. I., Stasińska G., Meynet G., Guseva N. G., Thuan T. X., 2006, A&A, 448, 955
- Izotov et al. (2011) Izotov Y. I., Guseva N. G., Thuan T. X., 2011, ApJ, 728, 161
- Izotov et al. (2015) Izotov Y. I., Guseva N. G., Fricke K. J., Henkel C., 2015, MNRAS, 451, 2251
- Izotov et al. (2016a) Izotov Y. I., Orlitová I., Schaerer D., Thuan T. X., Verhamme A., Guseva N. G., Worseck G., 2016a, Nature, 529, 178
- Izotov et al. (2016b) Izotov Y. I., Schaerer D., Thuan, T. X., Worseck G., Guseva N. G., Orlitová I., Verhamme A., 2016b, MNRAS, 461, 3683
- Izotov et al. (2016c) Izotov Y. I., Guseva N. G., Fricke K. J., Henkel C., MNRAS, 462, 4427
- Izotov et al. (2018a) Izotov Y. I., Schaerer D., Worseck G., Guseva N. G., Thuan, T. X., Verhamme A., Orlitová I., Fricke K. J, 2018a, MNRAS, 474, 4514
- Izotov et al. (2018b) Izotov Y. I., Worseck G., Schaerer D., Guseva N. G., Thuan, T. X., Fricke K. J, Verhamme A., Orlitová I., 2018b, MNRAS, 478, 4851
- Izotov et al. (2018c) Izotov Y. I., Thuan T. X., Guseva N. G., Liss S. E., 2018c, MNRAS, 473, 1956
- Izotov et al. (2020) Izotov Y. I., Schaerer D., Worseck G., Verhamme A., Guseva N. G., Thuan T. X., Orlitová I., Fricke K. J., 2020, MNRAS, 491, 468
- Jaskot & Oey (2013) Jaskot A. E., Oey M. S., 2013, ApJ, 766, 91
- Jaskot & Oey (2014) Jaskot A. E., Oey M. S., 2014, ApJ, 791, L19
- Jaskot et al. (2017) Jaskot A. E., Oey M. S., Scarlata C., Dowd T., 2017, ApJ, 851, L9
- Jiang et al. (2018) Jiang L. et al., 2018, ApJ, 772, 99
- Katz et al. (2020) Katz H. et al., 2020, MNRAS, 498, 164
- Kennicutt (1998) Kennicutt R. C., Jr., 1998, ARA&A, 36, 189
- Khaire et al. (2016) Khaire V., Srianand R., Choudhury T. R., Gaikwad P., 2016, MNRAS, 457, 4051
- Kim et al. (2020) Kim K., Malhotra S., Rhoads J. E., Butler N. R., Yang H., 2020, ApJ, 893, 134
- Kulkarni et al. (2019) Kulkarni G., Worseck G., Hennawi J. F., 2019, MNRAS, 488, 1035
- Labbé et al. (2013) Labbé I. et al., 2013, ApJ, 777, L19
- Leitet et al. (2013) Leitet E., Bergvall N., Hayes M., Linné S., Zackrisson E., 2013, A&A, 553, A106
- Leitherer et al. (2010) Leitherer C., Ortiz Otálvaro P. A., Bresolin F., Kudritzki R.-P., Lo Faro B., Pauldrach A. W. A., Pettini M., Rix S. A., 2010, ApJS, 189, 309
- Leitherer et al. (2016) Leitherer C., Hernandez S., Lee J. C., Oey M. S., 2016, ApJ, 823, L64
- Lejeune et al. (1997) Lejeune T., Buser R., Cuisinier F., 1997, A&AS, 125, 229
- Lewis et al. (2020) Lewis J. S. W. et al., 2020, MNRAS, 496, 4342
- Madau & Haardt (2015) Madau P., Haardt F., 2015, ApJ, 813, L8
- Marchi et al. (2017) Marchi F. et al., 2017, A&A, 601, 73
- Marchi et al. (2018) Marchi F. et al., 2018, A&A, 614, 11
- Matsuoka et al. (2018) Matsuoka Y. et al., 2018, ApJ, 869, 150
- Matthee et al. (2017) Matthee J., Sobral D., Darvish B., Santos S., Mobasher B., Paulino-Afonso A., Röttgering H., Alegre L., 2017, MNRAS, 472, 772
- Matthee et al. (2018) Matthee J., Sobral D., Gronke M., Paulino-Afonso A., Stefanon M., Röttgering H., 2018, A&A, 619, 136
- McKinney et al. (2019) McKinney J. H., Jaskot A. E., Oey M. S., Yun M. S., Dowd T., Lowenthal J. D., 2019, ApJ, 874, 52
- Meštric et al. (2020) Meštric U. et al., 2020, MNRAS, 494, 4986
- Meyer et al. (2020) Meyer R. A. et al., 2020, MNRAS, 494, 1560
- Meyer et al. (2021) Meyer R. A., Laporte N., Ellis R. S., Verhamme A., Garel T., 2021, MNRAS, 500, 558
- Meynet et al. (1994) Meynet G., Maeder A., Schaller G., Schaerer D., Charbonnel C., 1994, A&AS, 103, 97
- Mitra et al. (2013) Mitra S., Ferrara A., Choudhury T. R., 2013, MNRAS, 428, L1
- Mitra et al. (2018) Mitra S., Choudhury T. R., Ferrara A., 2018, MNRAS, 473, 1416
- Naidu et al. (2020) Naidu R. P., Tacchella S., Mason C. A., Bose S., Oesch P. A., Conroy C., 2020, ApJ, 892, 109
- Nakajima & Ouchi (2014) Nakajima K., Ouchi M., 2014, MNRAS, 442, 900
- Nakajima et al. (2018) Nakajima K., Fletcher T., Ellis R. S., Robertson B. E., Iwata I., 2018, MNRAS, 477, 2098
- Nakajima et al. (2020) Nakajima K., Ellis R. S., Robertson B. E., Tang M., Stark D. P., 2020, ApJ, 889, 161
- Ouchi et al. (2008) Ouchi M. et al., 2008, ApJS, 176, 301
- Ouchi et al. (2009) Ouchi M. et al., 2009, ApJ, 706, 1136
- Paulino-Afonso et al. (2018) Paulino-Afonso A. et al., 2018, MNRAS, 476, 5479
- Pentericci et al. (2018) Pentericci L. et al., 2018, A&A, 619, 147
- Rivera-Thorsen et al. (2019) Rivera-Thorsen T. E. et al., 2019, Science, 366, 738
- Robertson et al. (2013) Robertson B. E. et al., 2013, ApJ, 768, 71
- Robertson et al. (2015) Robertson B. E., Ellis R. S., Furlanetto S. R., Dunlop J. S., 2015, ApJ, 802, L19
- Saha et al. (2020) Saha K. et al., 2020, Nature Astronomy, 4, 1185
- Schmutz et al. (1992) Schmutz W., Leitherer C., Gruenwald R., 1992, PASP, 104, 1164
- Shapley et al. (2016) Shapley A. E., Steidel C. C., Strom A. L., Bogosavljević M., Reddy N. A., Siana B. Mostardi R. E., Rudie G. C., 2016, ApJ, 826, L24
- Shen et al. (2020) Shen X., Hopkins P. F., Faucher-Giguére C.-A., Alexander D. M., Richards G. T., Ross N. P., Hickox R. C., 2020, MNRAS, 495, 3252
- Smit et al. (2014) Smit R. et al., 2014, ApJ, 784, 58
- Sobral et al. (2018) Sobral D. et al., 2018, MNRAS, 477, 2817
- Stark (2016) Stark D. P., 2016, ARA&A, 54, 761
- Stasińska et al. (2015) Stasińska G., Izotov Y., Morisset C., Guseva N., 2015, A&A, 576, A83
- Steidel et al. (2001) Steidel C. C., Pettini M., Adelberger K. L., 2011, ApJ, 546, 665
- Steidel et al. (2018) Steidel C. C., Bogosavljević M., Shapley A.E., Reddy N. A., Rudie G. C., Pettini M., Trainor R. F., Strom A. L., 2018, ApJ, 869, 123
- Thuan & Martin (1981) Thuan T. X., Martin G. E., 1981, ApJ, 247, 823
- Trebitsch et al. (2017) Trebitsch M., Blaizot J., Rosdahl J., Devriendt J., Slyz A., 2017, MNRAS, 470, 224
- Vanzella et al. (2010) Vanzella E. et al., 2010, ApJ, 725, 1011
- Vanzella et al. (2012) Vanzella E. et al., 2012, ApJ, 751, 70
- Vanzella et al. (2015) Vanzella E. et al., 2015, A&A, 576, A116
- Vanzella et al. (2018) Vanzella E. et al., 2018, MNRAS, 476, L15
- Vanzella et al. (2020) Vanzella E. et al., 2020, MNRAS, 491, 1093
- Verhamme et al. (2015) Verhamme A., Orlitová I., Schaerer D., Hayes M., 2015, A&A, 578, A7
- Verhamme et al. (2017) Verhamme A., Orlitová I., Schaerer D., Izotov Y., Worseck G., Thuan T. X., Guseva N., 2017, A&A, 597, A13
- Vielfaure et al. (2020) Vielfaure J.-B., et al. 2020, A&A, 640, 30
- Wang et al. (2019) Wang F. et al., 2019, ApJ, 884, 30
- Wise & Chen (2009) Wise J. H., Cen R., 2009, ApJ, 693, 984
- Wise et al. (2014) Wise J. H., Demchenko V. G., Halicek M. T., Norman M. L., Turk M. J., Abel T., Smith B. D., 2014, MNRAS, 442, 2560
- Worseck et al. (2016) Worseck G., Prochaska J. X., Hennawi J. F., McQuinn M., 2016, ApJ, 825, 144
- Wright (2006) Wright E. L., 2006, PASP, 118, 1711
- Yajima et al. (2011) Yajima H., Choi J.-H., Nagamine K., 2011, MNRAS, 412, 411
- Yang et al. (2017a) Yang H. et al., 2017a, ApJ, 844, 171
- Yang et al. (2017b) Yang H., Malhotra S., Rhoads J. E., Leitherer C., Wofford A., Jiang T., Wang J., 2017b, ApJ, 847, 38