Basak,
Two approaches to quantification of force networks in particulate systems
Abstract
The interactions between particles in particulate systems are organized in ‘force networks’, mesoscale features that bridge between the particle scale and the scale of the system as a whole. While such networks are known to be crucial in determining the system wide response, extracting their properties, particularly from experimental systems, is difficult due to the need to measure the interparticle forces. In this work, we show by analysis of the data extracted from simulations that such detailed information about interparticle forces may not be necessary, as long as the focus is on extracting the most dominant features of these networks. The main finding is that a reasonable understanding of the time evolution of force networks can be obtained from incomplete information such as total force on the particles. To compare the evolution of the networks based on the completely known particle interactions and the networks based on incomplete information (total force each grain) we use tools of algebraic topology. In particular we will compare simple measures defined on persistence diagrams that provide useful summaries of the force network features.
1 Introduction
In recent years, a significant amount of research has been carried on the topic of relating interparticle forces in static, compressed, or sheared dry or wet granular systems with the system-wide response; see [Behringer and Chakraborty (2018)] for a recent review. This body of research has established clear connections between the particle-sale interactions, the mesoscopic structures loosely referred to as force networks (often discussed in terms of force chains and cycles), and macro-scale system properties. Therefore, in order to understand the properties of the system as a whole, it is crucial to understand and quantify the properties of the underlying force networks, by which we mean the force field that describes the interparticle interactions.
Force networks in particulate systems have been analyzed recently using a variety of methods. These include force network ensemble analysis [Snoeijer et al. (2004), Tighe et al. (2010), Sarkar et al. (2013)], statistics-based methods [Peters et al. (2005), Tordesillas et al. (2010), Tordesillas et al. (2012), Bo et al. (2014)], network analysis [Bassett et al. (2012), Walker and Tordesillas (2012), Tordesillas et al. (2015), Giusti et al. (2016)], and topological data analysis (TDA), in particular persistent homology (PH) [Arévalo et al. (2010), Arévalo et al. (2013), Ardanza-Trevijano et al. (2014), Kondic et al. (2012), Kramár et al. (2013), Kramár et al. (2014b), Kramár et al. (2014a), Pugnaloni et al. (2016), Kondic et al. (2016)]. While different methods provide complementary insights, we focus in particular on the PH approach since it allows for significant data reduction and for formulation of simple but informative measures describing the force networks, as well as for comparison of different networks in a dynamic setting. Furthermore, the approach is dimension-independent, being easily applied in both two and three (2D and 3D) physical dimensions. Such an approach was used with success to discuss force networks in dry and wet (suspensions) systems that were compressed [Kondic et al. (2012), Kramár et al. (2014a)], vibrated [Pugnaloni et al. (2016), Kondic et al. (2016)], or sheared [Gameiro et al. (2020)], as well as for analysis of yielding of a granular system during pullout of a buried intruder in 3D [Shah et al. (2020)].
While significant progress has been reached on quantifying properties of force networks based on the data obtained in discrete element simulations, the progress on analysis of experimental data has been much slower. The reason for this is that it is much more difficult to extract the information about the forces between the particles in experiments. Significant progress in this direction has been obtained using photoelastic systems, where based on photoelastic response on the single particle scale, one can extract information about the forces at particle-particle contacts [Zadeh et al. (2019)]. Such extraction is, however, computationally expensive, and furthermore it requires high resolution input data so that the contact forces can be accurately extracted across a broad range of forces. Moreover, by now this method can be only applied to systems consisting of circular particles. Very often, the data does not meet the above requirements and the reconstruction cannot be carried out; instead, semiquantitative or qualitative measures must be utilized. Depending on the quality of the data, one could either use the gradient-squared (G2) method [Zadeh et al. (2019), Howell et al. (1999)] that allows for the extraction of the total force on a particle based on the photolastic signal [Zhao et al. (2019)] but amplifies noisy signals, or one could simply analyze the intensities of raw photoelastic images with the hope that the available information is sufficient to extract meaningful data. The former approach (based on the G2 data) was used in the context of shear jamming experiments [Dijksman et al. (2018)], while the latter approach was used to analyze granular impact [Takahashi et al. (2018)], and recently stick-slip dynamics of a slider on top of a granular bed [Cheng et al. (2021)]. The analyses were carried out using the PH-based tools, leading to insightful information about the role of force networks in the considered systems. For example, in [Dijksman et al. (2018)] it was found that a precise comparison between DEM simulations and experimental force network could be reached by adding white-noise to the simulation data to mimic the experimental noise, and in [Cheng et al. (2021)] it was uncovered that the PH-based measures show clear correlations between the evolution of force networks and the stick-slip dynamics of a slider moving on top of granular media.
The analysis of the force networks discussed above has proven to be useful in developing connections between particle scale physics and macroscopic system response. However, it should be emphasized that these results were obtained using incomplete data about the force networks: precise information about interparticle forces was not available. This raises the question: how accurate is the analysis based on incomplete data? Or, to formulate this question differently, assuming that more detailed experimental information were available, how would the results change? To be specific, let us consider an example of analysis of data in granular impact [Takahashi et al. (2018)], where it was found that the loops (cycles) in the force network play an important role in slowing down the intruder. This finding was obtained based on the data extracted from photoelastic images. If more detailed information about the structure of the force network were available, would such a conclusion still hold?
Answering the outlined question requires having complete information regarding particle-particle forces, computing relevant results, and then comparing them to the ones obtained based on incomplete information. To be able to carry out such a project, two necessary conditions need to be met: (i) one should to be able to compare the results obtained based on different sets of data, and (ii) one should be able to obtain the information about the particle-particle forces. To start from (ii), the information about particle-particle forces is difficult and costly to obtain in experiments, as already discussed. The simpler approach is to consider DEM simulations, and then either use the complete information (which is readily available), or to use only the incomplete information about the total force on each particle (which can be easily computed from the information about the forces at each contact). In the experiments, the total force on each particle could be estimated using the G2 method in a manner that is relatively straightforward [Zhao et al. (2019)]. Going back to the item (i), it is convenient to use the PH-based approach, since the corresponding analysis can be carried out both using the information about the force networks based on particle-particle contact forces, and based on the total force on each particle.
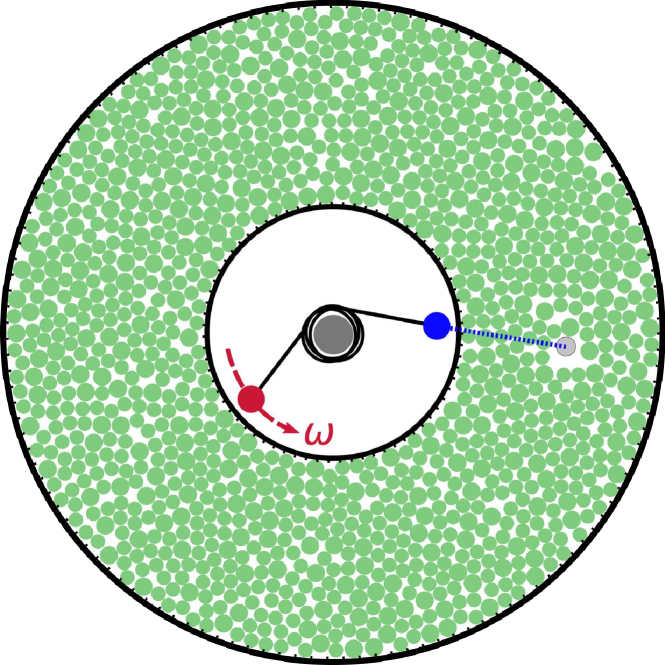
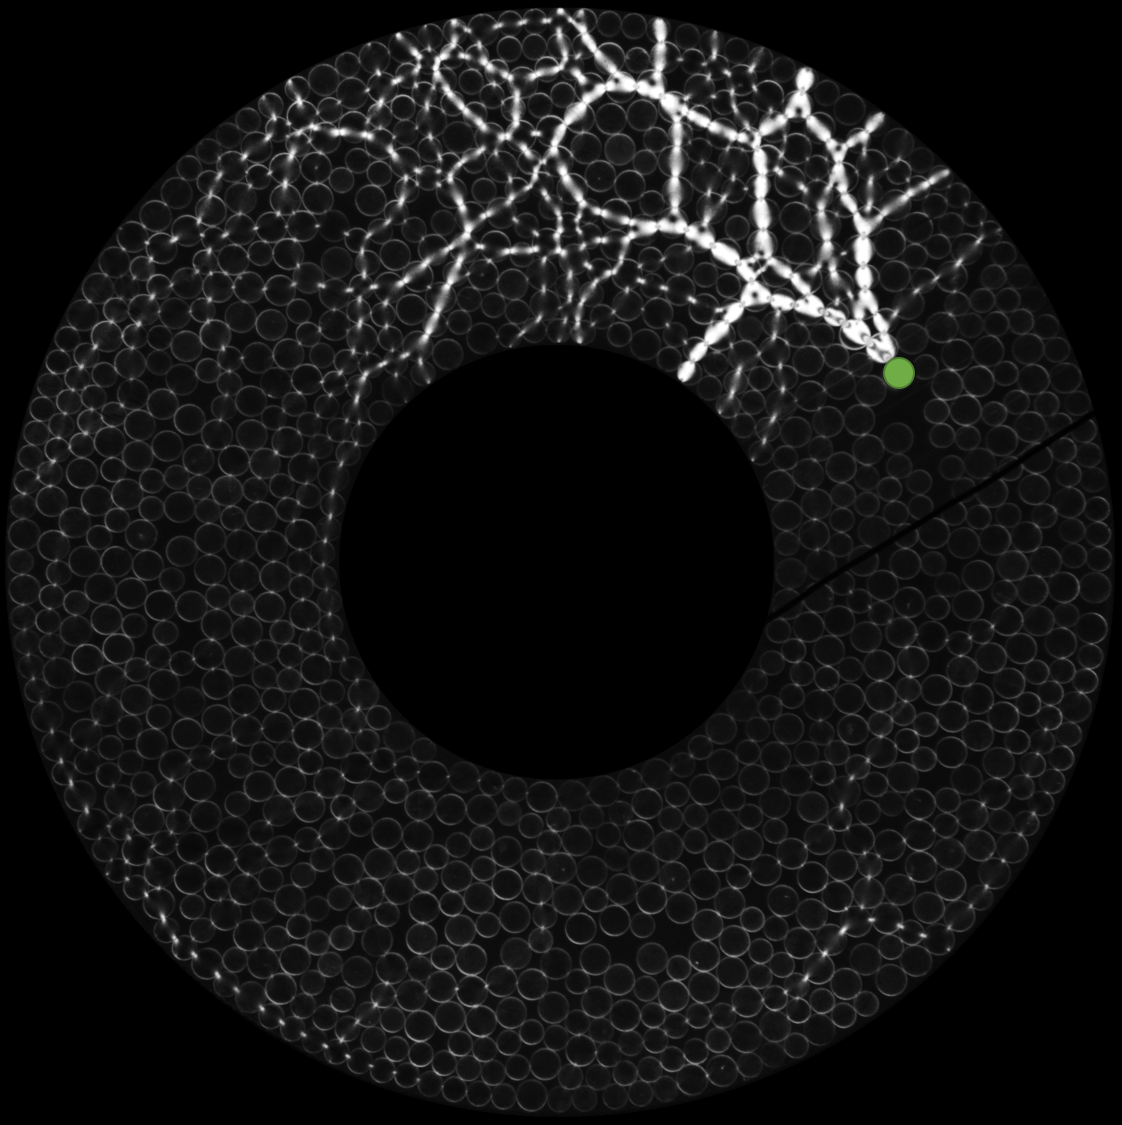
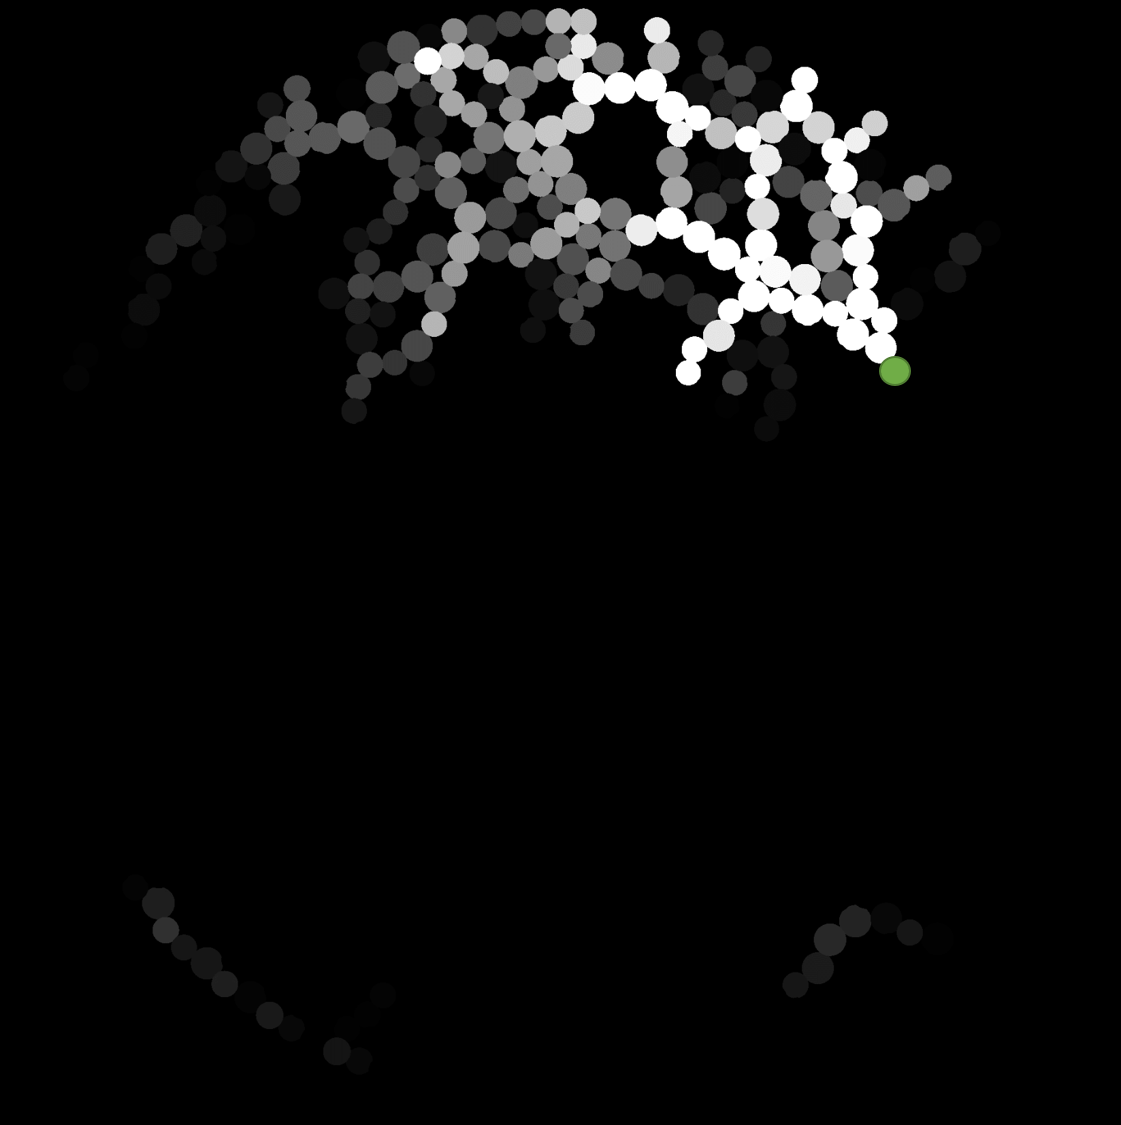
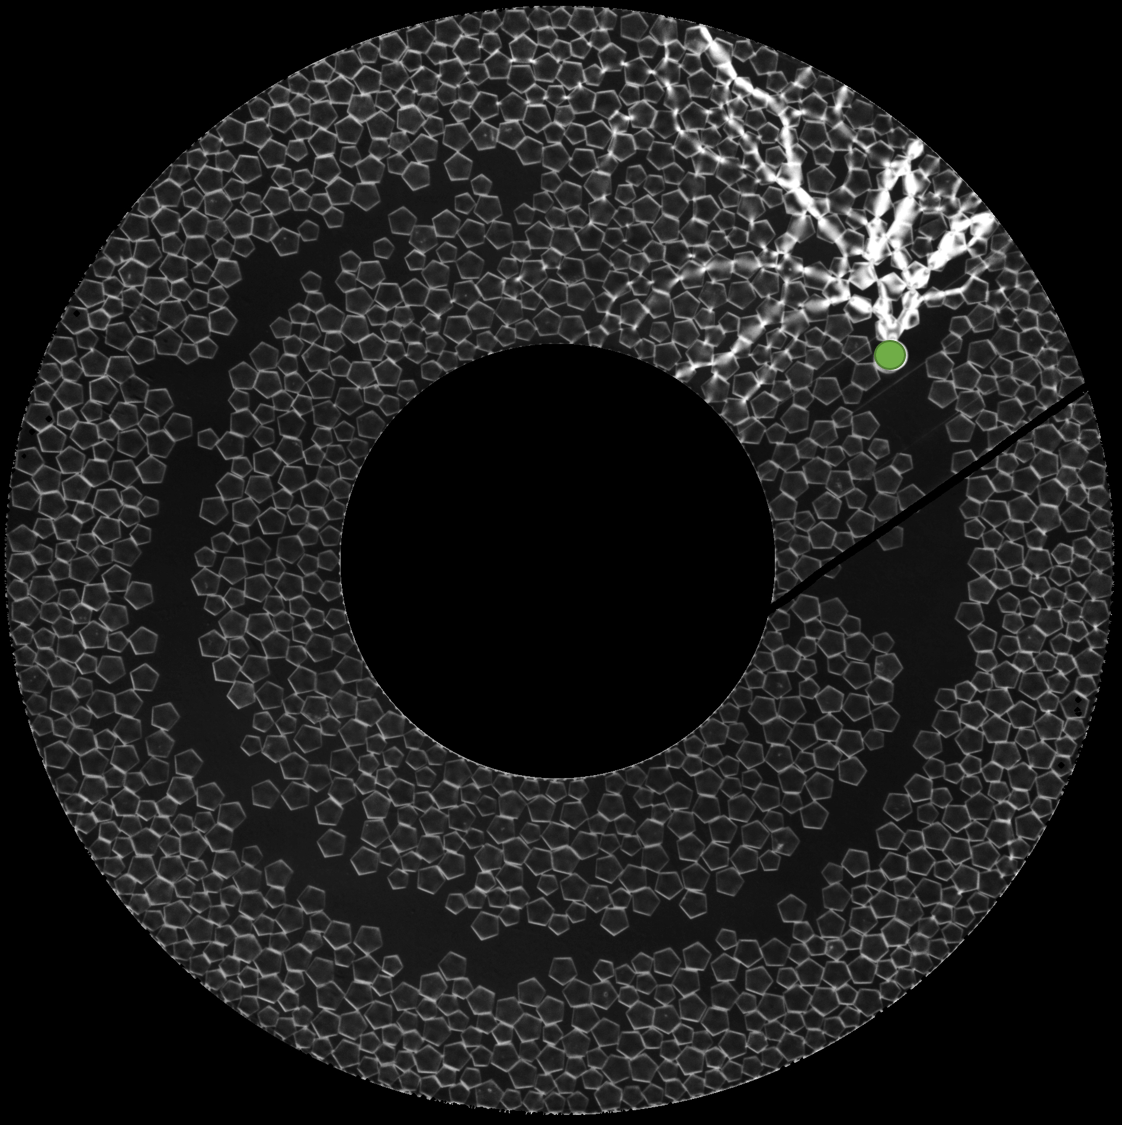
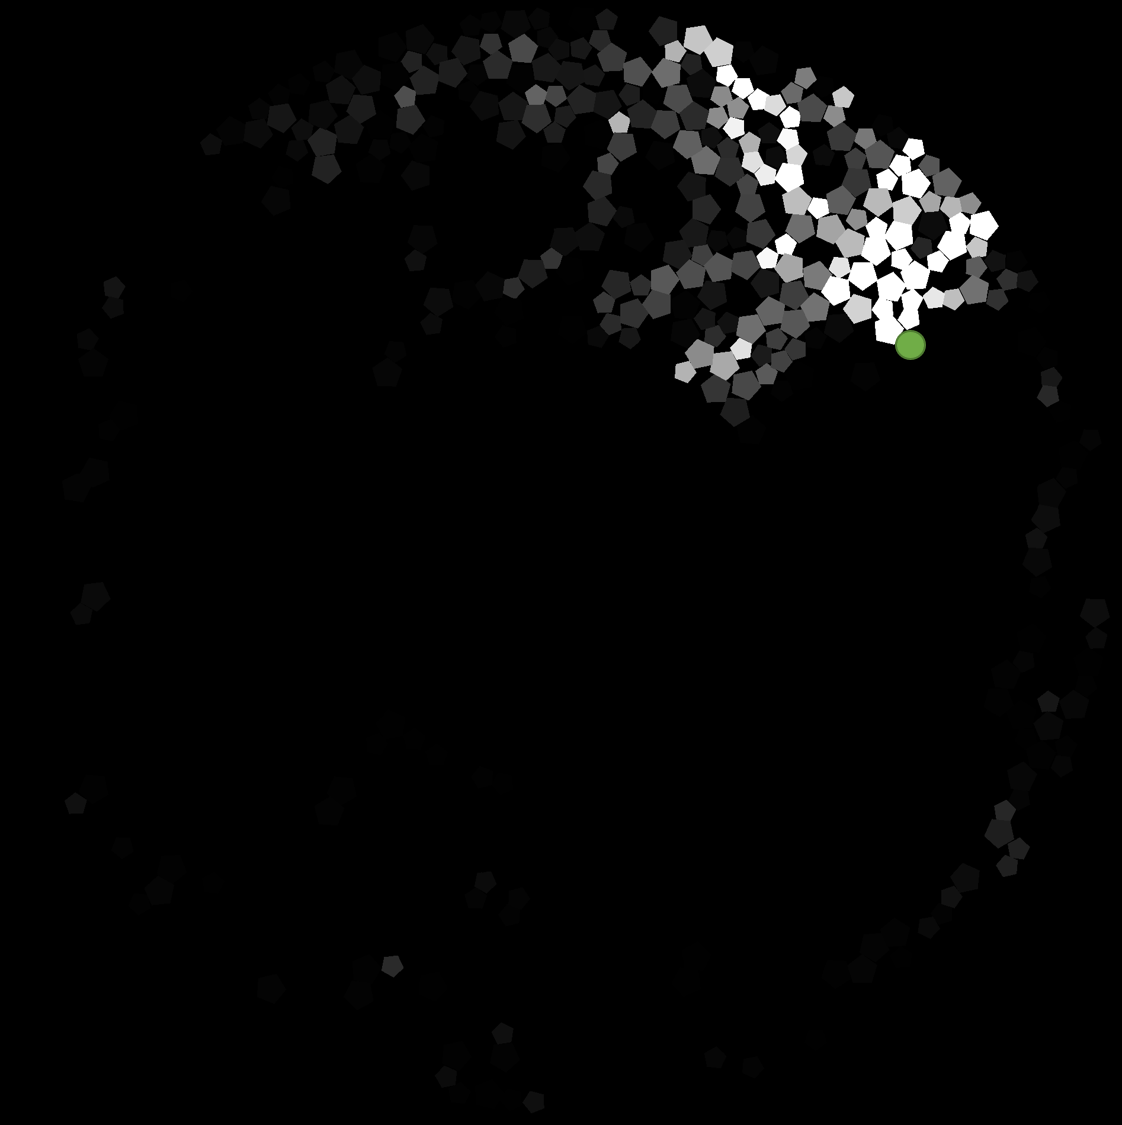
In the present paper, we illustrate the outlined approach in the context of recent experiments and simulations that consider the intermittent dynamics of an intruder in an angular Couette geometry discussed in our recent works [Kozlowski et al. (2019), Carlevaro et al. (2020)]. Figure 1 shows the setup of the experiment motivating the system studied by simulations in this work, and Fig. 2 shows the photoelastic images acquired in experiments as well as processed images of force networks extracted using the G2 method. The latter are produced by measuring the average gradient-squared of the photoelastic image intensity of all pixels within each grain (tracked in a white light image of the system), and drawing all of the grains onto a black background with values corresponding to the average gradient-squared for each grain. In this system, a bidisperse monolayer of around photoelastic disks (or pentagons) is confined to an annular region by fixed boundaries lined with ribbed rubber to prevent slipping at the boundaries. In one set of experiments described in [Kozlowski et al. (2019)], disks were floated on a water-air interface to remove friction with the glass base, while in other experiments with disks and pentagons the particles have basal friction. An intruding disk is pushed in the counterclockwise azimuthal direction (at fixed radius) by a torque spring. One end of the torque spring is coupled to the intruder, while the other end is driven at a fixed angular rate . By using a spring stiffness that is far smaller than the grain material stiffness, we are able to study stick-slip dynamics. Cameras above the system track grains and, by use of a dark-field polariscope [Daniels et al. (2017)], visualize grain-scale stresses as demonstrated in Fig. 2. A detailed analysis of the insights of PH for these experimental data will be presented elsewhere; the goal of the present work is to study the same system using simulations, where exact forces are known and not limited by experimental resolution.
The rest of this paper is structured as follows. In the following section we discuss the simulated systems and TDA methods used in this study. This section also includes a brief discussion of a toy example, which illustrates how PH analysis of the data is carried out. We then follow up with the Results section, where we present the topological measures quantifying the force networks. We will consider both the data obtained in the stick-slip regime, where the intruder is essentially static for significant periods of time, and in the clogging regime where the intruder is rarely at rest. The computations are carried out for both disks and pentagons, so that we can also reach some insight regarding the influence of particle shape on the force networks.
2 Methods
2.1 Simulations
Our model considers the grains as rigid impenetrable 2D objects (disks or regular pentagons) that experience both normal and tangential forces when they are in contact with each other or the walls. The 2D particles slide flat on top of a frictional substrate (a “table”) inside an angular Couette geometry. An intruder particle is dragged through the granular system in a circle (concentric with the annular cell boundaries) by pulling it via a soft torsion spring at a very low speed. The interaction with the substrate is defined by dynamic and static sliding friction coefficients, but rotational friction is set to zero. Since the model is 2D, we do not allow buckling out of the plane, and we assume the interparticle forces have no out-of-plane component. Key parameters are chosen to match the values used in the experiments that inspired these simulations, including particle diameters and masses, dimensions of the confining annular region, driving velocity, and torque spring constant [Kozlowski et al. (2019), Carlevaro et al. (2020)]. We have found that the statistics of the intruder dynamics closely match the experimental results [Carlevaro et al. (2020)].
We have carried out discrete element method (DEM) simulations of the model using the Box2D library [(7)]. The Box2D library uses a constraint solver to handle rigid (infinitely stiff) bodies. Before each time step, a series of iterations (typically 100) is used to resolve constraints on overlaps and on static friction between bodies through a Lagrange multiplier scheme [Pytlos et al. (2015), Catto (2005)]. After resolving overlaps, the inelastic collision at each contact is solved and new linear and angular velocities are assigned to each body. The interaction between particles is defined by a normal restitution coefficient and a friction coefficient (dynamic and static friction coefficients are set to be equal). The equations of motion are integrated through a symplectic Euler algorithm. Solid friction between grains is also handled by means of a Lagrange multiplier scheme that implements the Coulomb criterion. The approach yields realistic dynamics for granular bodies [Pytlos et al. (2015)] with complex shapes. Box2D has been successfully used to study grains under a variety of external drivings [Carlevaro and Pugnaloni (2011), Carlevaro et al. (2020)].
Systems consisting of disks are made up of bidisperse mixtures of small disks (S, with mass and diameter ) and large disks (L, with mass and diameter ) in a (S/L) ratio. We also simulate a bidisperse mixture of pentagons in a ratio, with radii and for the small and large sizes, respectively. The time step used to integrate the Newton-Euler equations of motion is , with the acceleration of gravity acting in the direction perpendicular to the substrate. The restitution coefficient is set to , and the friction coefficient is set to for the grain-grain and grain-wall interactions. The static friction coefficient with the substrate is set to in all cases, whereas the dynamic friction is set to in some simulations (which we call frictional) and to when a frictionless substrate is investigated. The particles are contained in a 2D Couette cell formed by two concentric rings of radii and . These rings have effectively roughened surfaces made up of immobile small equilateral triangles facing inward (toward the annular channel) to prevent the slippage of particles at the boundaries.
The intruder is a disk with and is constrained to move on a circular trajectory midway between the inner and outer rings. The intruder can interact with any other grain in the system but does not interact with the base (i.e., it has no basal friction). It is pulled by a torsion spring with a spring constant of /rad. One end of this spring is attached to the intruder; the other is driven at a constant angular velocity of . This spring can only pull the intruder; no force is applied when the spring becomes shorter than its equilibrium length.
During the simulations, the intruder displays stick-slip dynamics and the particles in the system develop a force network during the sticking periods that fully rearranges after each slip event. These force networks resemble the ones observed in experiments (see Fig. 2). We save the contact forces (normal and tangential components) for every single contact in the system for further analysis though persistent homology, discussed in what follows. Contact forces are calculated from the impulses (normal and tangential) after resolving each contact collision. In the case of pentagonal particles, the side-to-side contacts are defined by two points and two forces (one at each point selected along the contact line). The total force at the contact is obtained as the vector sum of these two forces.
2.2 Two networks: Contact and particle force network
In this section, we present a toy example that clarifies definitions of the contact force and particle force networks. In the following section these networks are used to demonstrate basic properties of persistence diagrams. Roughly speaking, both force networks are defined by a real valued function on a contact network created by the particles. We start by considering an ensemble of the particles . The contact network CN is a network with vertices corresponding to particle centers. An edge , is present in the contact network if the particles and are in contact.
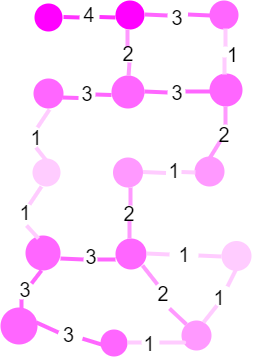
To define the force networks we need to assign real values to both vertices and edges of the contact network CN. If we know the forces between the particles, then it is natural to define the value of a function to be the magnitude of the force acting between the particles and . For the reasons explained below we extend the definition of to the vertices, so that the value at the vertex is the maximum value of on the edges that contain . Figure 3a shows a simple example of a possible contact force (FC) network. In this toy example we specify the forces values by hand; for the data discussed in the Results section, these forces are obtained from simulations.
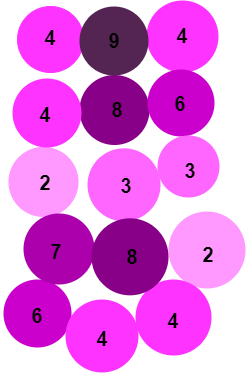
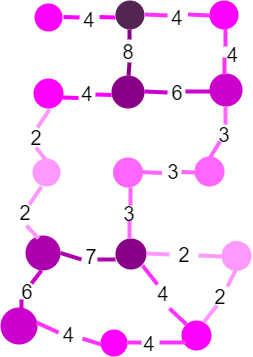
On the other hand, if only the total force on each particle is known, it is natural to define a particle force (FP) network by a function with the values on the vertices equal to the total force experienced by the particle . Again for the reasons explained below, we expand the definition of to the edges by . Figure 3b-c shows an example: note that the forces on the vertices are defined by the sums of the forces on the edges from Fig. 3a (these forces are shown in Fig. 3b), and then the forces on the edges are assigned as a minima of the forces on the adjacent vertices, as described above. These forces are shown in Fig. 3c.
The aim of the persistent homology is to understand the structure of the force networks for all values (thresholds) of the force. For the FC network, the persistent homology describes how the topological structure of the super level sets changes with . Similarly, for the FP network, the level sets are given by . In order to use persistence homology the families of super level sets and have to satisfy the following property. If the edge belongs to a given super level set, than both vertices, and , must belong to this set as well; this governs our choice for extending the functions and .
To relate these networks to the ones that are obtained in experiments or simulations of granular systems, we note that, on the one hand, the FC network requires as an input all the contact forces, which are difficult to obtain in experiments. On the other hand, the FP network requires only the total force on a particle, which in experiments can be estimated based on G2 information only.
Our toy example illustrates that there is no clear connection between these two networks, since the structure of and is very different. For example, the top two layers of particles are connected by edges with much smaller values in Fig. 3a than in Fig. 3c. This should not come as a surprise since the networks are defined in a very different way. The FC network describes structure of the force chains through which the force propagate. Thus, the edges with high values tend to belong to strong force chains. On the other hand, for the FP network, high values on the vertices indicate particles at the junctions of force chains.
Clearly, the considered networks are different and their direct comparison is not possible. Instead, the natural question is whether the evolution of the features of one network is closely correlated to the evolution of the features of the other. To find the answer to this question we use persistent homology.
2.3 Persistent Homology
For the present purposes, one can think of persistent homology (PH) as a tool for describing the structure of weighted networks, such as and , defined in the previous section. The reader is referred to [Shah et al. (2020)] for a more detailed overview of application of PH to dense granular matter from a physics point of view, and to [Kramár et al. (2016)] for a more in-depth presentation. To facilitate understanding of the insight that can be reached by using PH, we briefly outline the main ideas and demonstrate them on the above toy example.
Given a weighted network, PH assigns to it two persistence diagrams, and , which describe how the structure of the super level sets changes with the threshed . The diagram encodes how distinct connected components in super level sets appear and then merge as the threshold is decreased. The appearance and merging of these components is precisely encoded by the birth and death coordinates of the points in the diagram. To put this in context, in a granular system, high threshold values correspond to strong forces, the components correspond to ‘force chains,’ and merging corresponds to force chains connecting at the lower force levels.
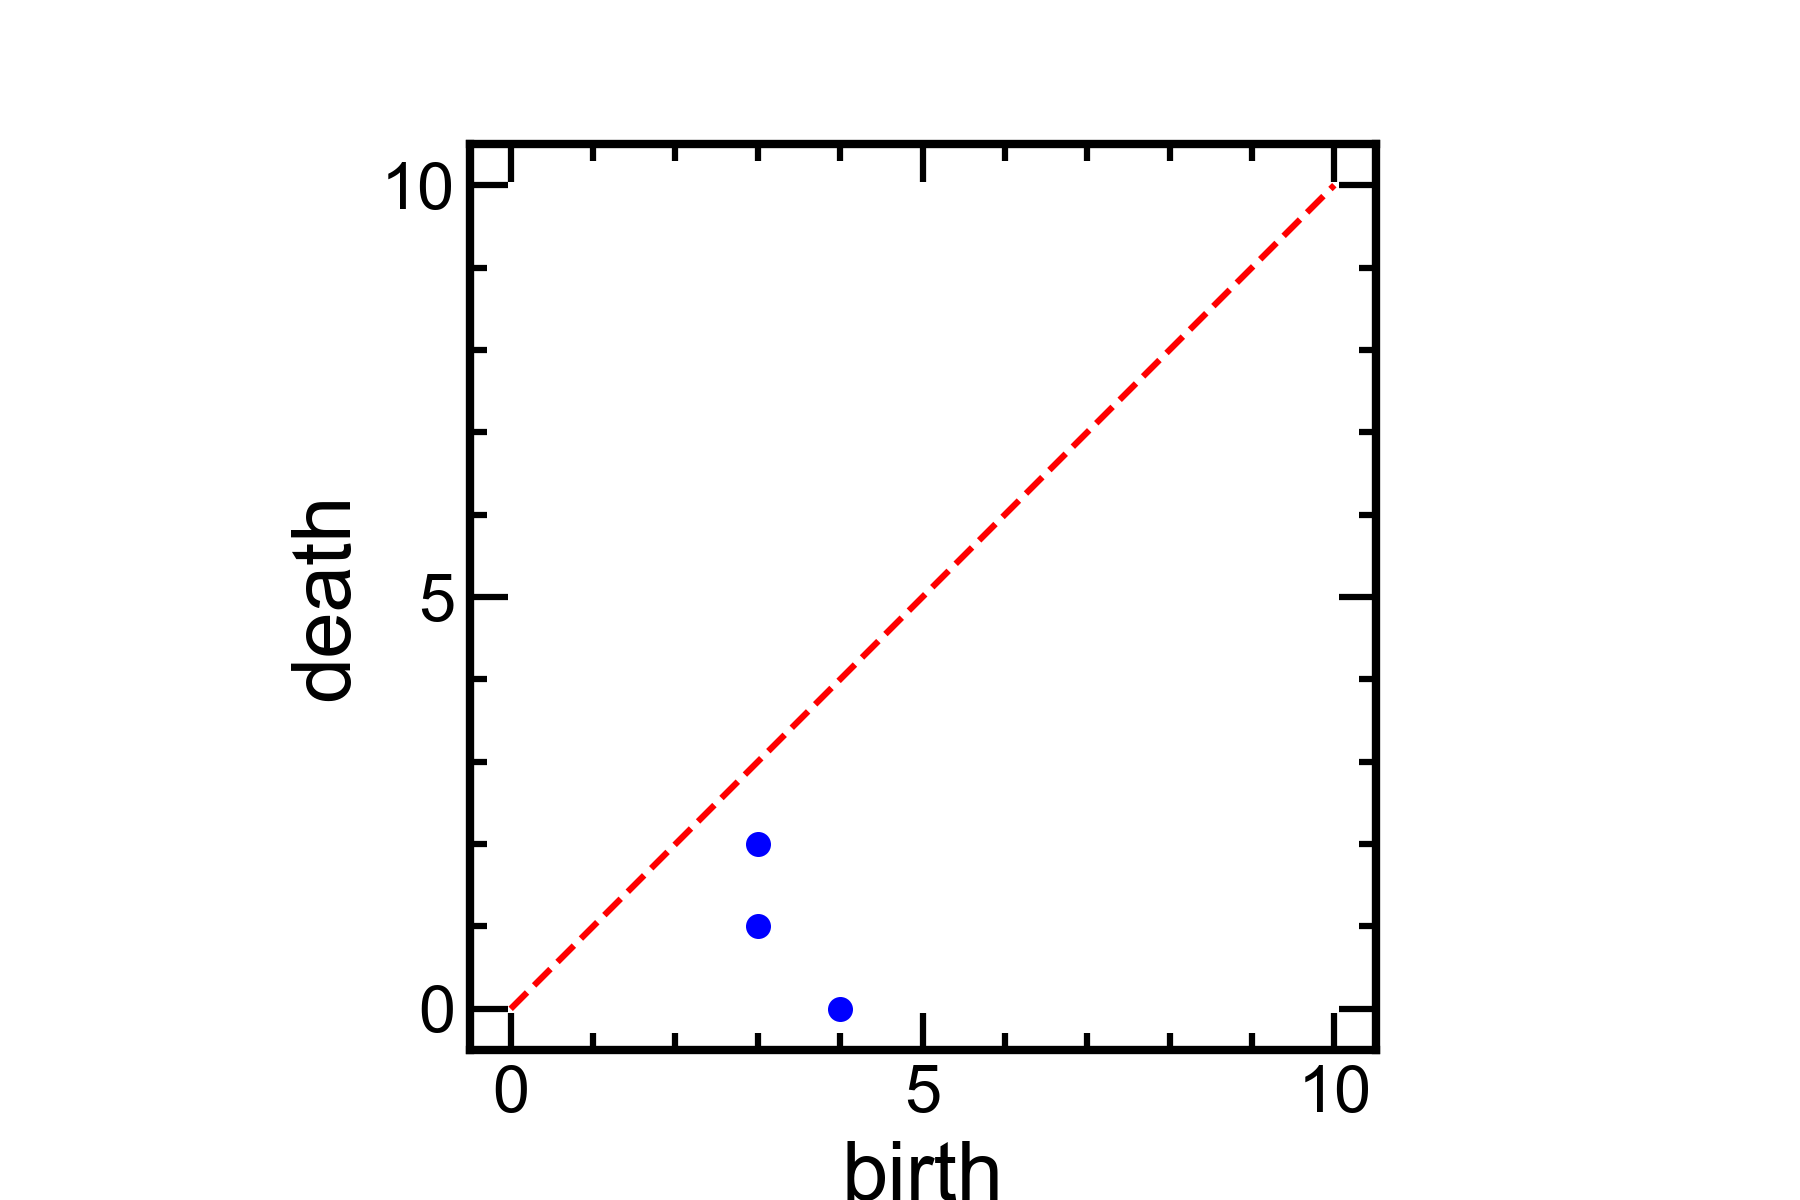
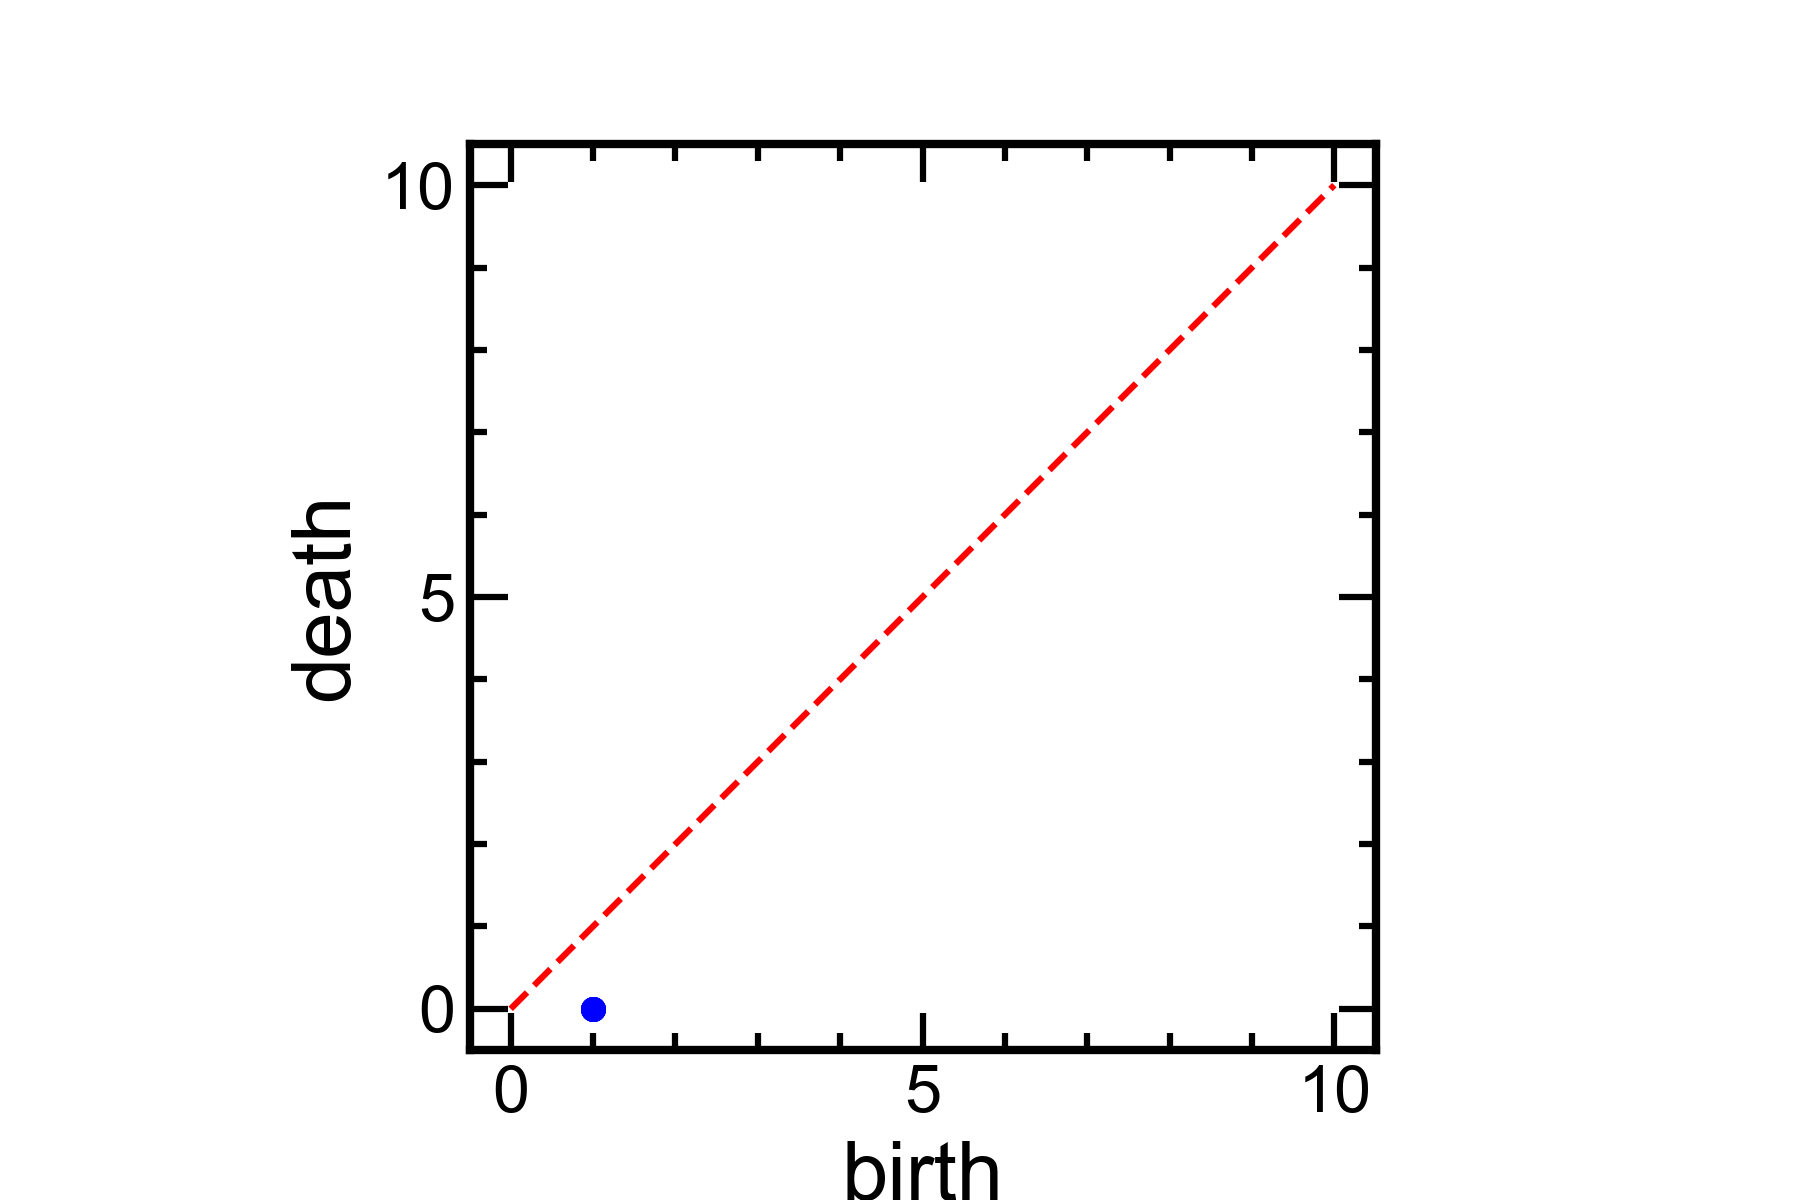
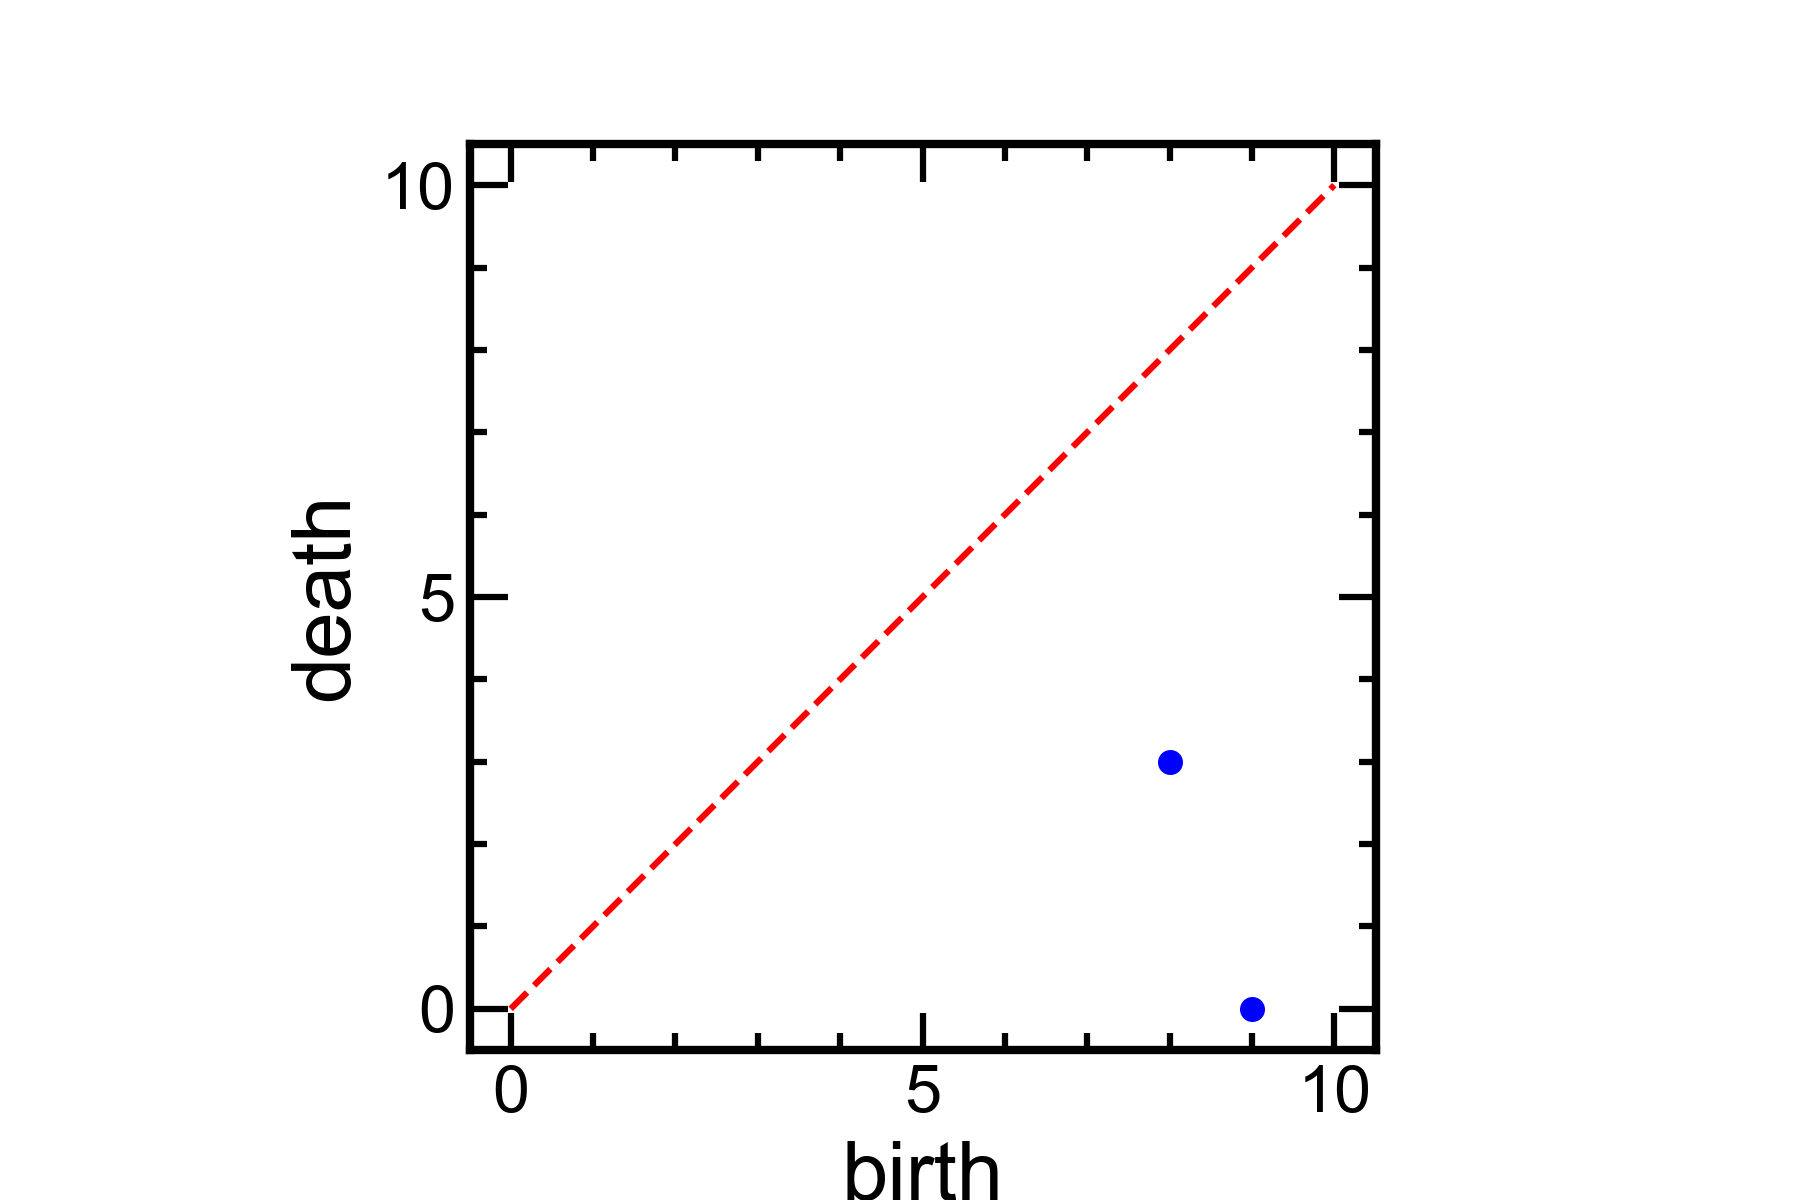
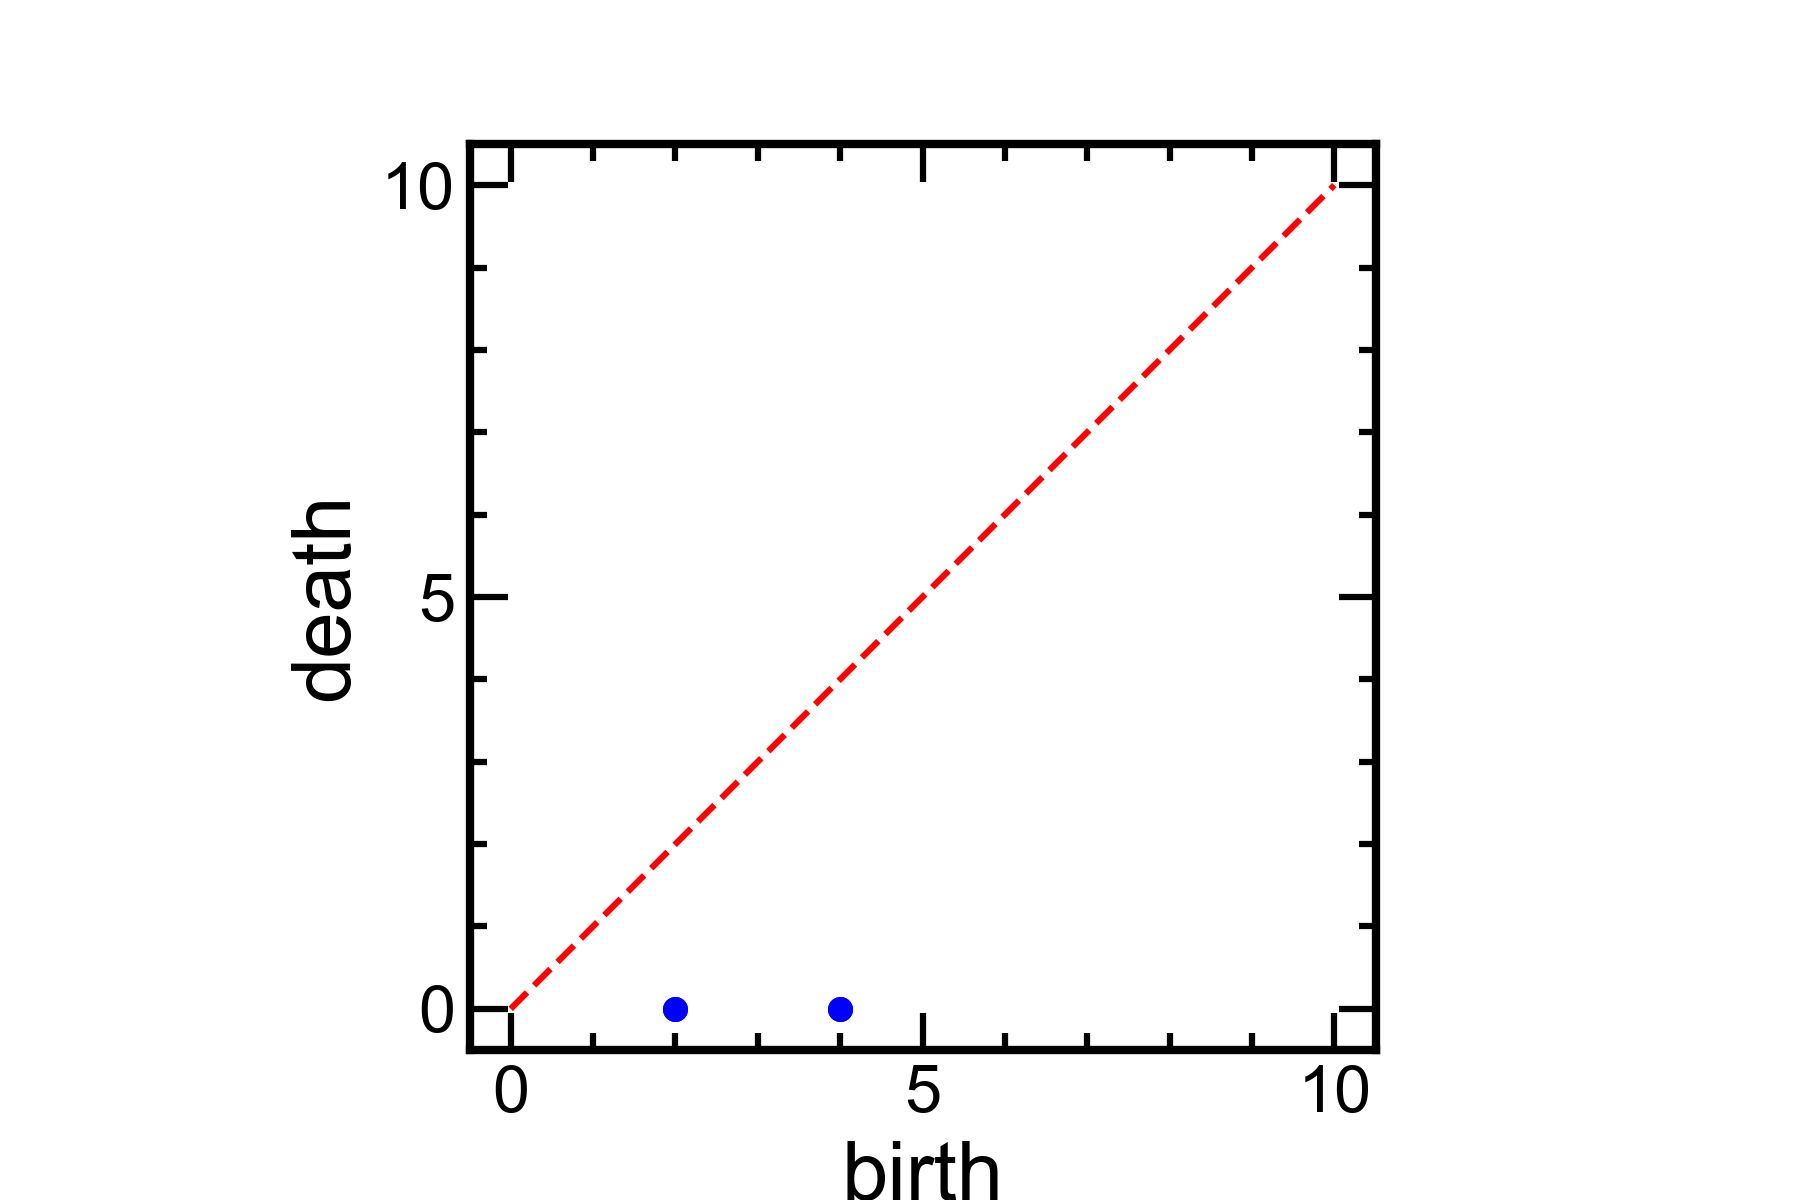
Figure 4a illustrates this process using networks from Fig. 3a. In this network, the first connected component appears for and is represented by the point in with the birth coordinate value . There are two more points in this diagram with birth coordinates at , and they represent two distinct components that appear at this threshold, one at the bottom of the network and the other consist of the edges in the second layer from the top. The latter component merges with the top layer at , and we say that it disappears (dies) at this value so that the lifetime of this component is described by the point . The bottom component merges with the rest of the network at and is represented by . Finally, the first component that appeared for is present for all values of and is identified by the point . Again to put this in context, we note that the points in the diagram can be related to the common (even if not always well defined) concept of force chains. The birth and death coordinate indicate the force levels at which different force chains form and merge.
The persistence diagram , shown in Fig. 4c for the FP network, describes the appearance and disappearance of the connected components in the network depicted in Fig. 3c. Clearly, this diagram is different from the one for , since the networks are different. As we already mentioned, the high values in FP network are attained at the places where ’force chains’ come close to each other or intersect. As indicated by the presence of two points in , there are two distinct place in the FP network where this happens, as visible in Fig. 3b-c.
In a similar manner, the diagram describes the appearance of the loops (cycles). Note that if a loop appears in the super level set at a given threshold , then it is present for all values , and is represented by the point . For the FC network shown in Fig. 3c, there are four loops that appear in the at , as shown in Fig. 4b and they are represented by four copies of the point in . For the FP network, there are four loops. Two appear at the top right and the bottom left of the network at , and are represented in by two copies of the point . The other two are born at and are described by two copies of in . Similarly as we discussed in the context of , the are different for the FC and FP networks.
An important aspect of PH is that it provides information about the force networks at all force levels. So, unlike other measures, it does not require separation of a force network into a ‘strong’ or a ‘weak’ network, although it allows for such classification, as we will discuss also in the Results section. We note that each feature of the network can be described by a point (where stands for birth and for death) in one of the persistence diagrams. Moreover, the prominence of a feature is encoded by its lifespan defined as .
The description of a weighted force network in terms of PDs provides a compact but meaningful description of the features of the underlying network. As demonstrated by Fig. 3, the PDs clearly describe the differences between the FC and FP networks. It should be noted, however, that the space of PDs is a nonlinear complete metric space [Mileyko et al. (2011)], and there is no readily available method for correlating the diagrams. Hence, in the rest of this paper, we will consider several different metrics that can be defined for PDs. Introducing these metrics leads to a further data reduction. Still, as we will demonstrate, such metrics provide relevant summaries of the properties of the considered networks. One considered metric is the number of points (generators) in a diagram. Another option is the lifespan, already introduced above, which describes for how long (that is, for how many thresholds levels) a point persists. Using a landscape (mountains and valleys) as an analogy, the number of points, NG in corresponds to the number of mountain peaks, and the lifespan corresponds to the difference in altitude between a peak and a valley. Lifespans of all the points in a persistence diagram can be aggregated into a single number by defining the total persistence, TP, as a sum of all lifespans. We will be using both NG and TP in discussing some properties of the force networks in the considered system.
In our calculations, we define FC and FP networks based on the normal force between the particles, suitably normalized. The PH calculations leading to persistence diagrams are carried out to compute PDs for both FC and FP networks using the software package Gudhi [(16)]. We focus on the interparticle interactions only, and do not consider particle - wall forces in the present work.
3 Results
In this section we first discuss the general features of the results for the considered networks, and then focus our discussion on the main topic of the paper: the differences between the contact force (FC) and particle force (FP) networks.
3.1 Contact force and Particle force networks: General features
Figure 5 (see also associated animations FN-disk and FN-pent) shows the FC and FP networks obtained by simulations based on the same setup as the experiments, depicted in Fig. 2. As we have already discussed, these two networks exhibit different features and cannot be directly related. Instead, we show that the time evolution of the features exhibited by these networks is correlated. We will demonstrate this by first extracting the topological measures introduced in the previous section for a large number of both networks and then cross-correlating them.
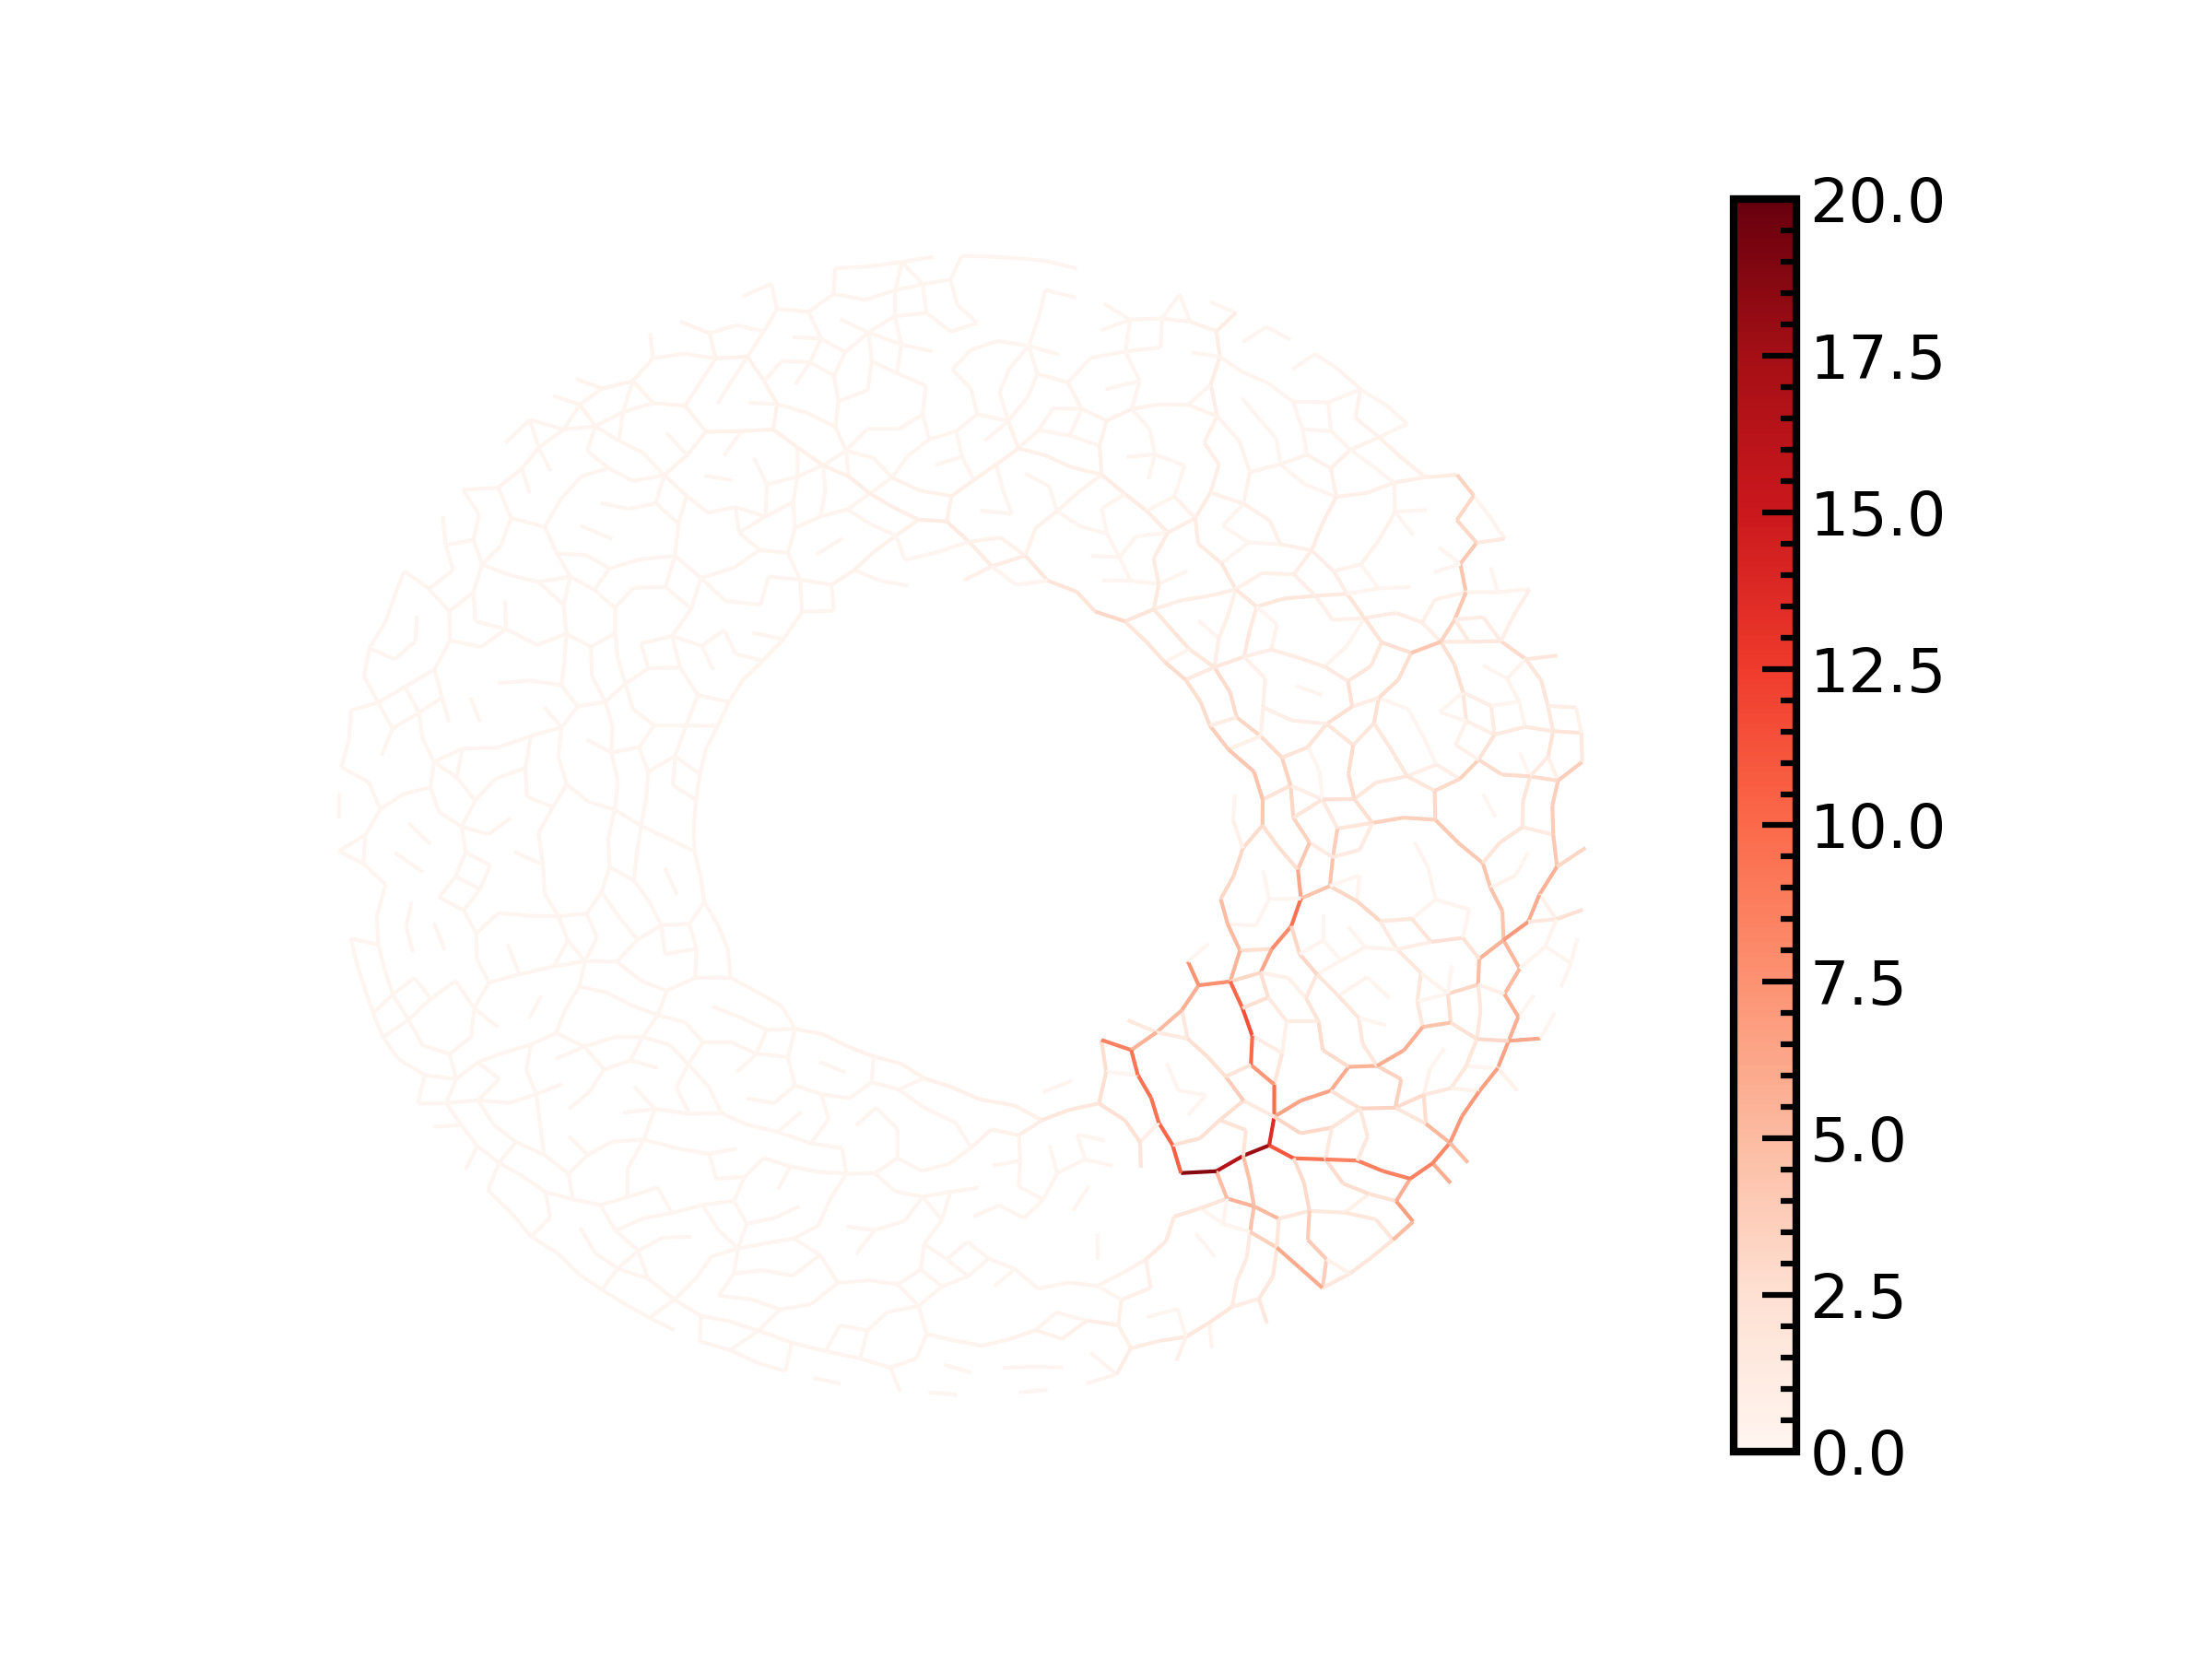
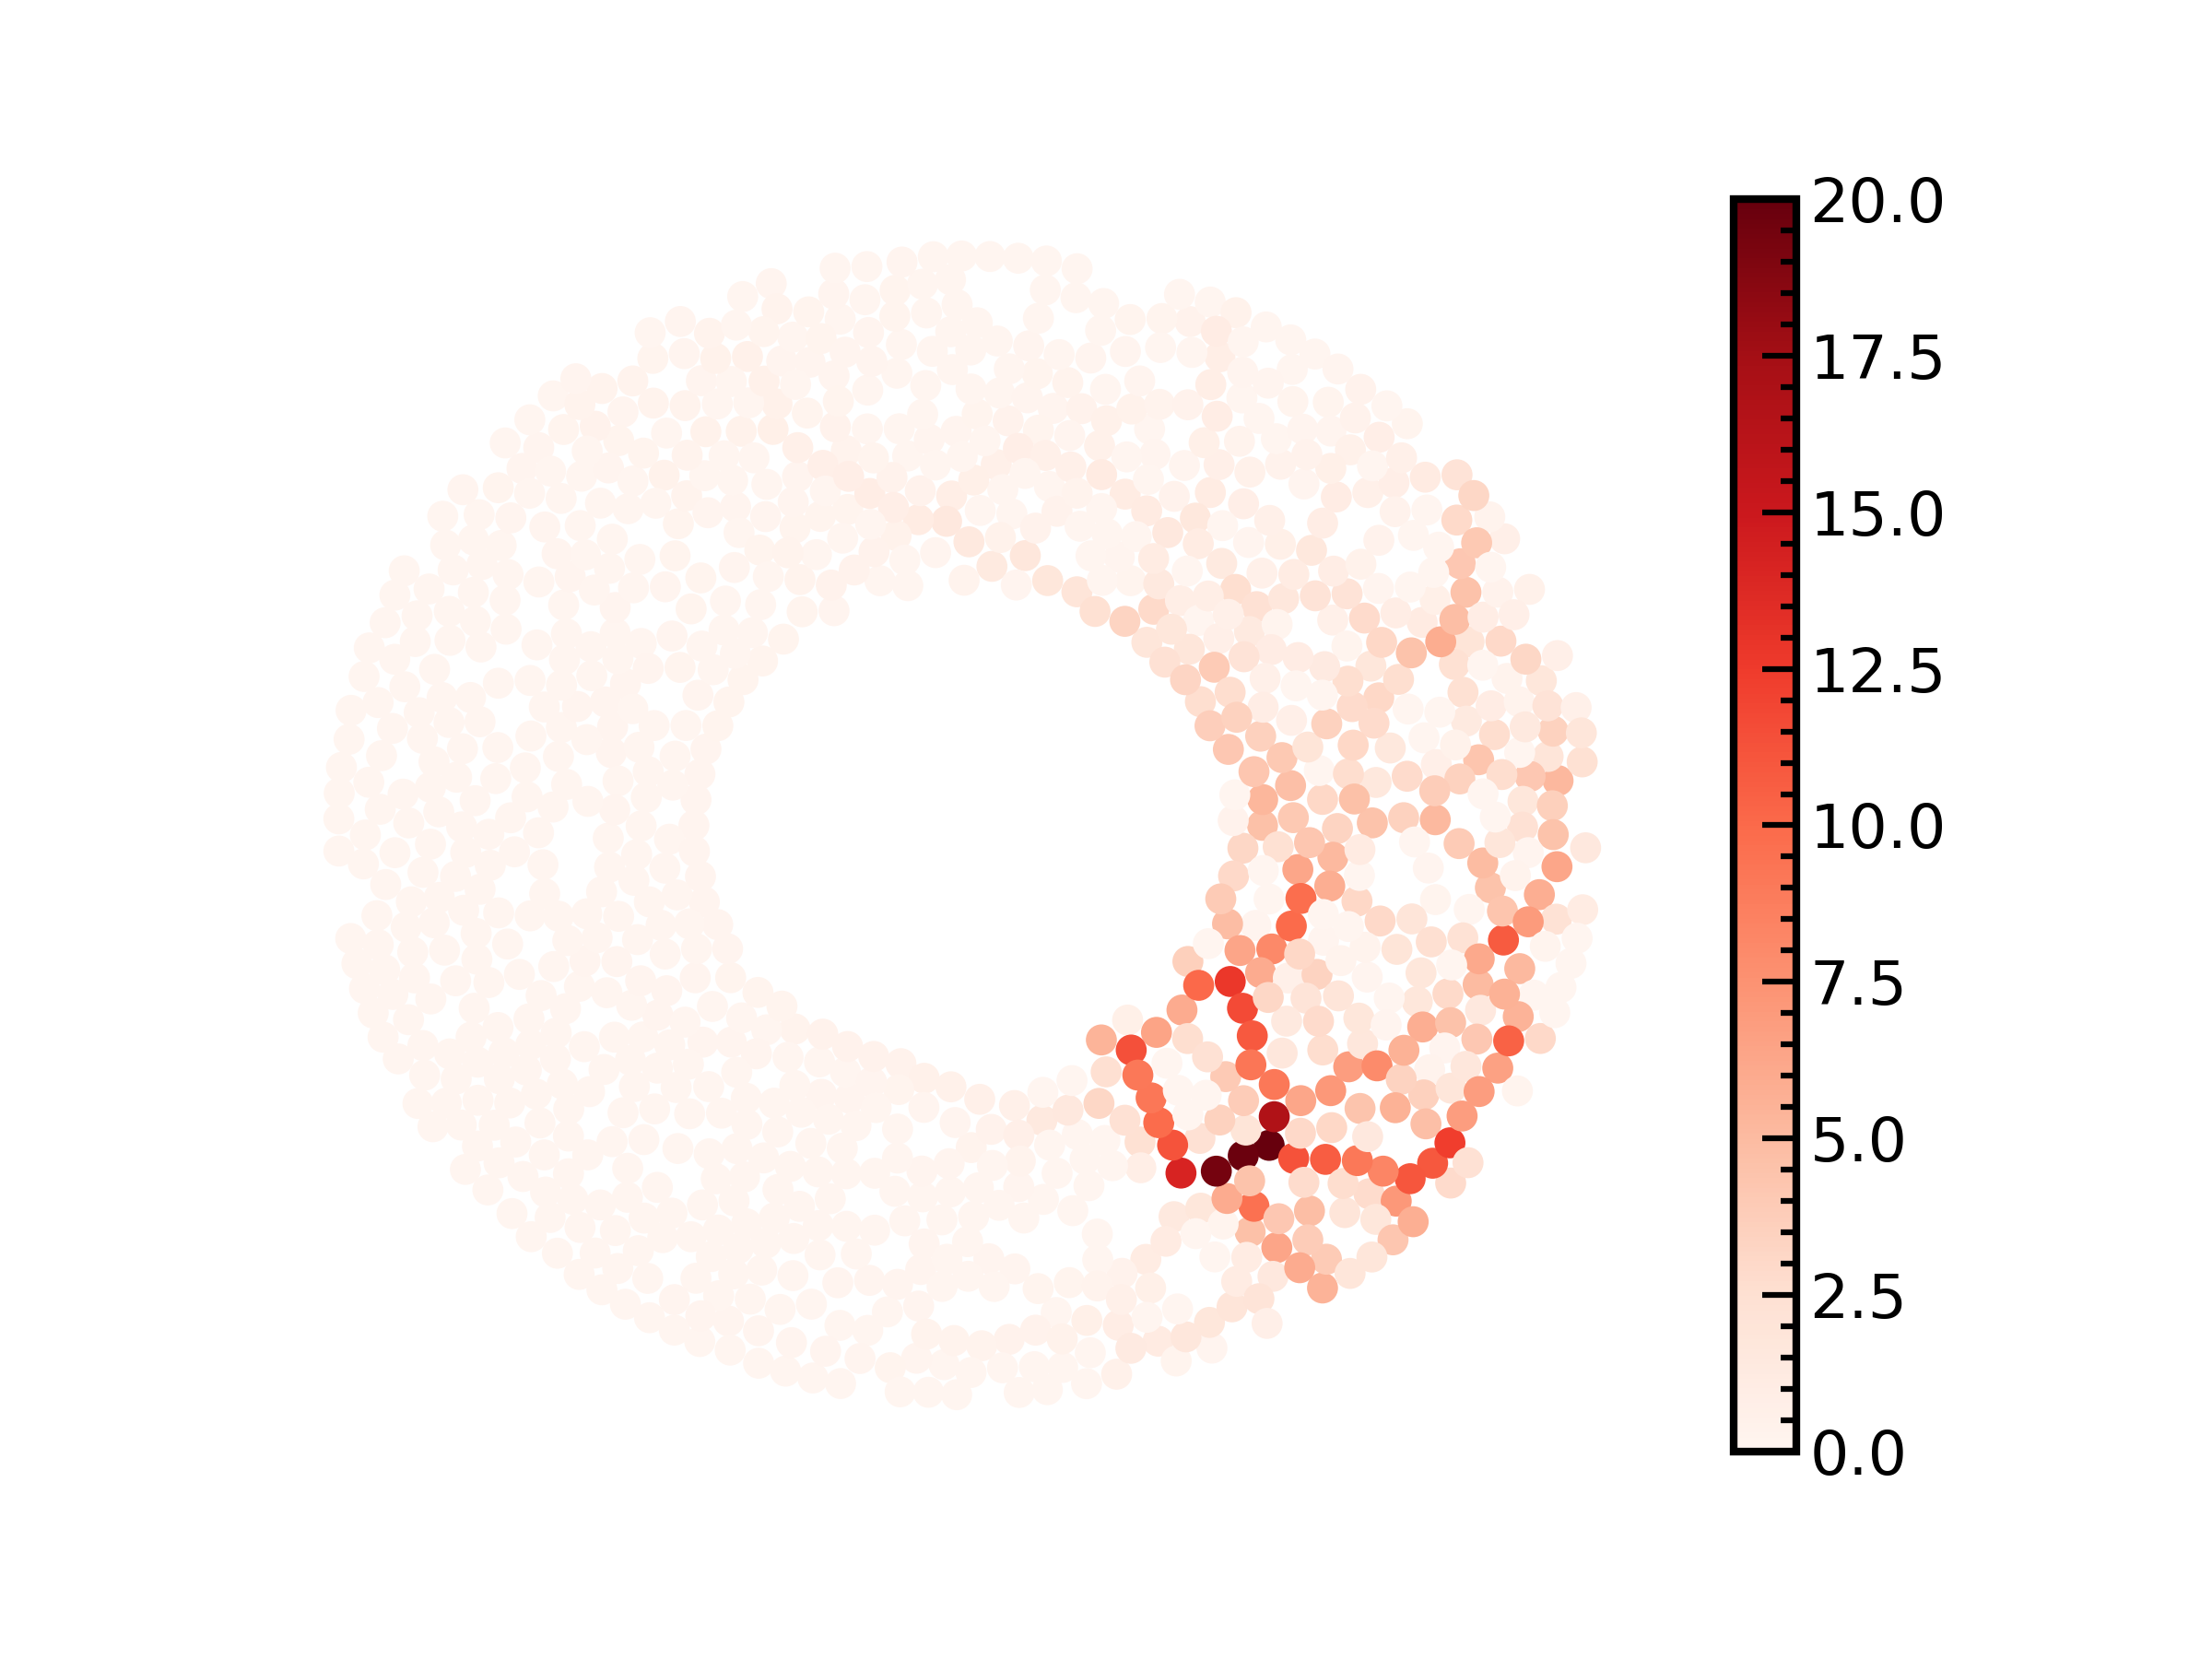
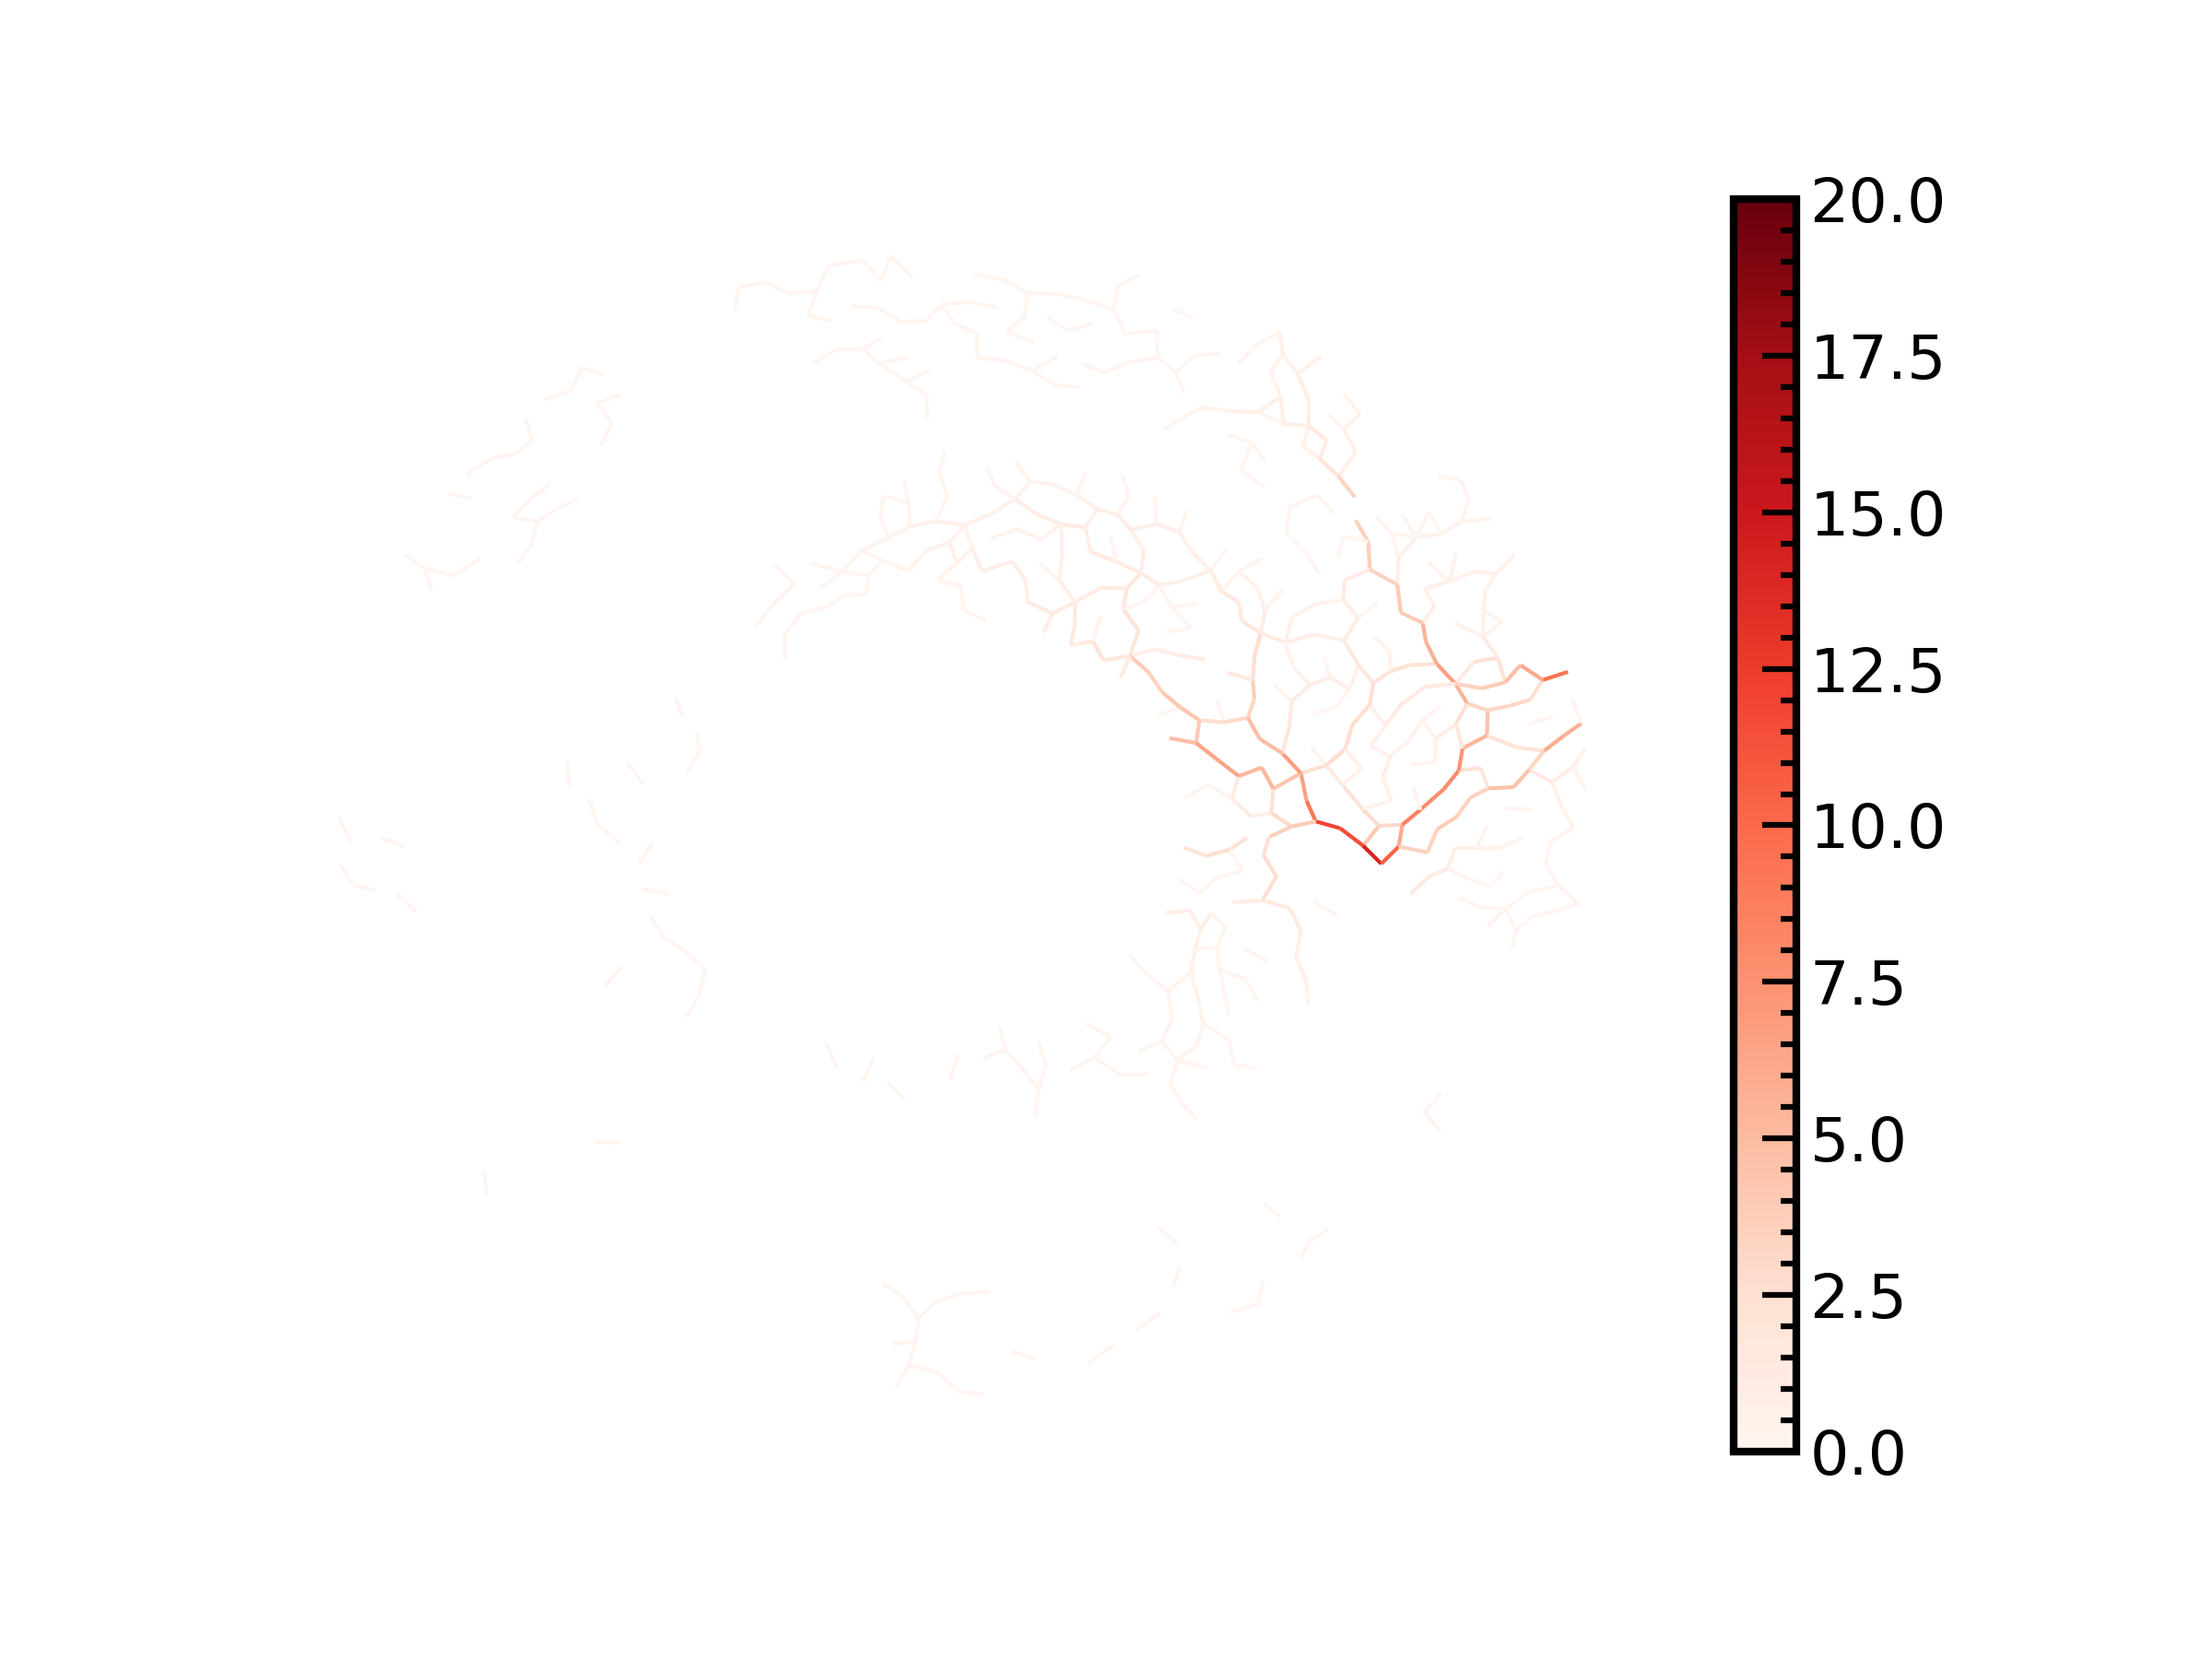
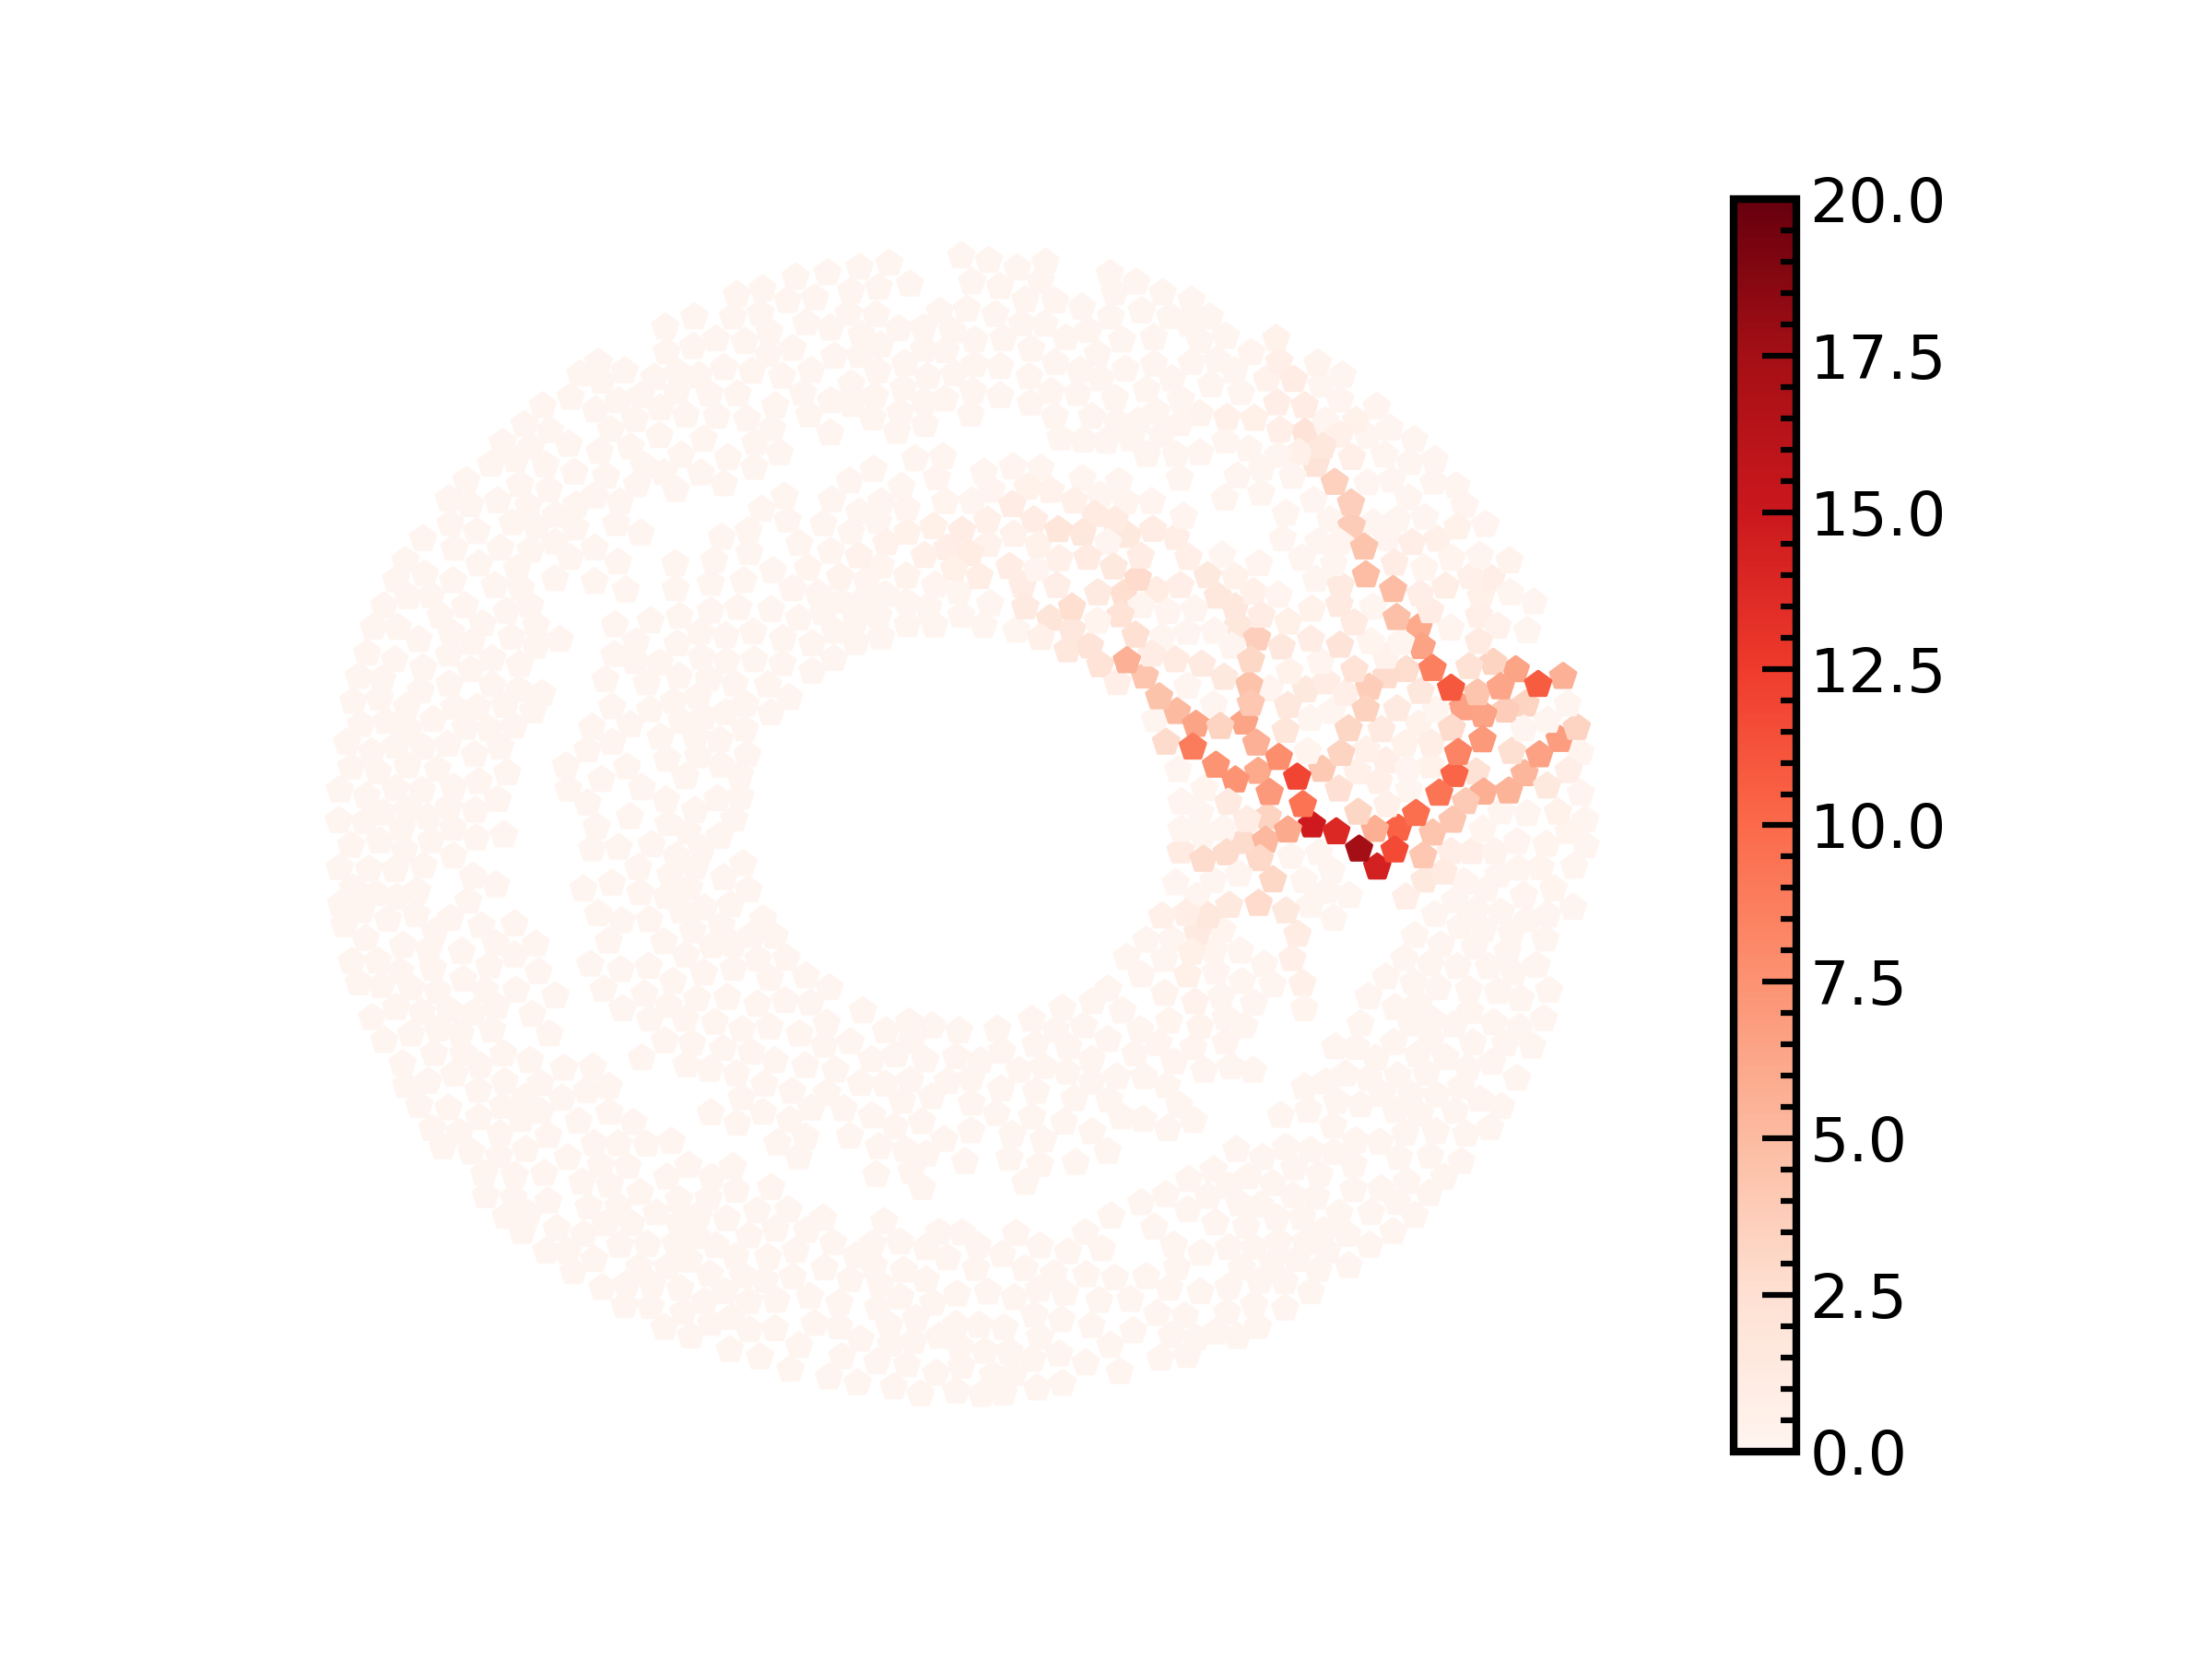

The functions and describing the FC and FP networks are defined as in the previous section using the normal forces between the particles. In the considered system, the average force between the particles fluctuates significantly during the evolution, so we normalize the computed forces by their (time-dependent) average first. The function is normalized by the sum of its original values over the edges divided by the number of edges (only the edges characterized by non-zero forces are considered). The function is normalized by the sum of its original values over the vertices (particles) divided by the number of vertices, again considering only the vertices (particles) characterized by a nonzero force. Figure 5 shows these normalized functions. For visualization purposes, each vertex is plotted as the approximate size of the particle at whose center it resides.
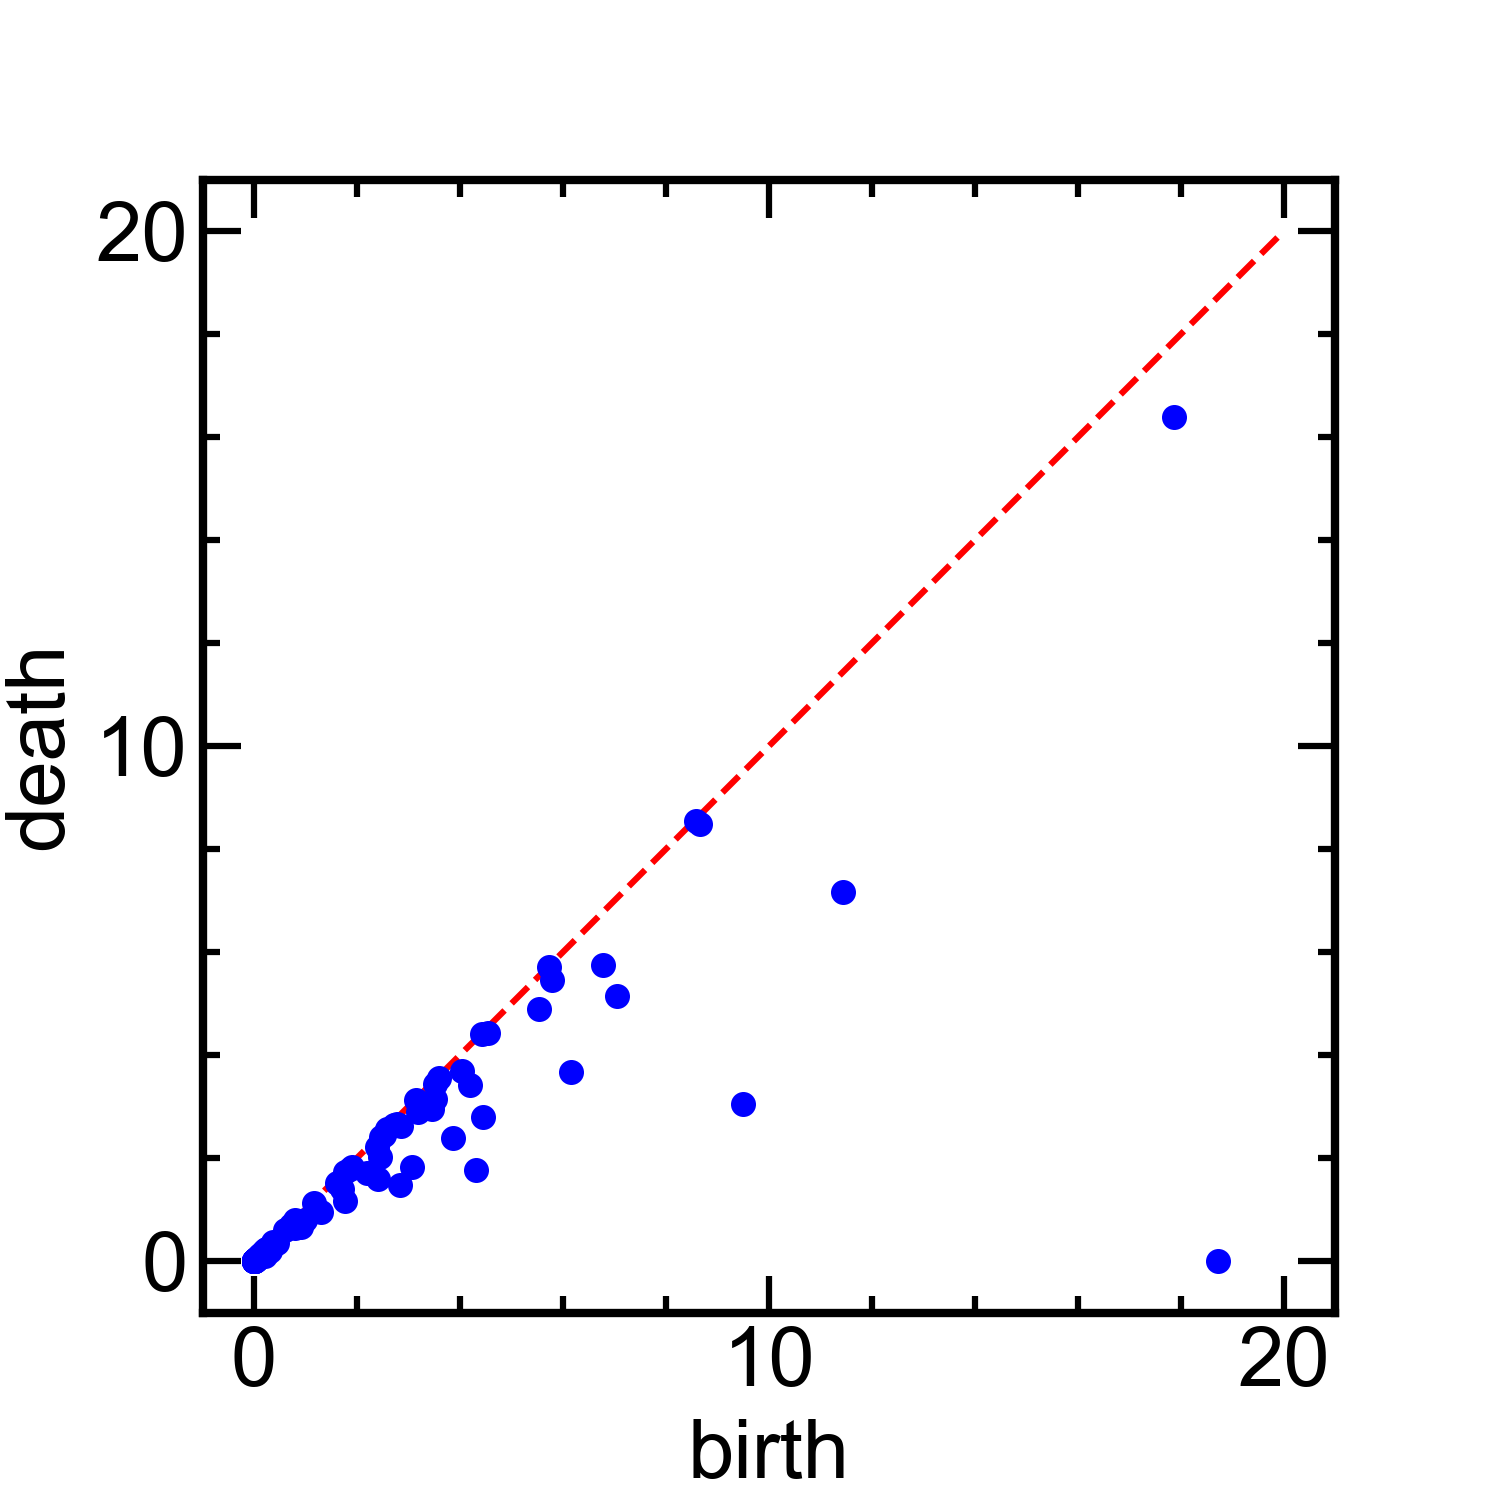
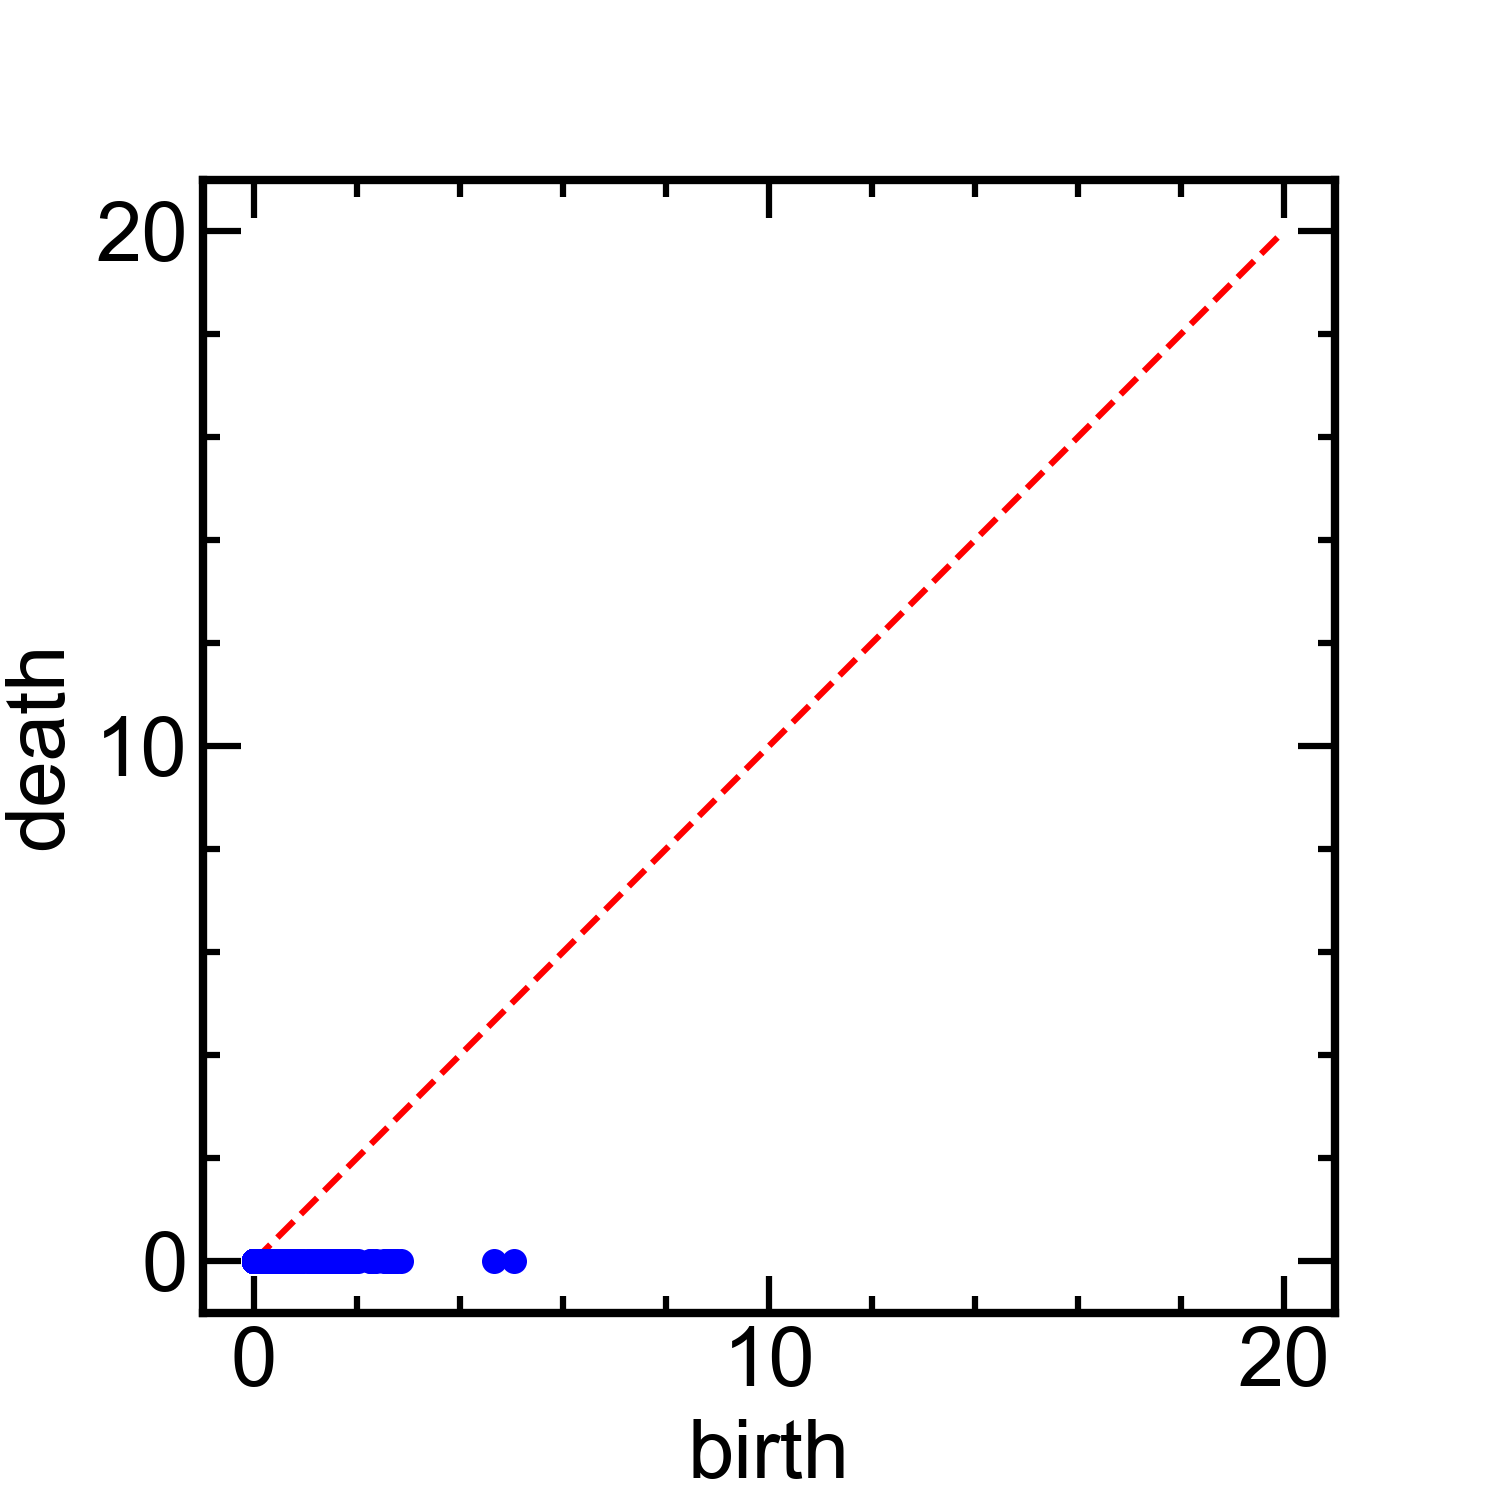
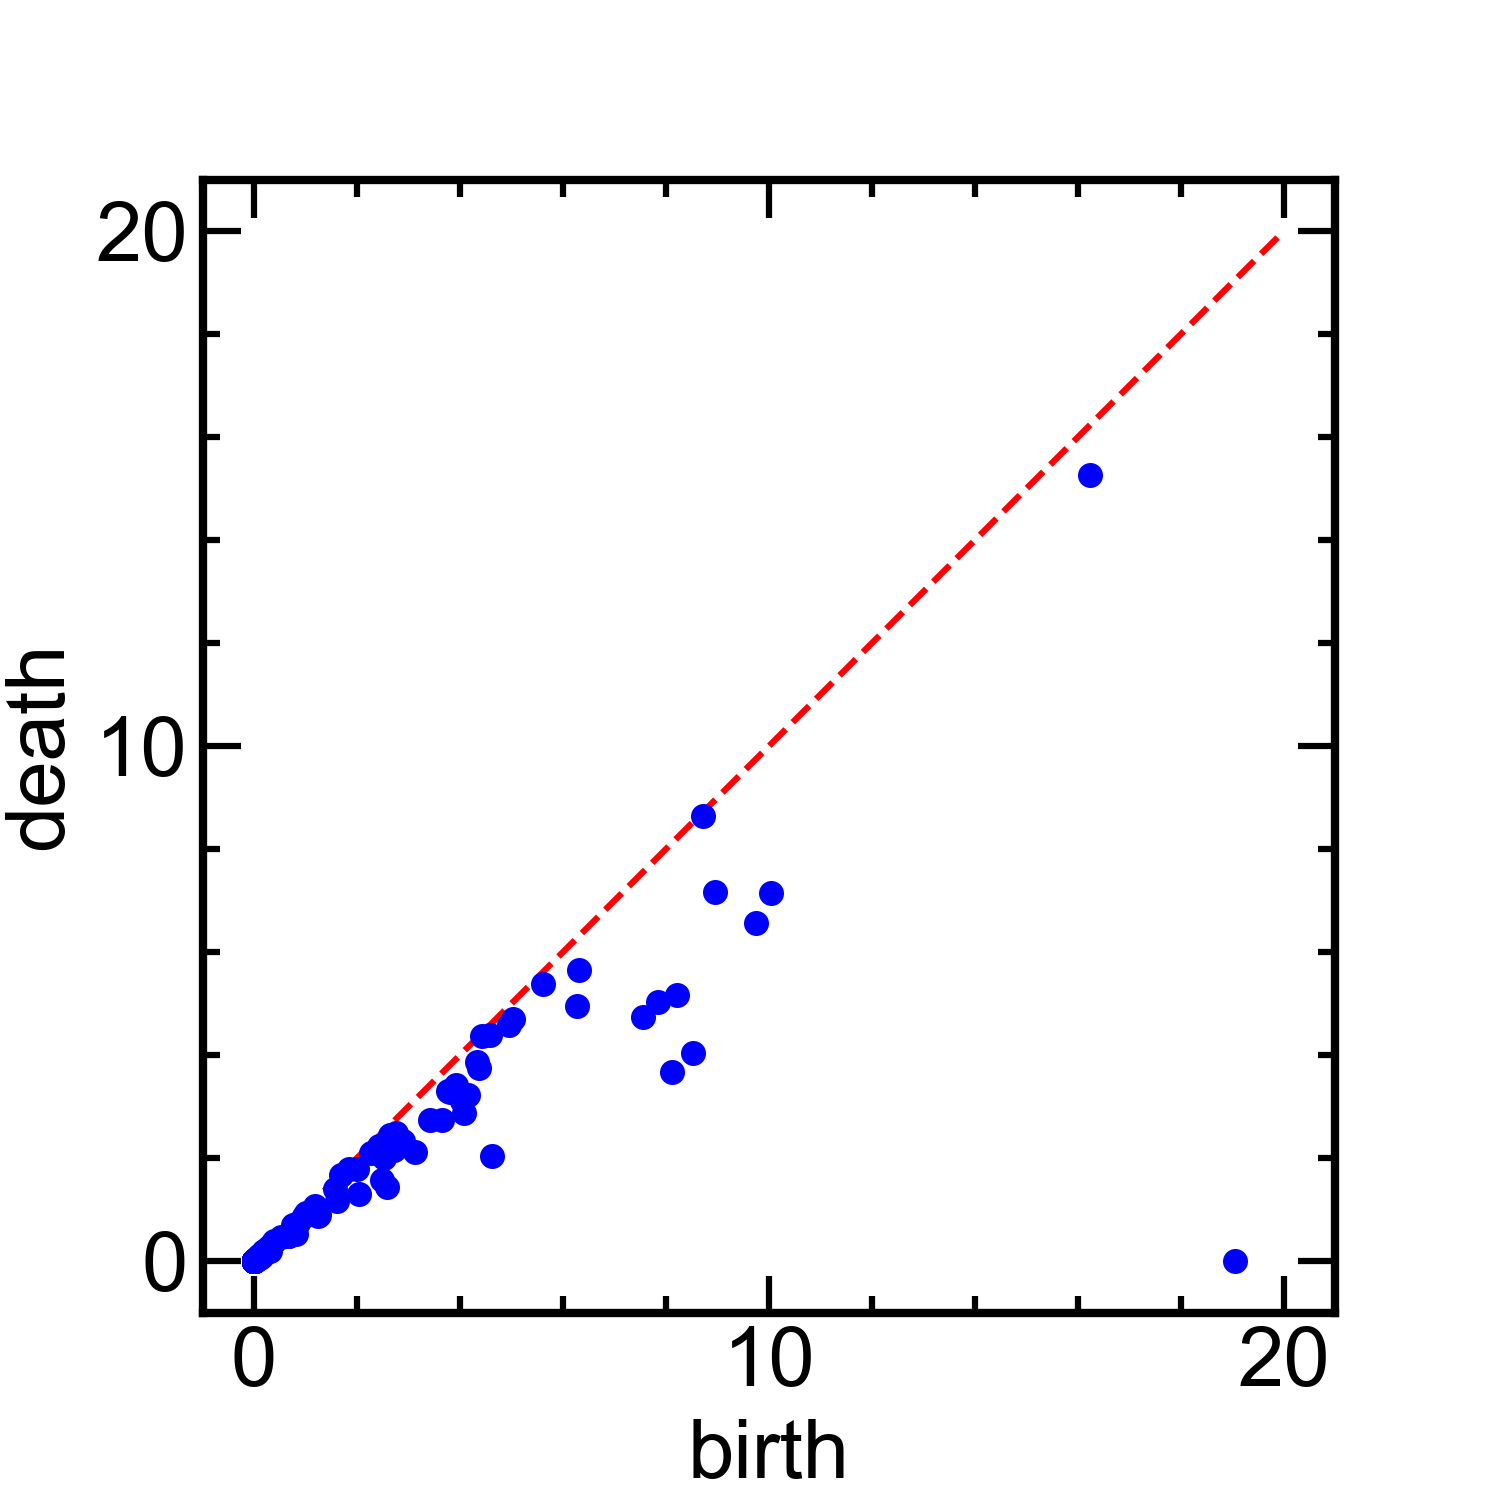
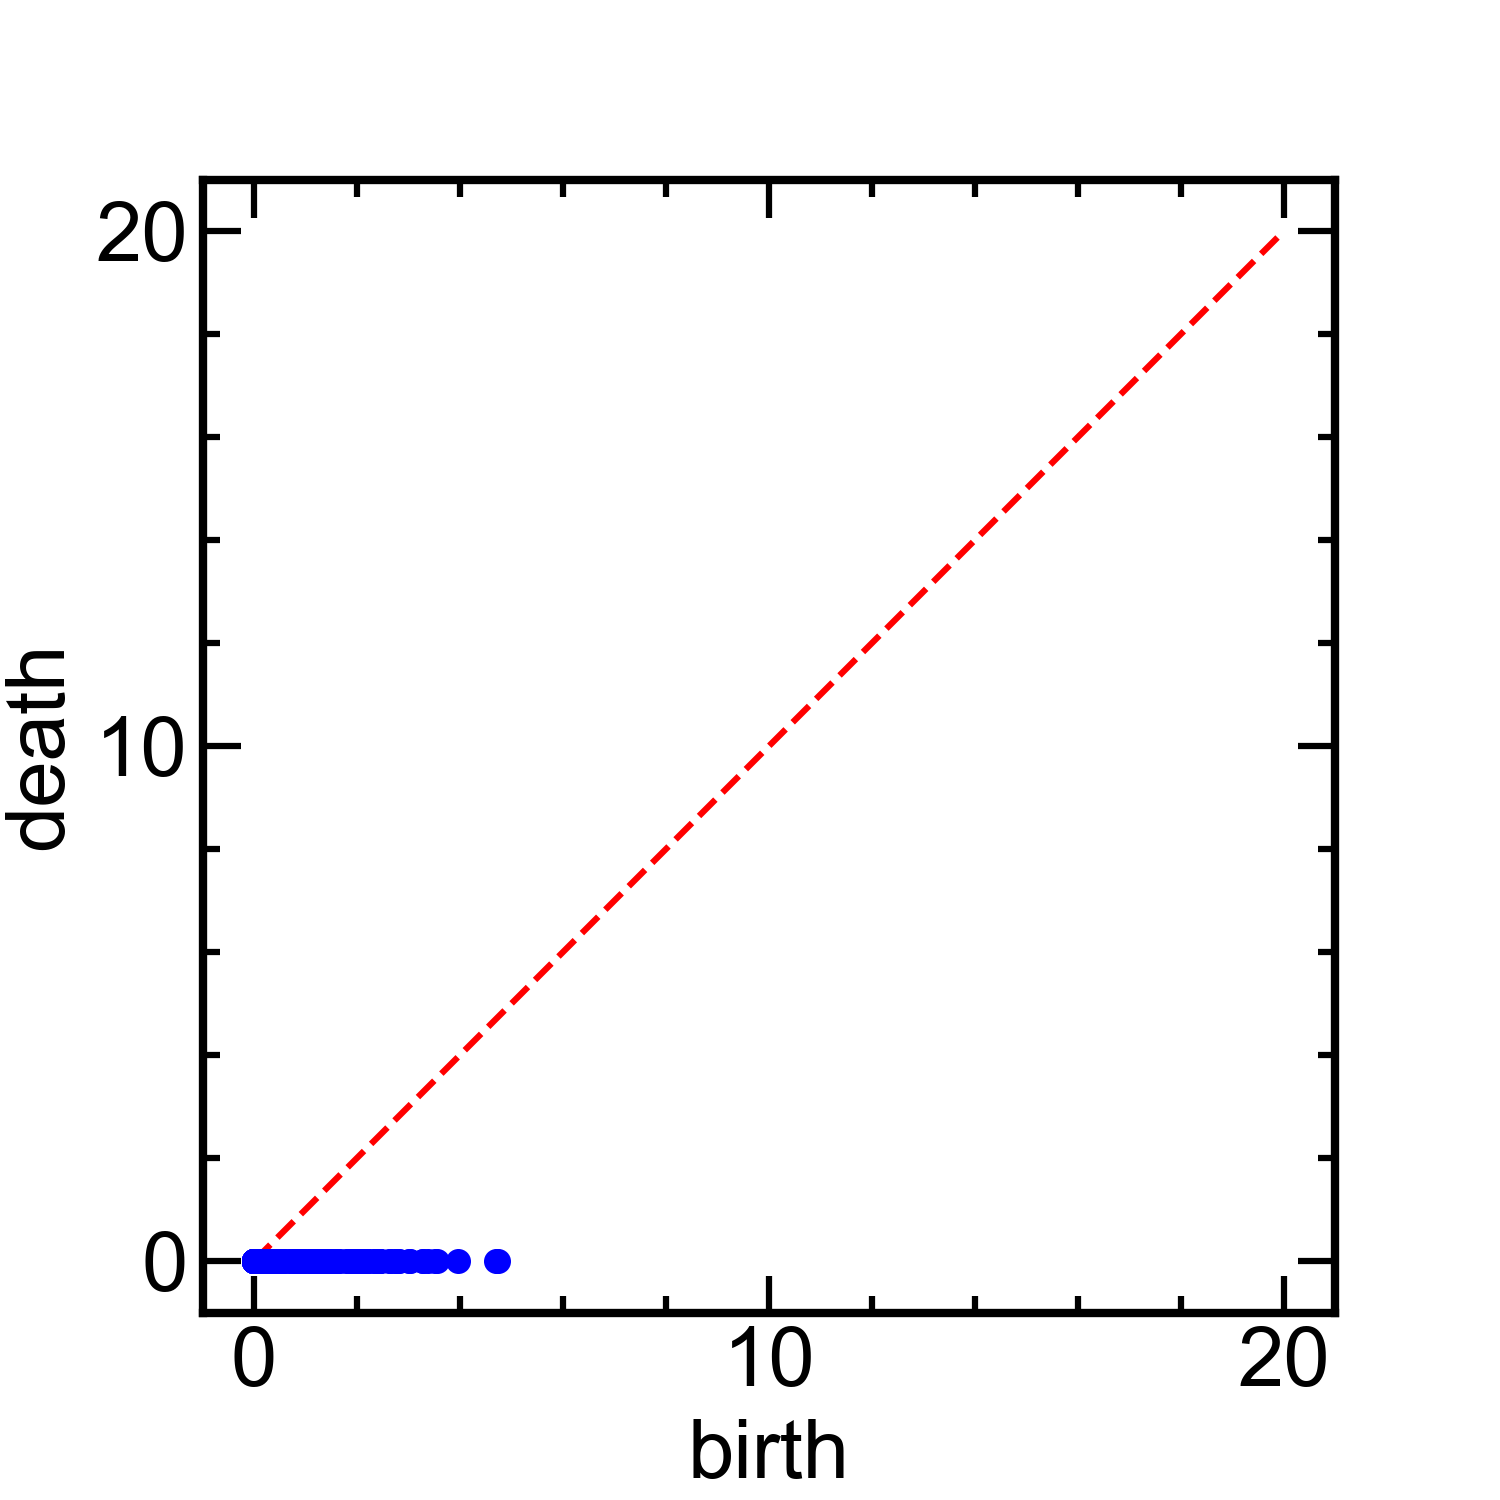
The persistence diagrams corresponding to Fig. 5, are computed from the and networks, respectively. Figure 6 shows the corresponding diagrams (see also associated animations, pd-disk and pd-pent). We will analyze the properties of a large number of such diagrams in the next section, focusing mostly on two measures: the total persistence (TP) and the number of generators, NG. In interpreting the results, it is useful to remember that the generators that are close to the diagonal represent the features that persist just for a small range of thresholds and therefore are not significant. The significant features are the ones that are far away from the diagonal. We will see later in the paper that excluding these insignificant features may help considerably in relating the FC and FP networks.
3.2 Comparison of contact force and particle force networks: Disks with basal friction
After specifying how the PDs for the two types of networks are computed, we now proceed with the comparison of the large number of diagrams, extracted from time-dependent simulation data. In our analysis, we consider four systems, with their choice motivated by our previously reported results discussing intruder dynamics [Carlevaro et al. (2020)]. First, we discuss the results obtained using disks in simulations that include the basal friction (friction with the substrate) for packing fraction ; then we proceed with pentagons for . In such systems, for the simulation parameters that we use, the intruder exhibits stick-slip dynamics. Then we proceed with briefly considering the same particles shapes and ’s, but without basal friction. Such systems experience clogging type of dynamics. These four considered systems therefore differ by both particle shapes and the type of dynamics.
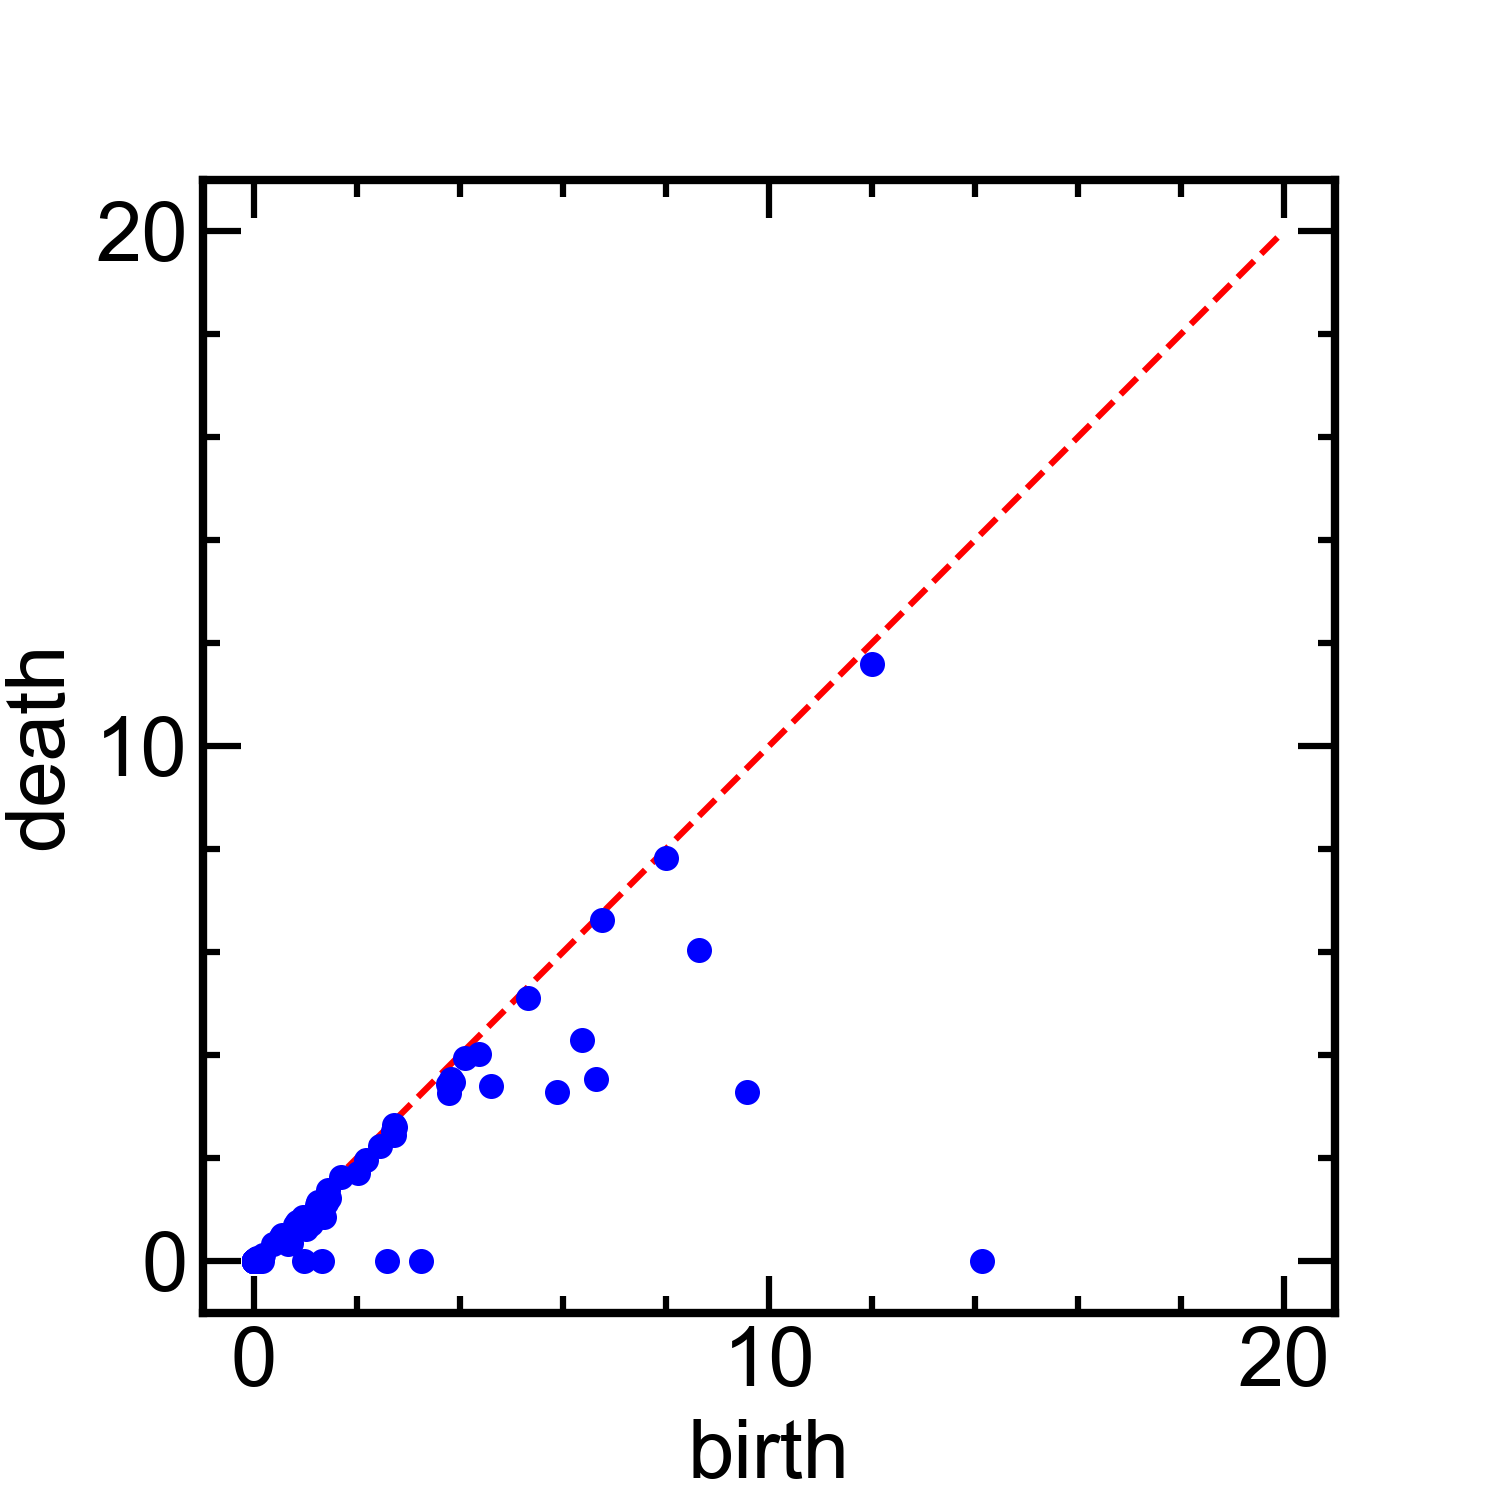
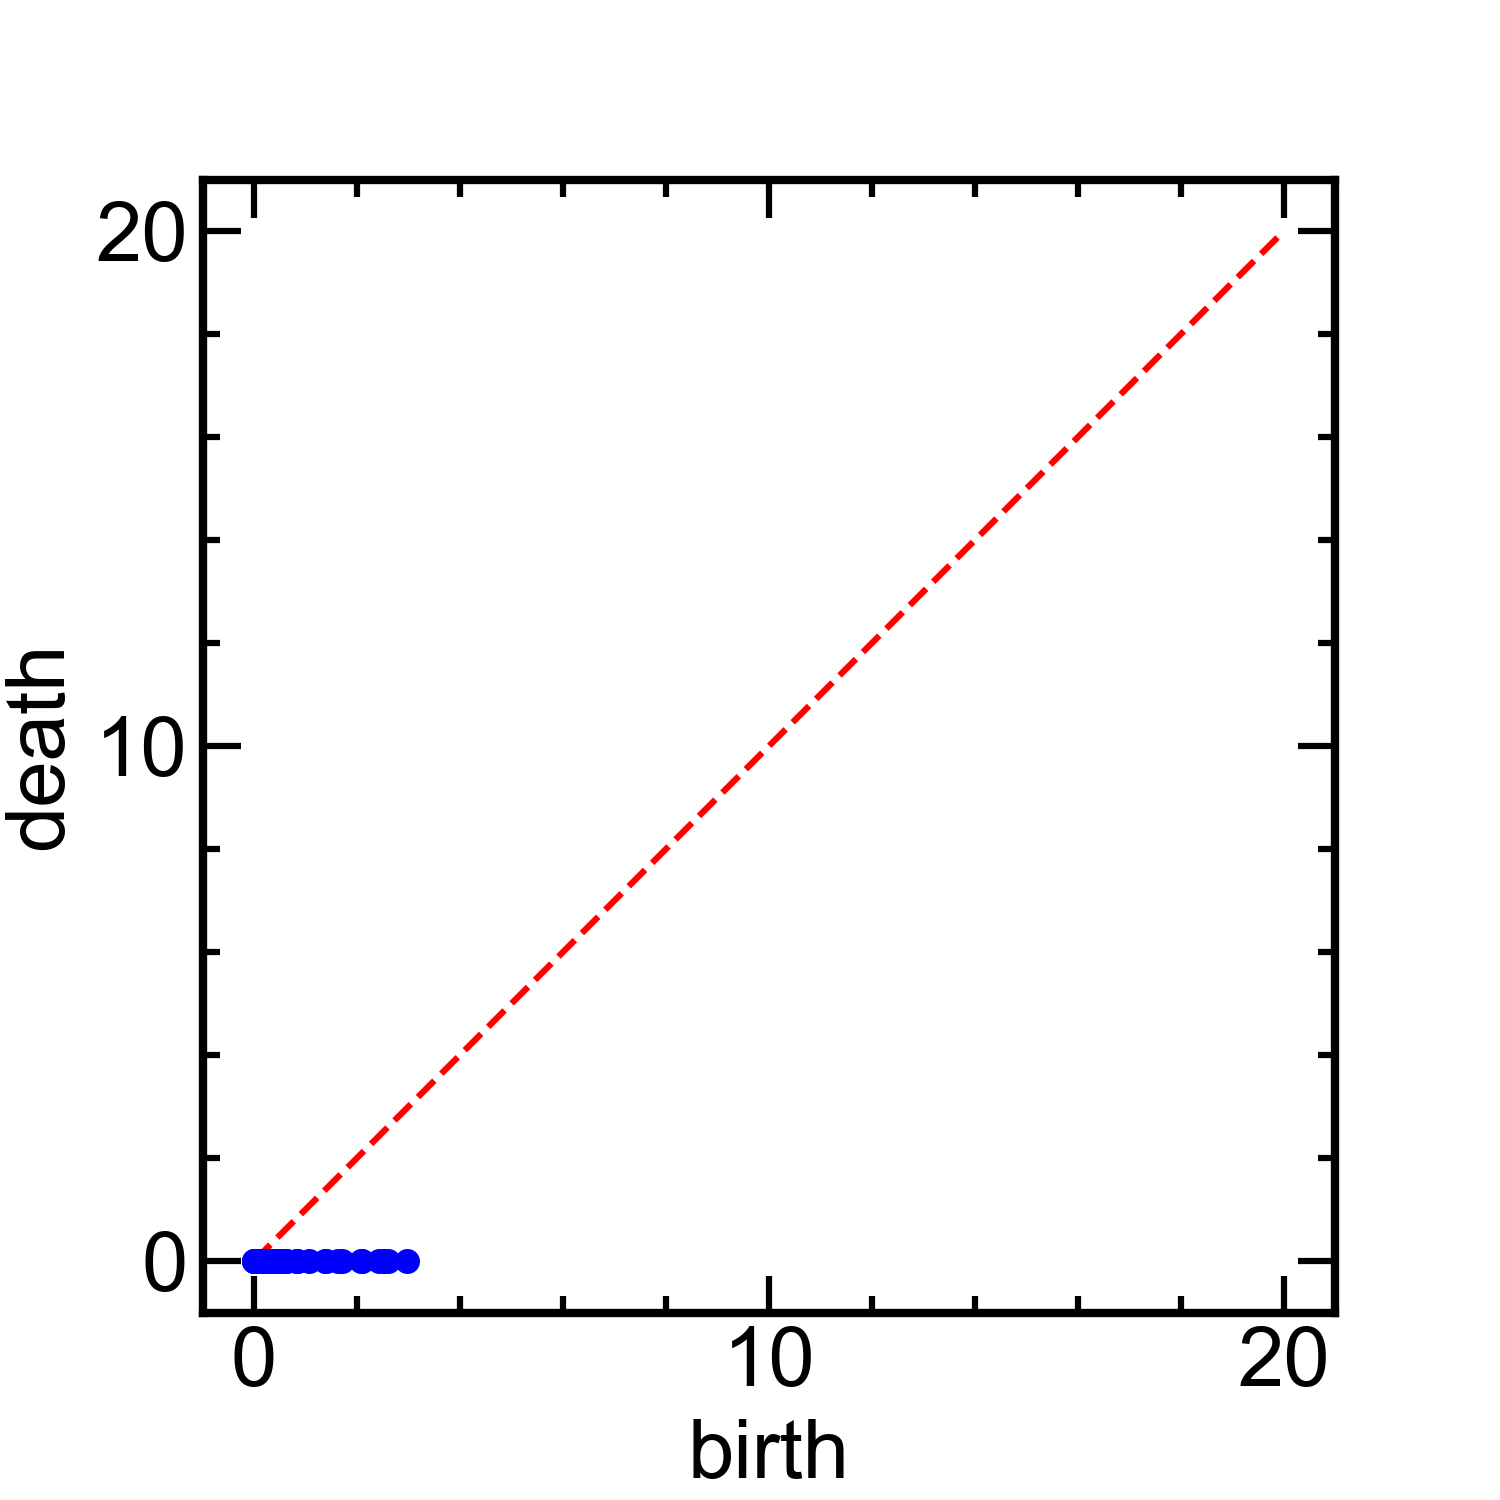
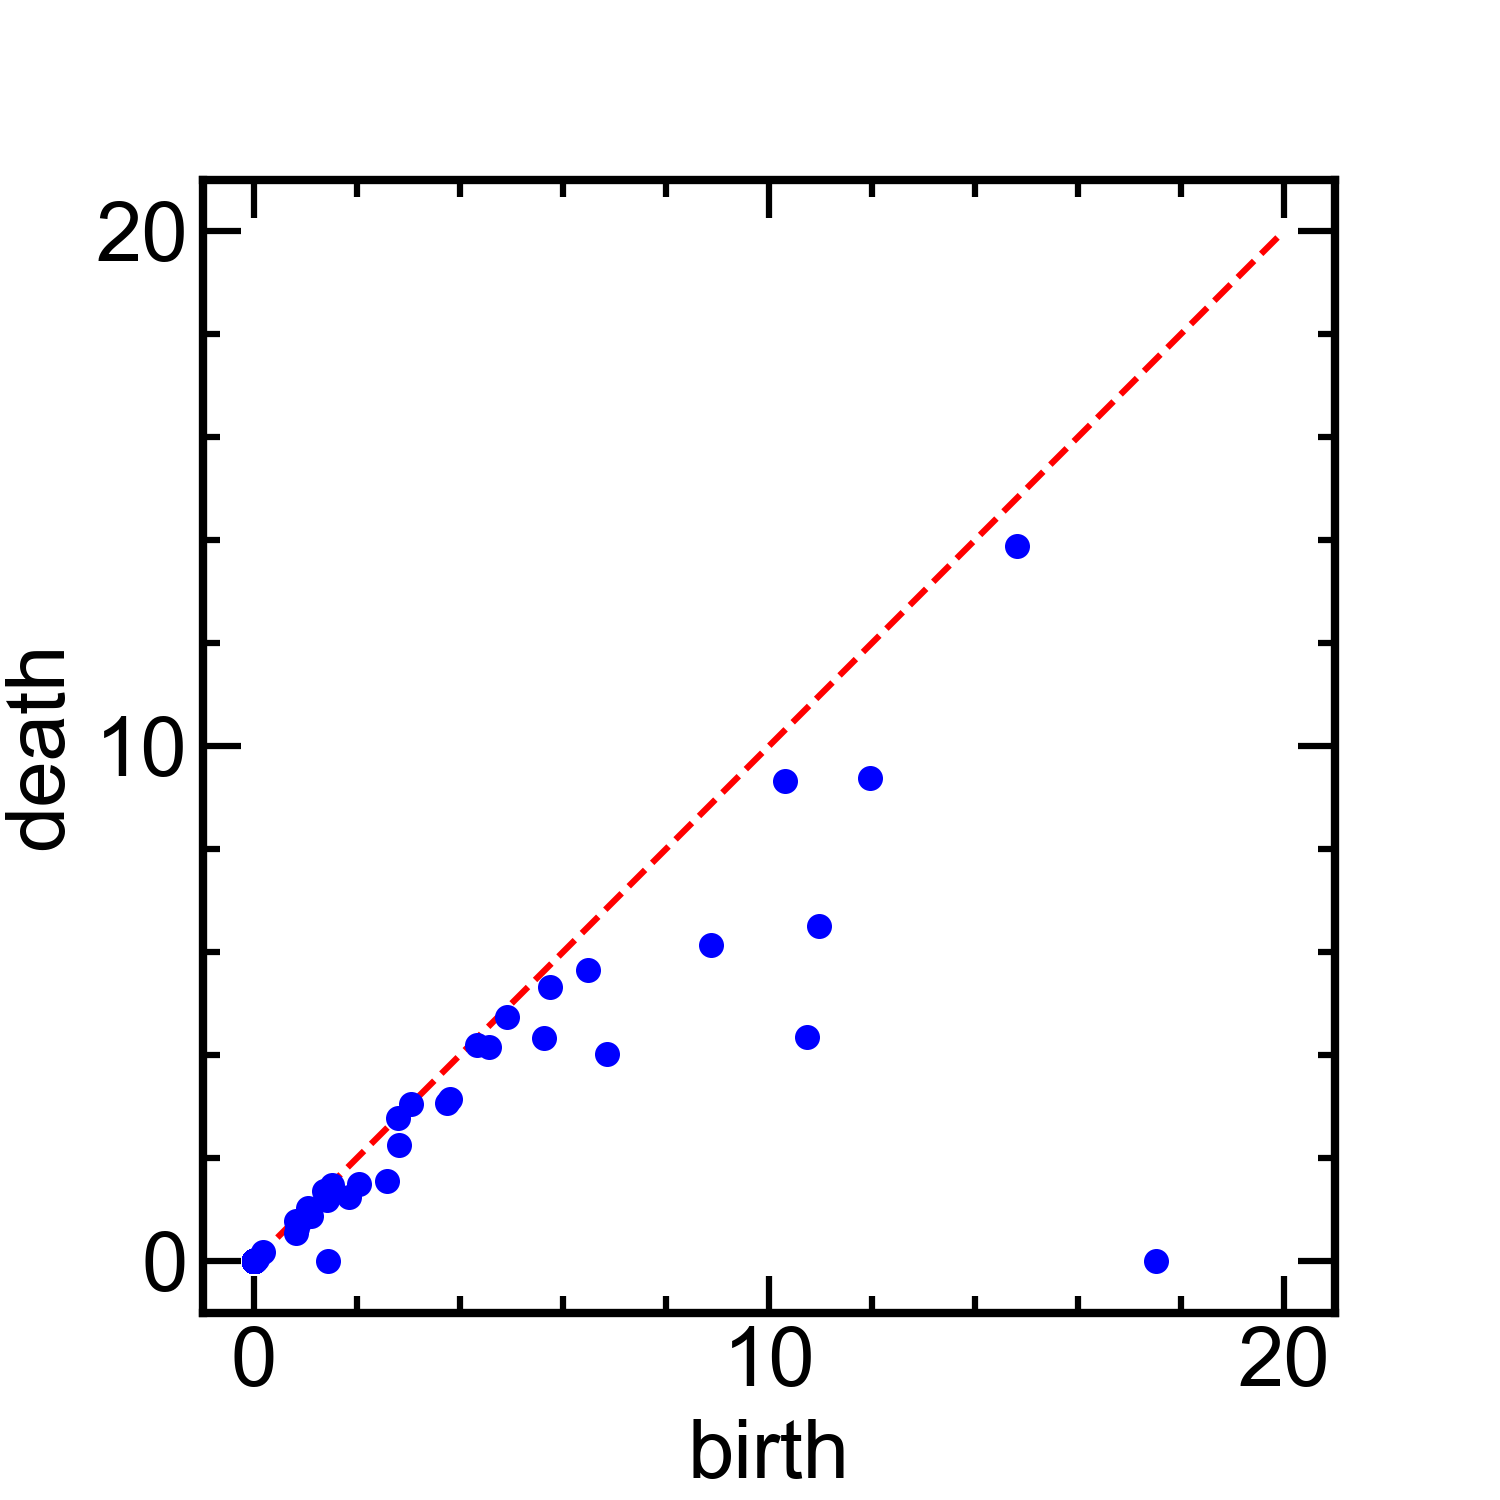
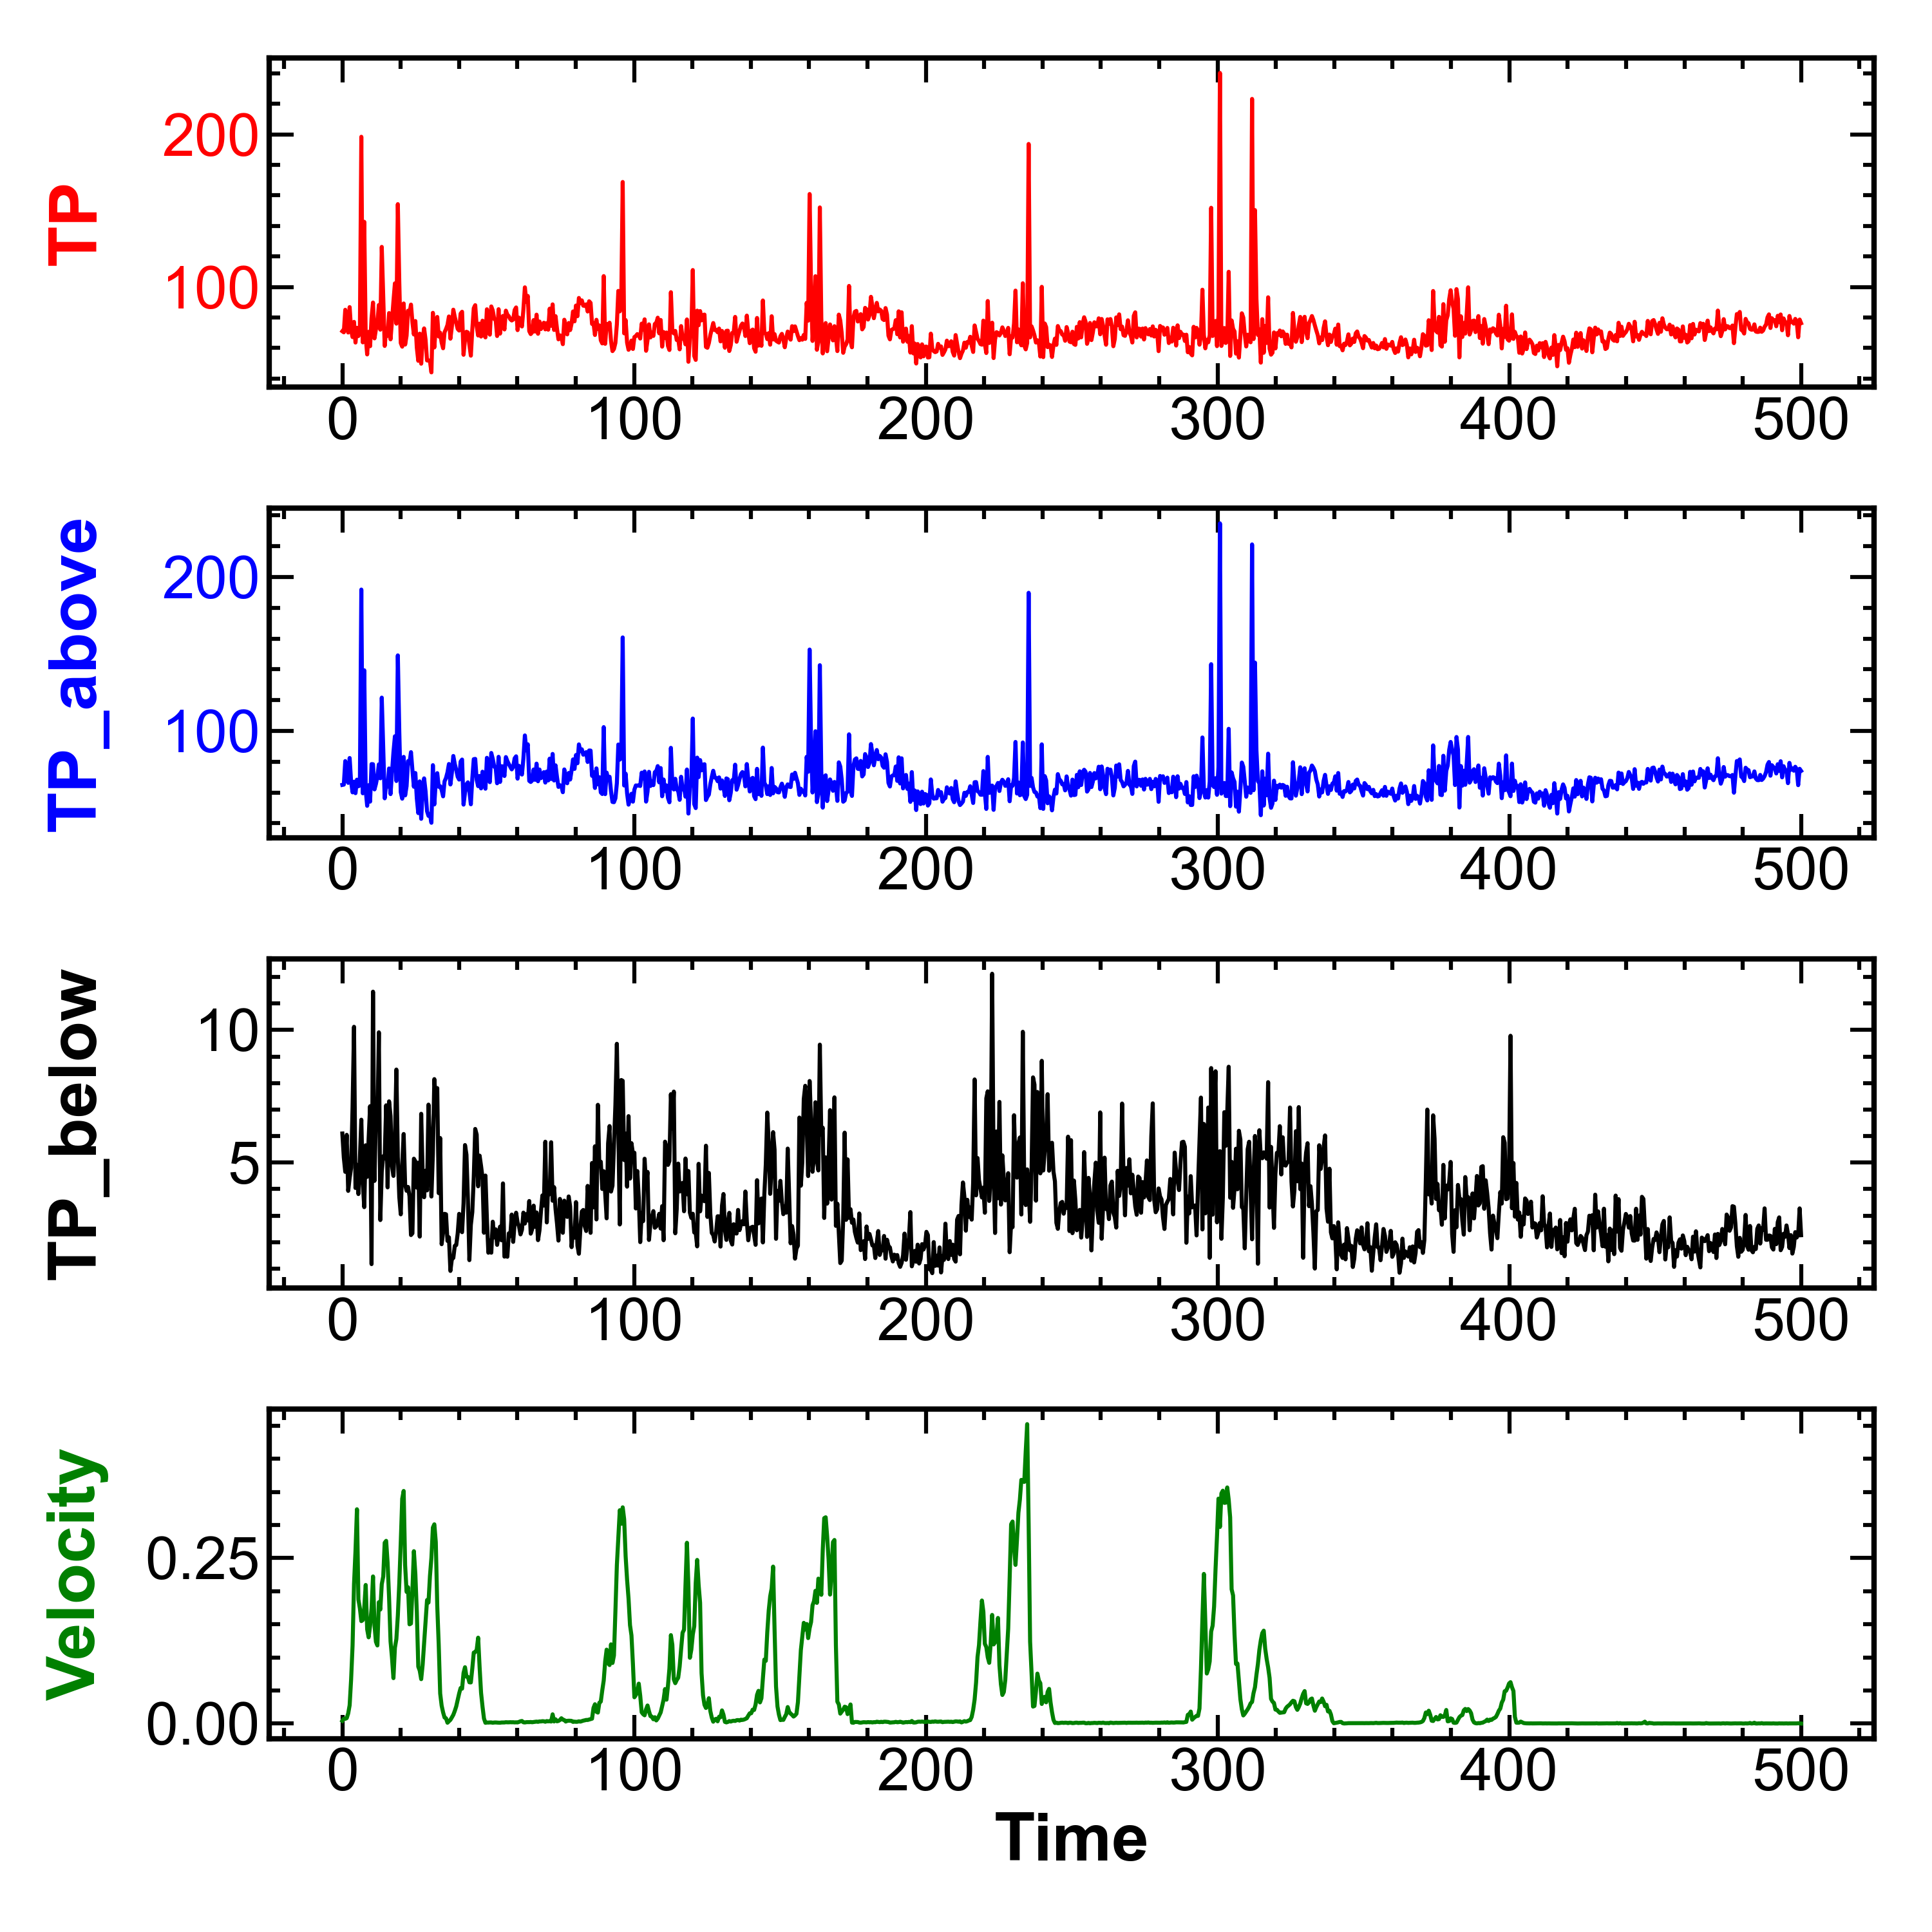
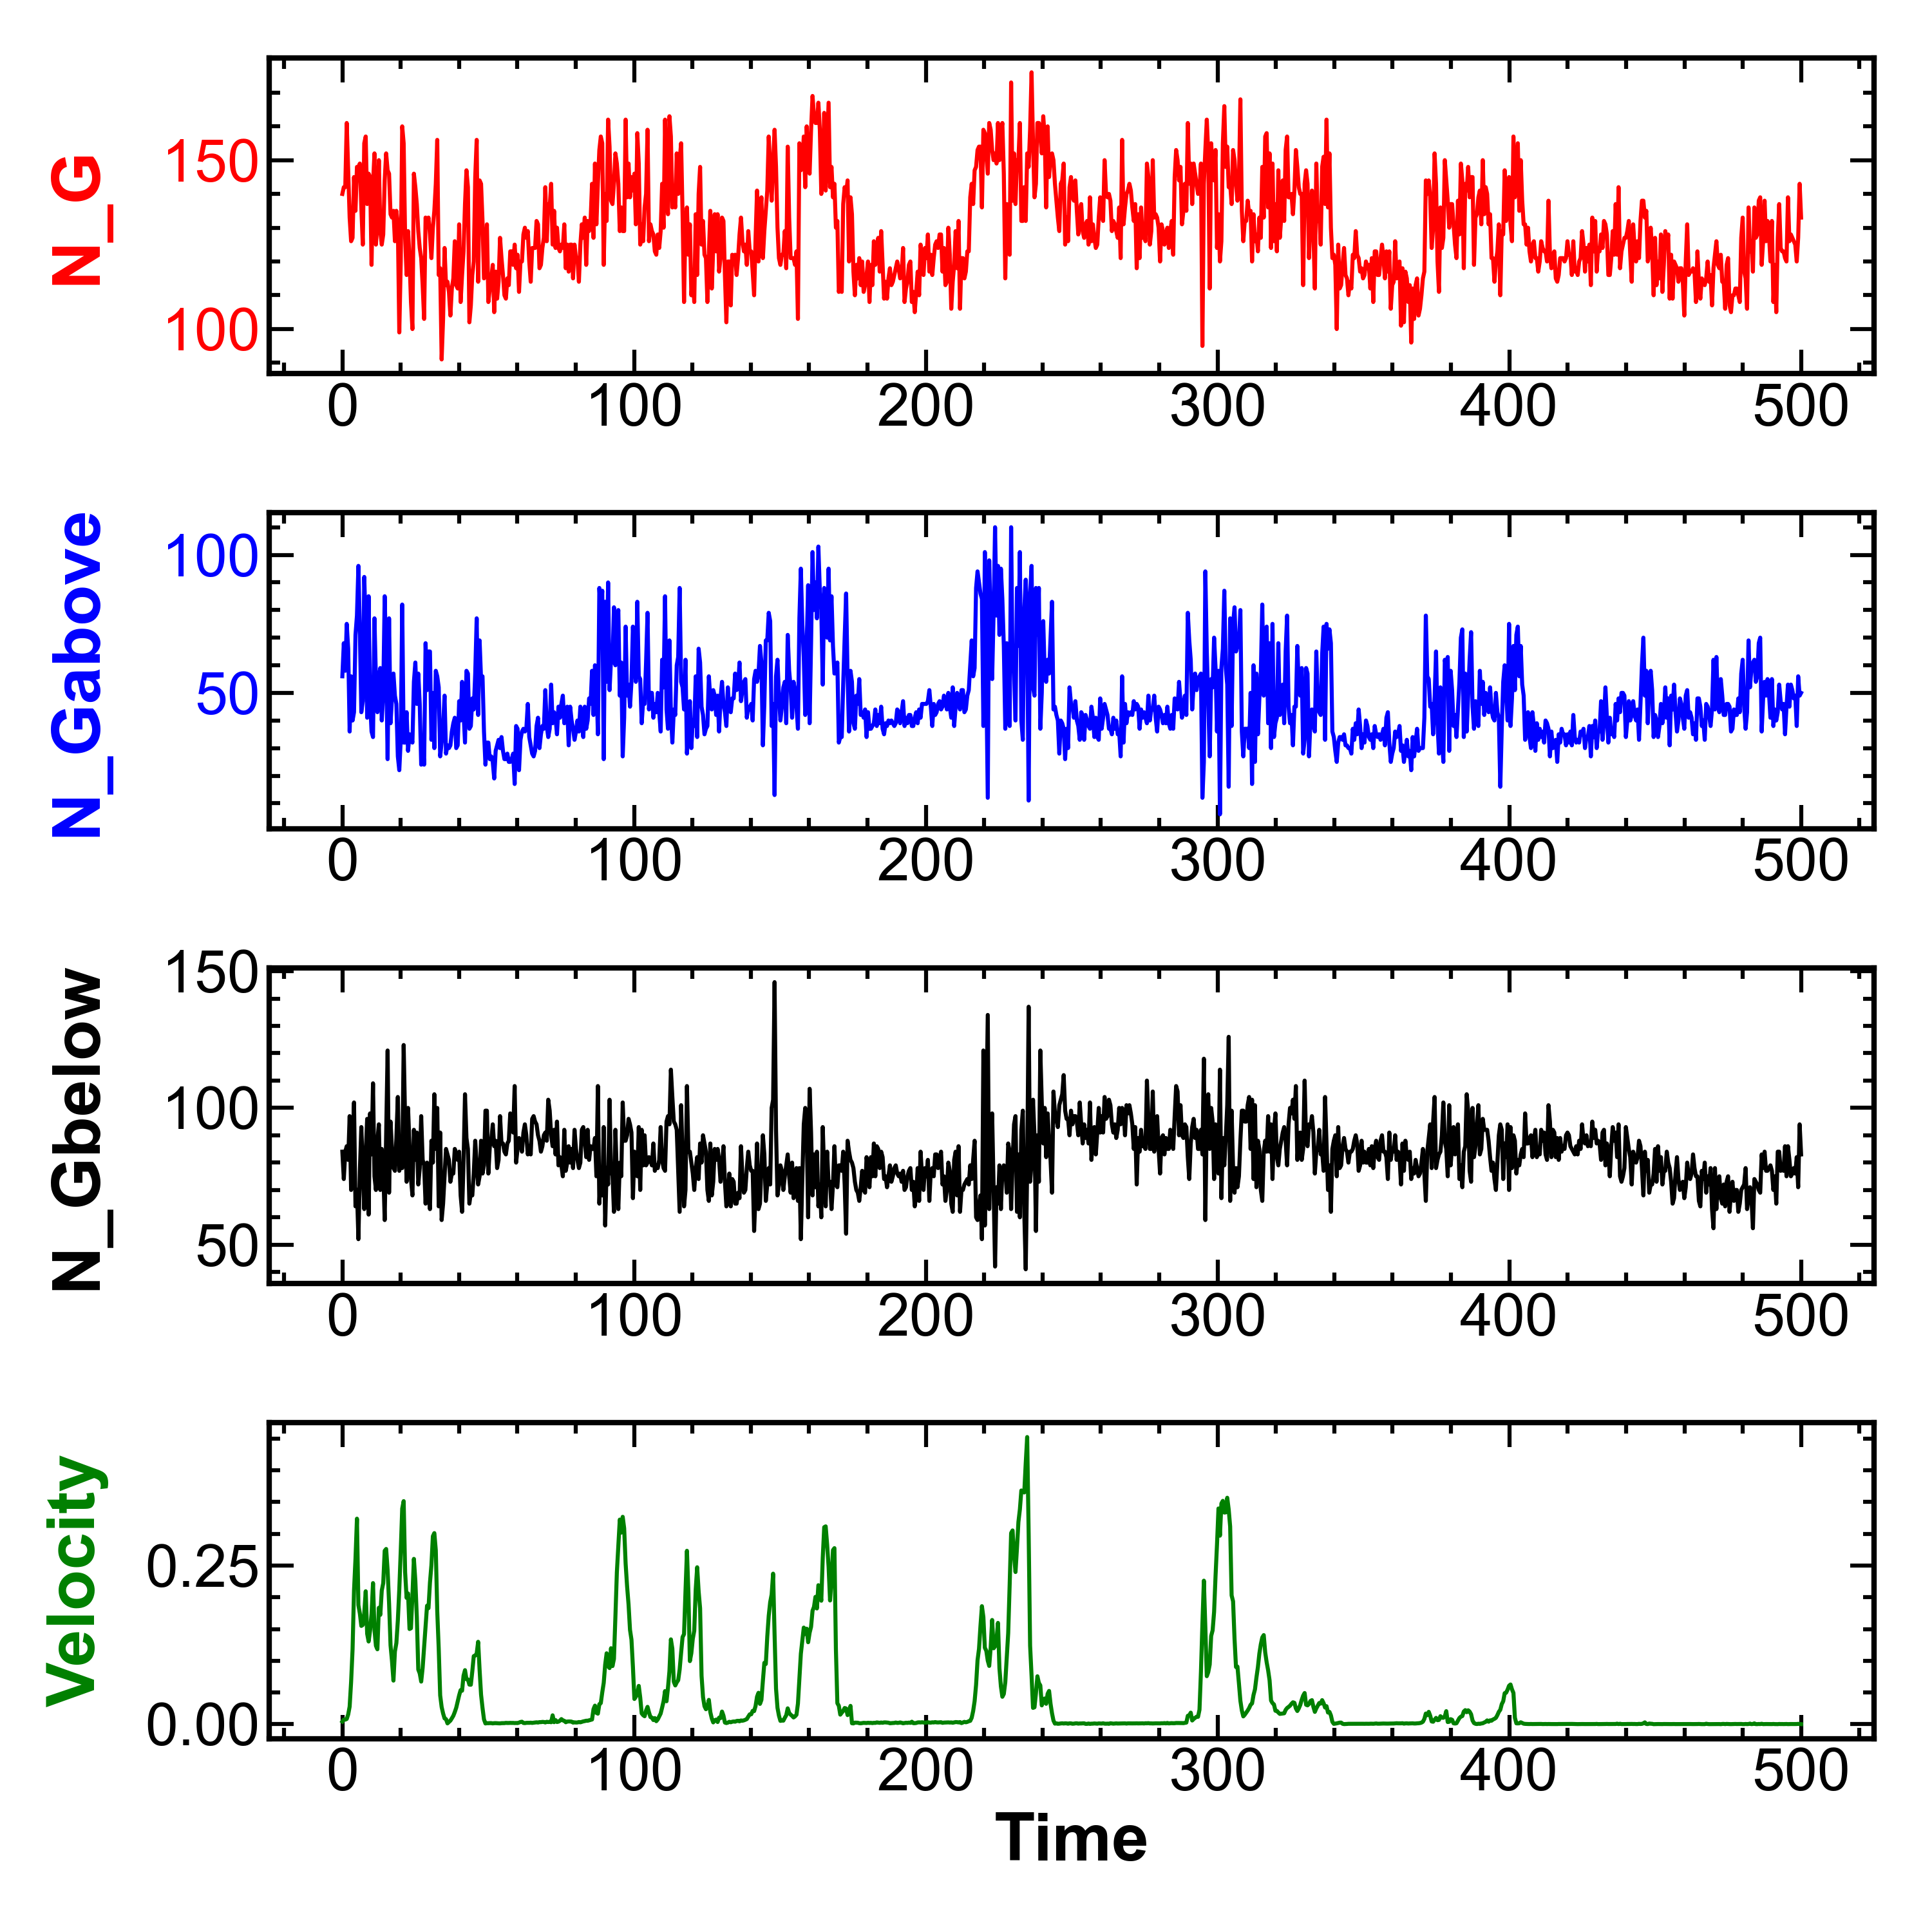
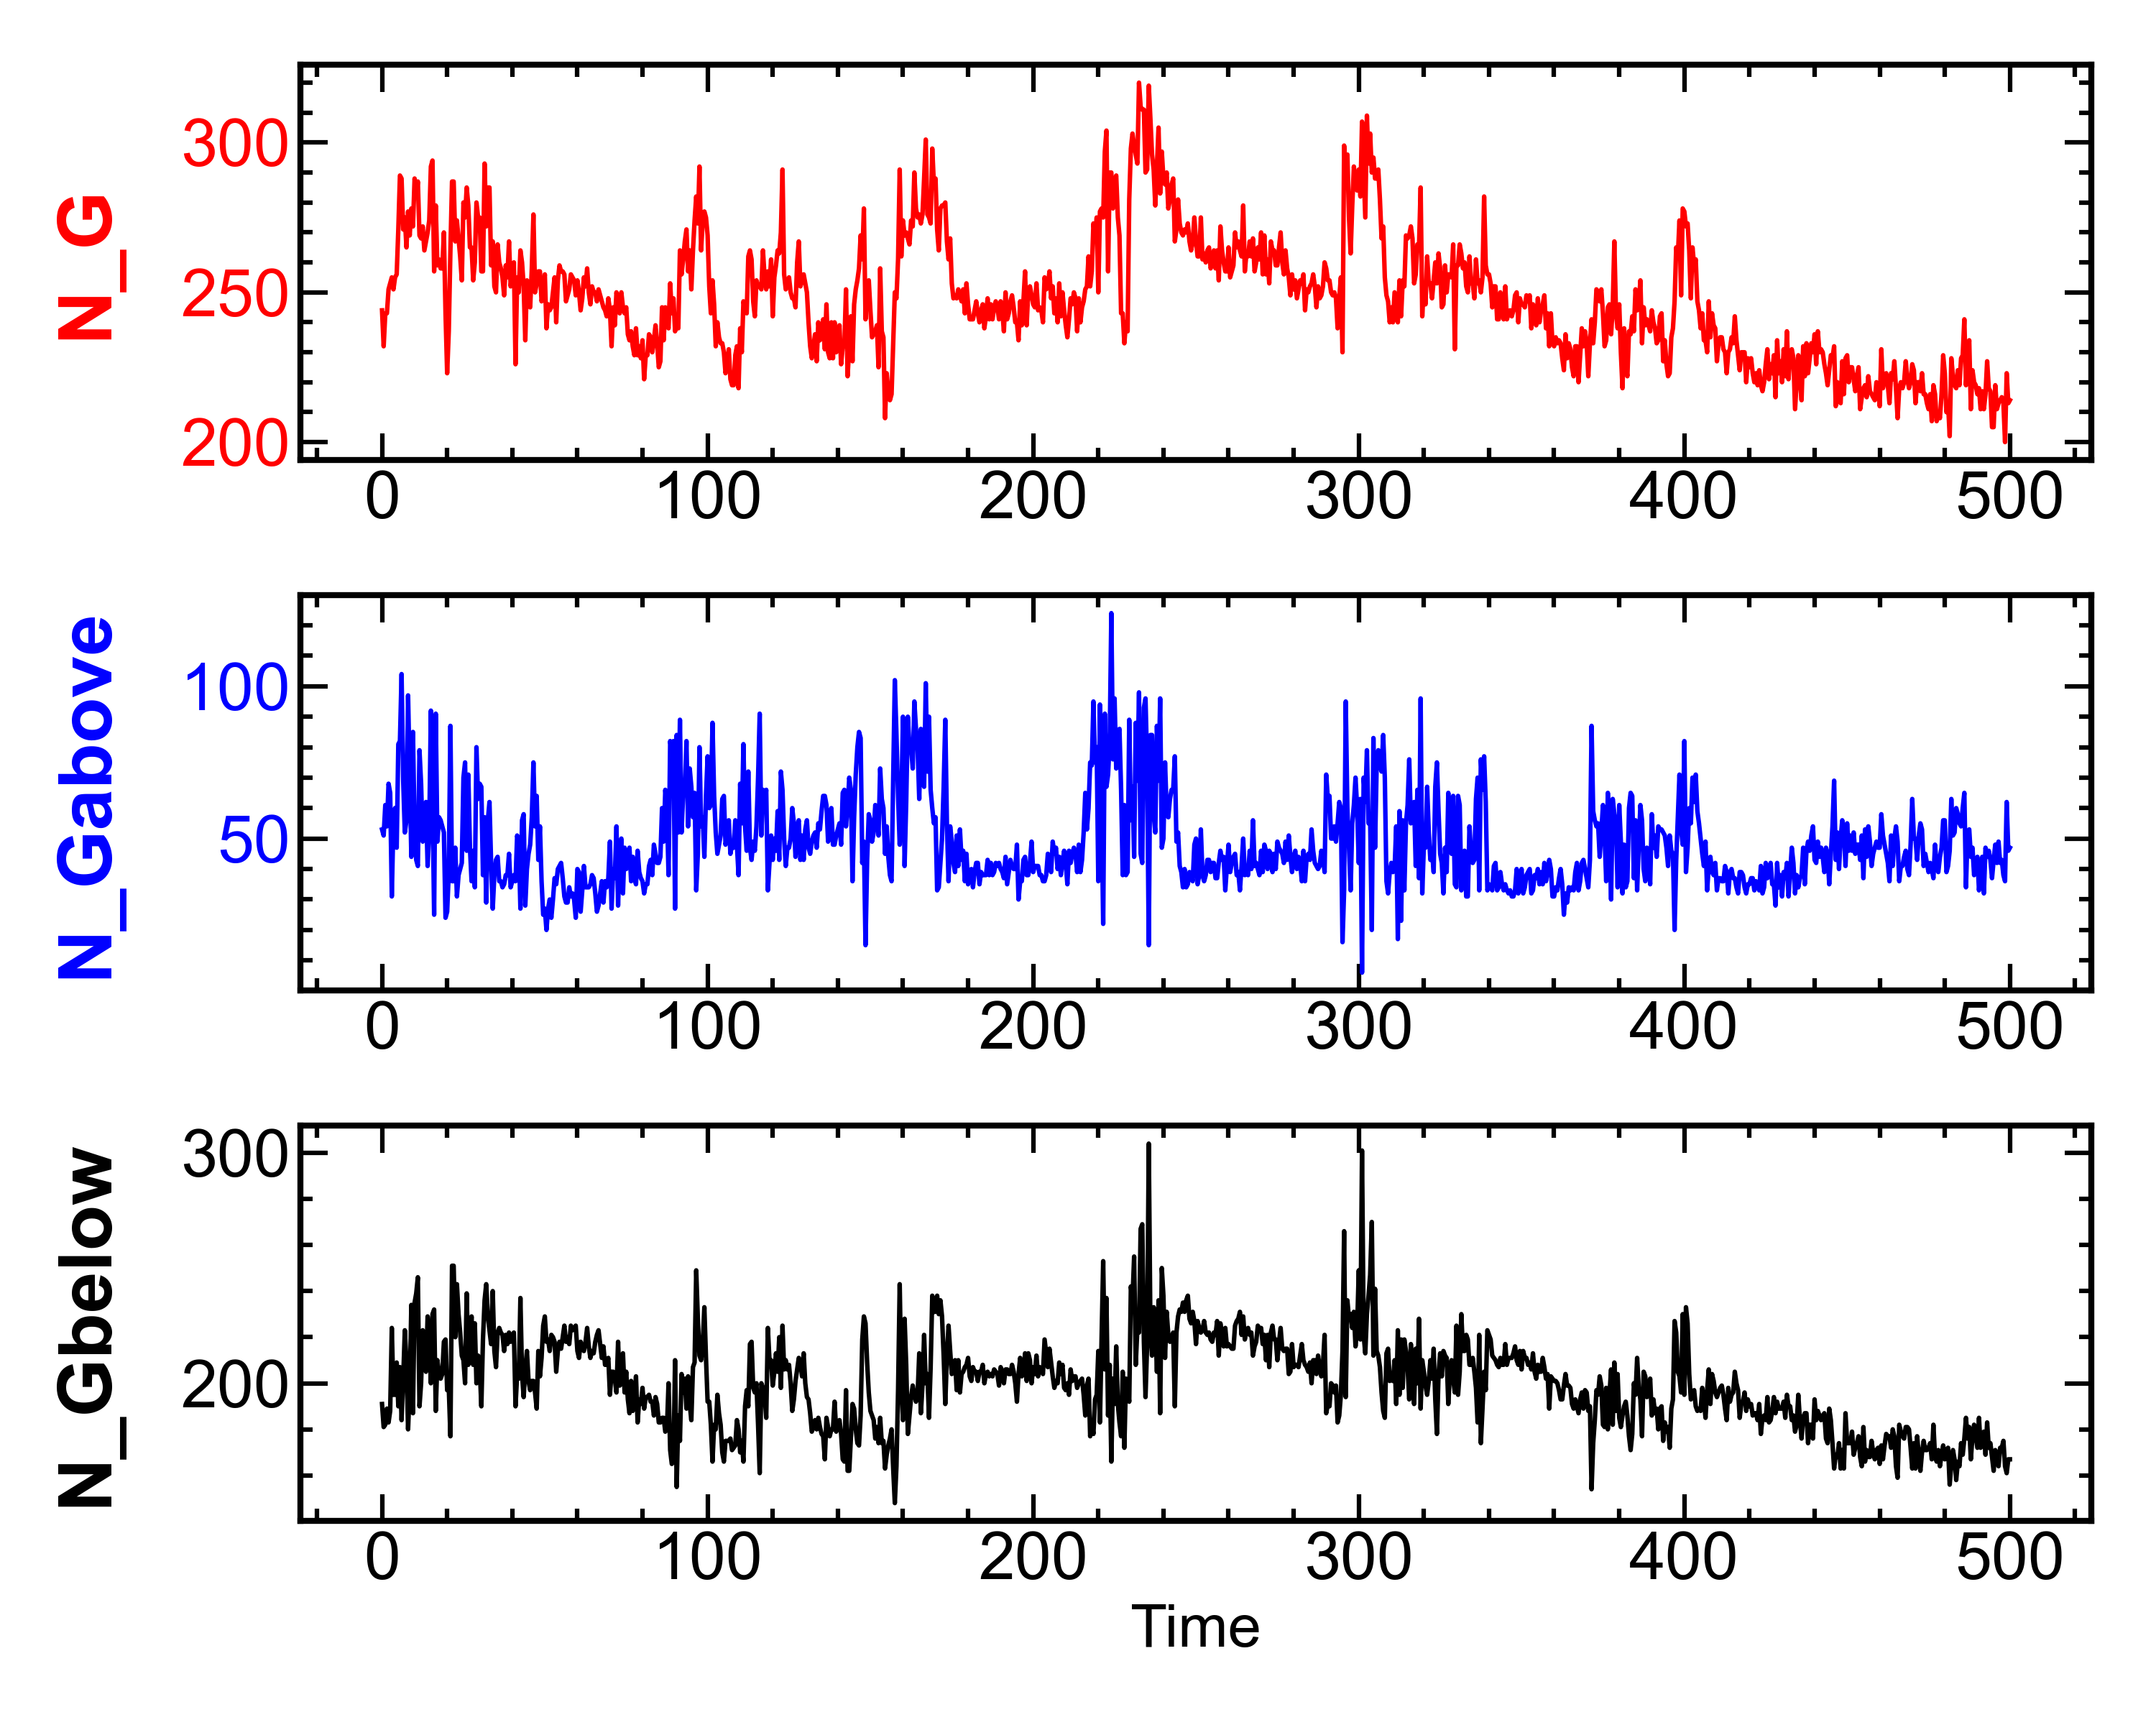
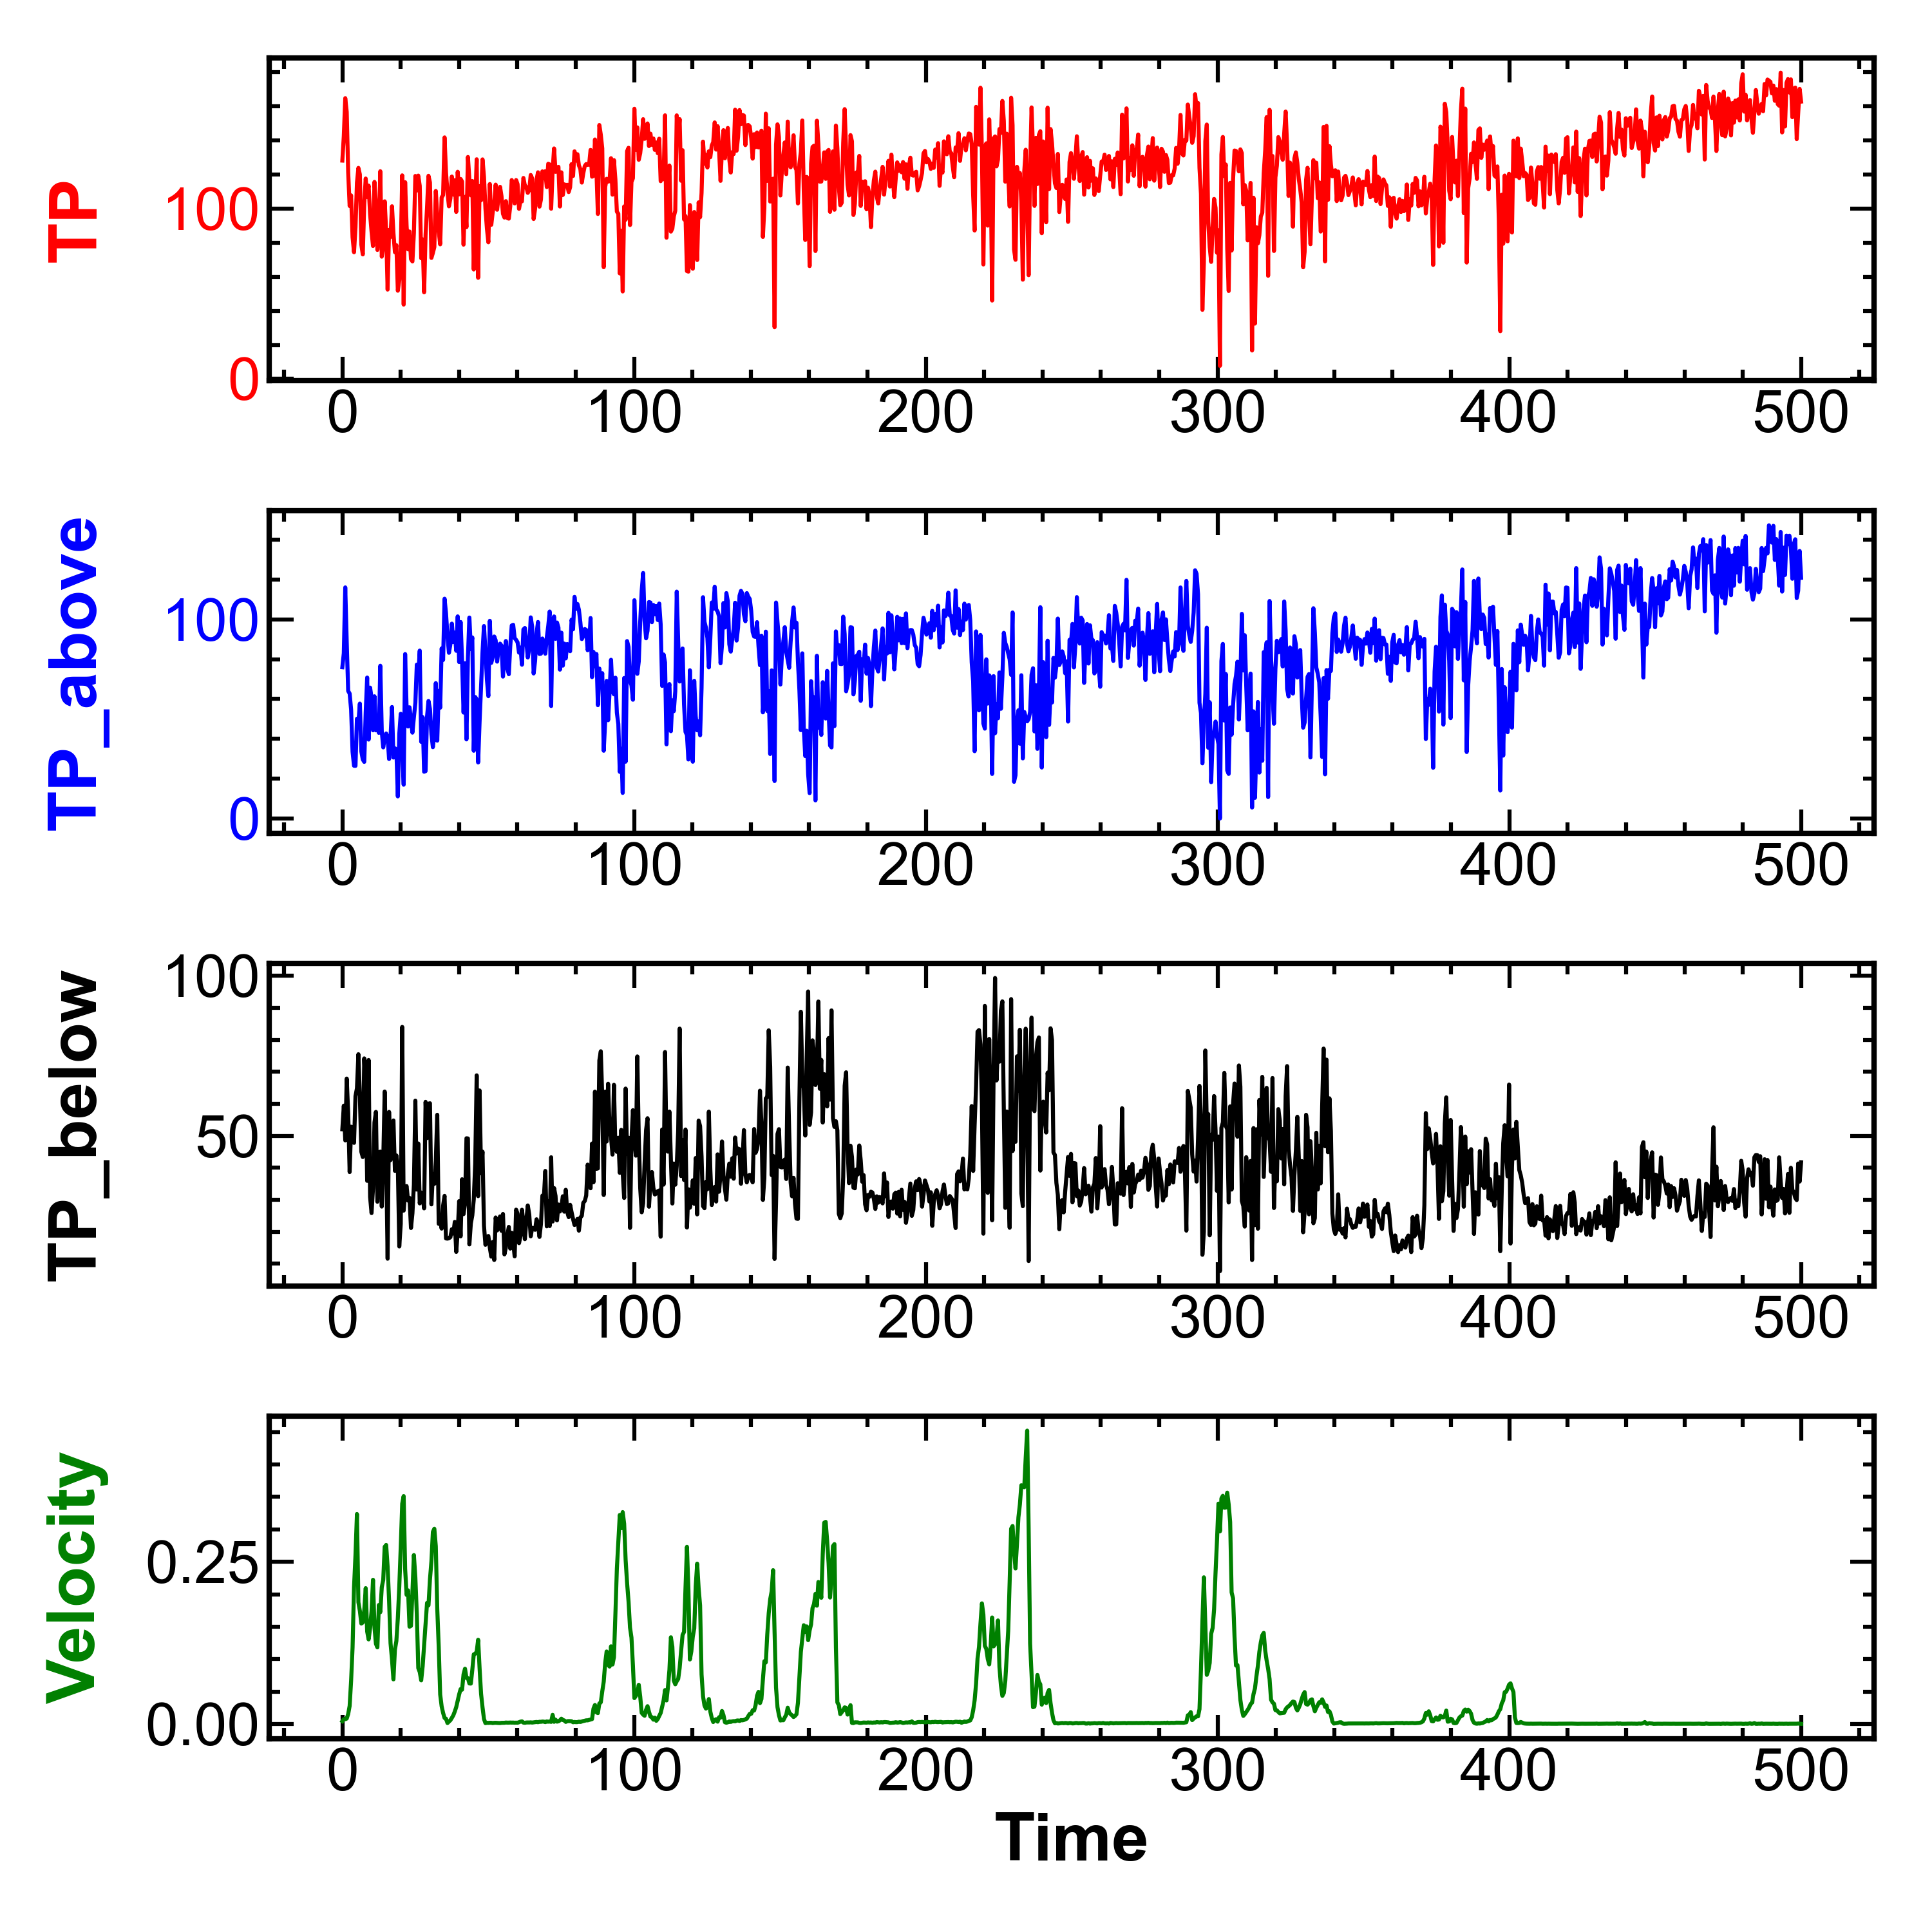
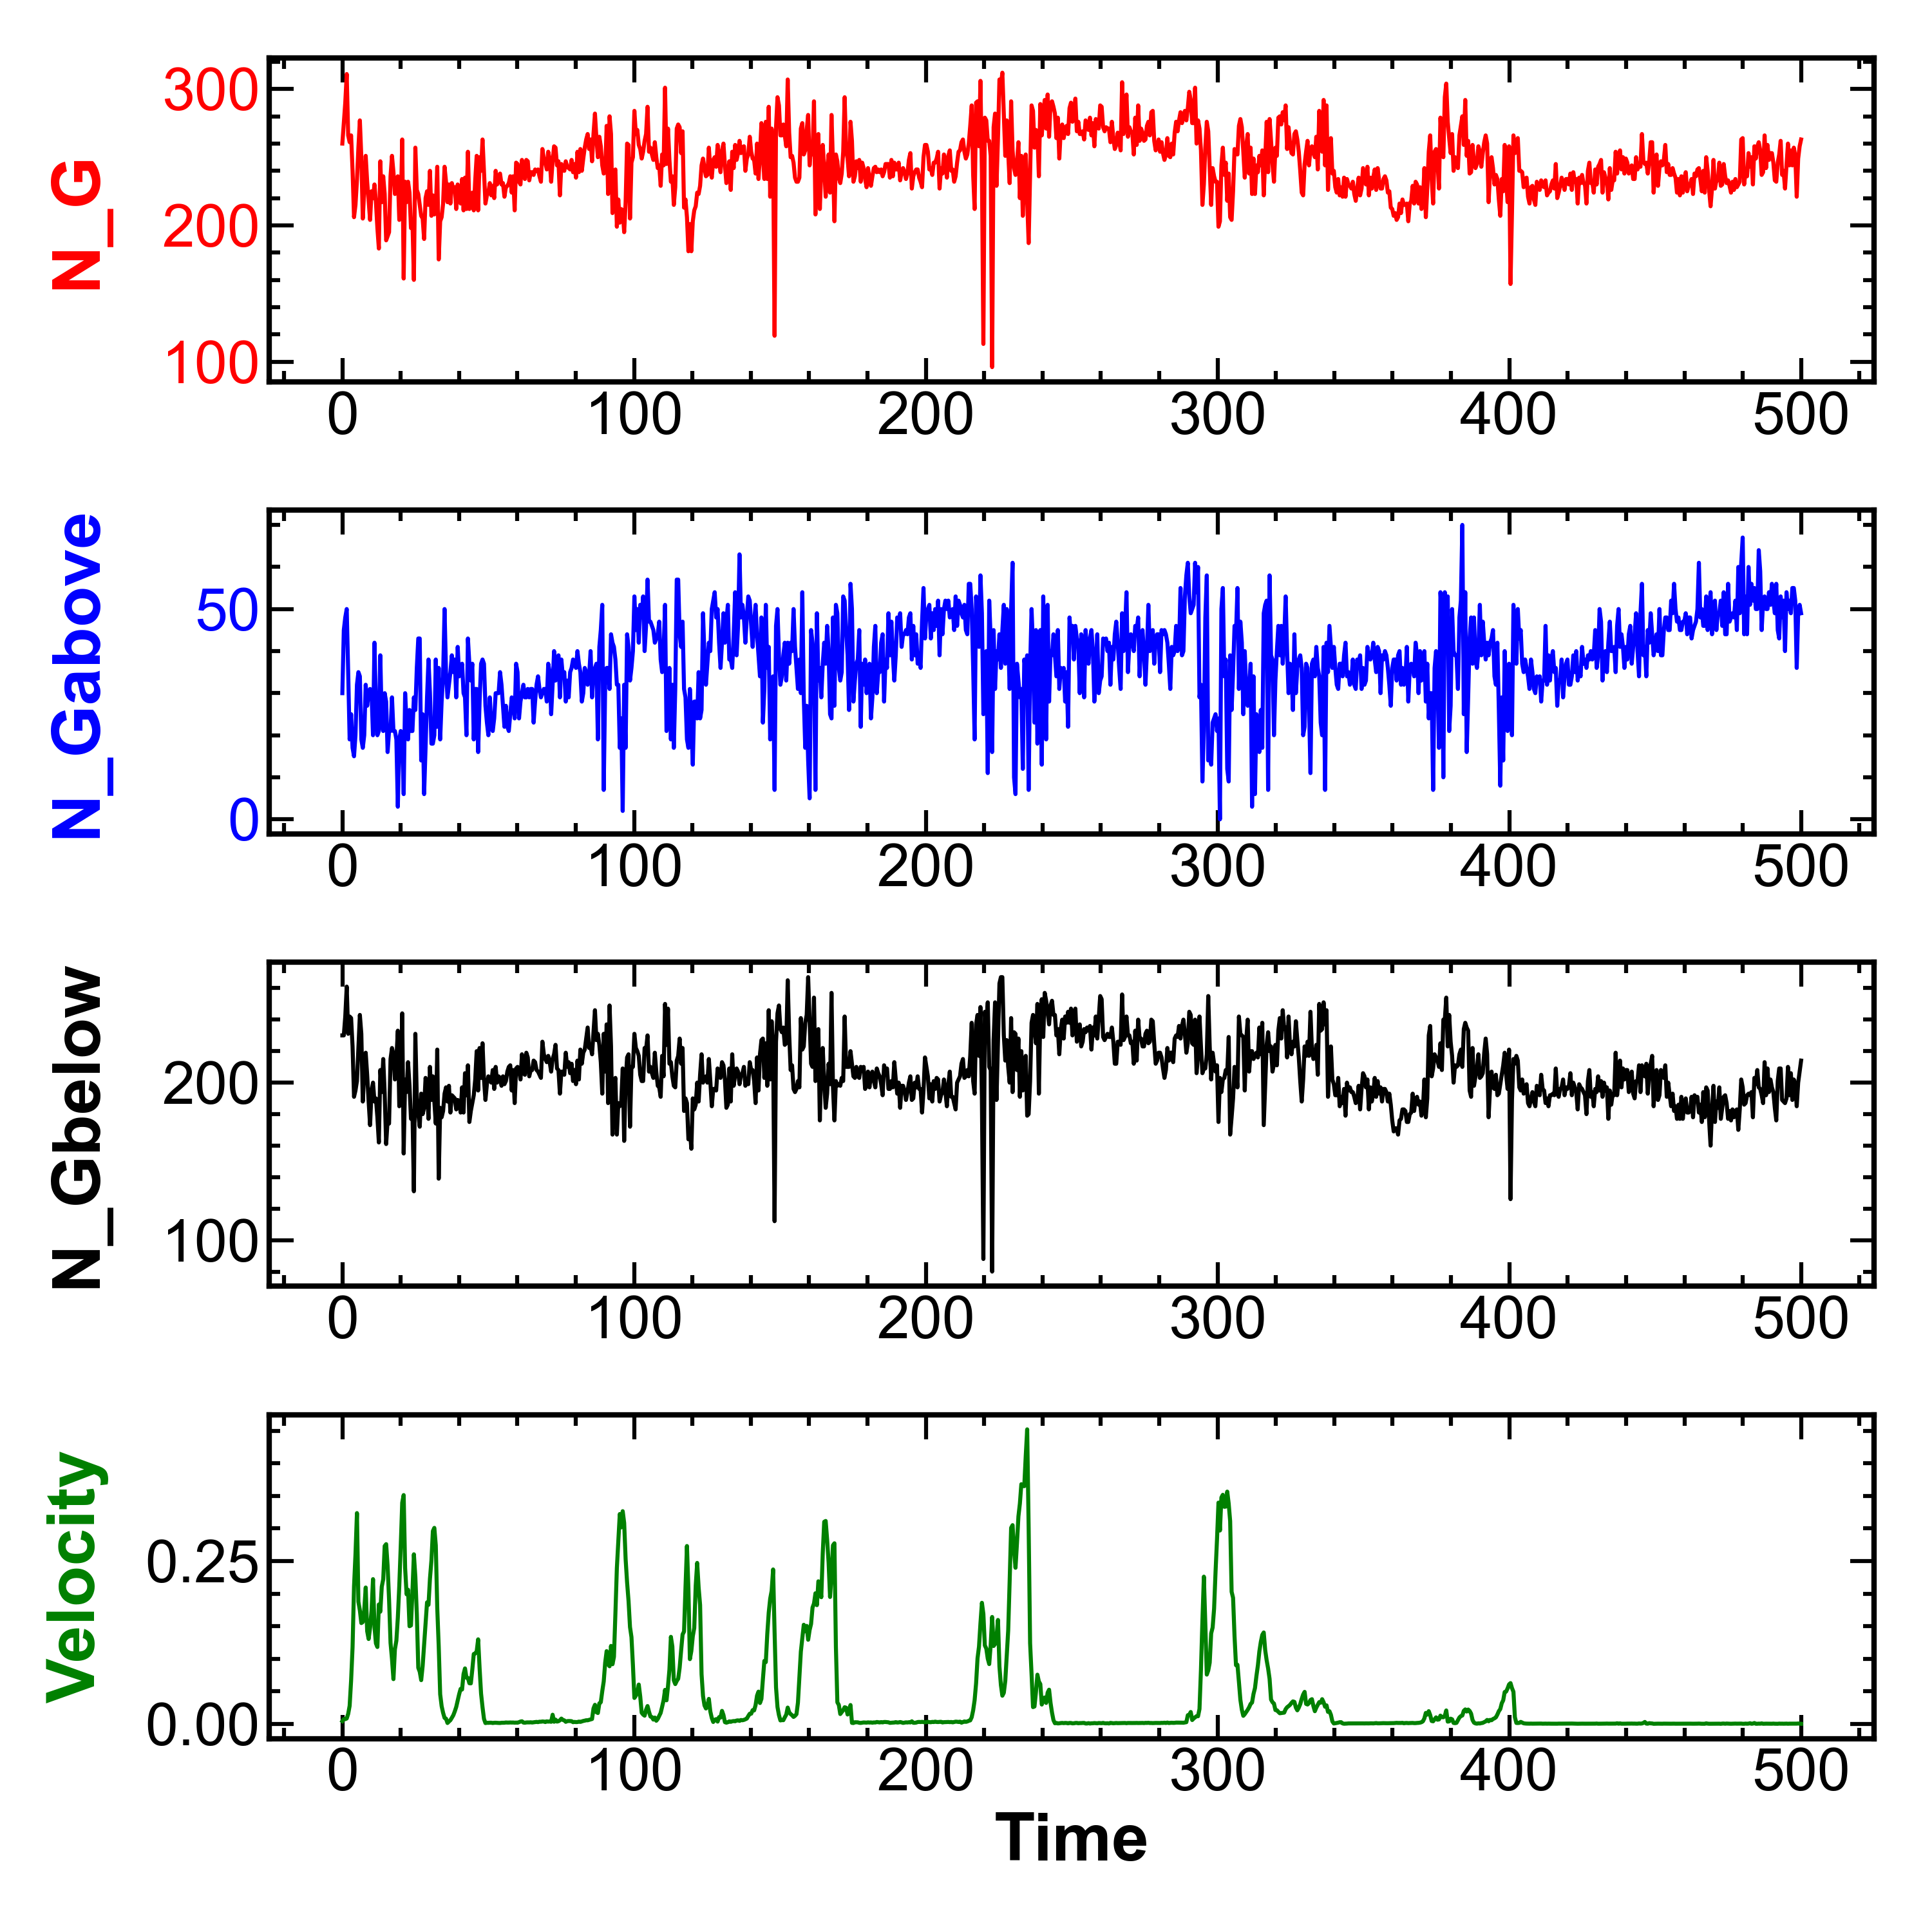
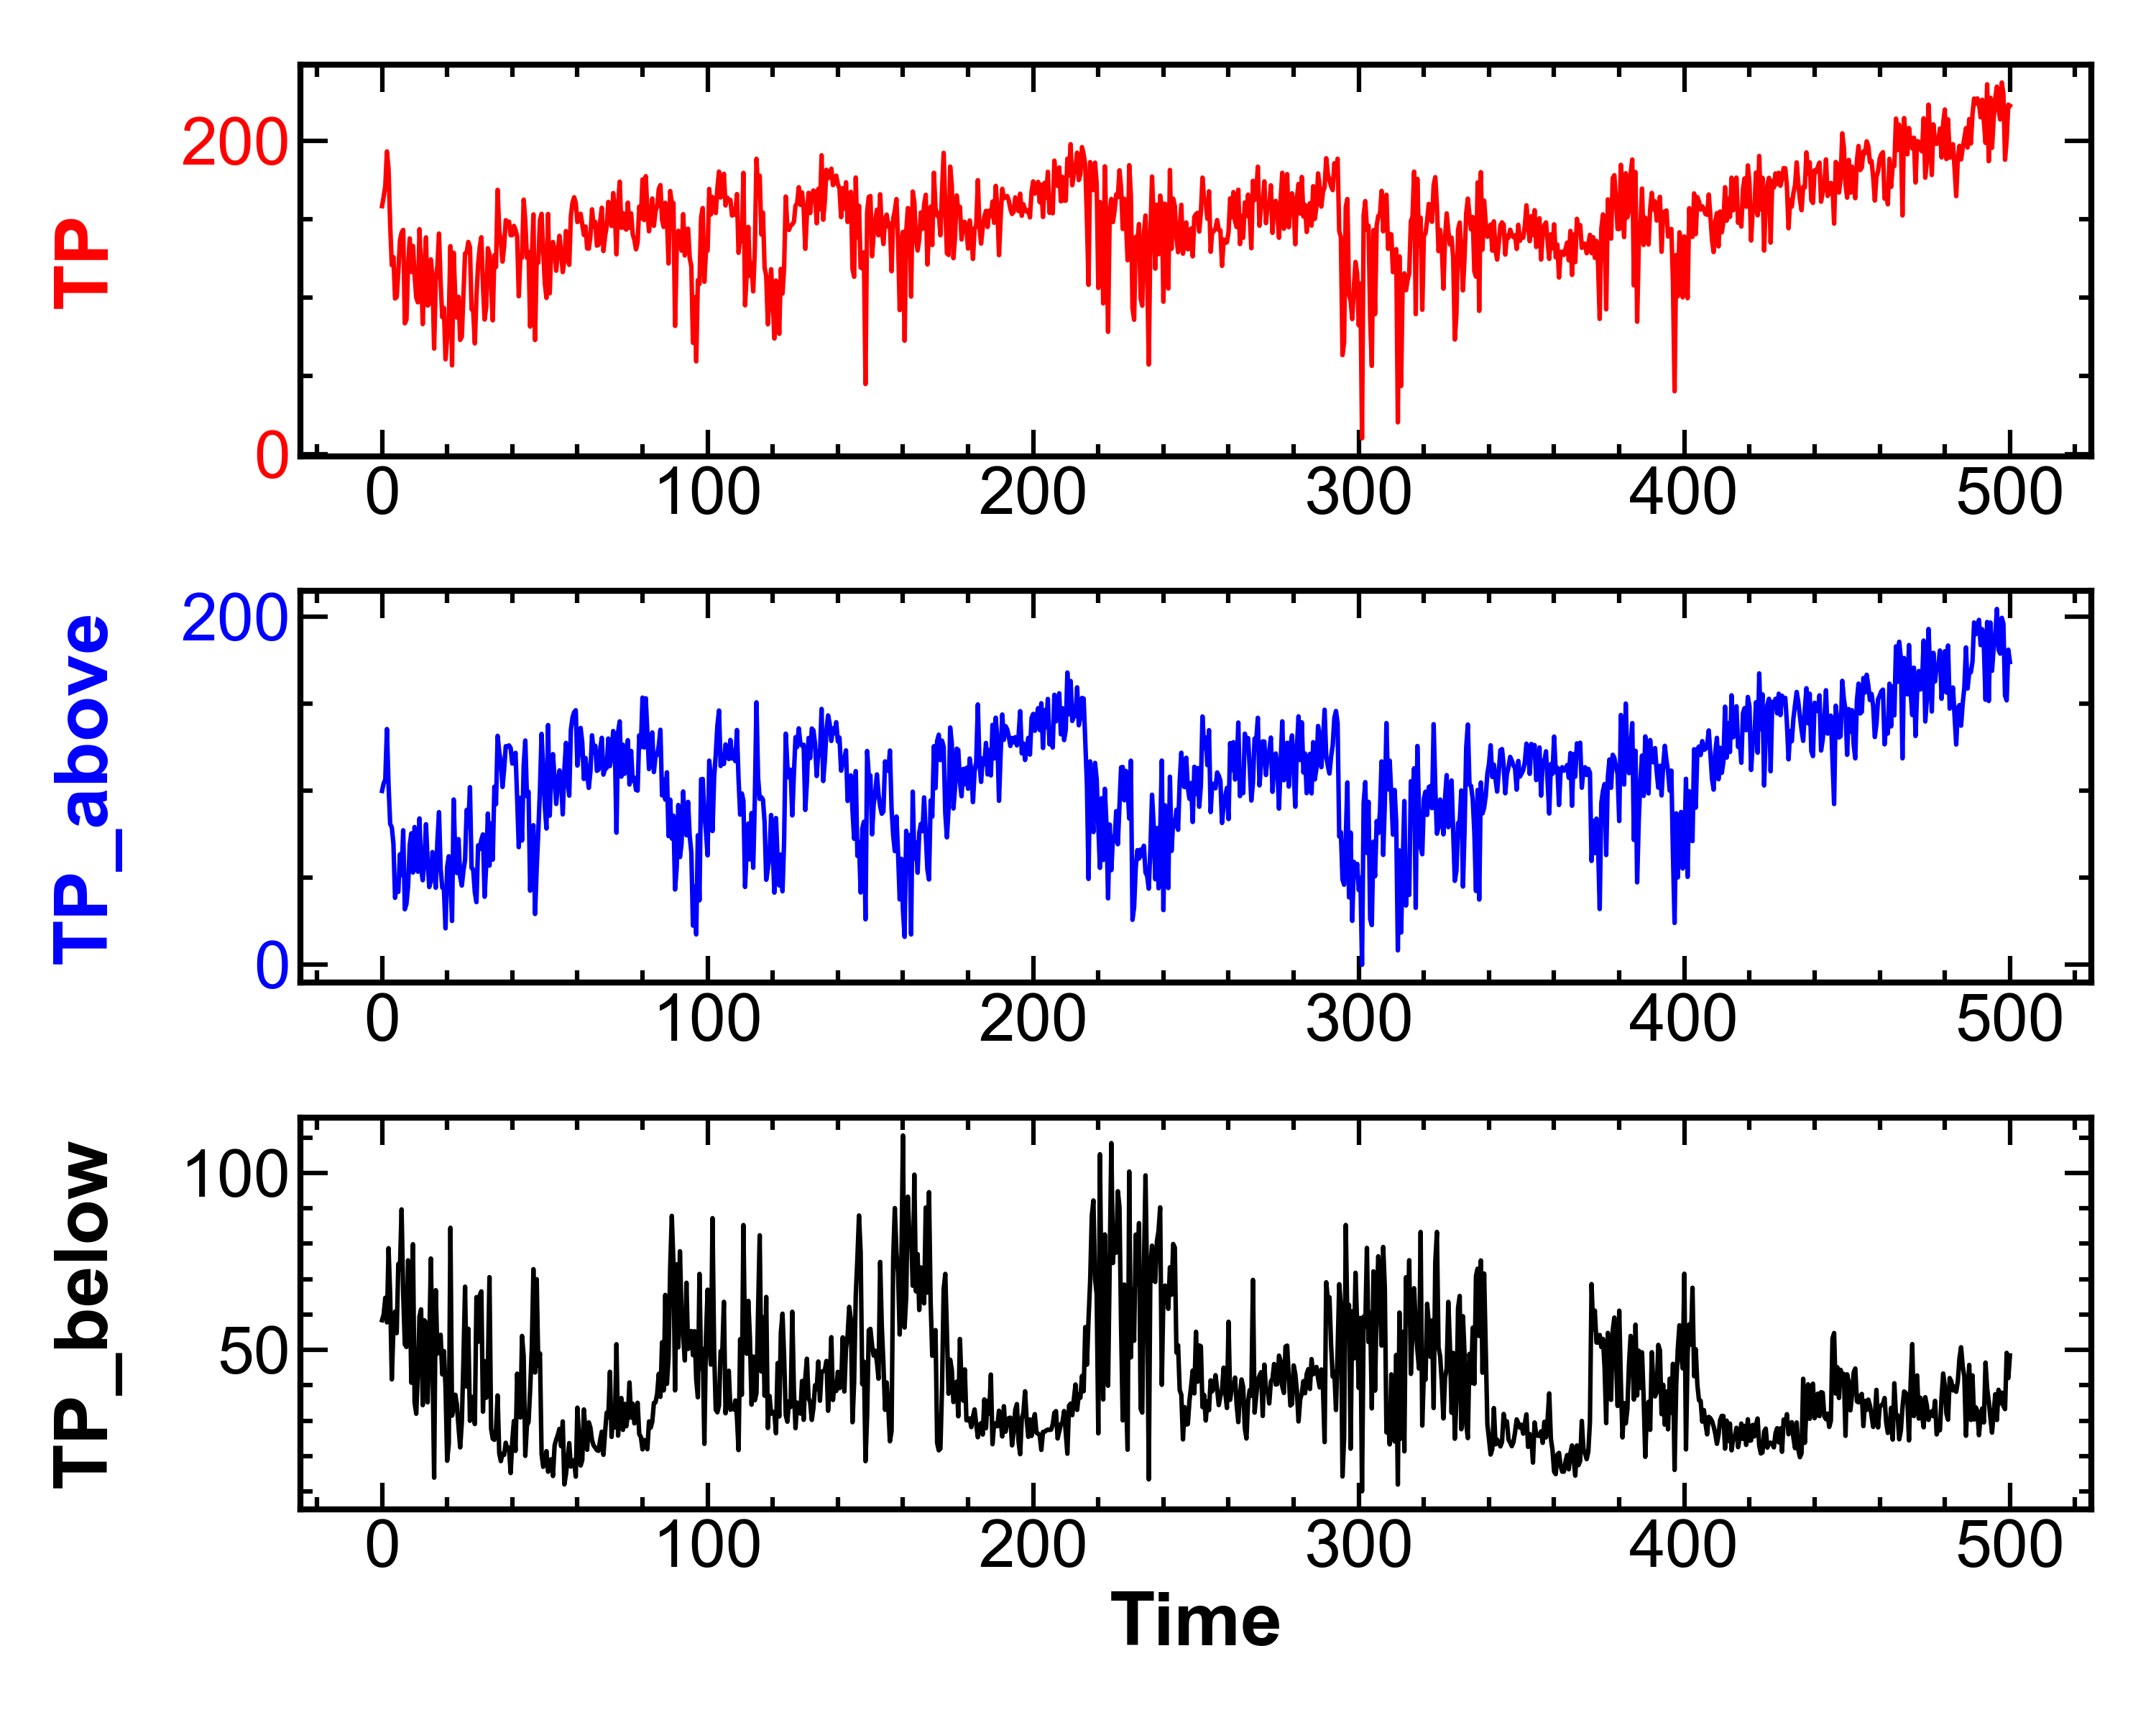
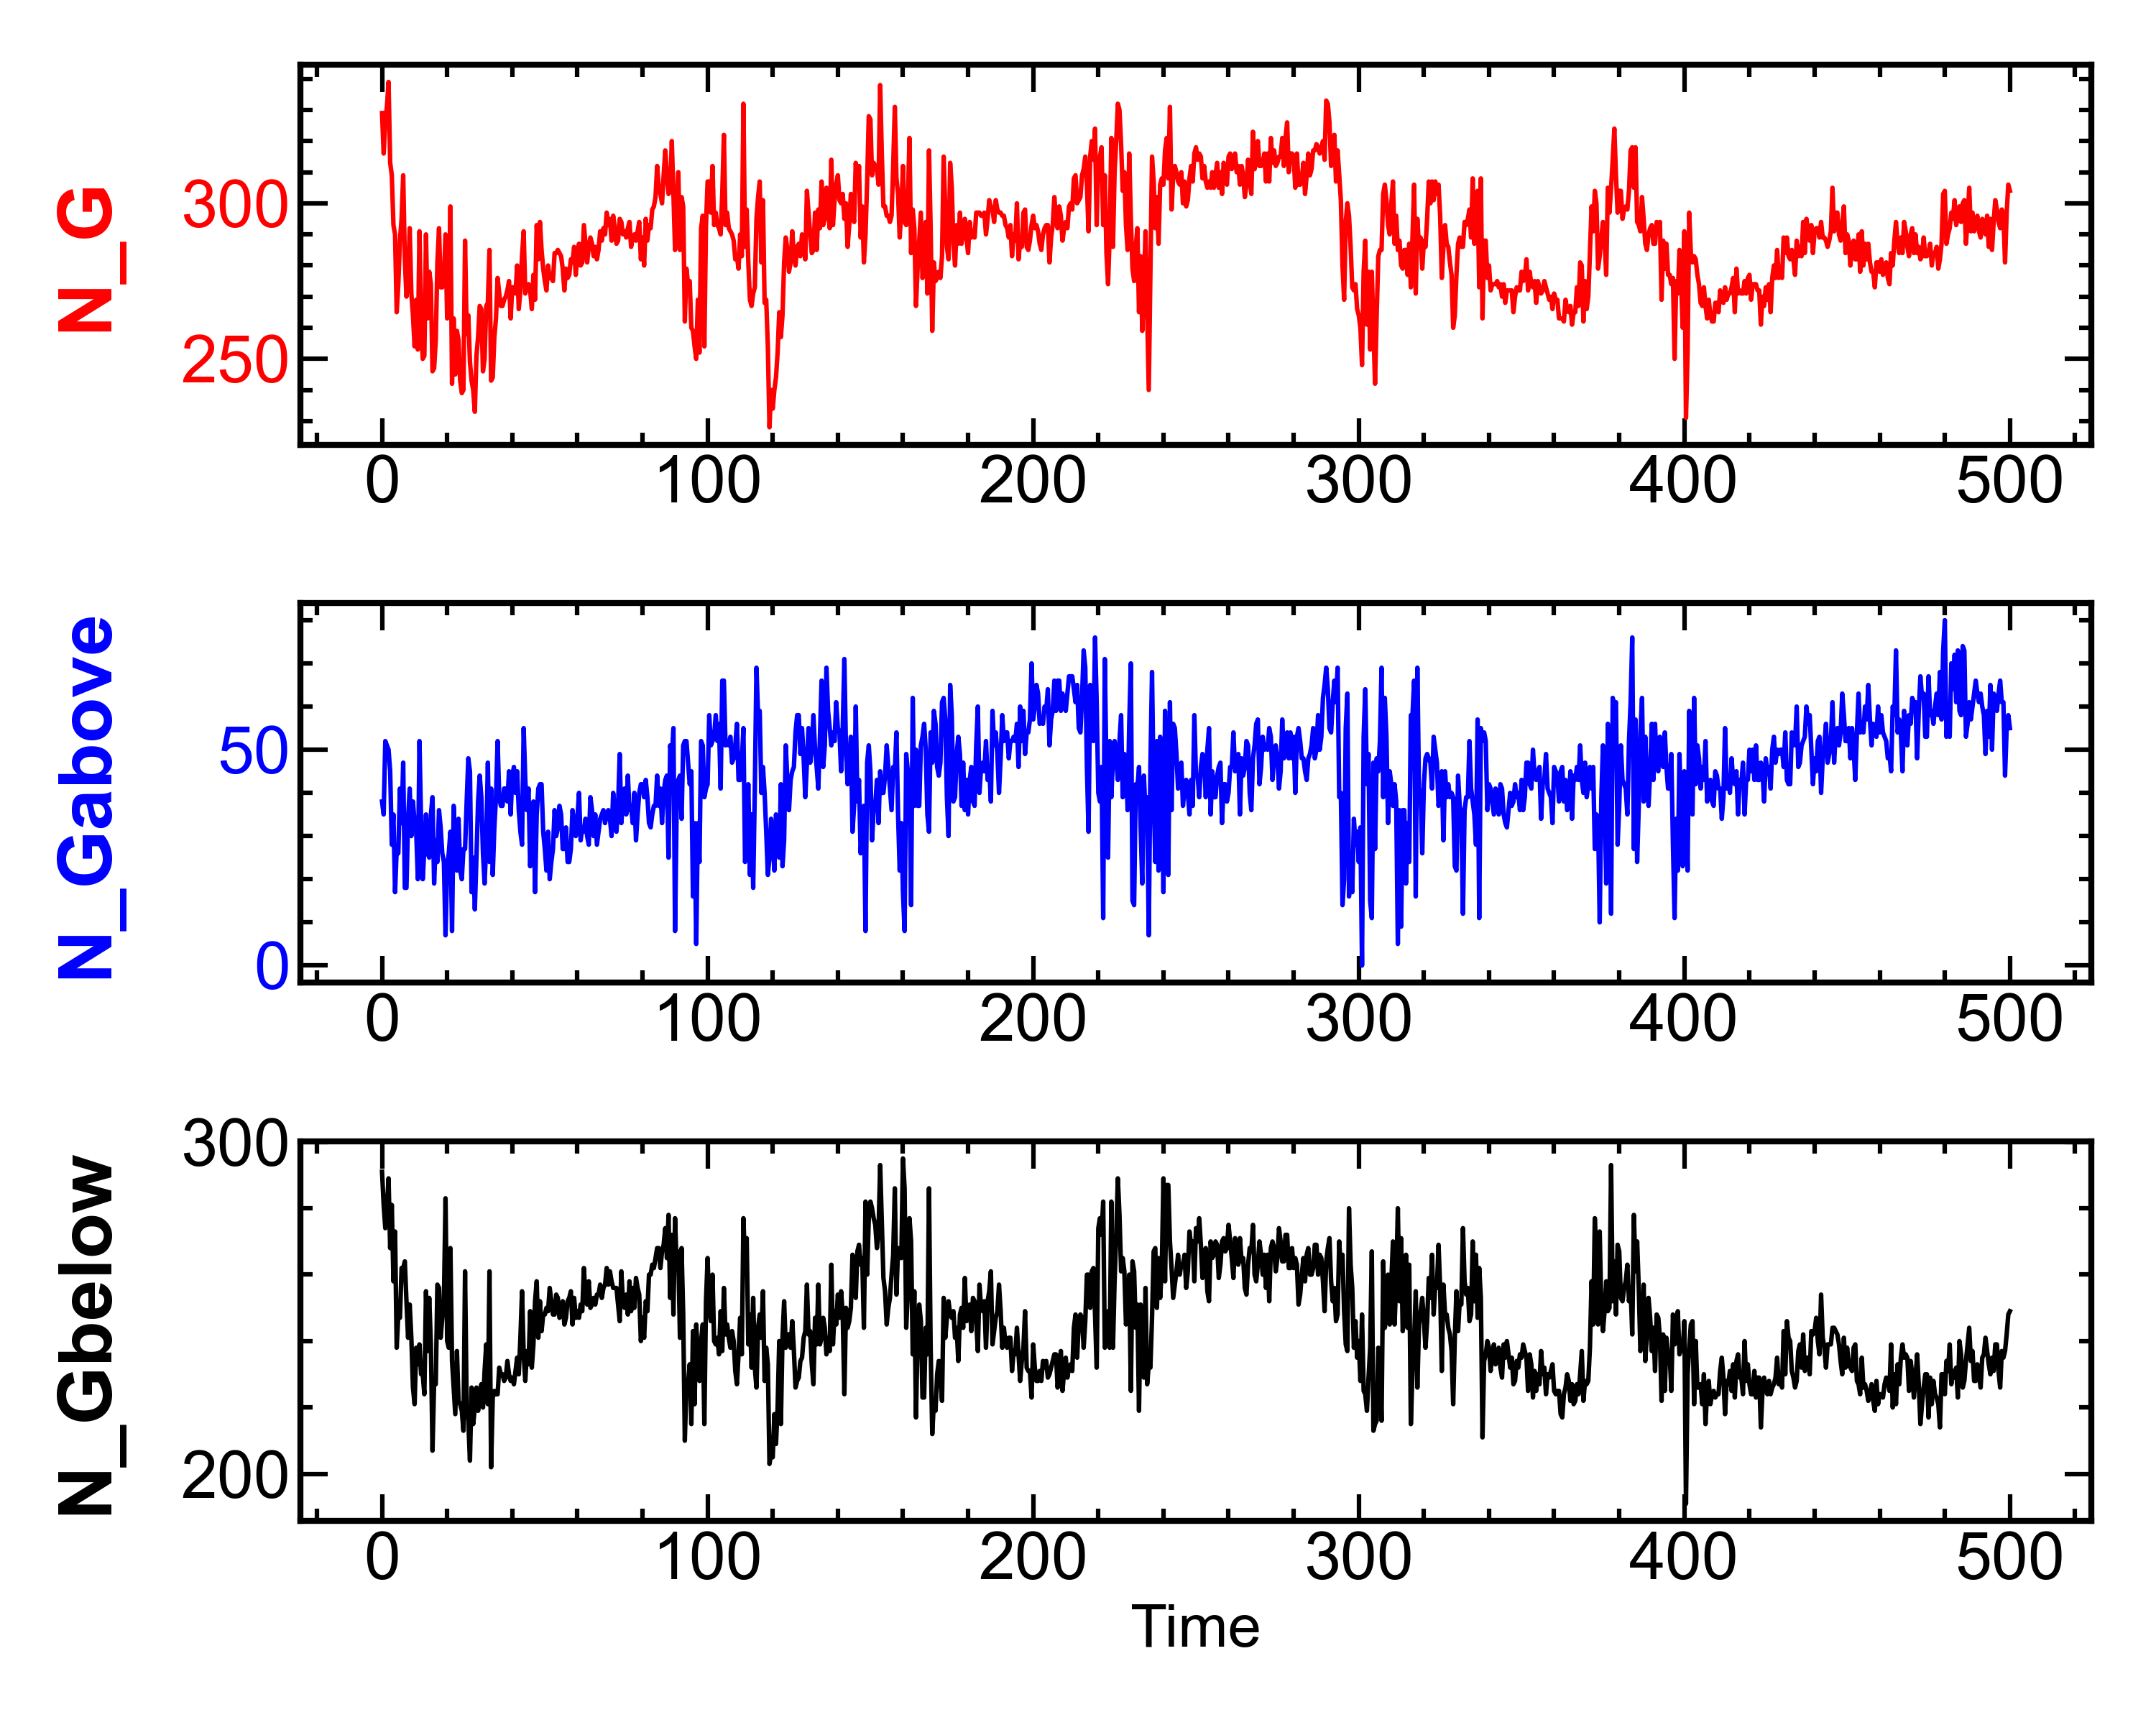
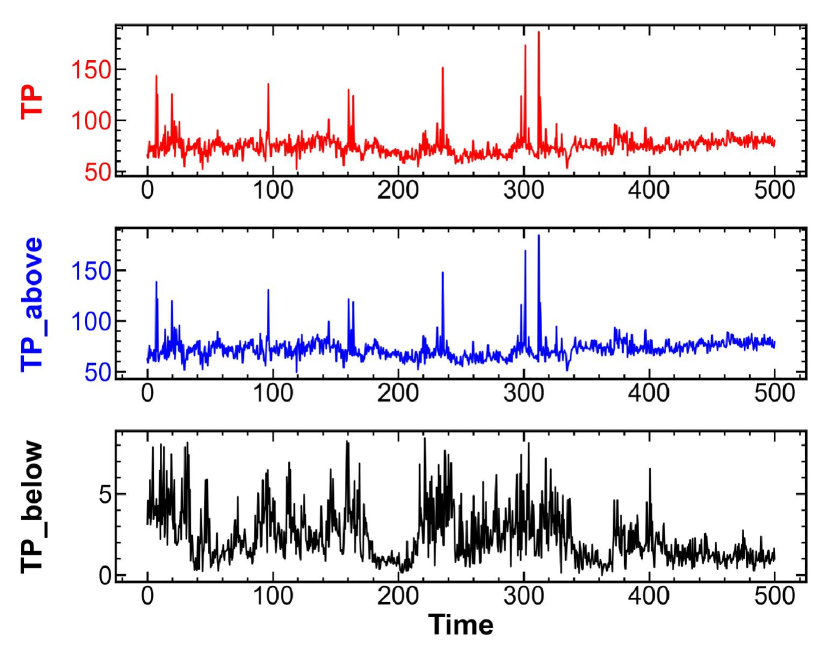
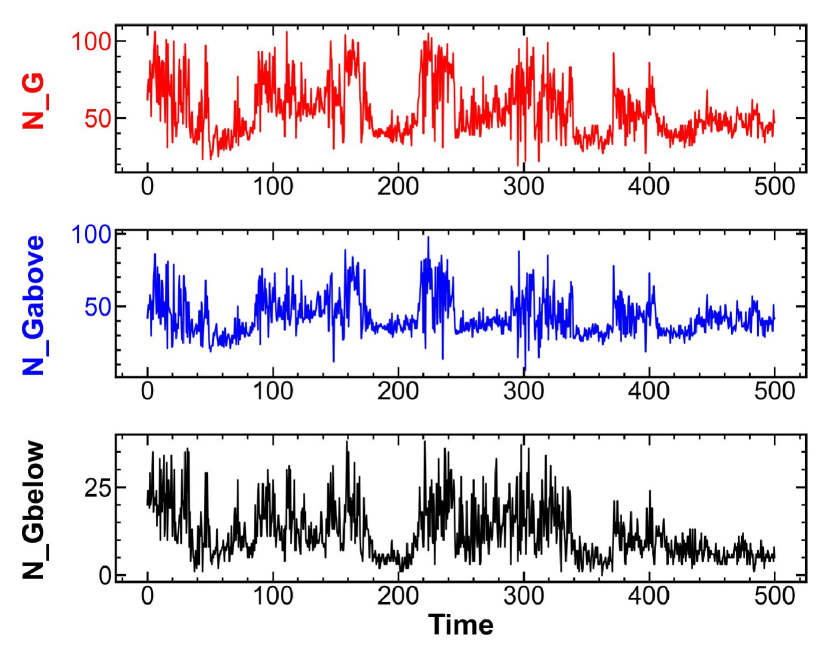
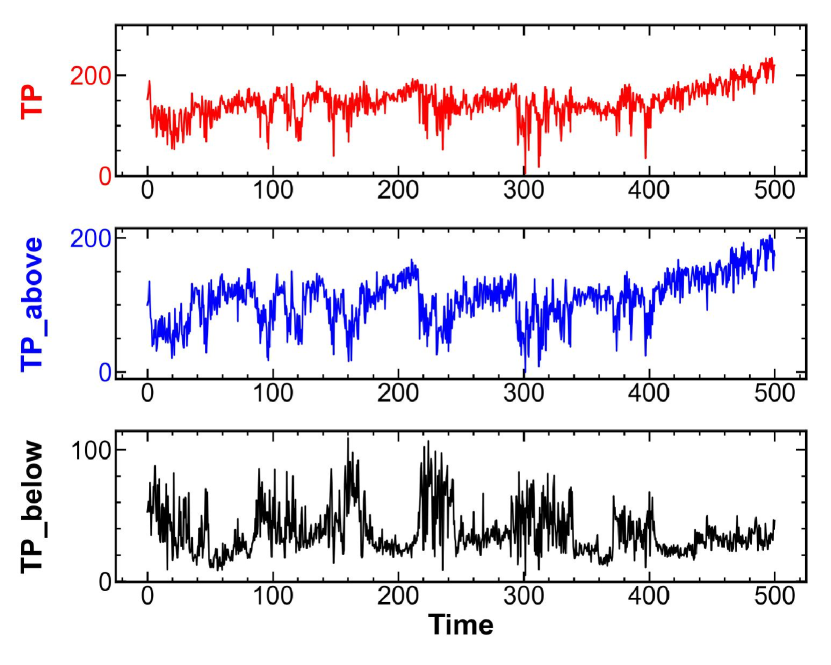
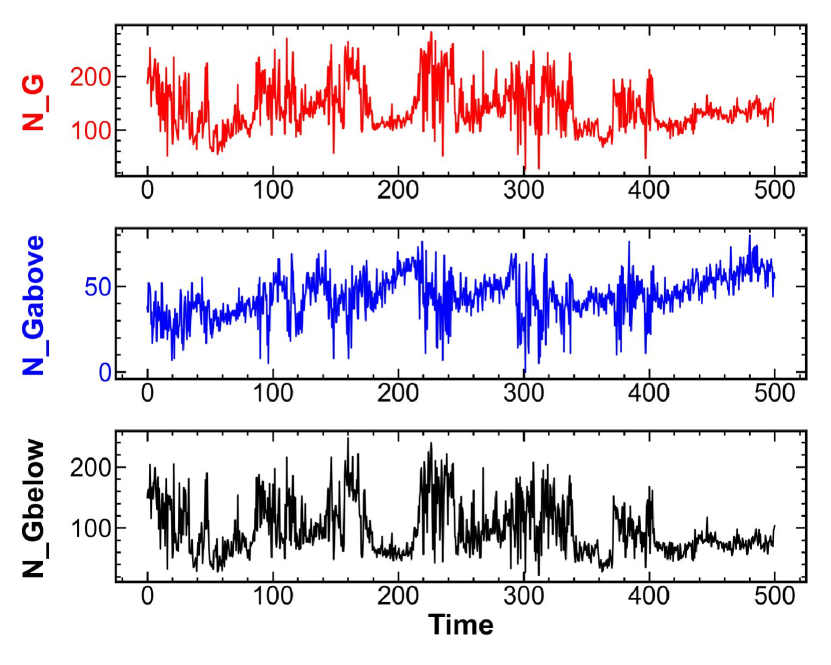
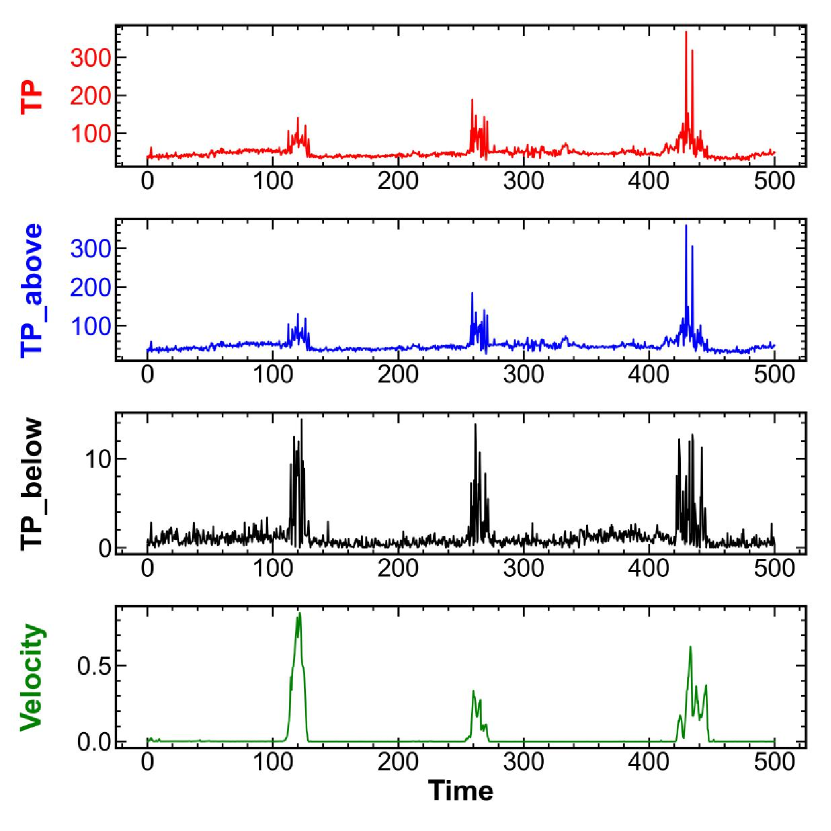
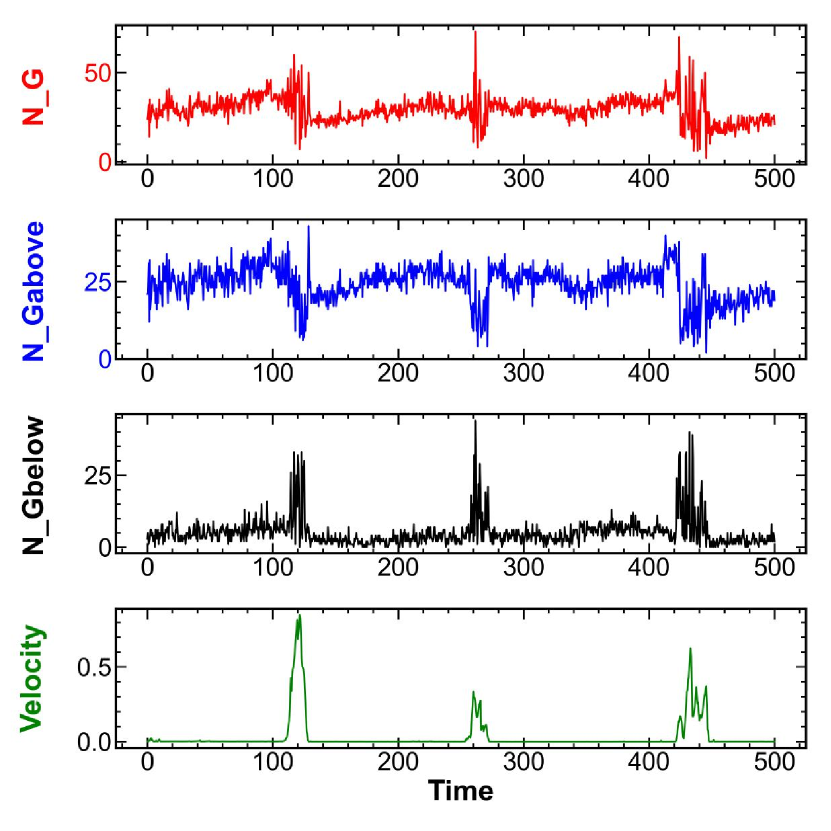
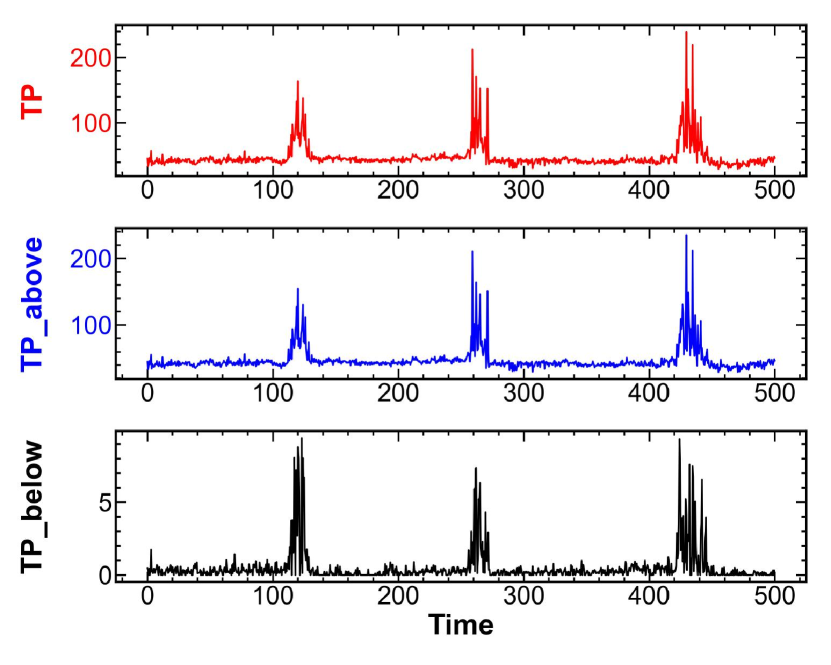
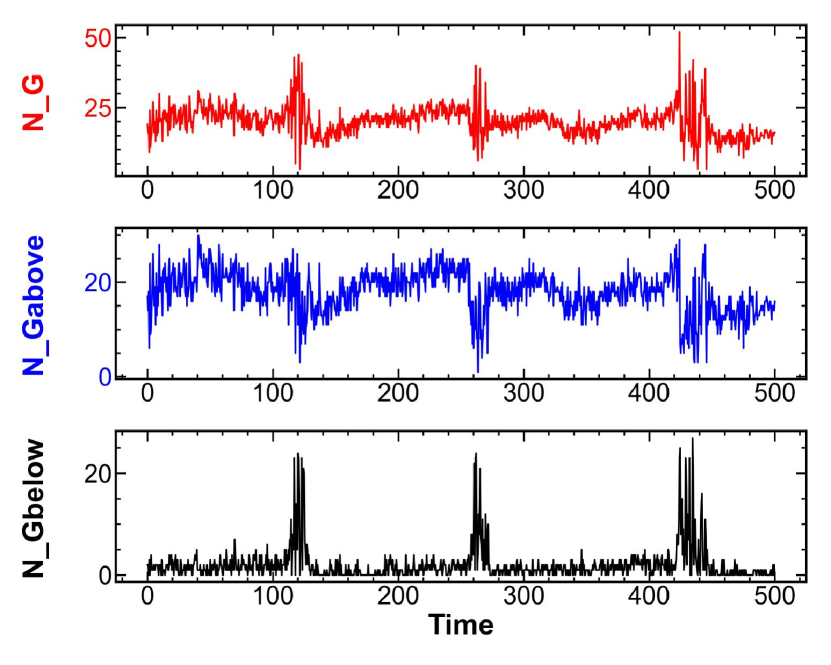
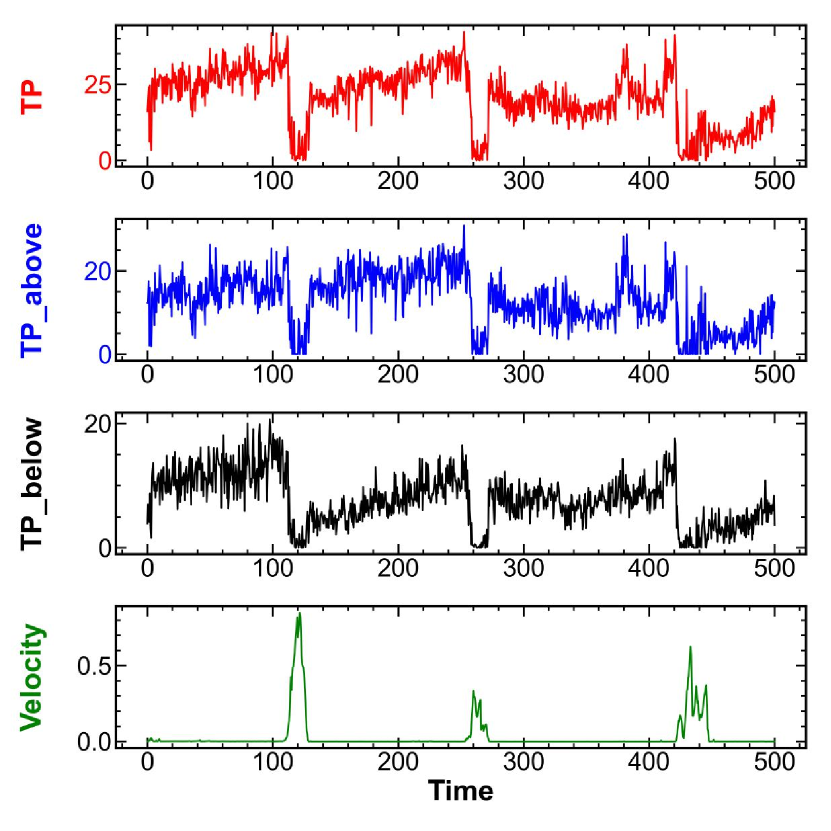
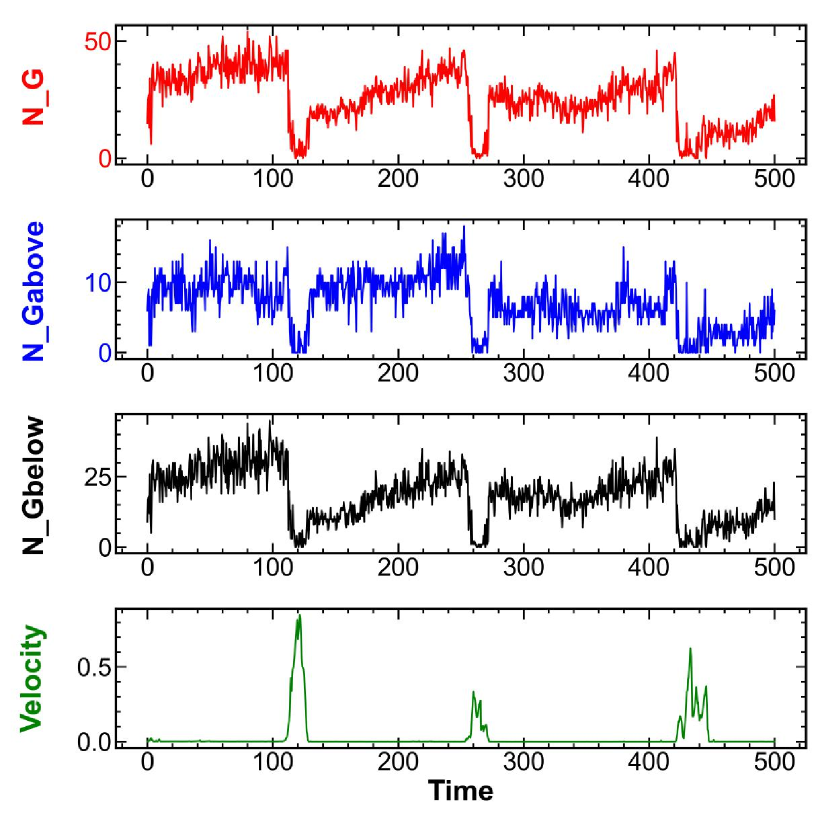
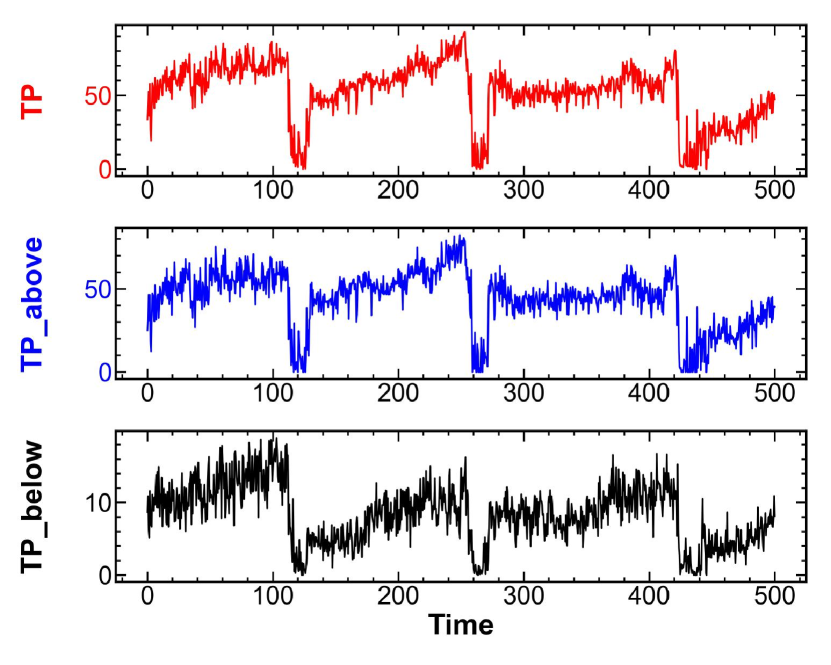
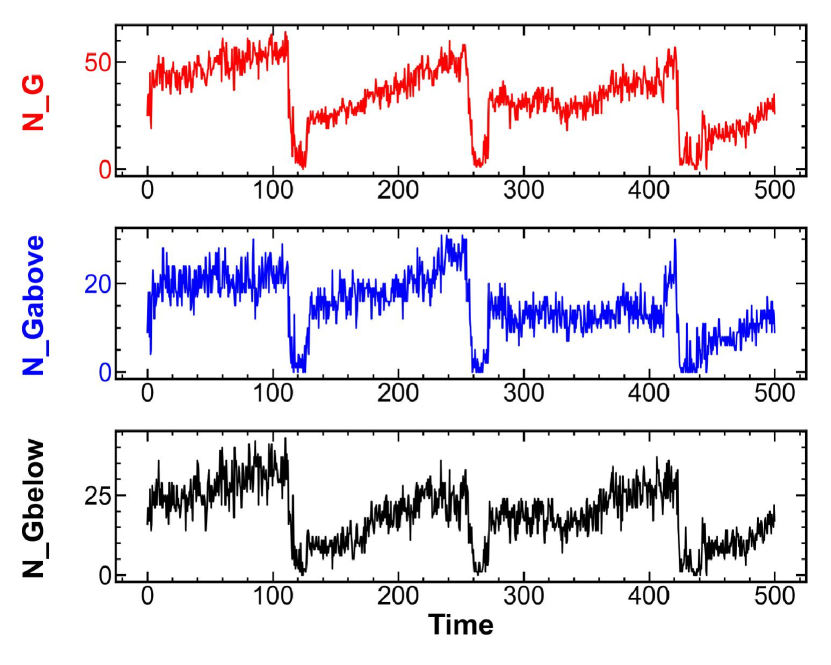
We start by considering disks with basal friction, measuring the total persistence (TP) and the number of generators (NG) in the PDs, as discussed in the Methods section. Both measures are considered for all force thresholds, and also separately for the forces with the birth coordinate above (TPabove) and below (TPbelow) the mean force (similarly for NG). All the measures are considered for both FC and FP networks, and both for the components () and for the loops (). On each figure we also plot the magnitude of the intruder’s velocity, so to facilitate the comparison between the PH-derived measures and the intruder’s dynamics.
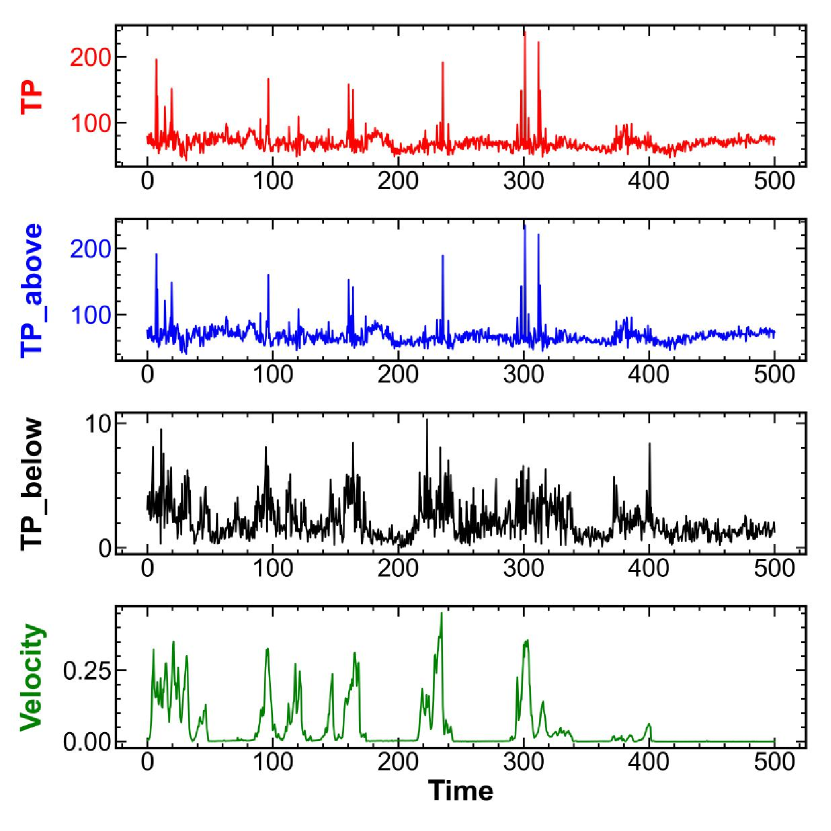
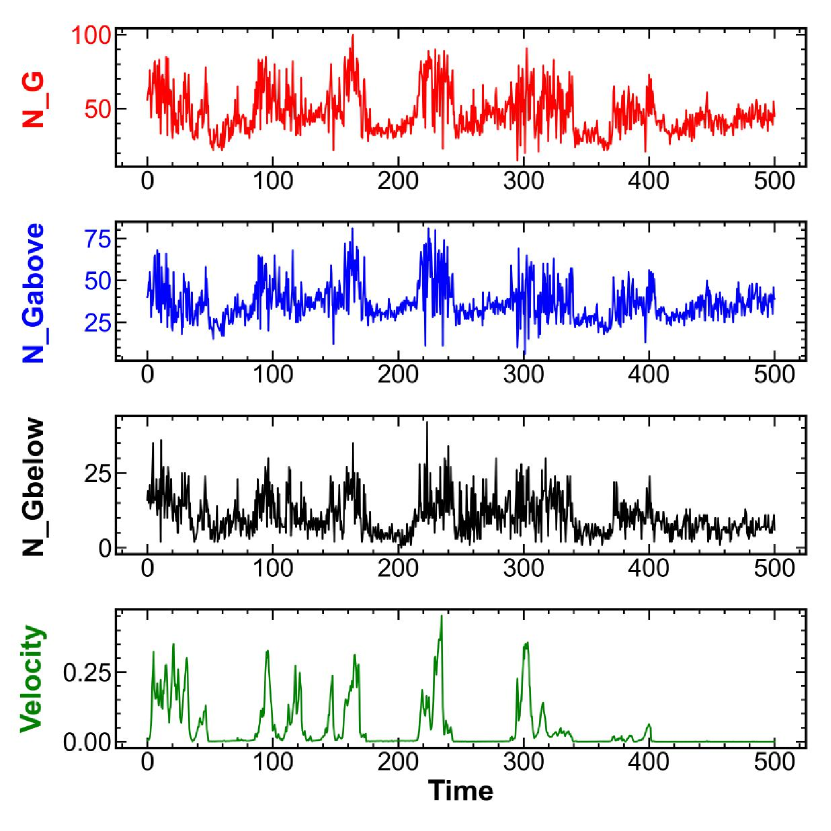
Figure 7 shows TP and number of generators (NG) for the components in the FC and FP networks. First, we note that motion of the intruder always leads to significant changes for both TP and NG. The TP results, shown in Fig. 7(a, c) appear to show similar behavior for the FC and FP networks; however, the generators appear to be different. A similar conclusion is obtained when we consider the results for loops, shown in Fig. 8. Furthermore, we notice that NG is significantly larger than what one would expect from the PDs for the force network snapshots, viz. Figs. 6. Detailed inspection uncovers that a significant number of generators is located at rather small forces, and very close to the diagonal. These generators correspond to the features which are insignificant, and may be due to the small variations of the forces between the particles; in experiments, such features may be very difficult to detect. These generators do not have strong influence on TP, since they are characterized by very small lifespans. To analyze the significant features characterized by the generators that are further away from the diagonal, we consider next the results obtained by removing a narrow band of the generators that are very close to the diagonal. We choose the thickness of this narrow band to be 0.1 (so, 10% of the mean force). Figures 9 and 10 show the corresponding results: as expected, we find that the TP results are similar as if the band of generators were not removed, while the number of generators is significantly smaller, in particular for loops and for small forces.

While the visual comparison of the figures presented so far appears promising, in the sense that the two considered networks appear similar, one wishes to provide more precise comparisons between the two network types. For this purpose, we compute the correlation coefficient, , between the time series defined by the TP and NG data, after subtracting their respective means. This calculation is carried out for 8 sets of simulations such as ones shown in Figs. 7 - 10. To help interpret the results discussed next, we note that means perfect correlations, means no correlation, and means anticorrelation.
Table 1 shows the results for disks with basal friction. While the correlations are not particularly high when all generators are included, the correlation after removing the band next to diagonal is very good, both for the components and for the loops. This result suggests that once the insignificant features are removed, the correlation of significant, dominant features between the two networks is excellent.
| (complete) | (band removed) | (complete) | (band removed) | |
|---|---|---|---|---|
| TP | 0.86 | 0.92 | 0.95 | 0.94 |
| TPabove | 0.85 | 0.92 | 0.93 | 0.95 |
| TPbelow | 0.91 | 0.87 | 0.97 | 0.97 |
| NG | 0.42 | 0.92 | 0.80 | 0.96 |
| NGabove | 0.65 | 0.90 | 0.76 | 0.95 |
| NGbelow | 0.50 | 0.80 | 0.78 | 0.98 |
3.3 Comparison of contact force and particle force networks: Other systems
We proceed by discussing briefly the other three considered configurations: the disks without basal friction and pentagons both with and without basal friction. As specified previously for disks we consider always and for pentagons . With basal friction both systems show stick-slip type of dynamics both in simulations and in experiments; without basal friction the systems follow clogging type dynamics [Carlevaro et al. (2020)], [Kozlowski et al. (2019)]. Therefore, by considering the four outlined configurations, we are in the position to discuss both the influence of particle shape and of particle dynamics on the force networks, and in particular, on the degree of agreement between the FC and FP networks. Motivated by the high degree of correlation found for disks with basal friction when a narrow band of generators close to the diagonal is removed, we report only such results in what follows; furthermore, for brevity we show time series of the results for TP and NG for pentagons with basal friction only.
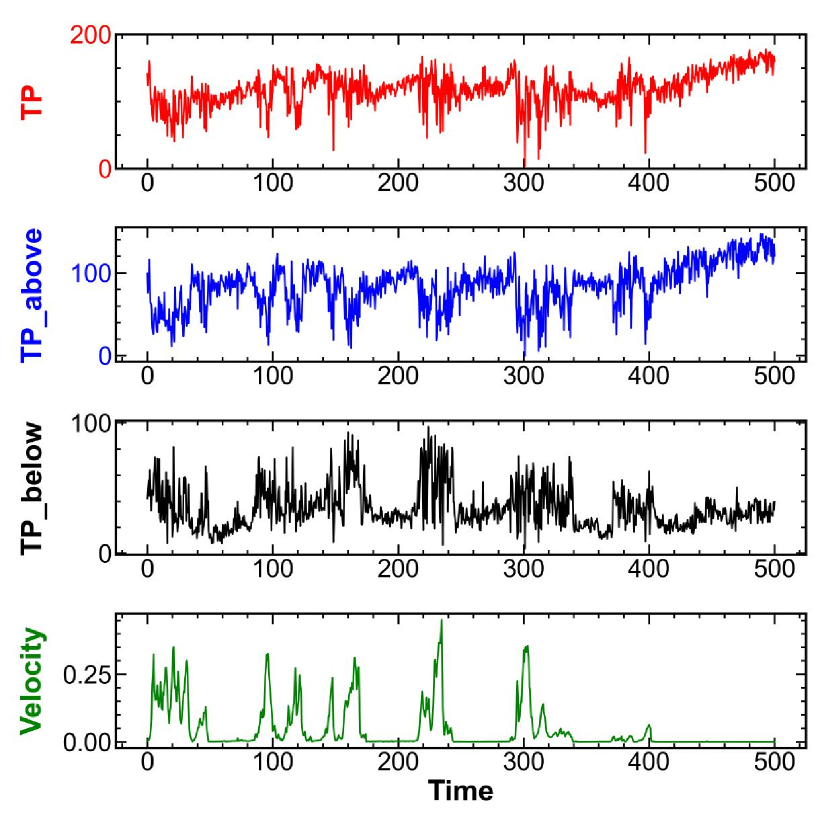
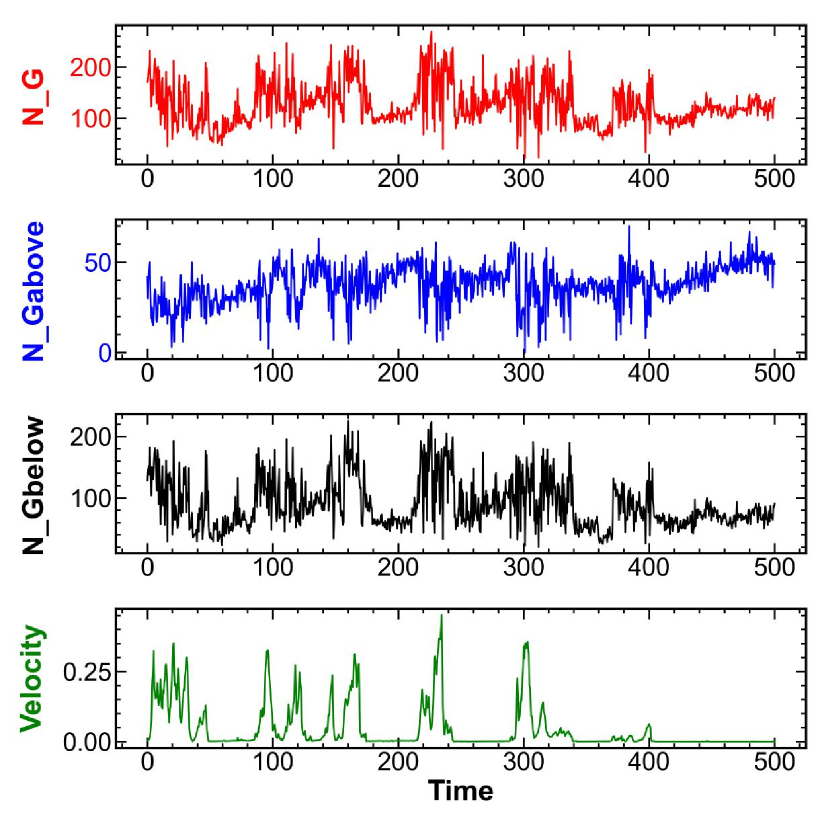
Figures 11 and 12 show the results for pentagons. The comparison with the results for disks show that the measures that we consider (TP and NG) are considerably different between the two systems, despite the fact that both system lead to the stick-slip type of dynamics. For pentagons we observe that the results for TP and NG are much less noisy, with clearly defined slip events, and not many changes in TP during the stick phases. The comparison of the results for the loops, Figs. 10 and 12 is interesting as well. The pentagons show a significantly smaller number of loops. This feature of the results will be discussed in more details in our future work. For present purposes, the main question is whether the correlation between the FC and FP networks is still as good as found for the disks. Table 2 show that this is indeed the case: the correlation between two measures that we consider is still excellent.
Finally, we comment briefly on the results obtained without basal friction. In such systems, one finds clogging type of dynamics, leading to PH results that are much more noisy for both disks and pentagons (not shown for brevity). However, despite the noisy behavior, the correlations between the considered measures, shown in Tables 3 and 4 are still excellent. This result suggest that even for dynamic systems, one can still obtain an excellent understanding regarding the evolving force networks even if only total force on the particles is known. Of course, we have considered only one particular setup, and only relatively crude measures for the purpose of quantifying the considered networks: further research should consider other type of dynamics, as well as more detailed measures for analysis of the considered networks and associated persistence diagrams.
| TP | 0.86 | 0.92 |
|---|---|---|
| TPabove | 0.86 | 0.85 |
| TPbelow | 0.90 | 0.85 |
| NG | 0.84 | 0.97 |
| NGabove | 0.81 | 0.84 |
| NGbelow | 0.86 | 0.91 |
| TP | 0.84 | 0.95 |
|---|---|---|
| TPabove | 0.84 | 0.94 |
| TPbelow | 0.84 | 0.97 |
| NG | 0.95 | 0.98 |
| NGabove | 0.94 | 0.96 |
| NGbelow | 0.86 | 0.98 |
| TP | 0.78 | 0.87 |
|---|---|---|
| TPabove | 0.78 | 0.74 |
| TPbelow | 0.80 | 0.83 |
| NG | 0.85 | 0.92 |
| NGabove | 0.85 | 0.75 |
| NGbelow | 0.85 | 0.88 |
4 Conclusions
While force networks and their static and dynamic properties are known to be a crucial factor determining macroscopic behavior of particulate-based systems, they are difficult to extract from experiments. In this work, we have shown that even if only incomplete information is available, a still very good understanding of the main features of the force networks can be extracted. This result is found to hold for the particles independently of their shape (disks and pentagons have been considered) and both for stick-slip and clogging type of dynamics. In reaching this conclusion, we were helped greatly by the tools of persistent homology, which allow for extraction of simple but objective measures describing complicated weighted networks.
While in this work we focus on two dimensional (2D) systems, the methods used are not limited to 2D - they are applicable equally well in 3D. Our results therefore set a stage for more in-depth analysis of the properties of force networks in 3D, where the interparticle forces are even more difficult to obtain.
Furthermore, the presented results set the stage for comparing the results of simulations (for which we have complete data about interparticle forces available) and of experiments, for which only partial information may be available. Such a comparison will be the subject of future work.
5 Data Availability Statement
All the data used in this study is available from the authors upon request.
6 Acknowledgments
This study was supported by the US Army Research Office Grant No. W911NF1810184. L.A.P. and C.M.C. acknowledge support by Universidad Tecnológica Nacional through Grants No. PID- MAUTNLP0004415 and No. PID-MAIFIBA0004434TC and CONICET through Grant No. RES-1225-17 and PUE 2018 229 20180100010 CO.
7 Supplemental Materials
References
- Ardanza-Trevijano et al. (2014) Ardanza-Trevijano, S., Zuriguel, I., Arévalo, R., and Maza, D. (2014). “Topological analysis of tapped granular media using persistent homology.” Phys. Rev. E, 89, 052212.
- Arévalo et al. (2013) Arévalo, R., Pugnaloni, L. A., Zuriguel, I., and Maza, D. (2013). “Contact network topology in tapped granular media.” Phys. Rev. E, 87, 022203.
- Arévalo et al. (2010) Arévalo, R., Zuriguel, I., and Maza, D. (2010). “Topology of the force network in jamming transition of an isotropically compressed granular packing.” Phys. Rev. E, 81, 041302.
- Bassett et al. (2012) Bassett, D. S., Owens, E. T., Daniels, K. E., and Porter, M. A. (2012). “Influence of network topology on sound propagation in granular materials.” Phys. Rev. E, 86, 041306.
- Behringer and Chakraborty (2018) Behringer, R. P. and Chakraborty, B. (2018). “The physics of jamming for granular materials: a review.” Rep. Progress Phys., 82, 012601.
- Bo et al. (2014) Bo, L., Mari, R., Song, C., and Makse, H. A. (2014). “Cavity method for force transmission in jammed disordered packings of hard particles.” Soft Matter, 10, 7379–7392.
- (7) Box2d. Available at http://box2d.org.
- Carlevaro and Pugnaloni (2011) Carlevaro, C. and Pugnaloni, L. (2011). “Steady state of tapped granular polygons.” J. Stat. Mech., 11, 01007.
- Carlevaro et al. (2020) Carlevaro, C. M., Kozlowski, R., Pugnaloni, L. A., Zheng, H., Socolar, J. E. S., and Kondic, L. (2020). “Intruder in a two-dimensional granular system: Effects of dynamic and static basal friction on stick-slip and clogging dynamics.” Phys. Rev. E, 101, 012909.
- Catto (2005) Catto, E. (2005). “Iterative dynamics with temporal coherence. available at https://box2d.org/downloads/.
- Cheng et al. (2021) Cheng, C., Zadeh, A., and Kondic, L. (2021). “Correlating the force network evolution and dynamics in slider experiments. available at arxiv:2101:07218.
- Daniels et al. (2017) Daniels, K. E., Kollmer, J. E., and Puckett, J. G. (2017). “Photoelastic force measurements in granular materials.” Rev. Sci. Instruments, 88(5), 051808.
- Dijksman et al. (2018) Dijksman, J. A., Kovalcinova, L., Ren, J., Behringer, R. P., Kramár, M., Mischaikow, K., and Kondic, L. (2018). “Characterizing granular networks using topological metrics.” Phys. Rev. E, 97, 042903.
- Gameiro et al. (2020) Gameiro, M., Singh, A., Kondic, L., Mischaikow, K., and Morris, J. F. (2020). “Interaction network analysis in shear thickening suspensions.” Phys. Rev. Fluids, 5, 034307.
- Giusti et al. (2016) Giusti, C., Papadopoulos, L., Owens, E. T., Daniels, K. E., and Bassett, D. S. (2016). “Topological and geometric measurements of force-chain structure.” Phys. Rev. E, 94, 032909.
- (16) GUDHI. “Topological data analysis and geometric inference in higher dimension. https://gudhi.inria.fr.
- Howell et al. (1999) Howell, D., Behringer, R. P., and Veje, C. (1999). “Stress fluctuations in a 2d granular couette experiment: A continuous transition.” Phys. Rev. Lett., 82, 5241.
- Kondic et al. (2012) Kondic, L., Goullet, A., O’Hern, C., Kramar, M., Mischaikow, K., and Behringer, R. (2012). “Topology of force networks in compressed granular media.” Europhys. Lett., 97, 54001.
- Kondic et al. (2016) Kondic, L., Kramár, M., Pugnaloni, L. A., Carlevaro, C. M., and Mischaikow, K. (2016). “Structure of force networks in tapped particulate systems of disks and pentagons. ii. persistence analysis.” Phys. Rev. E, 93, 062903.
- Kozlowski et al. (2019) Kozlowski, R., Carlevaro, C. M., Daniels, K. E., Kondic, L., Pugnaloni, L. A., Socolar, J. E. S., Zheng, H., and Behringer, R. P. (2019). “Dynamics of a grain-scale intruder in a two-dimensional granular medium with and without basal friction.” Phys. Rev. E, 100, 032905.
- Kramár et al. (2013) Kramár, M., Goullet, A., Kondic, L., and Mischaikow, K. (2013). “Persistence properties of compressed granular matter.” Phys. Rev. E, 87, 042207.
- Kramár et al. (2014a) Kramár, M., Goullet, A., Kondic, L., and Mischaikow, K. (2014a). “Evolution of force networks in dense particulate media.” Phys. Rev. E, 90, 052203.
- Kramár et al. (2014b) Kramár, M., Goullet, A., Kondic, L., and Mischaikow, K. (2014b). “Quantifying force networks in particulate systems.” Physica D., 283, 37 – 55.
- Kramár et al. (2016) Kramár, M., Levanger, R., Tithof, J., Suri, B., Xu, M., Paul, M., Schatz, M. F., and Mischaikow, K. (2016). “Analysis of kolmogorov flow and rayleigh–bénard convection using persistent homology.” Physica D: Nonlinear Phenomena, 334, 82 – 98.
- Mileyko et al. (2011) Mileyko, Y., Mukherjee, S., and Harer, J. (2011). “Probability measures on the space of persistence diagrams.” Inverse Problems, 27(12), 124007.
- Peters et al. (2005) Peters, J., Muthuswamy, M., Wibowo, J., and Tordesillas, A. (2005). “Characterization of force chains in granular material.” Phys. Rev. E, 72, 041307.
- Pugnaloni et al. (2016) Pugnaloni, L., Carlevaro, C., Kramár, M., Mischaikow, K., and Kondic, L. (2016). “Structure of force networks in tapped particulate systems of disks and pentagons. i. clusters and loops.” Phys. Rev. E, 93, 062902.
- Pytlos et al. (2015) Pytlos, M., Gilbert, M., and Smith, C. C. (2015).” Geotech. Lett., 5, 243–249.
- Sarkar et al. (2013) Sarkar, S., Bi, D., Zhang, J., Behringer, R. P., and Chakraborty, B. (2013). “Origin of rigidity in dry granular solids.” Phys. Rev. Lett., 111, 068301.
- Shah et al. (2020) Shah, S., Cheng, C., Jalali, P., and Kondic, L. (2020). “Failure of confined granular media due to pullout of an intruder: from force networks to a system wide response.” Soft Matter, 16, 7685–7695.
- Snoeijer et al. (2004) Snoeijer, J. H., Vlugt, T. J. H., van Hecke, M., and van Saarloos, W. (2004). “Force network ensemble: A new approach to static granular matter.” Phys. Rev. Lett., 92, 054302.
- Takahashi et al. (2018) Takahashi, T., Clark, A. H., Majmudar, T., and Kondic, L. (2018). “Granular response to impact: Topology of the force networks.” Phys. Rev. E, 97, 012906.
- Tighe et al. (2010) Tighe, B. P., Snoeijer, J. H., Vlugt, T. J. H., and van Hecke, M. (2010). “The force network ensemble for granular packings.” Soft Matter, 6, 2908–2917.
- Tordesillas et al. (2015) Tordesillas, A., Tobin, S. T., Cil, M., Alshibli, K., and Behringer, R. P. (2015). “Network flow model of force transmission in unbonded and bonded granular media.” Phys. Rev. E, 91, 062204.
- Tordesillas et al. (2012) Tordesillas, A., Walker, D. M., Froyland, G., Zhang, J., and Behringer, R. (2012). “Transition dynamics of frictional granular clusters.” Phys. Rev. E, 86, 011306.
- Tordesillas et al. (2010) Tordesillas, A., Walker, D. M., and Lin, Q. (2010). “Force cycles and force chains.” Phys. Rev. E, 81, 011302.
- Walker and Tordesillas (2012) Walker, D. and Tordesillas, A. (2012). “Taxonomy of granular rheology from grain property networks.” Phys. Rev. E, 85, 011304.
- Zadeh et al. (2019) Zadeh, A. A., Barés, J., Brzinski, T. A., Daniels, K. E., Dijksman, J., Docquier, N., Everitt, H. O., Kollmer, J. E., Lantsoght, O., Wang, D., et al. (2019). “Enlightening force chains: a review of photoelasticimetry in granular matter.” Gran. Matt., 21, 83.
- Zhao et al. (2019) Zhao, Y., Zheng, H., Wang, D., Wang, M., and Behringer, R. P. (2019). “Particle scale force sensor based on intensity gradient method in granular photoelastic experiments.” New J. Phys., 21, 023009.