MUSE narrow field mode observations of the central kinematics of M15
Abstract
We present observations of the stellar kinematics of the centre of the core collapsed globular cluster M15 obtained with the MUSE integral field spectrograph on the VLT operating in narrow field mode. Thanks to the use of adaptive optics, we obtain a spatial resolution of 0.1 arcsec and are able to reliably measure the radial velocities of 864 stars within 8 arcsec of the centre of M15 thus providing the largest sample of radial velocities ever obtained for the innermost regions of this system. Combined with previous observations of M15 using MUSE in wide field mode and literature data, we find that the central kinematics of M15 are complex with the rotation axis of the core of M15 offset from the rotation axis of the bulk of the cluster. While this complexity has been suggested by previous work, we confirm it at higher significance and in more detail.
keywords:
stars: kinematics and dynamics - globular clusters: individual: NGC 7078 (M15)1 Introduction
The high stellar densities of globular clusters (GCs) have long proved a challenge in studying the kinematics of their resolved stars, particularly in their centres. However, recent improvements in instrumentation and analysis techniques have allowed the kinematics of large numbers of GC stars to be studied. Imaging from space using the Hubble Space Telescope has allowed proper motion measurements of GCs in their centres (e.g. Bellini et al., 2014; Watkins et al., 2015) while Gaia provides high quality astrometry in cluster outskirts (e.g. Gaia Collaboration et al., 2018; Bianchini et al., 2018; Sollima et al., 2019; Vasiliev, 2019). Recent advances in adaptive optics also provide the potential for useful astrometry in the centres of GCs (e.g. Dalessandro et al., 2016; Massari et al., 2016).
Multiobject spectroscopy has allowed large samples of radial velocities to be measured (e.g. Lane et al., 2011; Kimmig et al., 2015; Ferraro et al., 2018) but conventional fibre or slit spectroscopy is limited to the lower density outskirts. Integral field spectroscopy (e.g. Lanzoni et al., 2013; Kamann et al., 2014; Dalgleish et al., 2020) allows spectra to be observed even in dense fields, especially when used with techniques to reliably extract spectra from blended stars (Kamann et al., 2013). With wide-field integral field spectrographs, large numbers of spectra can be obtained at once, with Kamann et al. (2018a) measuring the radial velocities of over 200 000 stars in 22 GCs using MUSE on the VLT (Bacon et al., 2010).
M15 (NGC 7078) is an old ( Gyr, e.g. Dotter et al. 2010; VandenBerg et al. 2013), metal poor ([Fe/H] Carretta et al. 2009) GC with a mass of (e.g. Dalgleish et al., 2020). According to the 2010 edition of the Harris (1996) catalgoue, M15 lies 10.4 kpc from the Sun as well as 10.4 kpc from the Galactic centre. Its steep, cuspy surface brightness profile strongly suggests that it is a core collapse GC (e.g. Djorgovski & King, 1986).
To date, many groups investigated the kinematics of this GC through radial velocity (Peterson et al., 1989; Gebhardt et al., 1994, 2000; Gerssen et al., 2002) and proper motion (Bellini et al., 2014) surveys.
Interest on the central kinematics of M15 (e.g. Newell et al., 1976; Gerssen et al., 2002; McNamara et al., 2003; Baumgardt et al., 2003; Murphy et al., 2011; den Brok et al., 2014) initially focused on the possible presence of an intermediate mass black hole (IMBH) in the cluster. However, it is now generally considered unlikely that a core collapsed GC could host an IMBH as the excess kinetic energy that stars gain in interactions with the IMBH prevent their accumulation in the cluster centre (e.g. Illingworth & King, 1977; Baumgardt et al., 2003; Gieles et al., 2018).
More recent work has focused on the surprising detection of rotation in the central regions of M15. van den Bosch et al. (2006) found evidence for a fast spinning, kinematically decoupled core in the inner 4 arcsec of M15. This result, already suggested by the analysis of Gebhardt et al. (1997), was later supported by the work of Bianchini et al. (2013) and Kamann et al. (2018a) who found the core of M15 shows a higher rotation and a different rotation axis than what is found at large radii. This discovery was surprising given that ordered rotation should be quickly erased by the short relaxation time scale ( Myr Harris 1996) in the centre of M15. Kamann et al. (2018a) found a clear connection between the angular momentum of a GC and its relaxation time with GCs with shorter relaxation times having lower specific angular momenta (see also Bianchini et al., 2018; de Boer et al., 2019).
In this paper we combine the techniques of adaptive optics and integral field spectroscopy, by analysing MUSE observations in the AO-supported narrow field mode to study the central kinematics of M15. In Section 2 we describe our observations and data reduction as well as our radial velocity measurements and the literature datasets we include in our analysis. In Section 3 we present the spatially resolved inner kinematics of M15 before discussing these kinematics in 4.
2 Observations and data reduction
2.1 MUSE narrow field mode
We observed the centre of M15 using MUSE on the VLT in narrow field mode (NFM) as part of the NFM science verification (program 60.A-9492(A)) on the nights of 2018 September 13 and 14. We observed four pointings in a 2 by 2 mosaic centred on the cluster centre. Two of the pointings were observed for s; the remaining two s. The DIMM seeing ranged from 0.5 to 1.2 arcsec. The observations were all carried out using the GALACSI adaptive optics module (Arsenault et al., 2012; Ströbele et al., 2012) which provides MUSE a 7.5 by 7.5 arcsec field-of-view with a spatial sampling of 0.025 arcsec in NFM. In nominal mode, MUSE provides wavelength coverage between 4800 Å and 9300 Å with a gap between 5780 and 6050 Å due to the notch filter used to suppress the light from the laser guide stars. MUSE has a near constant spectral FWHM of Å across the wavelength range (corresponding to a resolution of at the blue end of the wavelength range and at the red end). The datacubes were reduced using the standard MUSE pipeline (Weilbacher et al., 2020) in the same manner as in Kamann et al. (2018b).
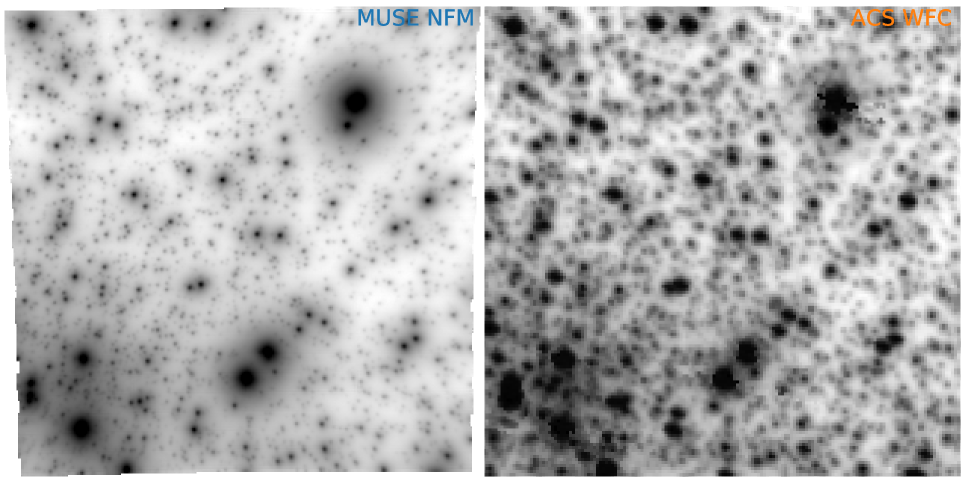
We used PampelMuse (Kamann et al., 2013) to extract the stellar spectra from the MUSE datacubes. PampelMuse determines the point spread function (PSF) from bright, isolated stars in the datacube and uses the PSF to extract spectra of all the sources in its input catalogue. We utilised the Beccari et al. (2019) HST ACS/HRC photometric catalogue as the input catalogue. During the extraction, we modelled the PSF using the combination of an outer Moffat and a central Gaussian profile. The idea behind this hybrid PSF model is that AO observations typically result in a PSF consisting of a diffraction-limited core surrounded by a seeing-limited halo. For the Gaussian component, we obtain a FWHM of at and at the calcium triplet. We compare a -band image created from one of the MUSE NFM pointings with the HST ACS/WFC F814W image from the ACS Globular Cluster Treasury Survey (GO-10775 Sarajedini et al., 2007) in Figure 1. In this wavelength region, the spatial resolution of the MUSE and HST data is is similar, with the MUSE PSF showing a sharper core but broader wings than the HST PSF.
Initial radial velocities were obtained by cross correlating the extracted spectra with synthetic templates from the PHOENIX library of Husser et al. (2013). In order to find a suitable template for each spectrum, we compared the photometry of Beccari et al. (2019) to an isochrone from the MIST (Choi et al., 2016) database, adopting a cluster metallicity of (Harris, 1996). The comparison provided us with estimates of the effective temperature and surface gravity of each star with a MUSE spectrum available, which were in turn used to select a synthetic template for the cross correlation.
In the final step of the spectrum analysis, we processed each spectrum with Spexxy (Husser et al., 2016). The code performs a full spectrum fit against the same library of synthetic spectra used for the cross correlation to measure the radial velocity, effective temperature, and metallicity of each star. Initial guesses for the fit were obtained from the isochrone comparison described above as well as from the cross correlation.
As detailed in Kamann et al. (2016), the radial velocities obtained with Spexxy tend to be more precise than those measured via cross correlation, hence we gave preference to the former. We obtained reliable radial velocities for 864 stars. This is a significant increase compared to previous studies in the number of stars with radial velocities in the central few arcsec of M15 (see below). Owing to the large range in brightness of our target stars, spectra were extracted over a wide range of signal-to-noise ratios, leading to very different uncertainties of the individual radial velocities. Our median accuracy is , while the 16th and 84th percentiles of the uncertainties distribution are and , respectively.
2.2 Literature radial velocities
We used the radial velocity catalogue from Kamann et al. (2018a) which used MUSE in wide field mode (WFM) to observe four pointings covering M15 out to arcmin at the same spectral resolution of the NFM dataset. The MUSE WFM dataset was reduced and analysed in the same manner as the MUSE NFM data, providing radial velocities for 10420 stars.
We also utilised the literature radial velocities from Gebhardt et al. (2000), Gerssen et al. (2002) and Baumgardt & Hilker (2018). Gebhardt et al. (2000) used an imaging Fabry-Perot spectrograph together with the CFHT Adaptive Optics Bonnette (Rigaut et al., 1998) to obtain radial velocities of 104 stars within 20 arcsec of the centre of M15. We note that these observations required 6.5 hours of exposure time. Gebhardt et al. (2000) combine this sample with their previous natural seeing Fabry-Perot observations and literature data to provide a dataset of 1779 radial velocities. We further note that the astrometry of this catalogue is poor, especially in the outskirts of M15.
Gerssen et al. (2002) used multiple long slit HST STIS observations to mimic an integral field spectrograph. They used 25 orbits of HST time to measure radial velocities for 64 stars.
The Baumgardt & Hilker (2018) sample combines 273 radial velocities from APOGEE (Abolfathi et al., 2018) with their own radial velocity measurements of archival VLT FLAMES (Pasquini et al., 2002) and Keck HIRES (Vogt et al., 1994) spectra. As these spectra were observed using traditional long slit or fibre spectroscopy, they all lie more than 30 arcsec away from the cluster centre.
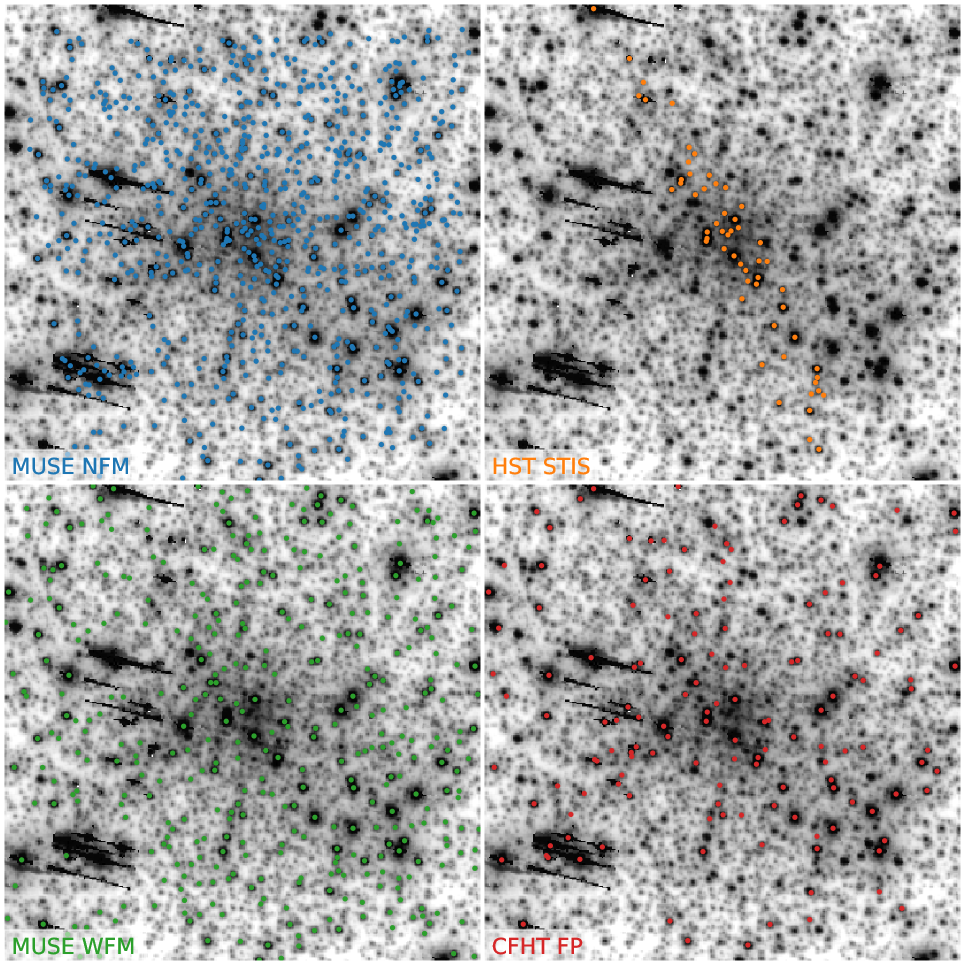
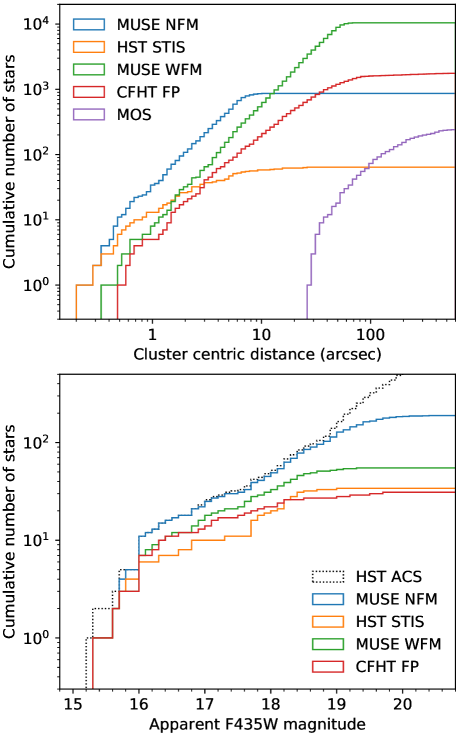
We compare the spatial distribution of stars from the first four catalogs in the inner 15 by 15 arcsec in Figure 2. We plot the radial distributions of stars from the five radial velocity catalogs in the upper panel of Figure 3. Our MUSE NFM observations provide significantly more radial velocities within 8 arcsec compared to previous works. The MUSE NFM observations provide 33 stars with radial velocities within 1 arcsec of the centre, 191 within 3 arcsec and 801 within 8 arcsec compared to 7, 57 and 363 stars respectively in the MUSE WFM observation within the same radii and 14, 57 and 173 stars within the same radii from the combined Gebhardt et al. (2000) and Gerssen et al. (2002) samples.
In the lower panel of Figure 3 we show the HST ACS/HRC F435W luminosity functions (using the photometry from Beccari et al. 2019) for each of the radial velocity catalogs within 3 arcsec of the centre of M15. Our MUSE NFM observations provide significantly more radial velocities for fainter stars than previous work. We are able to measure radial velocities for virtually all stars in the ACS/HRC input catalogue brighter than F435W.
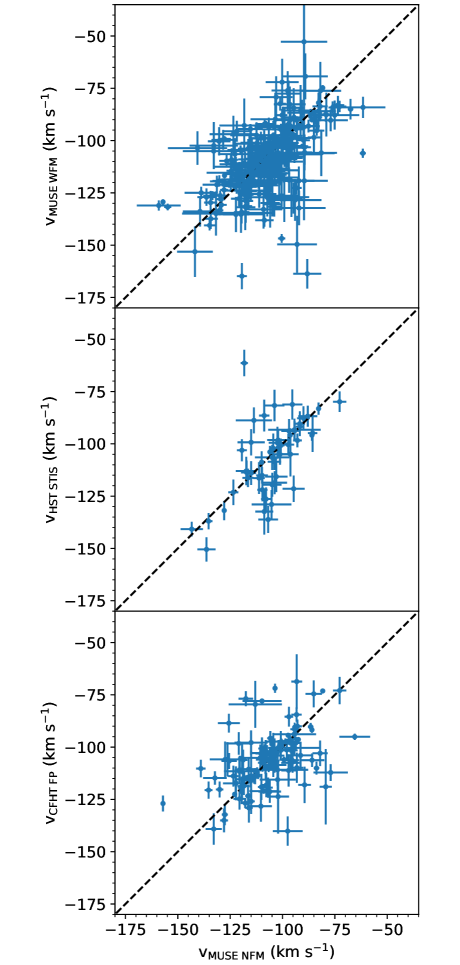
In Figure 4 we show a comparison of the MUSE NFM velocities and the other velocities. When combining the velocity catalogues we applied shifts to each of the other catalogues such that the median velocities of stars in common were the same as the median for the same stars in the MUSE NFM sample. For the 312 stars in common between the MUSE WFM and MUSE NFM datasets, 68 % of the velocity differences lie between and km s-1, for the 54 stars in common the HST STIS and MUSE NFM, 68 % of the velocity differences lie between and km s-1, and for the 126 stars in common the CFHT and MUSE NFM, 68 % of the velocity differences lie between and km s-1. The widths of the distributions of the velocity differences are roughly two times larger than would be expected from the uncertainties. The median uncertainties on the MUSE NFM velocities are similar to those of the MUSE WFM velocities (3.5 versus 3.2 km s-1) but smaller than the HST STIS (2.8 versus 5.5 km s-1) or the CFHT FP (2.0 versus 3.8 km s-1) velocity uncertainties for stars in common between the studies.
To check whether the uncertainties are systematically larger or smaller for one sample or another, we used the same Markov chain Monte Carlo kinematics analysis presented in Section 3 to fit the median velocity and the velocity dispersion for the stars in common between the other velocity source and the MUSE NFM using both the NFM velocities and the other sources for each of the MUSE WFM, HST STIS and CFHT FP datasets. In all cases the fitted kinematics agree within the uncertainties suggesting that the uncertainties of none of the samples are systematically different.
We expect that stars in short period binaries would have radial velocities that would vary between the different studies, inflating the differences in velocities beyond what is expected from their uncertainties. The binary fraction is also typically higher in the centres of GCs than in their outskirts (e.g. Milone et al., 2012; Ji & Bregman, 2015; Giesers et al., 2019).
3 Inner kinematics of M15
We analysed the spatial resolved kinematics in a similar manner as in Kamann et al. (2018a, 2020), by deriving 1D radial profiles and 2D Voronoi maps of the first and second moments of the line-of-sight velocity distribution. The radial profiles are depicted in Fig. 5. The continuous curves were obtained by describing the unbinned data using analytical models. More specific, we adopted the rotation profile expected for systems that underwent violent relaxation (Lynden-Bell, 1967; Gott, 1973, eq. 1 in Kamann et al. 2020), while a Plummer (1911) profile (eq. 2 in Kamann et al., 2020) was adopted for the dispersion. The model parameters were obtained using a maximum-likelihood approach, where we used the Markov chain Monte Carlo code emcee (Foreman-Mackey et al., 2013) to sample their posterior distributions. Our model also included a background component, characterised by a Gaussian velocity distribution with mean velocity and dispersion and a surface stellar density . Inclusion of the background component allowed us to determine a posteriori cluster membership probabilities for all stars in our sample, via
where and are the radial velocity of the -th star and its associated uncertainty and is the velocity dispersion of the bin containing it. We do not try to identify or remove the contribution of binary stars.
We also analysed the kinematics in radial bins that contained at least 100 stars and covered at least a radial range of 0.2 dex in log radius. From this, we excluded all stars with membership probabilities . Further, we fixed the mean velocity in each bin to the value of that was determined in the previous step. Hence, in each bin, we optimized three parameters: the rotation amplitude, the position angle of the rotation axis, and the velocity dispersion. To do so, we used the same maximum-likelihood approach introduced above. The values of the three parameters in all radial bins are included in Fig. 5.
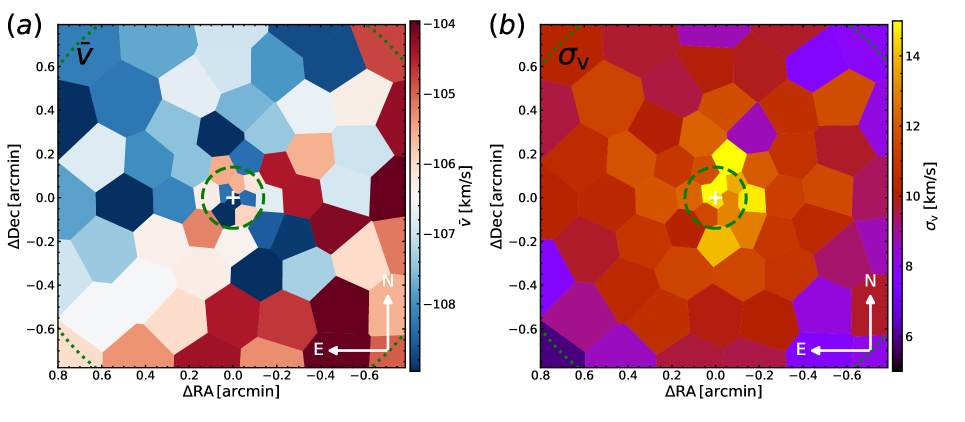
Second, we used the Cappellari & Copin (2003) code to create Voronoi maps of the kinematics of M15 with an average number of 100 stars per bin. In each bin, we used a simple Nelder-Mead optimization in order to obtain the mean velocity and the velocity dispersion. Stars with membership probabilities were again excluded from the calculation. The resulting Voronoi maps of the mean velocity and the velocity dispersion are shown in Fig. 6.
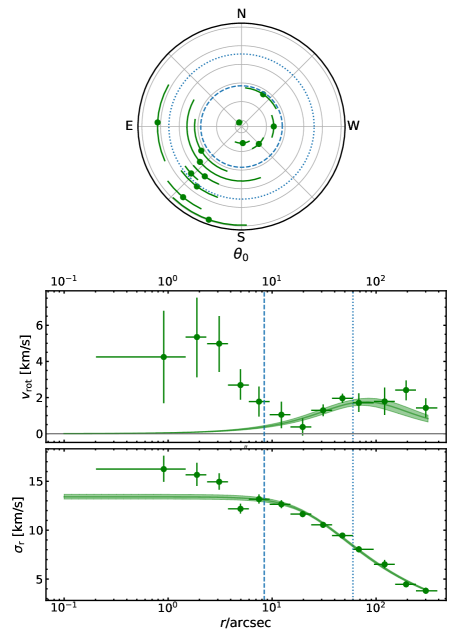
We see clear evidence for a kinematically distinct core in M15 in both the radial profiles and the Voronoi bins. While at large radii, the measured rotation profile is largely consistent with the analytic profile (cf. Fig. 5, upper left panel), this is not true for radii , where the rotation measurements obtained via radially binning the data diverge from the fitted profile. Rather than showing a single peak, the rotation amplitude shows a minimum at arcsec with two peaks at and arcsec. Since the analytic profile is fit to the individual stars and not the binned data, the profile is a better fit to the bins at large radii due to the larger number of stars in this range. Furthermore, the axis of rotation clearly twists by deg at roughly 10 arcsec of the centre (cf. Fig. 5, right panel). This twist has been previously identified by van den Bosch et al. (2006), Bianchini et al. (2013) and Kamann et al. (2018a). Another twist may be present even closer to the centre with the inner-most bin showing a rotation axis deg different from the next further out bin.
The Voronoi map shows a velocity field more complex and asymmetric than expected from a simple twisted disc model. For example, a region with negative velocity is seen south-west of the centre that does not have a corresponding region with positive velocity to the north-east. The velocity dispersion map shows an elongation of the central velocity peak in the north-south direction such that the velocity dispersion north and south of the centre is higher than east or west of the centre at the same distance.
4 Discussion
Kinematically distinct cores (KDCs) are found in the centres of some massive early-type galaxies (e.g. 19 out 260 galaxies in the ATLAS sample, Krajnović et al. 2011). In galaxies, KDCs are usually thought to form due to mergers (e.g. Kormendy, 1984; Franx & Illingworth, 1988; Balcells & Quinn, 1990; Hernquist & Barnes, 1991; Hoffman et al., 2010; Bois et al., 2011). However, mergers of GC are thought to be relatively rare (Khoperskov et al., 2018). We note that M15 does not show any spread in Fe (Carretta et al., 2009) which might be expected if M15 is a merger remnant.
Alternatively, a KDC may be due to the projection effects of a triaxial system with a different distribution of orbits in the centre than in the outskirts (Statler, 1991; van den Bosch et al., 2008). Core collapse could conceivably cause the orbits in the centre of the cluster to be different than in the outskirts.
Kamann et al. (2018a) found a correlation between rotation and relaxation times at the half light radii, suggesting that GCs loose angular momentum via two-body interactions as they dynamically evolve (see Tiongco et al., 2017, for a theoretical modeling of this process). Due to their significantly larger sizes, in galaxies two-body relaxation timescales are longer than the age of the Universe so KDCs are expected to persist in them till the present day. Due to the short two-body relaxation time scale of the core of M15 ( Myr, Harris 1996), any ordered rotation should be quickly erased. Thus it is unlikely that the complex kinematics of centre M15 are a relic of its formation.
Beccari et al. (2019) used the same HST ACS/HRC imaging used in this work to study the blue straggler population of M15. They found evidence of multiple generations of blue stragglers formed by stellar collisions. Beccari et al. suggest that these generations of blue stragglers formed during brief periods of increased stellar density caused by core collapse and by the oscillations that occur after core collapse (e.g. Bettwieser & Sugimoto, 1984; Goodman, 1987; Cohn et al., 1989; Takahashi & Inagaki, 1991; Breen & Heggie, 2012). The complicated velocity field of the centre M15 may also be due to these post core collapse oscillations. The post core collapse model of Grabhorn et al. (1992) reproduces the observed large core radius, cuspy light profile and high central velocity peak of M15. Grabhorn et al. (1992) also find that the post core collapse oscillations only produce significant temporal variations in surface brightness and in kinematics within arcsec. This would neatly explain how the central kinematics of M15 are disconnected from the outer kinematics. Detailed dynamical modelling will be required to test whether the observed kinematics can be explained by post core collapse oscillations.
Mapelli et al. (2005) propose that a central binary with massive components (i.e. two massive stellar-mass BHs or two IMBHs) could transfer angular momentum and energy to nearby stars, causing them to co-rotate with the binary and have high velocity dispersion. These predictions are very similar to what we see in the inner few arc seconds and would also naturally explain the misalignment between the inner and outer rotation, but the collapsed core argues strongly against the presence of BH binaries of any mass (Hurley, 2007; Heggie et al., 2007; Breen & Heggie, 2013). It could be that M15 only recently ejected its last BH binary, and still shows features of the co-rotation imprinted by this binary. For this to work, angular momentum needs to be retained during core collapse and some time thereafter. Alternatively, the mechanism proposed by Mapelli et al. (2005) also works with lower mass binaries (e.g. a recently formed binary with non-BH components, such as neutrons stars or white dwarfs). Dynamical modelling is required to test these ideas and asses whether they can explain the observations.
We note that Boberg et al. (2017) discussed the case of another cluster, M53, which also exhibits strong internal rotation in its central regions with a complex radial profile and a radial variation of the position angle of the rotation axis. Their data however do not probe the innermost few arcseconds that we are able to study in M15 with MUSE, and M53 is not a core collapse cluster. Kamann et al. (2018a) also found evidence for enhanced rotation in the centre and twists in the position angle with radius in five of their 25 GCs (NGC 362, M5, M10, M15 and M62). All five of these GCs are relatively compact (King profile concentrations ) but only three (NGC 362, M15 and M62) are listed as possible core collapse GCs in the 2010 edition of the Harris (1996) catalogue.
5 Conclusion
Using the new narrow field mode of MUSE we have studied the central kinematics of the core collapse GC M15 in detail. The combination of AO delivering HST-like spatial resolution with MUSE’s large field-of-view and analysis techniques to extract spectra from crowded fields (i.e. PampelMuse) allows for a significantly larger sample of stars (864) with radial velocities compared to earlier studies with AO (Gebhardt et al., 2000, 104 stars) and HST (Gerssen et al., 2002, 64 stars). The improvements in instrumentation and analysis techniques over the last two decades are highlighted by the fact our significantly larger sample required a significantly smaller amount of telescope time (1.3 hours of exposure time) compared to previous studies (6.5 hours for Gebhardt et al. 2000; 25 HST orbits or 16.2 hours of exposure time for Gerssen et al. 2002).
We see clear evidence for complex central kinematics that are distinct from those of the outer parts of the cluster. Due to the short two-body relaxation time scale, this KDC is unlikely to have survived from the formation of M15. Nor is it likely that this KDC shares a similar merger origin to the much larger KDCs observed in some massive early-type galaxies. In a future work we will use dynamical models to fit this kinematic data set. This will allow us to explore possible hypotheses for the peculiar kinematics of this cluster, including the transfer of angular momentum from black hole binaries and post core-collapse oscillations. The dynamical models will further allow us to place strong constraints on the presence of any compact system of stellar remnants (e.g. Gieles et al., 2018; Hénault-Brunet et al., 2019; Hénault-Brunet et al., 2020).
Acknowledgements
We thank the anonymous referee for their helpful suggestions which improved the manuscript. CU acknowledges the support of the Swedish Research Council, Vetenskapsrådet. SK gratefully acknowledges funding from UKRI in the form of a Future Leaders Fellowship (grant no. MR/T022868/1) and financial support from the European Research Council (ERC-CoG-646928, Multi-Pop). MG acknowledges support from the Ministry of Science and Innovation through a Europa Excelencia grant (EUR2020-112157). VHB acknowledges the support of the Natural Sciences and Engineering Research Council of Canada (NSERC) through grant RGPIN-2020-05990. EB acknowledges financial support from a Vici grant by the Netherlands Organisation for Scientific Research (NWO).
Based on observations collected at the European Organisation for Astronomical Research in the Southern Hemisphere under ESO programme 60.A-9492(A).
Data availability
The raw MUSE data are available from the ESO archive (https://archive.eso.org/eso/eso_archive_main.html). The reduced data underlying this work is available from the authors upon reasonable request.
References
- Abolfathi et al. (2018) Abolfathi B., et al., 2018, ApJS, 235, 42
- Arsenault et al. (2012) Arsenault R., et al., 2012, ESO adaptive optics facility progress report. p. 84470J, doi:10.1117/12.926074
- Astropy Collaboration et al. (2013) Astropy Collaboration et al., 2013, A&A, 558, A33
- Bacon et al. (2010) Bacon R., et al., 2010, The MUSE second-generation VLT instrument. p. 773508, doi:10.1117/12.856027
- Balcells & Quinn (1990) Balcells M., Quinn P. J., 1990, ApJ, 361, 381
- Baumgardt & Hilker (2018) Baumgardt H., Hilker M., 2018, MNRAS, 478, 1520
- Baumgardt et al. (2003) Baumgardt H., Hut P., Makino J., McMillan S., Portegies Zwart S., 2003, ApJ, 582, L21
- Beccari et al. (2019) Beccari G., et al., 2019, ApJ, 876, 87
- Bellini et al. (2014) Bellini A., et al., 2014, ApJ, 797, 115
- Bettwieser & Sugimoto (1984) Bettwieser E., Sugimoto D., 1984, MNRAS, 208, 493
- Bianchini et al. (2013) Bianchini P., Varri A. L., Bertin G., Zocchi A., 2013, ApJ, 772, 67
- Bianchini et al. (2018) Bianchini P., van der Marel R. P., del Pino A., Watkins L. L., Bellini A., Fardal M. A., Libralato M., Sills A., 2018, MNRAS, 481, 2125
- Boberg et al. (2017) Boberg O. M., Vesperini E., Friel E. D., Tiongco M. A., Varri A. L., 2017, ApJ, 841, 114
- Bois et al. (2011) Bois M., et al., 2011, MNRAS, 416, 1654
- Breen & Heggie (2012) Breen P. G., Heggie D. C., 2012, MNRAS, 425, 2493
- Breen & Heggie (2013) Breen P. G., Heggie D. C., 2013, MNRAS, 432, 2779
- Cappellari & Copin (2003) Cappellari M., Copin Y., 2003, MNRAS, 342, 345
- Carretta et al. (2009) Carretta E., Bragaglia A., Gratton R., D’Orazi V., Lucatello S., 2009, A&A, 508, 695
- Choi et al. (2016) Choi J., Dotter A., Conroy C., Cantiello M., Paxton B., Johnson B. D., 2016, ApJ, 823, 102
- Cohn et al. (1989) Cohn H., Hut P., Wise M., 1989, ApJ, 342, 814
- Dalessandro et al. (2016) Dalessandro E., et al., 2016, ApJ, 833, 111
- Dalgleish et al. (2020) Dalgleish H., et al., 2020, MNRAS, 492, 3859
- Djorgovski & King (1986) Djorgovski S., King I. R., 1986, ApJ, 305, L61
- Dotter et al. (2010) Dotter A., et al., 2010, ApJ, 708, 698
- Ferraro et al. (2018) Ferraro F. R., et al., 2018, ApJ, 860, 50
- Foreman-Mackey (2016) Foreman-Mackey D., 2016, The Journal of Open Source Software, 24
- Foreman-Mackey et al. (2013) Foreman-Mackey D., Hogg D. W., Lang D., Goodman J., 2013, PASP, 125, 306
- Franx & Illingworth (1988) Franx M., Illingworth G. D., 1988, ApJ, 327, L55
- Gaia Collaboration et al. (2018) Gaia Collaboration et al., 2018, A&A, 616, A12
- Gebhardt et al. (1994) Gebhardt K., Pryor C., Williams T. B., Hesser J. E., 1994, AJ, 107, 2067
- Gebhardt et al. (1997) Gebhardt K., Pryor C., Williams T. B., Hesser J. E., Stetson P. B., 1997, AJ, 113, 1026
- Gebhardt et al. (2000) Gebhardt K., Pryor C., O’Connell R. D., Williams T. B., Hesser J. E., 2000, AJ, 119, 1268
- Gerssen et al. (2002) Gerssen J., van der Marel R. P., Gebhardt K., Guhathakurta P., Peterson R. C., Pryor C., 2002, AJ, 124, 3270
- Gieles et al. (2018) Gieles M., Balbinot E., Yaaqib R. I. S. M., Hénault-Brunet V., Zocchi A., Peuten M., Jonker P. G., 2018, MNRAS, 473, 4832
- Giesers et al. (2019) Giesers B., et al., 2019, A&A, 632, A3
- Goodman (1987) Goodman J., 1987, ApJ, 313, 576
- Gott (1973) Gott III R. J., 1973, ApJ, 186, 481
- Grabhorn et al. (1992) Grabhorn R. P., Cohn H. N., Lugger P. M., Murphy B. W., 1992, ApJ, 392, 86
- Harris (1996) Harris W. E., 1996, AJ, 112, 1487
- Heggie et al. (2007) Heggie D. C., Hut P., Mineshige S., Makino J., Baumgardt H., 2007, PASJ, 59, L11
- Hénault-Brunet et al. (2019) Hénault-Brunet V., Gieles M., Sollima A., Watkins L. L., Zocchi A., Claydon I., Pancino E., Baumgardt H., 2019, MNRAS, 483, 1400
- Hénault-Brunet et al. (2020) Hénault-Brunet V., Gieles M., Strader J., Peuten M., Balbinot E., Douglas K. E. K., 2020, MNRAS, 491, 113
- Hernquist & Barnes (1991) Hernquist L., Barnes J. E., 1991, Nature, 354, 210
- Hoffman et al. (2010) Hoffman L., Cox T. J., Dutta S., Hernquist L., 2010, ApJ, 723, 818
- Hunter (2007) Hunter J. D., 2007, Computing In Science & Engineering, 9, 90
- Hurley (2007) Hurley J. R., 2007, MNRAS, 379, 93
- Husser et al. (2013) Husser T. O., Wende-von Berg S., Dreizler S., Homeier D., Reiners A., Barman T., Hauschildt P. H., 2013, A&A, 553, A6
- Husser et al. (2016) Husser T.-O., et al., 2016, A&A, 588, A148
- Illingworth & King (1977) Illingworth G., King I. R., 1977, ApJ, 218, L109
- Ji & Bregman (2015) Ji J., Bregman J. N., 2015, ApJ, 807, 32
- Jones et al. (01 ) Jones E., Oliphant T., Peterson P., et al., 2001–, SciPy: Open source scientific tools for Python, http://www.scipy.org/
- Kamann et al. (2013) Kamann S., Wisotzki L., Roth M. M., 2013, A&A, 549, A71
- Kamann et al. (2014) Kamann S., Wisotzki L., Roth M. M., Gerssen J., Husser T. O., Sandin C., Weilbacher P., 2014, A&A, 566, A58
- Kamann et al. (2016) Kamann S., et al., 2016, A&A, 588, A149
- Kamann et al. (2018a) Kamann S., et al., 2018a, MNRAS, 473, 5591
- Kamann et al. (2018b) Kamann S., et al., 2018b, MNRAS, 480, 1689
- Kamann et al. (2020) Kamann S., et al., 2020, MNRAS, 492, 966
- Khoperskov et al. (2018) Khoperskov S., Mastrobuono-Battisti A., Di Matteo P., Haywood M., 2018, A&A, 620, A154
- Kimmig et al. (2015) Kimmig B., Seth A., Ivans I. I., Strader J., Caldwell N., Anderton T., Gregersen D., 2015, AJ, 149, 53
- Kormendy (1984) Kormendy J., 1984, ApJ, 287, 577
- Krajnović et al. (2011) Krajnović D., et al., 2011, MNRAS, 414, 2923
- Lane et al. (2011) Lane R. R., Kiss L. L., Lewis G. F., Ibata R. A., Siebert A., Bedding T. R., Székely P., Szabó G. M., 2011, A&A, 530, A31
- Lanzoni et al. (2013) Lanzoni B., et al., 2013, ApJ, 769, 107
- Lynden-Bell (1967) Lynden-Bell D., 1967, MNRAS, 136, 101
- Mapelli et al. (2005) Mapelli M., Colpi M., Possenti A., Sigurdsson S., 2005, MNRAS, 364, 1315
- Massari et al. (2016) Massari D., et al., 2016, A&A, 595, L2
- McNamara et al. (2003) McNamara B. J., Harrison T. E., Anderson J., 2003, ApJ, 595, 187
- Milone et al. (2012) Milone A. P., et al., 2012, A&A, 540, A16
- Murphy et al. (2011) Murphy B. W., Cohn H. N., Lugger P. M., 2011, ApJ, 732, 67
- Newell et al. (1976) Newell B., Da Costa G. S., Norris J., 1976, ApJ, 208, L55
- Pasquini et al. (2002) Pasquini L., et al., 2002, The Messenger, 110, 1
- Peterson et al. (1989) Peterson R. C., Seitzer P., Cudworth K. M., 1989, ApJ, 347, 251
- Plummer (1911) Plummer H. C., 1911, MNRAS, 71, 460
- Rigaut et al. (1998) Rigaut F., et al., 1998, PASP, 110, 152
- Sarajedini et al. (2007) Sarajedini A., et al., 2007, AJ, 133, 1658
- Sollima et al. (2019) Sollima A., Baumgardt H., Hilker M., 2019, MNRAS, 485, 1460
- Statler (1991) Statler T. S., 1991, AJ, 102, 882
- Ströbele et al. (2012) Ströbele S., et al., 2012, GALACSI system design and analysis. p. 844737, doi:10.1117/12.926110
- Takahashi & Inagaki (1991) Takahashi K., Inagaki S., 1991, PASJ, 43, 589
- Tiongco et al. (2017) Tiongco M. A., Vesperini E., Varri A. L., 2017, MNRAS, 469, 683
- VandenBerg et al. (2013) VandenBerg D. A., Brogaard K., Leaman R., Casagrande L., 2013, ApJ, 775, 134
- Vasiliev (2019) Vasiliev E., 2019, MNRAS, 489, 623
- Vogt et al. (1994) Vogt S. S., et al., 1994, HIRES: the high-resolution echelle spectrometer on the Keck 10-m Telescope. p. 362, doi:10.1117/12.176725
- Watkins et al. (2015) Watkins L. L., van der Marel R. P., Bellini A., Anderson J., 2015, ApJ, 803, 29
- Weilbacher et al. (2020) Weilbacher P. M., et al., 2020, A&A, 641, A28
- de Boer et al. (2019) de Boer T. J. L., Gieles M., Balbinot E., Hénault-Brunet V., Sollima A., Watkins L. L., Claydon I., 2019, MNRAS, 485, 4906
- den Brok et al. (2014) den Brok M., van de Ven G., van den Bosch R., Watkins L., 2014, MNRAS, 438, 487
- van den Bosch et al. (2006) van den Bosch R., de Zeeuw T., Gebhardt K., Noyola E., van de Ven G., 2006, ApJ, 641, 852
- van den Bosch et al. (2008) van den Bosch R. C. E., van de Ven G., Verolme E. K., Cappellari M., de Zeeuw P. T., 2008, MNRAS, 385, 647
- van der Walt et al. (2011) van der Walt S., Colbert S. C., Varoquaux G., 2011, Computing in Science & Engineering, 13, 22