Oscillations of the thermal conductivity observed in the spin-liquid state of -RuCl3
In the class of materials called spin liquids, a magnetically ordered state cannot be attained even at milliKelvin temperatures because of conflicting constraints on each spin (for e.g. from geometric or exchange frustration). The resulting quantum spin-liquid (QSL) state is currently of intense interest because it exhibits novel excitations as well as wave-function entanglement. The layered insulator -RuCl3 orders as a zigzag antiferromagnet below 7 K in zero magnetic field. The zigzag order is destroyed when a magnetic field is applied parallel to the zigzag axis a. Within the field interval (7.3, 11) Tesla, there is growing evidence that a QSL state exists. Here we report the observation of oscillations in its thermal conductivity below 4 K. The oscillation amplitude is very large within the interval (7.3, 11) T and strongly suppressed on either side. Paradoxically, the oscillations are periodic in 1/H, analogous to quantum oscillations in metals, even though -RuCl3 is an excellent insulator with a gap of 1.9 eV. By tilting out of the plane, we find that the oscillation period is determined by the in-plane component . As the temperature is raised above 0.5 K, the oscillation amplitude decreases exponentially. The decrease anticorrelates with the emergence above 2 K of an anomalous planar thermal Hall conductivity measured with . To exclude extrinsic artifacts, we carried out several tests. The implications of the oscillations are discussed.
The Quantum Spin Liquid (QSL), first described by Anderson Anderson , is an exotic state of matter in which the spin wave functions are highly entangled, but long-range magnetic order is absent Ng ; Savary ; WenQFT . The Kitaev honeycomb model Hamiltonian for a class of spin liquids has attracted intense interest because the exact solution of its ground state in zero magnetic field features anyonic excitations that are Majorana fermions and vortices Kitaev .
The magnetic insulator -RuCl3 is proximate to the Kitaev honeycomb model Plumb ; Sears1 ; Banerjee ; Sears2 ; Wang ; Leahy ; Banerjee2 ; Hentrich ; Lampen1 ; Lampen2 ; Balz . Interaction between the spins on Ru ions are described by the Kitaev exchange terms, e.g. where and define the spin axes Khaliullin ; Chun . Additional exchange terms and KimKee stabilize a zig-zag antiferromagnetic state below 7 K when the magnetic field =0 (Fig. 1a, inset).
In a field , the zig-zag state is suppressed when exceeds the critical field = 7.3 T. Within the field interval (7.3, 11) T, experiments Banerjee ; Balz reveal a magnetically disordered state, identified as a quantum spin liquid (QSL) in which magnons give way to very broad modes Wang ; Balz . Above 11 T, the local moments are partially field-polarized. Interest was heightened by a report Kasahara that the thermal Hall conductivity is quantized within a 2-Kelvin window (from 3.3 to 5.5 K).
Here we report measurements of both and the thermal conductivity to temperatures 0.4 K. We have uncovered oscillations in with amplitudes that are strongly peaked when lies in the interval (7.3, 11) T. Tilting reveals that the oscillation period is determined by the in-plane component . We note that, despite the similarity to Shubnikov de Haas (SdH) oscillations in metals, the free-carrier population at 1 K is exponentially suppressed by the large gap of 1.9 eV Sinn .
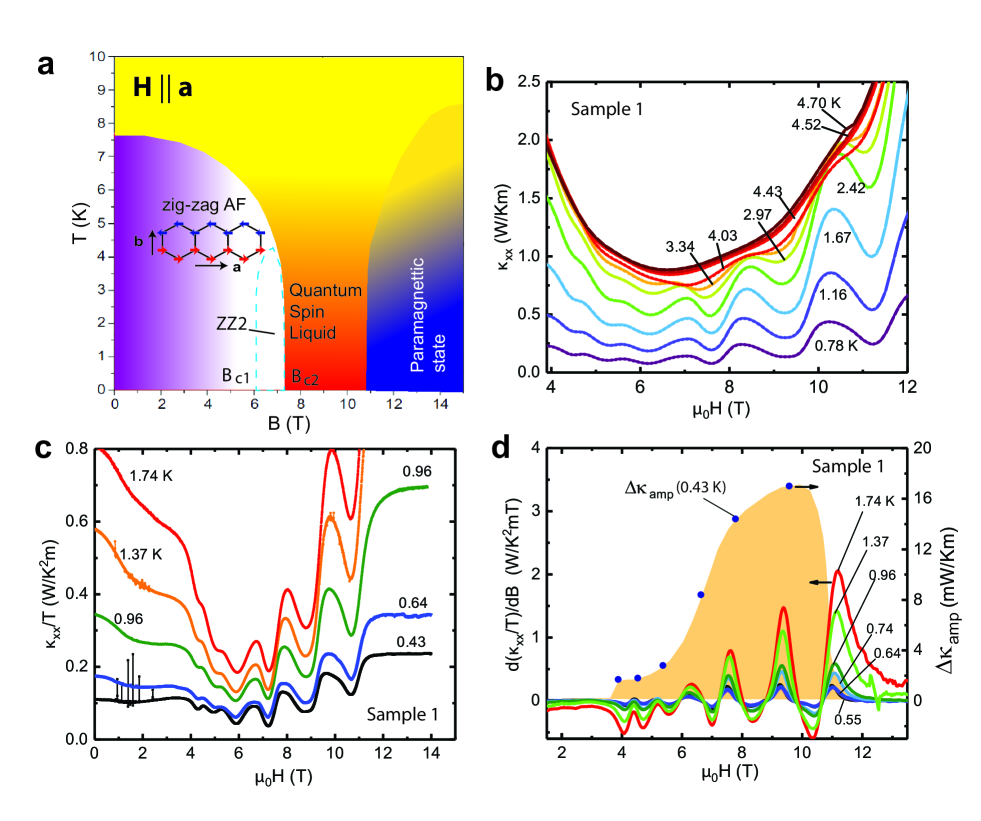
Above 2 K, we recorded using the stepped-field method both the thermal resistivity and thermal Hall resistivity as was slowly varied at fixed (Secs. A and B of Methods). As seen in Fig. 1b (for Sample 1 with ), strong oscillations emerge in . Below 2 K, the data were recorded continuously as well with the stepped-field method. The data, plotted as in Fig. 1c, show that the oscillation amplitudes continue to grow until they comprise 30-60 of at 0.43 K. At 11.5 T, displays a step-increase to a flat plateau. In the high-field partially polarized state, where is dominated by the phonon conductivity , oscillations are rigorously absent (see below and Sec. LABEL:phonons in Methods). Similar curves are observed in Sample 3 (Fig. LABEL:figS3a in Methods).
The oscillation amplitudes are strongly peaked in the QSL state. To extract the amplitude, we first determined the smooth background curve threading the midpoints between adjacent extrema (Fig. LABEL:figS2d in Methods). The oscillatory component, defined as (Fig. LABEL:figS2c in Methods), allowed accurate determination of the amplitude , which we plot in Fig. 1d for Sample 1 (solid circles). Above 6 T, rises steeply to peak at 9.6 T, followed by an abrupt collapse to zero above 11 T. Below 6 T, a weak remnant “tail” survives to 4 T in a mixed state in which small QSL regions coexist with the zig-zag state (we note that 4 T is roughly where the averaged zig-zag Bragg intensity begins to weaken with Banerjee2 ). By its profile, is largest within the field interval (7.3, 11.5 T) of the QSL state. The profile in Sample 3 is similar (Fig. LABEL:figS3a of Methods). A fourth sample 4 did not exhibit oscillations with tilted at 45 to (Table in Methods).
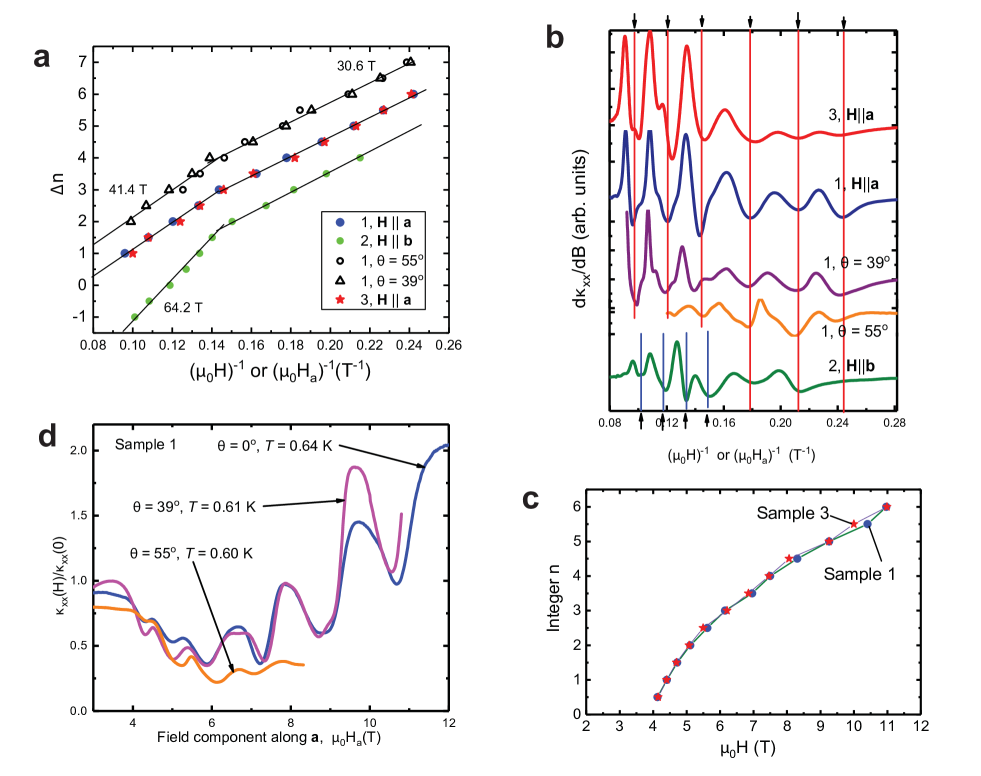
We next show that the oscillations are periodic in . Figure 2a displays plots of the integer increment vs. , where are fields locating extrema of plotted in Fig. 2b. We focus first on data shown as solid symbols. The data from Samples 1 (blue circles) and 3 (red stars), measured with , fall on a curve comprised of straight-line segments separated by a break-in-slope at 7 T. The slopes of the straight segments are 41.4 T (7 T) and 30.6 T (7 T). When (Sample 2, green circles), similar behavior is obtained, with the low-field slope also at 30.6 T. However, the high-field slope is steeper with = 64.2 T. As shown in Figs. 1b and c, the periods are independent from 0.43 to 4.5 K.
Taken together, the data shown in Figs. 2a to 2d provide strong evidence that the oscillations are intrinsic and reproducible across samples. The five data sets discussed in Panel a were derived from extrema of the derivative curves displayed in Figs. 2b. The profiles show the close agreement in both period and phase between Samples 1 and 3. The matching of the extrema is especially evident in Fig. 2c, which also shows that periodicity vs. (as opposed to ) can be excluded. In Sample 2 the period and phase also agree with 1 and 3 for 7 T (the period is shorter above 7 T, as already noted).
Oscillations observed with tilted in the - plane (at an angle to ) provide tests in an independent direction. Figure 2c shows curves of measured in Sample 1 with (blue curve), 39∘ (purple) and 55∘ (orange) (curves of at various are in Figs. LABEL:figS4a and LABEL:figS4b). By plotting the curves vs. , we find that the periods match quite well (with a possible phase shift for the curve at 55∘). The corresponding derivatives at 39∘ and 55∘ are plotted in Panel (b). We infer that, in tilted , the periods depend only on . Moreover, the close matching of the blue and purple curves strongly supports an intrinsic origin.
In Sec. LABEL:Strain in Methods, we discuss the relation of the oscillations to de Haas van Alphen experiments on the correlated insulator SmB6 Sebastian . For the proposed mechanism Cooper ; FaWang to apply to -RuCl3, we would need 10,000 T. We also elaborate further on the evidence against artifactual origins, such as stacking faults produced by field-induced strain Kubota ; Cao .
The profile of vs. actually imposes a tight constraint on possible mechanisms. Above 11.5 T in the polarized state, the oscillations vanish abruptly. Below the oscillations survive as a weak tail extending to 4 T in the zig-zag state. The amplitude profile suggests a close connection to the QSL state. The periodicity suggests an intriguing analogy with Shubnikov de Haas oscillations, despite the absence of free carriers. We note that Landau-level oscillations have been predicted in the insulating 2D QSL state with normal to the plane Motrunich ; Senthil . A spinon Fermi surface in the QSL state of -RuCl3 is widely anticipated Normand ; Trivedi ; Fujimoto . Our finding that is determined by suggests either a fully 3D QSL state (or possibly a different mechanism). Nonetheless, quantization of a spin Fermi surface is currently our leading interpretation.
The amplitude is much larger in Sample 3 than in 1 (from Figs. LABEL:figS3a and 1d, the peak values are 100 and 16.5 mW/Km, respectively). We have uncovered a correlation with lattice disorder, as estimated from (see Sec. LABEL:phonons). In the QSL state, it is difficult to separate reliably the phonon term from the spin-excitation conductivity because of strong spin-phonon coupling (which causes oscillations in both). However, in the polarized state above 11.5 T, is strongly dominated by (the profile becomes independent). Hence the plateau value of measures reliably the lattice disorder. At 1.0 K, is much higher in Sample 3 (2.2 W/mK2) than in 1 (0.7 W/mK2). The lower disorder in Sample 3 correlates with a 6-fold increase in the oscillation amplitude.
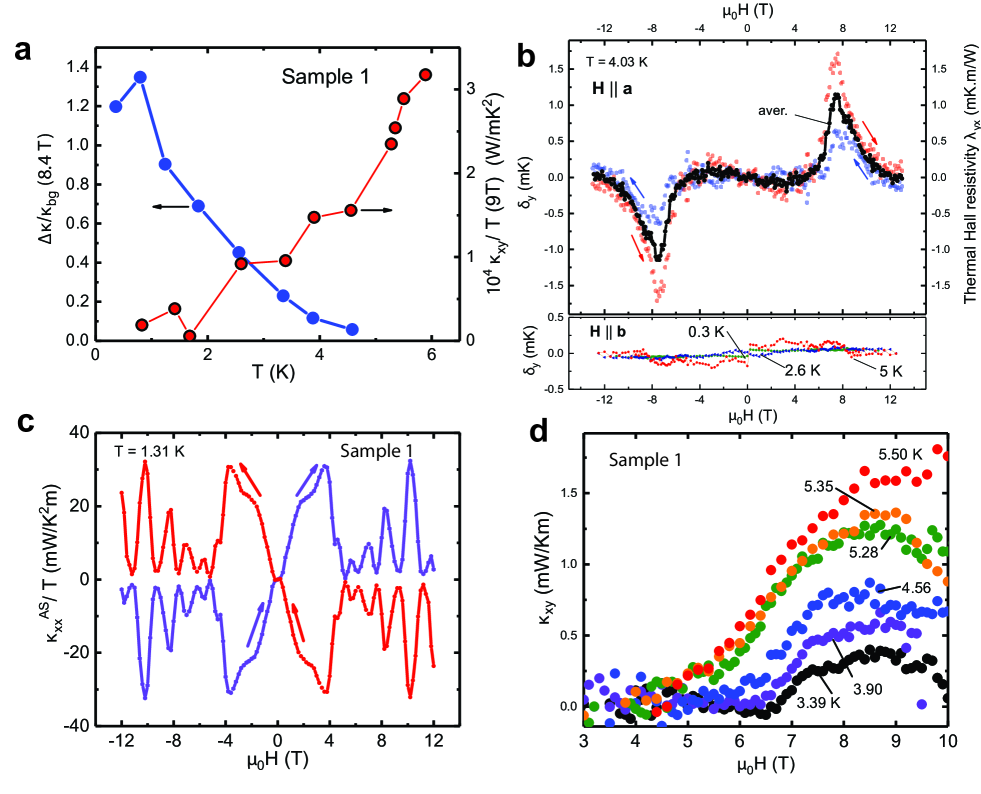
The observed status of seems empirically related to the planar thermal Hall effect (PTHE), which appears only with . At a fixed , the ratio decays with at a rate consistent with an effective mass where is the free electron mass (blue circles in Fig. 3a). The decay in is accompanied by a rapid growth in the PTHE observed with (red circles). Recently, Yokoi et al. Yokoi reported that measured with seems to be quantized, within a narrow interval in (3.8-6 K) and and in ( T). We have extended the PTHE experiment down to = 300 mK to gain a broader perspective.
Below 4 K, it is necessary to use the method described in Eqs. LABEL:DyT–LABEL:intrinsic in Methods Hirschberger to isolate the intrinsic thermal Hall signal (defined in Eq. LABEL:DyT) from artifacts arising from hystereses in as shown for e.g. in Fig. 3c. For , the intrinsic thermal Hall signal is found to be zero for T and 0.3 5 K (Fig. 3b, lower panel). However, with , a finite emerges above 2 K, as shown in upper panel of Fig. 3b. The antisymmetry of with respect to identifies it as a true PTHE. This is the thermal-conductivity analog of the true planar anomalous Hall effect observed in ZrTe5 Liang .
Inverting the matrix to obtain , we find that displays a dome profile that grows with in the QSL phase (Fig. 3d). Together, Figs. 3a and 3d provide a broad view of how the PTHE varies with . While the trends of our are consistent with those in Ref. Yokoi (e.g. the PTHE exists only with ), we note that the strong dependence evident in Figs. 2d seems difficult to reconcile with a quantized value occuring in the interval 3.8 – 6 K. Where the two data sets overlap (4-5 K), our magnitudes are much smaller ( 0.3 vs. 0.8 mW/K2m at = 5 K).
In summary, we have observed quantum oscillations in in -RuCl3 with in plane. The prominence of the amplitude in the interval (7.3, 11) T implies that they are specific to the QSL state.
References
- (1) Anderson, P. W. Resonating valence bonds: a new kind of insulator? Mater. Res. Bull. 8, 153 (1973).
- (2) Zhou, Y., Kanoda, K. Ng, T.K. Quantum spin liquid states, Rev. Mod. Phys. 89, 025003 (2017).
- (3) Savary, L. Balents, L., Quantum spin liquids: a review, Rep. Prog. Phys. 80, 106502 (2017).
- (4) Wen, X.G., Quantum Field Theory of Many-Body Systems, Oxford Univ. Press (2004), Ch. 9.
- (5) Kitaev, A., Anyons in an exactly solved model and beyond, Ann. Phys. 321, 2-111 (2006).
- (6) Plumb, K. W. et al., -RuCl3: a spin-orbit assisted Mott Insulator on a honeycomb lattice. Phys. Rev. B 90, 041112 (2014).
- (7) Sears, J. A. et al., Magnetic order in -RuCl3: A honeycomb-lattice quantum magnet with strong spin-orbit coupling. Phys. Rev. B 91, 144420 (2015).
- (8) Banerjee, A. et al., Proximate Kitaev quantum spin liquid behavior in a honeycomb magnet. Nat. Mater. 15, 733-740 (2016).
- (9) Sears, J. A. et al., Phase diagram of -RuCl3 in an in-plane magnetic field. Phys. Rev. B 95, 180411 (2017).
- (10) Wang, Z. et al., Magnetic Excitations and Continuum of a Possibly Field-Induced Quantum Spin Liquid in -RuCl3. Phys. Rev. Lett. 119, 227202 (2017).
- (11) Leahy. I. A. et al., Anomalous thermal conductivity and magnetic torque response in the honeycomb magnet -RuCl3, Phys. Rev. Lett. 118, 187203 (2017).
- (12) Banerjee, A. et al., Excitations in the field-induced quantum spin liquid state of -RuCl3. npj Quantum Materials (2018) 3:8 ; doi:10.1038/s41535-018-0079-2
- (13) Hentrich, R. et al., Unusual phonon heat transport in -RuCl3: Strong spin-phonon scattering and field-induced spin gap. Phys. Rev. Lett. 120, 117204 (2018).
- (14) Lampen-Kelley , P. et al., Anisotropic susceptibilities in the honeycomb Kitaev system -RuCl3. Phys. Rev. B 98, 100403 (2018).
- (15) Lampen-Kelley, P. et al., Field-induced intermediate phase in -RuCl3: Non-coplanar order, phase diagram, and proximate spin liquid, cond-mat arXiv:1807.06192v1
- (16) Balz, C. et al., Finite field regime for a quantum spin liquid in -RuCl3. Phys. Rev. B 100, 060405(R) (2019).
- (17) Jackeli, G. Khaliullin, G., Mott Insulators in the Strong Spin-Orbit Coupling Limit: From Heisenberg to a Quantum Compass and Kitaev Models, Phys. Rev. Lett. 102, 017205 (2009).
- (18) Chun, S.W. et al., Direct evidence for dominant bond-directional interactions in a honeycomb lattice iridate Na2IrO3, Nature Physics 11, 462 (2015).
- (19) Kim, H. S. Kee, H. Y., Crystal structure and magnetism in -RuCl3: An ab initio study, Phys. Rev. B 93, 155143 (2016).
- (20) Kasahara, Y. et al., Majorana quantization and half-integer thermal quantum hall effect in a Kitaev spin liquid. Nature 559, 227-231 (2018).
- (21) Sinn, S. et al., Electronic Structure of the Kitaev Material -RuCl3 Probed by Photoemission and Inverse Photoemission Spectroscopies. Sci. Rep. , 39544; doi: 10.1038/srep39544 (2016).
- (22) Tan, B.S. et al., Unconventional Fermi surface in an insulating state, Science 349, 287 (2015). DOI: 10.1126/science.aaa7974
- (23) Johannes Knolle and Nigel R. Cooper, Quantum Oscillations without a Fermi Surface and the Anomalous de Haas–van Alphen Effect, Phys. Rev. Lett. 115, 146401 (2015). DOI: 10.1103/PhysRevLett.115.146401
- (24) Long Zhang, Xue-Yang Song, and Fa Wang, Quantum Oscillation in Narrow-Gap Topological Insulators, Phys. Rev. Lett. 116, 046404 (2016). DOI: 10.1103/PhysRevLett.116.046404
- (25) Yumi Kubota, Hidekazu Tanaka, Toshio Ono, Yasuo Narumi, and Koichi Kindo, Successive magnetic phase transitions in -RuCl3: XY-like frustrated magnet on the honeycomb lattice, Phys. Rev. B 91, 094422 (2015). DOI: 10.1103/PhysRevB.91.094422
- (26) H. B. Cao, A. Banerjee, J.-Q. Yan, C. A. Bridges, M. D. Lumsden, D. G. Mandrus, D. A. Tennant, B. C. Chakoumakos, and S. E. Nagler, Low-temperature crystal and magnetic structure of -RuCl3, Phys. Rev. B 93, 134423 (2016). DOI: 10.1103/PhysRevB.93.134423
- (27) Motrunich, O.I., Orbital magnetic field effects in spin liquid with spinon Fermi sea: Possible application to -(ET)2Cu2(CN)3, Phys. Rev. B 73, 155115 (2006). DOI: 10.1103/PhysRevB.73.155115
- (28) Sodemann, I., Chowdhury, D. Senthil, T., Quantum oscillations in insulators with neutral Fermi surfaces, Phys. Rev. B 97, 045152 (2018). DOI: 10.1103/PhysRevB.97.045152
- (29) Liu, Z. X. Normand, B., Dirac and Chiral Quantum Spin Liquids on the Honeycomb Lattice in a Magnetic Field, Phys. Rev. Lett. 120, 187201 (2018).
- (30) Patel, N. D. Trivedi, N., Magnetic field-induced intermediate quantum spiin liquid with a spinon Fermi surface, PNAS 116, 12199 (2019).
- (31) Takikawa, D. Fujimoto, S., Impact of off-diagonal exchange interactions on the Kitaev spin-liquid state of -RuCl3, Phys. Rev. B 99, 224409 (2019).
- (32) Yokoi, T. et al., Half-integer quantized thermal Hall effect in the Kitaev material -RuCl3. cond-mat arXiv: 2001.01899v1.
- (33) Hirschberger, M. Quasiparticle excitations with Berry Curvature in insulating magnets and Weyl semimetals (PhD thesis, Princeton University 2017).
- (34) Liang, T. et al.., Anomalous Hall effect in ZrTe5, Nat. Phys. 14, 451-455 (2018). doi.org/10.1038/s41567-018-0078-z
* * *
∗P.C. and T.G. contributed equally to the experiment.
§Corresponding author email: npo@princeton.edu
†Current address of M.H.: Department of Applied Physics and Quantum-Phase Electronics Center (QPEC), The University of Tokyo, Bunkyo-ku, Tokyo, 113-8656, Japan.
‡A.B. is also affiliated with the Department of Physics, Purdue University, West Lafayette, IN 47907, USA.
Acknowledgements
We thank Jingjing Lin and Stephan Kim for technical assistance and T. Senthil and I. Sodemann for valuable discussions. The measurements of and P.C. and M.H. were supported by a MRSEC award from the U.S. National Science Foundation (DMR 1420541). T.G. and the low- thermal Hall experiments were supported by the U.S. Department of Energy (DE-SC0017863). A.B. and S.E.N are supported by the DOE, Office of Science, Scientific User Facilities Division. N.P.O. was supported by the Gordon and Betty Moore Foundation’s EPiQS initiative through grant GBMF4539. P.L-K. and D.M. were supported by Moore Foundation’s EPiQS initiative through grant GBMF4416.
Author contributions
P.C. and T.G. performed the measurements and analyzed the data together with N.P.O. who proposed the experiment. M.H. greatly enhanced the experimental technique employed. A.B., P.L-K. and S.E.N. provided guidance on prior results. Crystals were grown at ORNL by P.L-K., J.Y. and D.M. at ORNL. The manuscript was written by N.P.O., P.C. and T.G.
Additional Information
Supplementary information is available in the online version of the paper.
Correspondence and requests for materials should be addressed to N.P.O.
Reprints and permissions information is available at www.nature.com/reprints.
Competing financial interests
The authors declare no competing financial interests.
Figure Captions
Figure 1: Quantum oscillations in the quantum spin liquid (QSL) phase in -RuCl3 (Sample 1). Panel (a): The phase diagram showing the QSL phase sandwiched between the zig-zag and polarized states with (axes and shown in inset). The ZZ2 phase lying between critical fields and is outlined by the dashed curve Balz . Panel (b) shows the emergence of oscillations in () as falls below 4 K. Data recorded using the stepped-field technique to correct for magnto-caloric effects (Sec. B in Methods). Panel (c) displays the oscillations over the full field range at selected (data recorded continuously as well as with stepped-field method). At 11 T, displays a step-increase to a plateau-like profile in the polarized state in which oscillations are strictly absent. The amplitude (solid circles in Panel (d)) is strikingly prominent in the QSL state. Its profile (shaded orange) distinguishes the QSL from adjacent phases. A weak remnant tail extends below 7 T to 4 T in the zig-zag state. The derivative curves show that the oscillations onset abruptly at 4 T. The large derivative peak centered at 11.3 T corresponds to the step-increase in mentioned, and is not part of the oscillation sequence.
Figure 2: Periodicity and intrinsic nature of oscillations (panels labelled clockwise). Panel (a) plots the integer increment versus (or ) where are the fields identifying extrema of the derivative curves ( for tilted ). Solid symbols represent data taken with strictly in-plane. The blue circles (Sample 1) and red stars (Sample 3) were measured with , whereas the green circles were measured in Sample 2 with . Open symbols are measurements in Sample 1 with tilted in the - plane at angles = (triangles) and (circles), relative to . The data sets fall on the same segmented curve (comprised of line segments with slope 31 T below 7 T and 41 T above 7 T). The exception is the high-field slope of 64 T in Sample 2 with . For clarity, the 3 data sets are shifted vertically by . Panel (b): Curves of the derivative vs. (or ) for Samples 1, 2 and 3 (). For Sample 1, we show measured with and . The extrema of are plotted in Panel (a). Vertical lines mark the values of and read off from the straight-line fits in Panel (a) for integer increments . Panel (c): Replot of integer increment vs. (fields locating the extrema of ) in Samples 1 (blue circles) and 3 (red stars) to check for periodicity vs. (as opposed to ). In both data sets (measured with ), the curve diverges to large negative as decreases to 4 T. The narrowing of the spacing between adjacent extrema is strongly incompatible with periodicity vs. . Panel (d) shows the effect of tilting out of the plane in Sample 1 by angle (relative to ) at 0.6 K. The curves are measured with (blue), (purple) and (orange). When they are plotted vs. , the periods of the oscillations in match well for the 3 angles.
Figure 3: The planar thermal Hall response. Panel (a) The dependence of at 8.4 T (blue circles) and the planar thermal Hall conductivity at 9 T (red). The decrease of with (consistent with an effective mass = 0.64) is anti-correlated with the increase in . Panel (b) shows the emergence of the PTHE signal with (upper panel). At = 4.03 K, in Sample 1 (left axis) displays sharp peaks that are antisymmetric in for (black circles). Corresponding values of are on the right axis. The lower panel shows the null thermal Hall resistivity (expressed as the thermal Hall signal ) measured with at 0.3, 2.6 and 5 K in Sample 2. The total uncertainty in is 0.3 mK. Panel (c) shows the hysteresis in that can contaminate if not properly subtracted. The right-going (purple) and left-going (red) scans have been antisymmetrized with respect to . In Panel (d), derived from the measured tensor are plotted for several from 3.4 to 5.5 K. The dome-shaped profiles are the planar thermal Hall effect reported in Ref. Yokoi but in our experiment the values are not quantized.