Time-lag between disk and corona radiation leads to hysteresis effect observed in black hole X-ray binary MAXI J1348-630
Abstract
Accretion is an essential physical process in black hole X-ray binaries (BHXRBs) and active galactic nuclei. The properties of accretion flows and their radiation were originally considered to be uniquely determined by the mass accretion rate of the disk; however, the “hysteresis effect” observed during outbursts of nearly all BHXRBs seriously challenges this paradigm. The hysteresis effect is referred to that the hard-to-soft state transition in the fast-rise stage occurs at much higher luminosity than the soft-to-hard state transition in the slow-decay stage. That is, the same source can show different spectral/temporal properties at the same luminosity. Phenomenologically, this effect is also represented as the so-called “q”-shaped hardness-intensity diagram, which has been proposed as a unified scene for BHXRBs. However, there is still a lack of quantitative theoretical interpretation and observational understanding of the “q”-diagram. Here, we present a detailed time-lag analysis of a recently found BHXRB, MAXI J1348-630, intensively monitored by Insight-HXMT over a broad energy band (1–150 keV). We find the first observational evidence that the observed time-lag between radiations of the accretion disk and the corona leads naturally to the hysteresis effect and the “q”-diagram. Moreover, complemented by the quasi-simultaneous Swift data, we achieve a panorama of the accretion flow: the hard X-ray outburst from the corona heats and subsequently induces the optical brightening in the outer disk with nearly no lag; thereafter, the enhanced accretion in the outer disk propagates inward, generating the delayed soft X-ray outburst at the viscous timescale of days.
1 Introduction
Black hole X-ray binaries (BHXRBs) are systems in which a black hole accretes material from the companion star via the Roche-lobe overflows. The infalling gas forms an accretion disk, where the angular momentum transfers outward and the matter diffuses toward the central compact object through viscous interaction (for reviews, see Frank et al., 2002; Done et al., 2007). The gravitational energy turns into electromagnetic radiation, mostly in the X-ray band. BHXRBs generally stay at very faint quiescent state for most of their lifetime, but they may enter into outbursts with luminosity increased by several orders of magnitude within a few days, and then decay on a timescale of a few months (e.g., Remillard & McClintock, 2006; Corral-Santana et al., 2016). Additionally, BHXRBs can be bright in the optical and radio bands arising from the outer accretion disk and jet, respectively (e.g., van Paradijs & McClintock, 1994; Gallo et al., 2003; Russell et al., 2006; Rykoff et al., 2007).
The transient behavior of BHXRBs is generally considered as the result of the thermal-viscous instability propagating in the accretion disk (e.g., Chen et al., 1997; Dubus et al., 2001; Coriat et al., 2012). The disk instability model (DIM) provides a basic framework; meanwhile, the accretion disk truncation and X-ray irradiation should be involved to reproduce the global properties of BHXRB outbursts (for reviews, see Lasota, 2001; Hameury, 2020). Irradiation plays a crucial role in BHXRBs, provides additional heating, affects the thermal equilibrium, and stabilizes the disk (e.g., Dubus et al., 2001). In addition to the “fast-rise slow-decay” type light curve, the irradiation theory predicts a scaling relation between the optical luminosity, , and X-ray luminosity, , (i.e., ; van Paradijs & McClintock, 1994), which has been confirmed in some BHXRBs (e.g., King & Ritter, 1998; Russell et al., 2006; Rykoff et al., 2007). It is worth noting that, with some modifications, the irradiation scenario likely operates in active galactic nuclei (AGNs) as well (e.g., Krolik et al. 1991; Cackett et al. 2007; Edelson et al. 2015; however, see Zhu et al. 2018; Cai et al. 2018, 2020).
The properties of accretion flows and their radiation are generally considered to be a monotonic function of the mass accretion rate of the disk (Esin et al., 1997; Yuan & Narayan, 2014). The terminologies of the “high/soft” and “low/hard” states are widely used in literature (e.g., Remillard & McClintock, 2006; Done et al., 2007). However, this oversimplified assumption is challenged by the discovery of the “hysteresis effect” in nearly all BHXRBs; that is, apparently similar spectral state transitions take place at very different luminosities during an outburst cycle (e.g., Maccarone & Coppi, 2003). Therefore, it directly leads to the “q”-shaped hardness-intensity diagram (HID), which has been proposed as a unified scheme for BHXRBs (Fender et al., 2004; Belloni, 2010). High signal-to-noise ratio data show that there is no strict one-to-one correlation between the spectral/temporal parameters and the X-ray luminosity (e.g., Remillard & McClintock, 2006). Therefore, instead of solely using the X-ray luminosity, currently the accretion states of BHXRBs are explicitly defined by their spectral and the temporal properties. Many different properties of the accretion flow have been suspected to be responsible for the hysteresis effect, e.g., the size of corona (Homan et al., 2001), the mass of accretion disk (Yu & Dolence, 2007), the history of truncated disk radius (Zdziarski et al., 2004), and the hydrogen ionization instability (Done et al., 2007). However, none of these models can fully account for the hysteresis effect and the “q”-shaped HID.
MAXI J1348-630 was first discovered by MAXI on 2019 January 26 due to its X-ray outburst. Soon afterward Insight-HXMT, Swift, NICER, and INTEGRAL performed target-of-opportunity (ToO) observations to monitor the outburst and the subsequent re-flares (e.g., Chen et al., 2019; Bassi et al., 2019; Lepingwell et al., 2019; Sanna et al., 2019). Several groups had also carried out optical and radio observations (e.g., Carotenuto et al., 2019; Charles et al., 2019; Russell et al., 2019a, b). The spectral/temporal properties of MAXI J1348-630, including the “q”-shaped HID (e.g., Tominaga et al., 2020), the low-frequency quasi-periodic oscillations evolving with the spectral states (Jana et al., 2020; Belloni et al., 2020; Zhang et al., 2020a), and the radio flare occurred at the state transition (Carotenuto et al., 2019), are all well consistent with those of the classical BHXRBs. Taking advantage of the broadband coverage of Insight-HXMT and Swift on MAXI J1348-630, we aim to investigate the mechanism for the hysteresis behavior and the scaling relations, and test the reprocessing scenario. The Insight-HXMT and Swift data reduction is described in the next section, and the results are presented in Section 3. Discussion and conclusions follow in Section 4.
2 Data reduction
MAXI J1348-630 entered into an outburst in 2019 January, then decayed for months, and then re-brightened twice in the second half of 2019. In this work, we focus on the primary outburst, which was better sampled by both Insight-HXMT and Swift.
2.1 Swift light curves
The Neil Gehrel Swift Observatory is a rapid response multi-wavelength satellite with three main instruments on board: the Burst Alert Telescope, the X-ray Telescope (XRT), and the UV/Optical Telescope (UVOT; Gehrels et al., 2004). It carried out 34 pointings to monitor the primary outburst of MAXI J1348-630. We process both the XRT and UVOT data with the packages and tools available in heasoft version 6.27. Around the peak of the outburst, the observed XRT count rates are more than 1000 cts/s, which are much higher than the normal count rate of the instrument ( cts/s for the window-timing mode222https://www.swift.ac.uk/analysis/xrt/xrtpileup.php). Technically, a large bright center region should be excluded to handle the significant pile-up effect, and there remains only a small number of photons. Thus, the XRT data are not suitable for the following energy-dependent time-lag estimation.
In this work, we only use the UVOT data that were taken in the image mode. For each observation, we stack the images when there is more than one exposure in order to increase photon statistics. The counts are converted to the flux densities with source aperture radius of 5 arcseconds in the stacked images using the task uvotsource, and a larger neighboring source free sky region is adopted for estimating the background. The Galactic extinction in the direction of MAXI J1348-630 is heavy ( and ; Schlafly & Finkbeiner, 2011), while the neutral column density inferred from its X-ray spectrum also indicates a moderate extinction for the source (; Russell et al., 2019b). Consequently, most of near-ultraviolet emissions are absorbed, resulting in only 17/15/22/20/0/5 detections for the V/B/U/UW1/UM2/UW2 bands, respectively. Therefore, we only consider the V/B/U/UW1 flux densities333Throughout this Letter, we use the term “optical emission” to include also the UW1 flux. and their relationship to the Insight-HXMT data.
2.2 Insight-HXMT data analysis
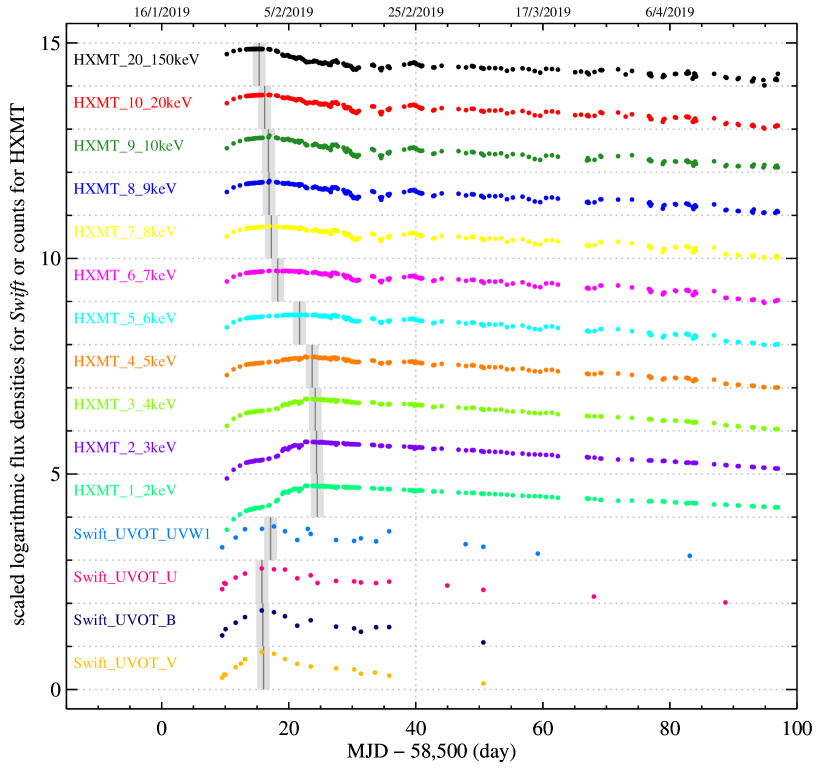
Insight-HXMT, launched on 2017 June 15, is the first X-ray astronomy satellite of China. It consists of three scientific instruments: the High Energy X-ray telescope (HE, 20–250 keV), the Medium Energy X-ray telescope (ME, 5–30 keV), and the Low Energy X-ray telescope (LE, 1–15 keV; Zhang et al., 2020b). The Insight-HXMT ToO observations started on 2019 January 27 (Chen et al., 2019) and ended on 2019 April 27. All data are reduced with the hxmtdas v2.01, and the initial event cleaning is performed with the standard quality cuts: (1) pointing offset angle ; (2) elevation angle ; (3) value of the geomagnetic cutoff rigidity ; (4) the time after and to next SAA s. The background is estimated using the tasks LEBKGMAP, MEBKGMAP, and HEBKGMAP in the hxmtdas software. Thanks to the large effective area, Insight-HXMT can accumulate enough photons without the pile-up effect in an individual observation. Nine LE light curves are constructed from 1 keV to 10 keV in bins of 1 keV, and count rates are averaged for each individual observation. Meanwhile, the light curves in 10–20 keV and 20–150 keV are extracted from the ME and HE data, respectively (Figure 1).
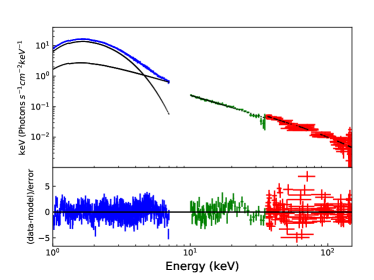
Broadband coverage of Insight-HXMT is helpful in resolving different spectral components. The spectra of Insight-HXMT throughout the whole outburst can be fit by an absorbed disk blackbody plus a cutoff power-law model, i.e. tbabs*(diskbb+cutoffpl) in xspec (Arnaud, 1996). More detailed spectral investigation will be presented in Zhang Wei et al. (2021, submitted to ApJ). Figure 2 shows an example spectrum in the soft state on 2019 March 8, with the best-fit parameters and errors in 90% confidence level of keV, , and keV. Our Insight-HXMT spectral fitting results are similar to those obtained with NICER (Zhang et al., 2020a). The unabsorbed thermal and cutoff power-law fluxes are calculated in 1–10 keV with the convolution model cflux.
3 Results
3.1 Energy-dependent time-lag estimation
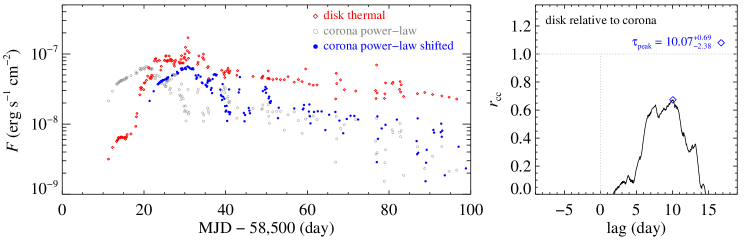
The X-ray properties of MAXI J1348-630 are consistent with those of the classical BHXRBs (Tominaga et al., 2020; Jana et al., 2020; Belloni et al., 2020; Zhang et al., 2020a). Visually, multi-band light curves of the outburst exhibit a “fast-rise slow-decay” profile, and the soft X-ray flux reached the maximum several days after the hard X-ray one, as shown in Figure 1. Since the Insight-HXMT ToO observations have much better sampling than the Swift/UVOT data, we quantitatively estimate the time-lag of all light curves relative to the Insight-HXMT/HE light curve in two ways. First, in order to avoid possible anomalous fluctuations, we employ a fourth-order polynomial fit to the peak four days before and after the maximum (the gray solid vertical lines in Figure 1). Note that the estimated peak epochs only varies slightly, days, if a third- or fifth-order polynomial is used.
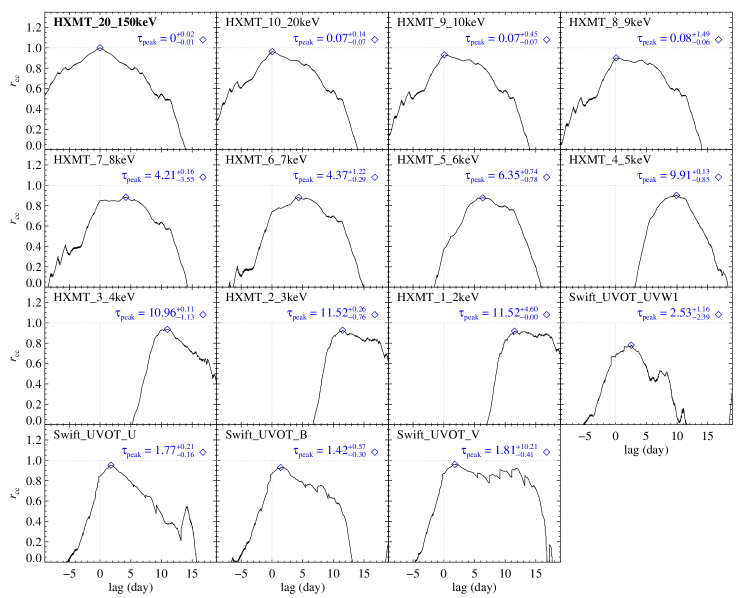
Second, we also estimate the lags of these light curves relative to the HE light curve using the linearly interpolated cross-correlation method (e.g., Peterson et al., 1998; Sun et al., 2018; Cai et al., 2020). Figure 3 shows the corresponding cross-correlation functions with the peak lag, , labled as blue diamonds. The 10-90th percentile uncertainties of are inferred from simulated light curves using the flux randomization/random subset selection method, wherein realizations of both light curves with flux measurements are adjusted by random Gaussian fluctuations scaled to the measurement uncertainties. Note that in applying a random subset selection for a light curve, a part of the initial epochs, , would be omitted. Since the Swift light curves are very sparse with only epochs, the random subset selection would not be performed when estimating the uncertainties of their lags relative to the HE light curve.
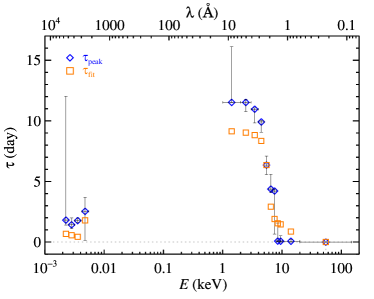
Relative to the HE light curve, the peak lag, , as a function of energy is illustrated in Figure 4, where inferred from the polynomial fit is also shown for comparison. Bi-modality of the lag-energy relation is obvious: hard X-rays above around 6 keV and optical emission are synchronized with negligible lags, but soft X-rays below about 6 keV lag behind by about 8-12 days. These results indicate that the soft component does not change in lockstep with the hard X-ray emission. The time-lag, days, between the thermal and the power-law emissions is measured with the linearly interpolated cross-correlation method as well (Figure 5). This value is consistent with those directly inferred from the multi-wavelength light curves illustrated in Figure 4.
3.2 Scaling relations
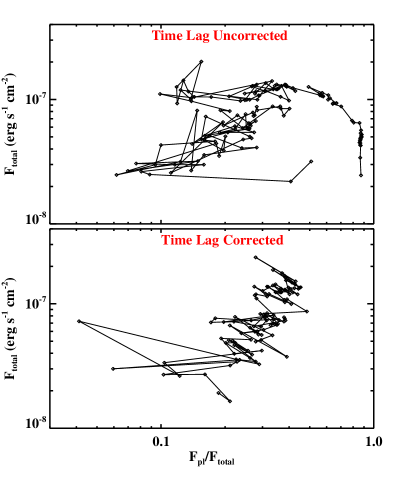
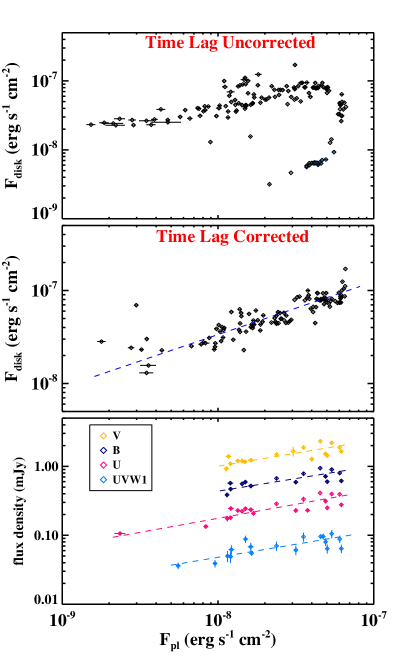
In order to compare the scaling relations found in other BHXRBs, we calculate the unabsorbed flux densities in the energy range of 1–10 keV, which is similar to those used in literature (e.g., Russell et al., 2006; Rykoff et al., 2007). The “q”-shaped HID pattern is reproduced in the top panel of Figure 6, where the hardness is defined as the ratio of the nonthermal power-law flux, , to the total flux, (e.g., Dunn et al., 2010). However, when the time-lag effect has been corrected by shifting the disk flux backward (or power-law flux forward) in time by 10 days and then recalculating the total flux, the hysteresis behavior is eliminated from the “q”-shaped HID (Figure 6), and the thermal flux monotonically increases with the power-law flux, as shown in the middle panel of Figure 7. The correlation is fit with the power-law function with bces (Akritas & Bershady, 1996): , where is a constant and parameter is the slope of the correlation. In this way, both 1 errors of and are considered in the fitting, and is derived.
We fit the optical and the power-law flux correlation with the same methodology, and obtain the slopes , , , and , for the V, B, U, and UW1 bands, respectively. The values of these parameters are significantly smaller than the value () given in the jet scenario (Gallo et al., 2003; Heinz & Sunyaev, 2003), and are consistent with (or slightly smaller than) the value of 0.5 predicted by the reprocessing theory (van Paradijs & McClintock, 1994; Russell et al., 2006).
4 Discussion and Conclusion
The 2019 January outburst of MAXI J1348-630, in particular its rise stage, was well traced by Insight-HXMT and Swift covering visible, UV, soft X-ray, and hard X-ray bands. In this work, we investigate the broadband monitoring data of MAXI J1348-630 and have obtained the main results as follows: bi-modality of lag-energy relation (Figure 4); elimination of the hysteresis behavior from the HID by taking the time-lag effect into account (Figure 6); and the linear correlation between the power-law flux and the optical emission (Figure 7).
The optical emissions from BHXRBs in their low-luminosity state can have contributions by the companion star, the jet, or viscously heated disk, resulting in different correlations between the X-ray and optical emissions (Russell et al., 2006; Weng & Zhang, 2015). In contrast, the reprocessing of X-rays is dominant at optical wavelengths in the high-luminosity state (e.g., van Paradijs & McClintock, 1994). Rykoff et al. (2007) revealed the strong relationship between the optical and the X-ray radiations during the 2006 outburst of XTE J1817-330, and provided strong evidence to the irradiation scenario. They further pointed out that the optical emission closely tracked the power-law flux and did not track the disk flux. However, the fast-rise of the outburst was missed, and the Swift data only covered the monotonic decline of its 2006 outburst. For MAXI J1348-630, because the rise stage of its 2019 January outburst was caught by both Swift and Insight-HXMT, we can firmly rule out the direct correlation between the visible emission and the disk flux because of the obvious time-lag (Figure 4). Meanwhile, the optical emission is nearly synchronized with the power-law component, and the correlation slopes between them are in the range of (Figure 7). These values are slightly smaller than 0.5 predicted by the reprocessing theory (van Paradijs & McClintock, 1994; Russell et al., 2006), and the deviation could be due to a more complicated geometry of corona in MAXI J1348-630. Alternatively, the synchrotron radiation of nonthermal electrons in the corona sometimes might give non-negligible optical emission, which is predicted to anti-correlate with X-rays (Veledina et al., 2011; López-Navas et al., 2020), thus probably causing the slope slightly smaller than 0.5 as we measured.
The time-lags estimated by both the multi-wavelength light curves and the resolved disk plus corona components suggest that the thermal component lags behind the nonthermal component by days. This is consistent with the viscous timescale for the matter traveling from the outer disk region to the vicinity of the central black hole. Intriguingly, after correcting for the time-lag effect, the “q” pattern HID is changed to a tight linear correlation (Figure 6). Therefore, we conclude that the observed time-lag between radiations of the accretion disk and the corona leads naturally to the hysteresis effect and the “q”-diagram observed in MAXI J1348-630. However, we do not know whether this mechanism universally works for other BHXRBs. Until recently, for only a small number of BHXRB outbursts, their fast-rise stages had been caught with high cadence pointed observations but over only limited energy/wavelength bands (Koljonen et al., 2016; Kara et al., 2019). Additionally, it would be hard to estimate the time-lag due to the complicated evolution patterns of thermal/nonthermal components. Finally, we propose a panorama of accretion disk/corona for MAXI J1348-630: the hard X-ray from the corona heats and induces the corresponding optical brightening in the outer disk; thereafter, the enhanced accretion in the outer disk propagates inward, at viscous timescale of 8-12 days, to the inner disk region where the soft X-rays are produced. Unfortunately, because the very beginning of the outburst was not captured by any telescope, the outburst triggering process is still unknown.
References
- Akritas & Bershady (1996) Akritas, M. G., & Bershady, M. A. 1996, ApJ, 470, 706
- Arnaud (1996) Arnaud, K. A. 1996, in Astronomical Society of the Pacific Conference Series, Vol. 101, Astronomical Data Analysis Software and Systems V, ed. G. H. Jacoby & J. Barnes, 17
- Bassi et al. (2019) Bassi, T., Del Santo, M., D’Ai, A., et al. 2019, The Astronomer’s Telegram, 12477, 1
- Belloni (2010) Belloni, T. M. 2010, States and Transitions in Black Hole Binaries, ed. T. Belloni, Vol. 794, 53
- Belloni et al. (2020) Belloni, T. M., Zhang, L., Kylafis, N. D., Reig, P., & Altamirano, D. 2020, MNRAS, 496, 4366
- Cackett et al. (2007) Cackett, E. M., Horne, K., & Winkler, H. 2007, MNRAS, 380, 669
- Cai et al. (2020) Cai, Z.-Y., Wang, J.-X., & Sun, M. 2020, ApJ, 892, 63
- Cai et al. (2018) Cai, Z.-Y., Wang, J.-X., Zhu, F.-F., et al. 2018, ApJ, 855, 117
- Carotenuto et al. (2019) Carotenuto, F., Tremou, E., Corbel, S., et al. 2019, The Astronomer’s Telegram, 12497, 1
- Charles et al. (2019) Charles, P. A., Buckley, D. A. H., Kotze, E., et al. 2019, The Astronomer’s Telegram, 12480, 1
- Chen et al. (1997) Chen, W., Shrader, C. R., & Livio, M. 1997, ApJ, 491, 312
- Chen et al. (2019) Chen, Y. P., Ma, X., Huang, Y., et al. 2019, The Astronomer’s Telegram, 12470, 1
- Coriat et al. (2012) Coriat, M., Fender, R. P., & Dubus, G. 2012, MNRAS, 424, 1991
- Corral-Santana et al. (2016) Corral-Santana, J. M., Casares, J., Muñoz-Darias, T., et al. 2016, A&A, 587, A61
- Done et al. (2007) Done, C., Gierliński, M., & Kubota, A. 2007, A&A Rev., 15, 1
- Dubus et al. (2001) Dubus, G., Hameury, J. M., & Lasota, J. P. 2001, A&A, 373, 251
- Dunn et al. (2010) Dunn, R. J. H., Fender, R. P., Körding, E. G., Belloni, T., & Cabanac, C. 2010, MNRAS, 403, 61
- Edelson et al. (2015) Edelson, R., Gelbord, J. M., Horne, K., et al. 2015, ApJ, 806, 129
- Esin et al. (1997) Esin, A. A., McClintock, J. E., & Narayan, R. 1997, ApJ, 489, 865
- Fender et al. (2004) Fender, R. P., Belloni, T. M., & Gallo, E. 2004, MNRAS, 355, 1105
- Frank et al. (2002) Frank, J., King, A., & Raine, D. J. 2002, Accretion Power in Astrophysics: Third Edition
- Gallo et al. (2003) Gallo, E., Fender, R. P., & Pooley, G. G. 2003, MNRAS, 344, 60
- Gehrels et al. (2004) Gehrels, N., Chincarini, G., Giommi, P., et al. 2004, ApJ, 611, 1005
- Hameury (2020) Hameury, J. M. 2020, Advances in Space Research, 66, 1004
- Heinz & Sunyaev (2003) Heinz, S., & Sunyaev, R. A. 2003, MNRAS, 343, L59
- Homan et al. (2001) Homan, J., Wijnands, R., van der Klis, M., et al. 2001, ApJS, 132, 377
- Jana et al. (2020) Jana, A., Debnath, D., Chatterjee, D., et al. 2020, ApJ, 897, 3
- Kara et al. (2019) Kara, E., Steiner, J. F., Fabian, A. C., et al. 2019, Nature, 565, 198
- King & Ritter (1998) King, A. R., & Ritter, H. 1998, MNRAS, 293, L42
- Koljonen et al. (2016) Koljonen, K. I. I., Russell, D. M., Corral-Santana, J. M., et al. 2016, MNRAS, 460, 942
- Krolik et al. (1991) Krolik, J. H., Horne, K., Kallman, T. R., et al. 1991, ApJ, 371, 541
- Lasota (2001) Lasota, J.-P. 2001, New A Rev., 45, 449
- Lepingwell et al. (2019) Lepingwell, A. V., Fiocchi, M., Bird, A. J., et al. 2019, The Astronomer’s Telegram, 12441, 1
- López-Navas et al. (2020) López-Navas, E., Degenaar, N., Parikh, A. S., Hernández Santisteban, J. V., & van den Eijnden, J. 2020, MNRAS, 493, 940
- Maccarone & Coppi (2003) Maccarone, T. J., & Coppi, P. S. 2003, MNRAS, 338, 189
- Peterson et al. (1998) Peterson, B. M., Wanders, I., Horne, K., et al. 1998, PASP, 110, 660
- Remillard & McClintock (2006) Remillard, R. A., & McClintock, J. E. 2006, ARA&A, 44, 49
- Russell et al. (2019a) Russell, D. M., Baglio, C. M., & Lewis, F. 2019a, The Astronomer’s Telegram, 12439, 1
- Russell et al. (2006) Russell, D. M., Fender, R. P., Hynes, R. I., et al. 2006, MNRAS, 371, 1334
- Russell et al. (2019b) Russell, T., Anderson, G., Miller-Jones, J., et al. 2019b, The Astronomer’s Telegram, 12456, 1
- Rykoff et al. (2007) Rykoff, E. S., Miller, J. M., Steeghs, D., & Torres, M. A. P. 2007, ApJ, 666, 1129
- Sanna et al. (2019) Sanna, A., Uttley, P., Altamirano, D., et al. 2019, The Astronomer’s Telegram, 12447, 1
- Schlafly & Finkbeiner (2011) Schlafly, E. F., & Finkbeiner, D. P. 2011, ApJ, 737, 103
- Sun et al. (2018) Sun, M., Grier, C. J., & Peterson, B. M. 2018, PyCCF: Python Cross Correlation Function for reverberation mapping studies, , , ascl:1805.032
- Tominaga et al. (2020) Tominaga, M., Nakahira, S., Shidatsu, M., et al. 2020, ApJ, 899, L20
- van Paradijs & McClintock (1994) van Paradijs, J., & McClintock, J. E. 1994, A&A, 290, 133
- Veledina et al. (2011) Veledina, A., Poutanen, J., & Vurm, I. 2011, ApJ, 737, L17
- Weng & Zhang (2015) Weng, S.-S., & Zhang, S.-N. 2015, MNRAS, 447, 486
- Yu & Dolence (2007) Yu, W., & Dolence, J. 2007, ApJ, 667, 1043
- Yuan & Narayan (2014) Yuan, F., & Narayan, R. 2014, ARA&A, 52, 529
- Zdziarski et al. (2004) Zdziarski, A. A., Gierliński, M., Mikołajewska, J., et al. 2004, MNRAS, 351, 791
- Zhang et al. (2020a) Zhang, L., Altamirano, D., Cúneo, V. A., et al. 2020a, MNRAS, 499, 851
- Zhang et al. (2020b) Zhang, S.-N., Li, T., Lu, F., et al. 2020b, Science China Physics, Mechanics, and Astronomy, 63, 249502
- Zhu et al. (2018) Zhu, F.-F., Wang, J.-X., Cai, Z.-Y., et al. 2018, ApJ, 860, 29