Virtual ID Discovery from E-commerce Media at Alibaba
Abstract.
Visual search plays an essential role for E-commerce. To meet the search demands of users and promote shopping experience at Alibaba, visual search relevance of real-shot images is becoming the bottleneck. Traditional visual search paradigm is usually based upon supervised learning with labeled data. However, large-scale categorical labels are required with expensive human annotations, which limits its applicability and also usually fails in distinguishing the real-shot images.
In this paper, we propose to discover Virtual ID from user click behavior to improve visual search relevance at Alibaba. As a totally click-data driven approach, we collect various types of click data for training deep networks without any human annotations at all. In particular, Virtual ID are learned as classification supervision with co-click embedding, which explores image relationship from user co-click behaviors to guide category prediction and feature learning. Concretely, we deploy Virtual ID Category Network by integrating first-clicks and switch-clicks as regularizer. Incorporating triplets and list constraints, Virtual ID Feature Network is trained in a joint classification and ranking manner. Benefiting from exploration of user click data, our networks are more effective to encode richer supervision and better distinguish real-shot images in terms of category and feature. To validate our method for visual search relevance, we conduct an extensive set of offline and online experiments on the collected real-shot images. We consistently achieve better experimental results across all components, compared with alternative and state-of-the-art methods.
1. Visual search relevance
Visual search aims at retrieving images by visual features for relevant image list. As shown in Figure LABEL:fig:2_onlineprocess, by continuous polishing of product technology, we settle down stable and scalable online process (Zhang et al., 2018). When users uploaded query images, two schemes are closely related to visual search relevance, referred as category prediction and feature extraction. The reasons can be attributed to that 1) we certainly can’t find the identical products once falling into the wrong predicted category. 2) Capability of CNN feature is no doubt the key step to obtain the most relevant results.
Click behavior data is not just bridging user intention gap for image search, but also serve as reliable and implicit feedback for training deep networks. Therefore, Virtual ID is able to reveal latent relationship by exploring the co-occurrences of the users’ clicks. Figure LABEL:fig:3_framework illustrates the unified structure of Virtual ID discovery in Pailitao. In Figure LABEL:fig:3_framework(A-B), Virtual ID are fed into Virtual ID Category and Feature Networks by jointly integrating various types of click data from Figure LABEL:fig:3_framework(a-c). Specifically, a bipartite graph between the users and clicked items is constructed based on the PVLOG from image search engine. Moreover, leaf-category and image spaces are formed by co-click graphs respectively. The link between every two nodes in each space represents the leaf-category or image similarity. The spirit of Virtual ID is to learn pseudo labels by means of clustering their corresponding latent embeddings, while preserving the inherent structure of co-click graph. Taking advantages of Virtual ID, deep networks could be trained based on classification labels in the traditional supervised way. In the following, we will cover details of Virtual ID algorithm.
1.1. Discovering Virtual ID from Co-clicks
Let denotes the co-click graph constructed from user click-through bipartite graph . is the set of vertices, which consists of the clicked items in the returned list from the users. is the set of edges between item vertices. An edge between two images on the returned list is established when the users who issued the query clicked both images.
Our goal is to learn the clusters of graph embedding that can well capture semantic relationship of the vertices. As the click data is usually long-tailed distributed and noisy, spectral clustering on graph is not capable of achieving adaptive clusters. By exploring diverse neighborhoods of vertices, we apply DeepWalk (Perozzi et al., 2014) from truncated random walks to learn representations of vertices in co-click graph. The distribution of nodes appearing in short random walks appears similar to the distribution of words in natural language. Skip-Gram model as the word2vec model, is adopted by DeepWalk to learn the representations of nodes. Specifically, for each walk sequence , following Skip-Gram, DeepWalk aims to maximize the probability of the context of node in this walk sequence as follows:
| (1) | |||
where is the window size, denotes the current representation of and is the local neighbourhood nodes of . hierarchical soft-max is used to efficiently infer the embeddings. Finally, we cluster the graph embedding into clusters as Virtual ID .
1.2. Virtual ID Category Network
In this part, we explain how to train Virtual ID Category Network from the user click data. Considering both visual and semantic similarity, query image is firstly recognized into 14 top categories, such as shoes, dress, bags etc, which covers all the leaf-categories. As hierarchy system of leaf-categories, the network contains two branches in terms of supervised data for Virtual ID and top category in Figure LABEL:fig:3_framework(A).
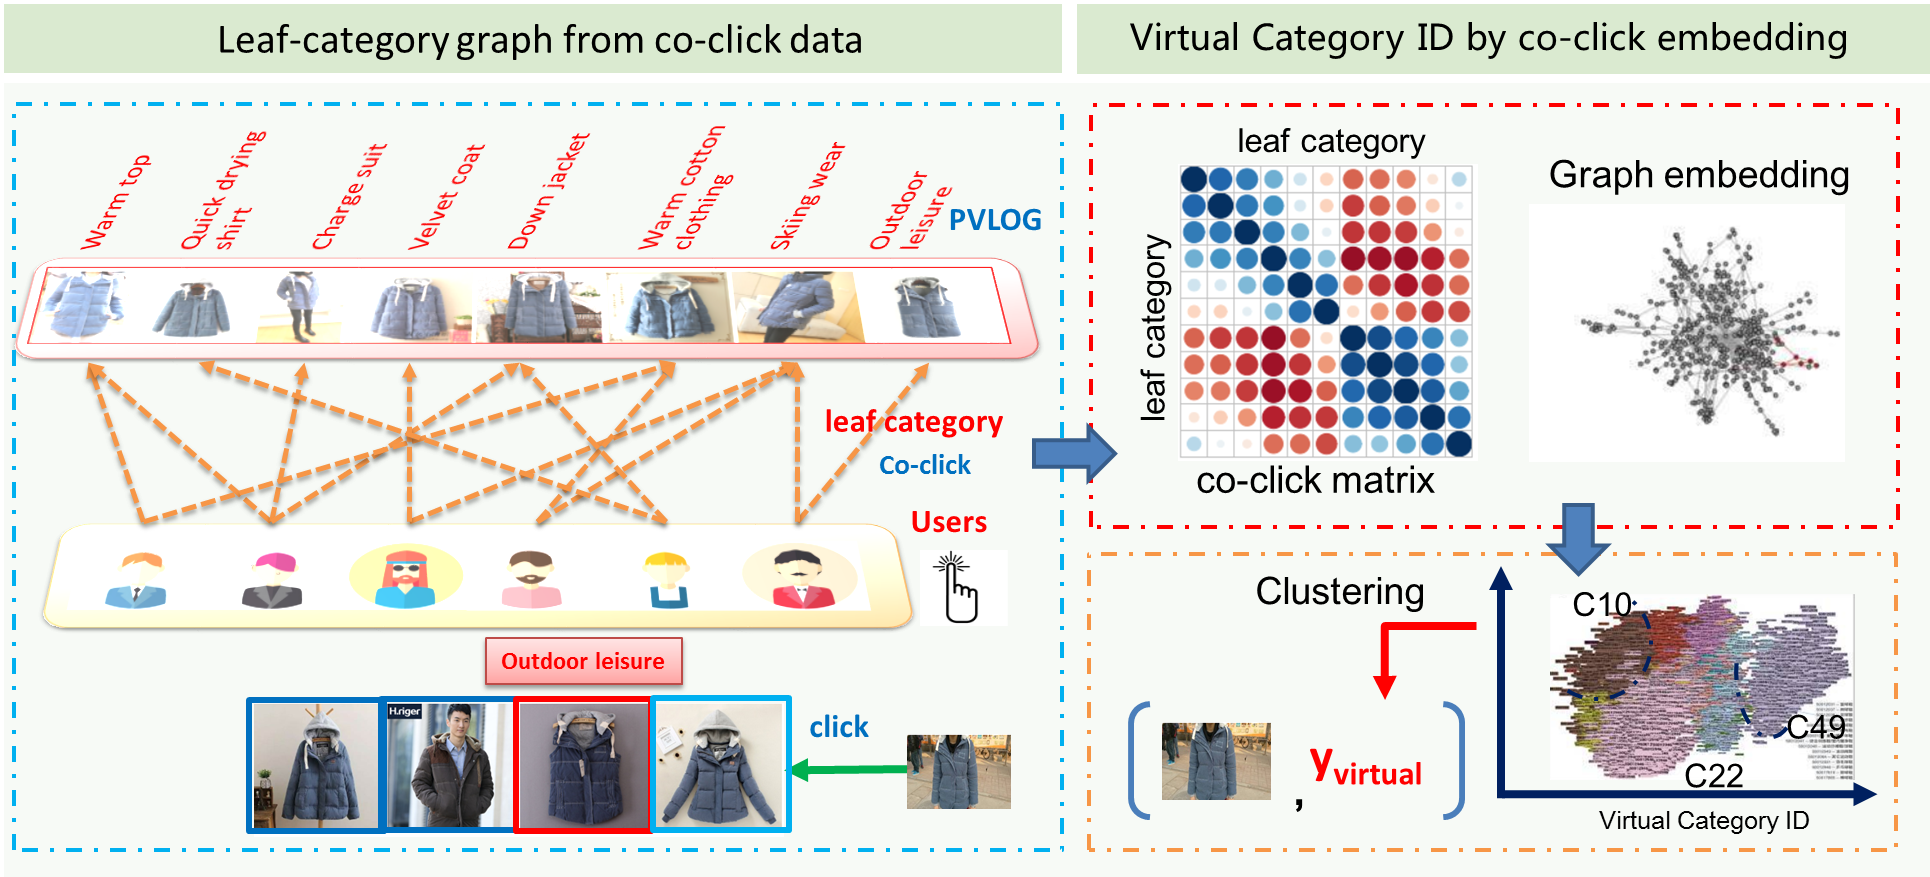
Leaf-category graph by co-clicks. To distinguish the confusable categories more accurate, we construct the co-click graph by using leaf-categories attached with clicked image, as shown in Figure 1. Some top categories contain thousands of leaf-categories, which are easily confused with each other. 1) For similar leaf-categories, we attempt to merge the fined-grained leaf-categories into virtual category node. 2) For the coarser top categories, we split them into multiple virtual category nodes. Following Section 1.1, we collect clicked image with corresponding Virtual Category ID to supervise the Virtual ID branch in the network. For the confusable top categories, we make a decision by mapping the predicted Virtual ID back to the corresponding top category. In Figure 1, the network is trained using each query image associated with the label . We deploy ResNet50 (He et al., 2016) network for trade-off between high accuracy and low latency. Standard softmax-loss is employed for Virtual ID branch in terms of classification task.
| (2) |
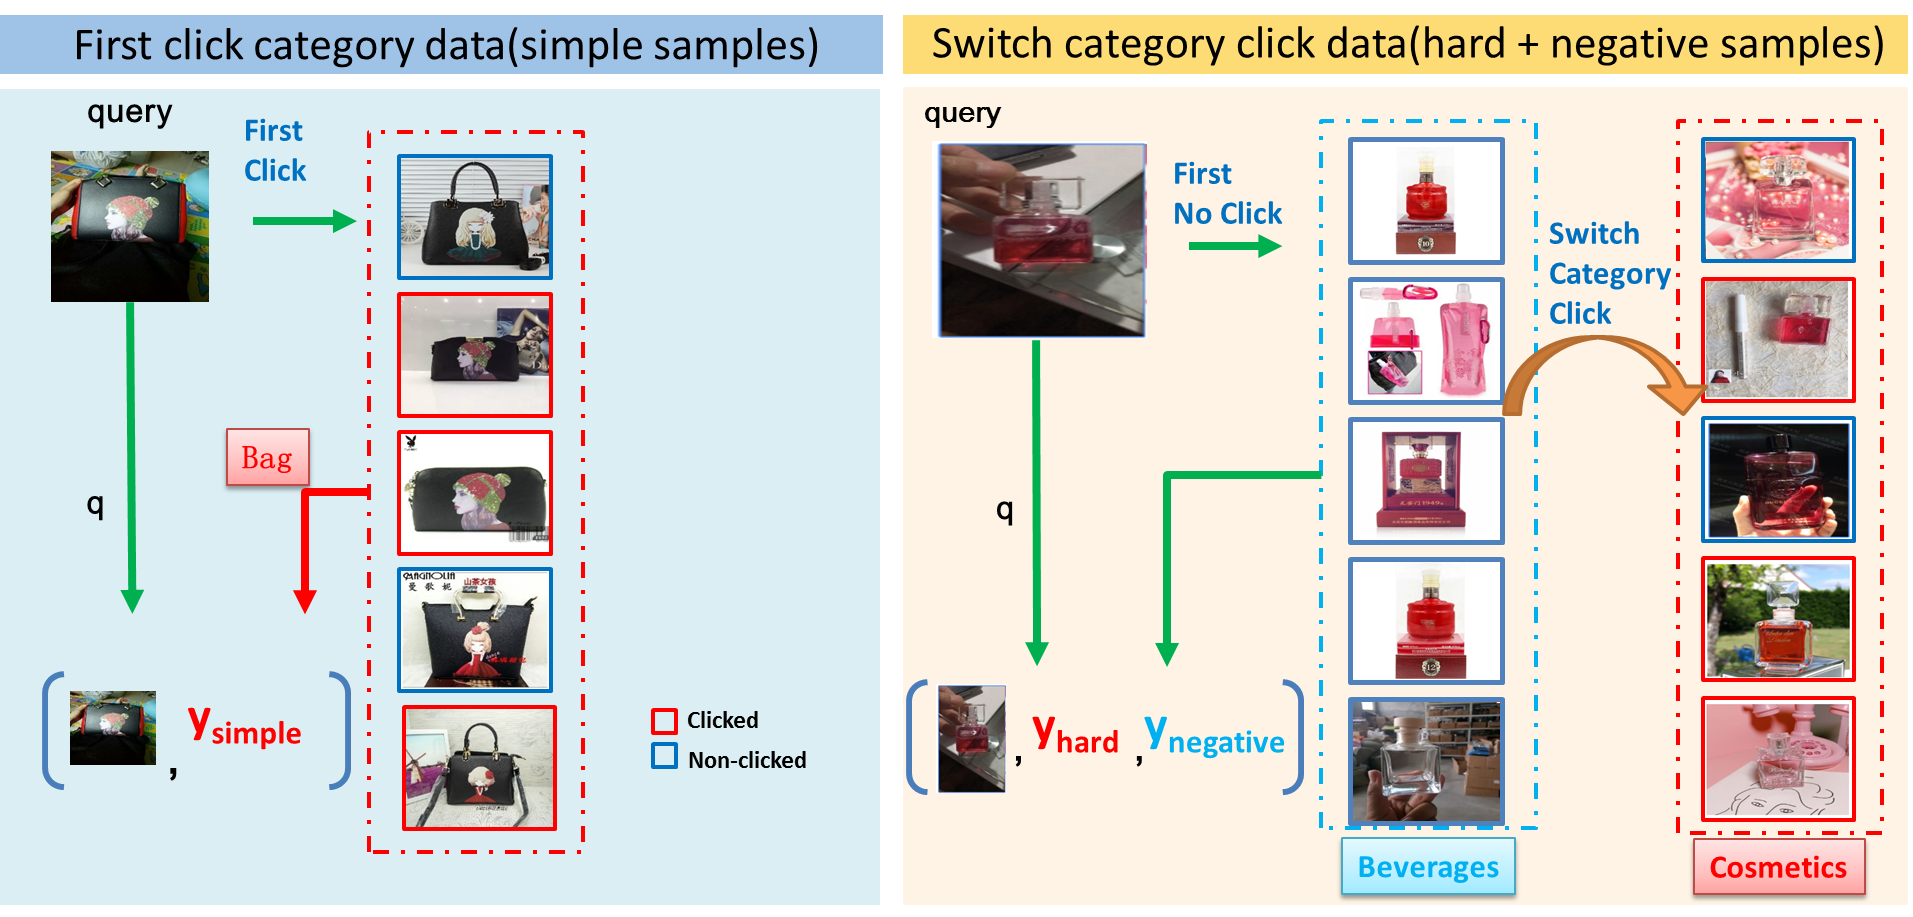
First-clicks as simple samples. To regularize the learned Virtual ID branch, we further make use of the top category clicks accompanying each query image and feed them into the top category branch. As shown in Figure 2, we can easily collect a large amount of first-click data and form simple samples containing the query image with the top category label .
Switch-clicks as hard and negative samples. Notice that most of the users’ effective behavior such as switching clicks can correct the errors of the previous category predictions. Therefore, we mine the PVLOG of the switching category behavior in Figure 2 and collect the previous non-click category as the negative sample label . After switching, the clicked category can be treated as hard sample label . At this point, pairwise label loss can be formed for training,
| (3) |
To encourage diversity of the training samples, hard samples play a more important role in contributing to classification performance. Click samples are collected containing simple and hard samples and further added by an indicator to comprise hard-aware samples. The top category loss is then,
| (4) |
The final training loss therefore becomes:
| (5) |
where , are scalar parameters. We trained the two branches together according to . Benefiting from the these types of click behavior, we ensemble the results of two branches and make the final prediction. Overall, the result brings over 9% absolute improvement on Top-1 accuracy for category prediction of real-shot images.
1.3. Virtual ID Feature Network
In this section, we will introduce the feature learning network based on user click behavior, which is formulated as a joint classification and ranking problem. Despicted in Figure LABEL:fig:3_framework(B), a classification loss with Virtual feature ID is employed on the Virtual ID branch, while a ranking loss with triplet-list samples is incorporated on the ranking branch. To maximum extent, we take advantage of the user click data to encode similarity relationship and ranking orders for discriminative feature training. As a result, we construct Virtual ID Feature Network that is able to jointly learn classification and ranking from clicked data without any annotations.
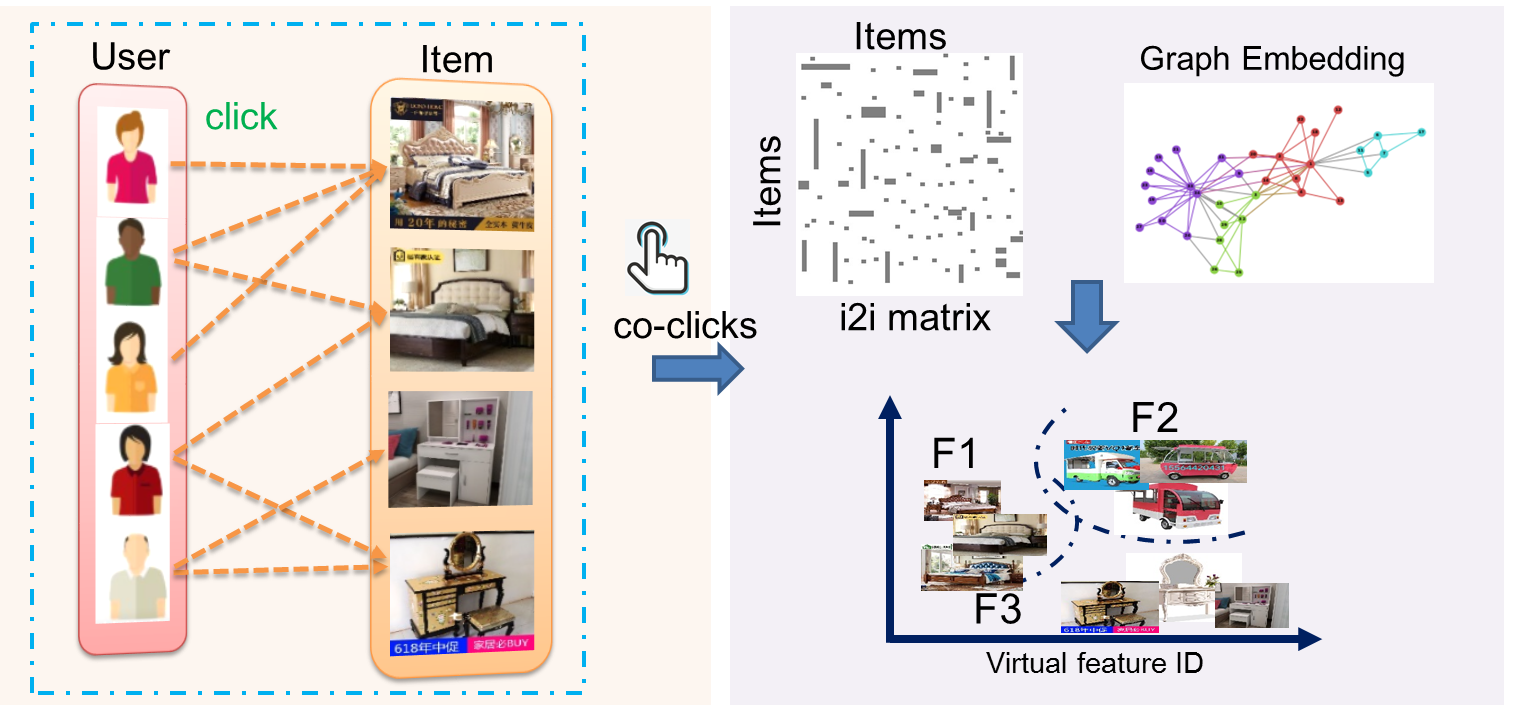
Item graph by co-clicks. Inspired by the CNN on large-scale ImageNet (Russakovsky et al., 2014) being able to learn quite generic visual features, we apply the co-clicks to create Virtual Feature ID as pseudo classes for query images and then learn high-level features in a supervised way. As shown in Figure 3, we construct the co-click graph using image items rather than leaf-categories as nodes and follow Section 1.1 to form training samples containing query image and Virtual Feature ID . Accordingly, we assign the same ID for more similar images according to item-level co-click embedding. Even though item graph contains noise, the learned Virtual Feature ID can greatly reflect semantic and visual relationship between our content items. In order to increase the capability of the learned visual feature, it is necessary to increase the number of Virtual ID to partition feature space of images to more fine-grained clusters. By reflecting Virtual Feature ID based on the cluster index of co-click embedding, we employ ResNet50 to learn such K-way Virtual ID branch in Feature Network.
Triplets and list constraints for ranking. While the classification loss by itself should be sufficient to learn discriminative feature, we note that in practice it is critical to complement with ranking loss simultaneously. Although clicked list data source can be used in different forms to learn visual features, we resort to a more emerging supervised way by creating triplets and list samples(Figure LABEL:fig:3_framework(c)) from the clicked items in the returned list.
Specifically, we can easily obtain a set of triplets , where each tuple consists of an input query , a similar image and a dissimilar image . As shown in Figure 4, we assume that the clicked images are more likely to be identical than the non-click images . To preserve the similarity relations in the triplets, we aim to learn the CNN embedding which makes the positive image more similar to than the negative image . Therefore, triplet loss is used as,
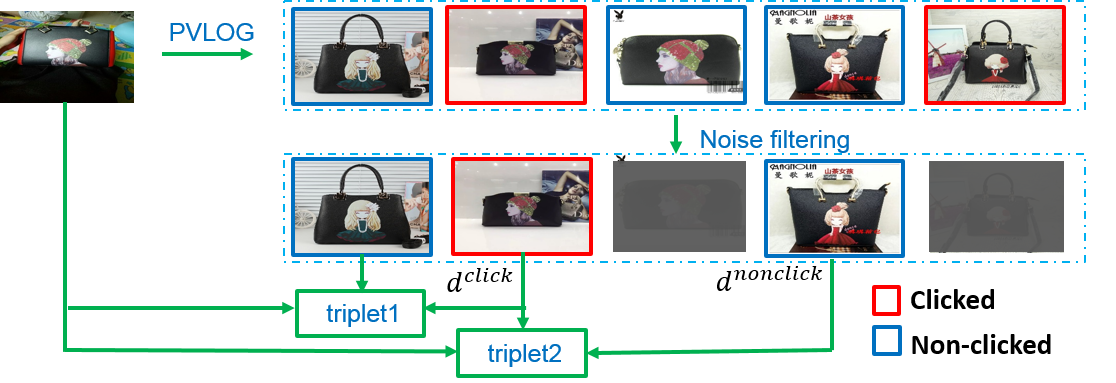
For triplet ranking loss, hard sample mining is a critical criterion to guarantee its performance in efficient similarity search. Given certain returned list from user clicks scenarios, we observed the users click the identical product images , which can be regarded as the query’s positive images. The identical images lie in non-clicked images would badly affect its performance. By removing false negatives, we adopt a multi-feature fusion approach to filter the non-clicked identical images according threshold as, . To ensure noisy negatives to be found more accurately, we combine the local feature, previous version features and pre-trained ImageNet (Russakovsky et al., 2014) feature to compute the integrated distance . More accurate positive images are obtained following similar process, .
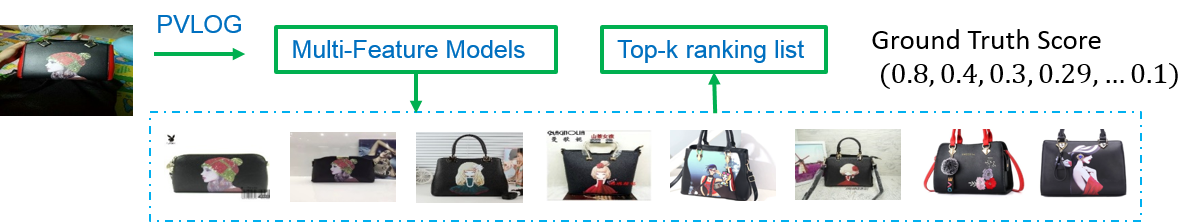
To further inherit high ranking performance from multi-feature fusion, we minimize a listwise ranking loss with ground truth ranking in a mini-batch. As the teacher models, multi-feature models are able to capture more patterns from data and thus has a strong performance. To obtain the ground truth in Figure 5, we compute the predicted relevance scores of the teacher models for returned images and get the top-N ranking permutation . The probability of a ranking list is computed as,
| (7) |
where the assigned relevance scores are computed by on the learned feature vector , denotes the importance of the position. With the cross entropy as the metric, listwise ranking loss is improved as,
| (8) |
This list-based constraint makes better use of non-clicked false negatives, which preserves relative position within the rank. It brings an improvement beyond the triplets, as well as keeping the learning stable by considering more ranked pairs, since only using the hard triplets can in practice lead to bad local minima in training.
Joint classification and ranking. We deploy the two branches of Virtual ID Feature Network with balance scalar by combining classification loss as well as triplet-list loss:
| (9) |
By feeding as the triplets and as the list simultaneously, we maximize the positive and negative characteristics in triplets and preserve the informative ranking.
Finally, we deploy Virtual ID Category Network to predict certain category, and extract the 512-dim CNN feature of FC layer with Virtual ID Feature Network for online process. In practice, we found that user co-click behavior data encodes both visual information and crowd semantic properties. Discrete Virtual ID, which is essentially a vector quantization coding, could be robust to outliers using softmax-loss. Further, associating with various click data in networks makes great improvement for the search relevance. In our experiments, we report that learning from Virtual ID can produce satisfactory category prediction and visual features.
2. Experiment and Analysis
In this section, we conduct extensive experiments to evaluate the performance of category prediction and feature learning paradigms in our system, which follow the same protocol in (Zhang et al., 2018). We take the ResNet50 model (He et al., 2016) as the backbone for both Virtual ID Networks.
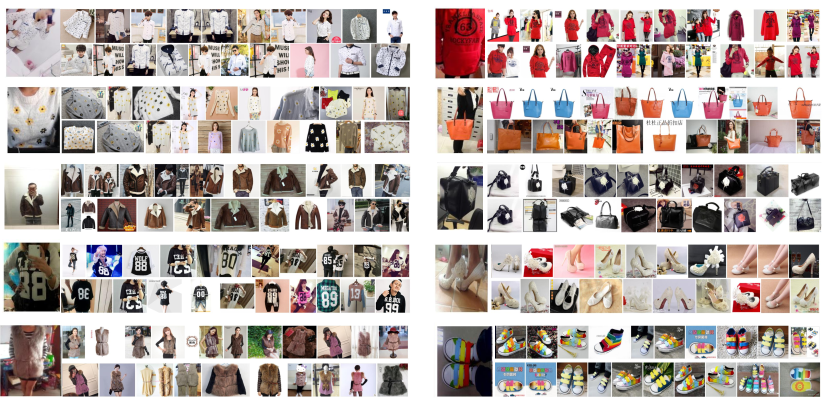
Dataset. To conduct evaluation for both relevance related components in visual search, we collected 200 thousand real-shot images along with top categorical labels and the identical item labels of retrieved results as ground truth. Our evaluation set covers various real-shot images in 14 top categories as listed in Table 1. We illustrate comprehensive evaluation result of the components in the unified architecture with various evaluation metrics.
2.1. Evaluation of Category Prediction
We conduct experiments to evaluate the performance of category prediction from Virtual ID Category Network, containing Virtual ID and top category branches. In Table 1, we list the results of the separated approaches in terms of Precision@1 of top category and conclude the average accuracy. As we can see, our Virtual ID Category Network results in better category prediction than either individual branch. Our Virtual ID branch achieves average Top-1 accuracy 76.48%, which already surpasses the online model (Zhang et al., 2018) with accuracy 72.88%. Besides, top category branch achieves slightly higher results than Virtual ID branch in some categories, i.e., “dress”, “accessories”, “digital”. Overall, we report the Accuracy@1 result of our approach for category prediction, which significantly increase the online model by over points. Specially, for the most confusable category, we increase the Precision@1 from 45.36% to 55.93% in “others”, which shows the significant improvement by employing Virtual ID.
| Method | shirt | dress | pants | bags | shoes | accessories | snacks | cosmetics | beverages | furniture | toys | underdress | digital | others | Accuracy |
| Online Model (Zhang et al., 2018) | 0.7604 | 0.6573 | 0.9480 | 0.8415 | 0.9574 | 0.9308 | 0.5906 | 0.7831 | 0.7127 | 0.7739 | 0.6523 | 0.4507 | 0.3568 | 0.4536 | 0.7288 |
| Virtual ID branch | 0.7986 | 0.7466 | 0.9440 | 0.9456 | 0.9712 | 0.9590 | 0.8148 | 0.7895 | 0.9473 | 0.8926 | 0.8839 | 0.8247 | 0.8279 | 0.5057 | 0.7648 |
| Top Category branch | 0.7850 | 0.7539 | 0.9303 | 0.9491 | 0.9627 | 0.9614 | 0.7921 | 0.7891 | 0.9286 | 0.8787 | 0.8576 | 0.7694 | 0.8303 | 0.4070 | 0.7565 |
| Ours | 0.8275 | 0.7443 | 0.9418 | 0.9001 | 0.9575 | 0.9578 | 0.8081 | 0.8548 | 0.8624 | 0.8168 | 0.8287 | 0.7762 | 0.7317 | 0.5593 | 0.823 |
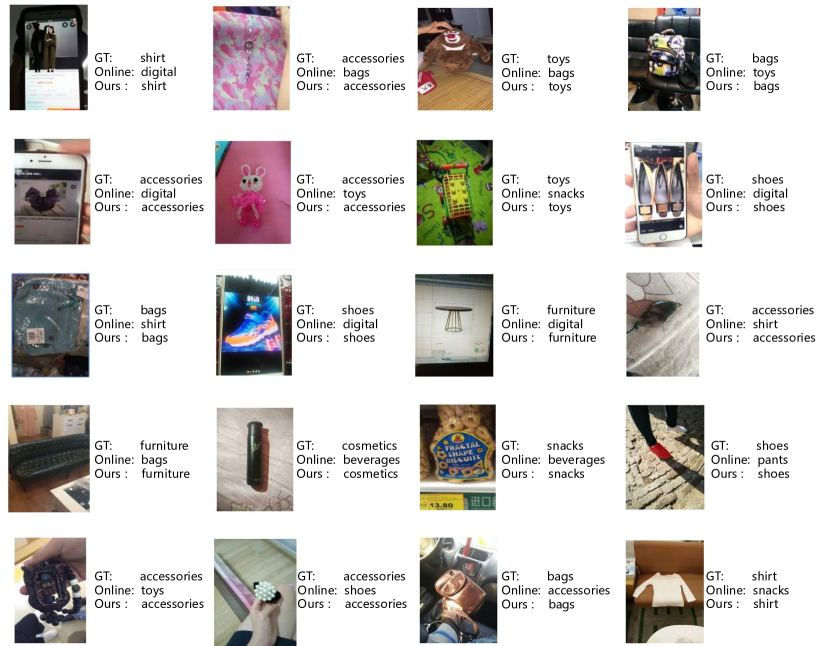
Qualitative comparison. To further illustrate the performance intuitively, we also visualize the predicted category from both online model and ours with corresponding ground truth labels in Figure 9. From these cases, we notice that confusable leaf-categories are effectively identified by Virtual ID Category Network, due to that we consider more fine-grained partition of the categories rather than that online model considers only 14 top categories trained with human labeled data. With the regularization of the top category branch, hard samples are able be to learned to correct some misclassifications, such as objects in cell phone, unusual accessories, etc. Coarser and finer categories are considered complementarily to get better predicted result, which results in that the predictions are much closer to the users’ intention.
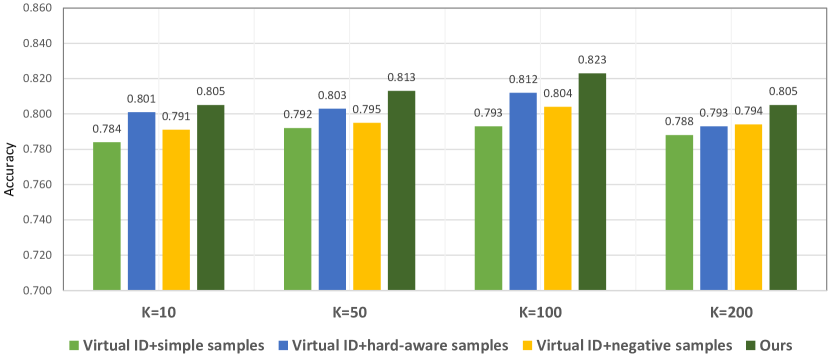
Effect of hyper-parameters. As shown in Figure 8, we report that results of our Virtual ID Networks by varying the number of Virtual ID. To predict the results, we can tell from the bars that ours achieves accuracy 80.5%, 81.3%, 82.3% and 80.5% for K=10,50,100,200, while K=100 achieves the best for the cluster configuration of Taobao leaf-category setting. Integrating with various click samples by tuning and in Equation 5, the comparison results present the progressive improvements from simple to hard and negative samples combined with Virtual ID, which indicates the value of switching-category data to regularize the Virtual ID branch and reduce generalization error.
2.2. Evaluation of Feature Learning
To evaluate the performance of Virtual ID Feature Network, we denote each real-shot image as the query to search for similar images in the item inventory. Following the same criterion to evaluate the learned feature (Zhang et al., 2018), we measure the relevance by Recall@K. As the metric to evaluate capability of feature, number of identical items returned among Top-K retrieved are counted. As the most revelent results, identical items clicked by the users’ intention will produce the most possible conversions.
Effect of Virtual ID branch. Excluding the interference of category prediction, we validate the Feature Network by searching the image in the fixed category inventory. As the baselines, we compared our individual Virtual ID branch (trained with Virtual feature ID only) with start-of-the-art model-based results on real-shot images. The Virtual Feature ID is trained on 50M images with number K=0.5M of Virtual ID. The compared models are trained using PVLOG-triplets mining protocol proposed in (Zhang et al., 2018) with various backbone networks (Krizhevsky et al., 2012; Szegedy et al., 2015; He et al., 2016). Table 3 shows the performances of compared models, along with Identical Recall@K(K=1,4,20) based on the same 512-dim activations of FC layer. Instead of both branches, we note that Virtual ID branch only can compete against PVLOG-triplet data with larger model ResNet101, which shows significant improvements compared with the alternative backbones.
| Evaluation | Metric | Methods | shirt | dress | pants | bags | shoes | accessories | snacks | cosmetics | beverages | furniture | toys | underdress | digital | others | Average |
| (A)Fixed category | Recall@1 | Online(Zhang et al., 2018) | 65.80% | 70.30% | 68.40% | 75.50% | 63.80% | 37.20% | 58.40% | 68.90% | 52.10% | 33.30% | 70.30% | 21.00% | 36.90% | 58.60% | 61.38% |
| Ours | 67.50% | 73.60% | 70.00% | 76.90% | 65.20% | 39.00% | 59.80% | 70.00% | 52.80% | 36.30% | 72.90% | 22.00% | 38.70% | 60.20% | 62.77% | ||
| gain | +1.70% | +3.30% | +1.60% | +1.40% | +1.40% | 1.80% | +1.40% | +1.10% | +0.70% | +3.00% | +2.60% | +1.00% | +1.80% | +1.60% | +1.39% | ||
| Recall@4 | Online(Zhang et al., 2018) | 79.10% | 81.90% | 83.60% | 83.40% | 78.90% | 54.70% | 63.10% | 75.80% | 62.20% | 43.70% | 81.70% | 36.00% | 53.20% | 68.10% | 72.47% | |
| Ours | 80.50% | 85.70% | 84.60% | 84.10% | 80.30% | 56.50% | 63.70% | 76.60% | 62.70% | 45.90% | 82.80% | 40.00% | 55.40% | 68.30% | 73.59% | ||
| gain | +1.40% | +3.80% | +1.00% | + 0.70% | +1.40% | +1.80% | +0.60% | +0.80% | + 0.50% | +2.20% | +1.10% | +4.00% | +2.20% | + 0.20% | +1.12% | ||
| Recall@20 | Online(Zhang et al., 2018) | 88.90% | 90.80% | 90.40% | 88.70% | 87.20% | 69.20% | 64.30% | 79.80% | 68.30% | 53.30% | 87.90% | 48.00% | 64.30% | 73.10% | 79.73% | |
| Ours | 90.70% | 91.70% | 92.80% | 89.80% | 88.10% | 73.70% | 65.10% | 81.10% | 69.00% | 54.10% | 88.60% | 50.00% | 64.40% | 73.30% | 81.81% | ||
| gain | +1.80% | +0.90% | +2.40% | +1.10% | +0.90% | +4.50% | +1.80% | +1.30% | +0.70% | +0.80% | +0.70% | +2.00% | +0.10% | +0.20% | +2.08% | ||
| (B)End to end offline | Recall@1 | Online(Zhang et al., 2018) | 65.60% | 69.30% | 68.80% | 72.70% | 63.50% | 36.70% | 56.90% | 70.30% | 56.60% | 30.70% | 69.90% | 18.00% | 42.70% | 49.00% | 59.06% |
| Ours | 67.70% | 72.60% | 70.00% | 73.90% | 64.60% | 38.90% | 58.80% | 71.90% | 57.90% | 35.60% | 71.40% | 20.00% | 44.10% | 52.50% | 61.20% | ||
| gain | +2.10% | +3.30% | +1.20% | + 1.20% | +1.10% | +2.20% | +1.90% | +1.60% | +1.30% | +4.90% | +1.50% | +2.00% | +1.40% | +3.50% | +2.14% | ||
| Recall@4 | Online(Zhang et al., 2018) | 79.40% | 81.30% | 81.90% | 80.20% | 79.70% | 54.20% | 61.00% | 75.90% | 65.90% | 39.40% | 80.80% | 32.30% | 58.10% | 58.00% | 69.07% | |
| Ours | 80.70% | 85.10% | 84.50% | 81.20% | 79.90% | 57.20% | 62.70% | 78.70% | 68.60% | 44.40% | 81.30% | 40.00% | 58.60% | 59.30% | 71.83% | ||
| gain | +1.30% | +3.80% | +2.60% | +1.00% | +0.20% | +3.00% | +1.70% | +2.80% | +2.70% | +5.00% | +0.50% | +7.70% | +0.50% | +1.30% | +2.76% | ||
| Recall@20 | Online(Zhang et al., 2018) | 88.70% | 90.20% | 89.80% | 86.50% | 86.90% | 67.70% | 62.00% | 79.60% | 71.60% | 48.00% | 87.70% | 51.00% | 62.50% | 62.30% | 76.74% | |
| Ours | 91.40% | 92.20% | 93.50% | 88.80% | 87.40% | 74.20% | 64.10% | 83.70% | 74.70% | 54.10% | 88.60% | 53.00% | 63.10% | 63.20% | 79.14% | ||
| gain | + 2.70% | +2.00% | +3.70% | + 2.30% | +0.50% | +6.50% | +2.10% | +4.10% | +3.10% | +6.10% | +0.90% | +2.00% | +0.60% | +0.90% | +2.40% | ||
| (C)Online A/B test | CTR | Ours | +5.54% | +4.35% | +6.25% | +4.53% | +7.15% | +6.54% | +5.49% | +6.37% | +8.26% | +8.43% | +6.49% | +5.33% | +5.17% | +7.63% | +5.86% |
| GMV | Ours | +6.23% | +5.34% | +8.23% | +5.27% | +6.87% | +9.54% | +4.47% | +7.39% | +8.54% | +9.21% | +6.19% | +5.32% | +7.19% | +8.37% | +7.23% |
Also, we report the overall results of our visual feature on all categories in Table 2(A). For all experiments, we search for 20 similar images within each predicted category for Recall@K (K=1,4,20). Identical Recall of our approach improves as increases, which clearly shows that our approach introduces more relevant images into the top search results. Compared to online model trained with PVLOG-triplets, we are able to achieve better performance when retrieving with our learned feature.
| Model | Recall@1 | Recall@4 | Recall@20 | |
|---|---|---|---|---|
| PVLOG-triplets (Zhang et al., 2018) | AlexNet (Krizhevsky et al., 2012) | 0.346 | 0.423 | 0.553 |
| GoogLeNet (Szegedy et al., 2015) | 0.465 | 0.564 | 0.629 | |
| ResNet50 (He et al., 2016) | 0.585 | 0.685 | 0.762 | |
| ResNet101 (He et al., 2016) | 0.613 | 0.718 | 0.784 | |
| Virtual ID data + ResNet50(Ours) | 0.615 | 0.715 | 0.798 | |
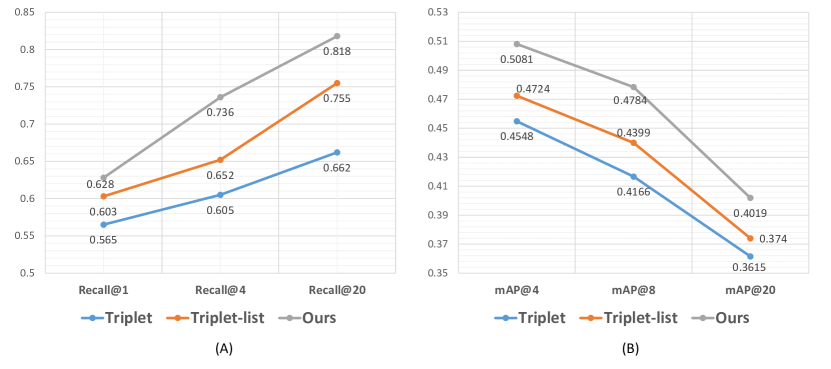
Effect of ranking branch. As illustrated in Section 1.3, we found the ranking loss preserves similarity relations within the retrieval list, so we jointly train the deep networks by sampling from list images for valid triplets and list samples without further annotations. To validate the superiority of the triplet-list samples, we compared the models with alternative models using these separated samples that are trained without Virtual ID data. As shown in Figure 10(A), we outperform list-based variants and increase the Identical Recall@1 by over 4 and 2 percentage points when compared with triplets and triplet-list. Clearly that triplet-list encodes more information from clicked images for discriminating identical items. Besides, in terms of mean Average Precision(mAP) metric in Figure 10(B), we surpass the feature with triplets by 4% mAP@1 and triplet-list by 3% mAP@1, indicating more relevant images are retrieved.
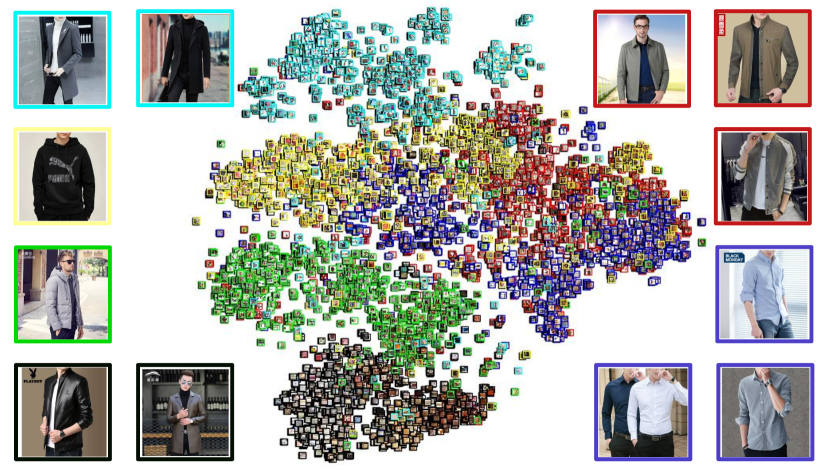
Qualitative comparison. In Figure 6, we further validate the fine-grained discriminating capacity of our learning embedding intuitively. We employ tSNE (Van der Maaten and Hinton, 2008) to illustrate the 512-dim semantic feature space for 6 leaf-categories of “skirt” including underclothes, wind coat, hoodie, jacket, feather dress and fur coat. From the distribution, we claim that our feature preserves semantic information even in the confusable neighborhood qualitatively. In Figure 9, we visualize the retrieval results for real-shot query images, which presents satisfying returned list on identical items. As we can see, the returned lists from ours achieve more identical items to the top positions and perform more consistently than online model in terms of proper order and similar ratio. It contributes to that our approach exerts more relationship information from click data, and more discriminative to recall semantically similar items both in local details and general styles.
2.3. End to End Search Relevance
Coupling with category prediction, we state Recall metric of end to end structure compared with online model, which is utilized on 3 billion images in Table 2(B). Compared with online model, the overall result of end to end evaluation is increased by over 2% in terms of Recall@1. Recall of different categories is more diverse, while the least “shoes” still outperforms online by 1.1%, due to it is easier to find the identical in this category. Besides, we present the results of online evaluation in Pailitao with a standard A/B testing configuration. We concern most on two important commercial metrics, i.e. Click Through Rate(CTR) and Gross Merchandise Volume(GMV). Table 2(C) reports the results of improvements on CTR, GMV when we apply Virtual ID Networks on the operational visual search system. The results show that CTR can increase 5.86% and GMV can increase 8.43% in average, which provides users with more acceptable and enjoyable visual search experience. Table 2(C) also presents a more detailed result of the increase on each category, achieving a maximum 8.43% CTR increase in “furniture” and 9.54% GMV engagement in “accessories”.
3. Conclusions
This paper propose a click-data driven approach for visual search relevance at Alibaba. Effective co-click embeddings that are learned as Virtual ID help to supervise classification for category prediction and feature learning, which explores underlying relationship among images. By exploiting various types of click data, first-clicks and switch-clicks facilitate to regularize Virtual ID Category Network. Besides, Virtual ID Feature Network is designed in a joint classification and ranking manner by integrating triplet-list constraint. Benefiting from richness of these click data, visual search relevance can be more effective to reflect users’ interests. We further provide some practical lessons of learning and deploying the deep networks in the visual search system.
Extensive experiments on real-shot images are provided to illustrate the the competitive performance of Virtual ID Networks as well as generality and transferability of the click-data based approach. Detailed discussion of some case studies are also provided to show the insight of how each component affects. Virtual ID discovery has already been deployed successfully on the online service in visual search system at Alibaba. Online A/B testing results show that our models increase users’ preference better and improve shopping conversions. In our future work, interactive search and image tagging will be leveraged in Pailitao to advocate visual search relevance.
References
- (1)
- Beeferman and Berger (2000) Doug Beeferman and Adam Berger. 2000. Agglomerative clustering of a search engine query log. In Proceedings of the sixth ACM SIGKDD international conference on Knowledge discovery and data mining. ACM, 407–416.
- Chu et al. (2018) Chen Chu, Zhao Li, Beibei Xin, Fengchao Peng, Chuanren Liu, Remo Rohs, Qiong Luo, and Jingren Zhou. 2018. Deep Graph Embedding for Ranking Optimization in E-commerce. In Proceedings of the 27th ACM International Conference on Information and Knowledge Management. ACM, 2007–2015.
- Fang et al. (2015) Chen Fang, Hailin Jin, Jianchao Yang, and Zhe Lin. 2015. Collaborative feature learning from social media. In Proceedings of the IEEE Conference on Computer Vision and Pattern Recognition, CVPR 2015. 577–585.
- He et al. (2016) Kaiming He, Xiangyu Zhang, Shaoqing Ren, and Jian Sun. 2016. Deep Residual Learning for Image Recognition. In 2016 IEEE Conference on Computer Vision and Pattern Recognition, CVPR 2016, Las Vegas, NV, USA, June 27-30, 2016. 770–778.
- Hu et al. (2018) Houdong Hu, Yan Wang, Linjun Yang, Pavel Komlev, Li Huang, Xi Stephen Chen, Jiapei Huang, Ye Wu, Meenaz Merchant, and Arun Sacheti. 2018. Web-scale responsive visual search at bing. In Proceedings of the 24th ACM SIGKDD International Conference on Knowledge Discovery and Data Mining. ACM, 359–367.
- Jing et al. (2015) Yushi Jing, David C. Liu, Dmitry Kislyuk, Andrew Zhai, Jiajing Xu, Jeff Donahue, and Sarah Tavel. 2015. Visual Search at Pinterest. In Proceedings of the 21th ACM SIGKDD International Conference on Knowledge Discovery and Data Mining. ACM, 1889–1898.
- Krizhevsky et al. (2012) Alex Krizhevsky, Ilya Sutskever, and Geoffrey E Hinton. 2012. Imagenet classification with deep convolutional neural networks. In Advances in neural information processing systems. 1097–1105.
- Li et al. (2008) Xiao Li, Ye-Yi Wang, and Alex Acero. 2008. Learning query intent from regularized click graphs. In Proceedings of the 31st annual international ACM SIGIR conference on Research and development in information retrieval. ACM, 339–346.
- Pan et al. (2014) Yingwei Pan, Ting Yao, Tao Mei, Houqiang Li, Chong-Wah Ngo, and Yong Rui. 2014. Click-through-based cross-view learning for image search. In Proceedings of the 37th international ACM SIGIR conference on Research and development in information retrieval. ACM, 717–726.
- Perozzi et al. (2014) Bryan Perozzi, Rami Al-Rfou, and Steven Skiena. 2014. Deepwalk: Online learning of social representations. In Proceedings of the 20th ACM SIGKDD international conference on Knowledge discovery and data mining. ACM, 701–710.
- Russakovsky et al. (2014) Olga Russakovsky, Jia Deng, Hao Su, Jonathan Krause, Sanjeev Satheesh, Sean Ma, Zhiheng Huang, Andrej Karpathy, Aditya Khosla, Michael Bernstein, Alexander C. Berg, and Li Fei-Fei. 2014. ImageNet Large Scale Visual Recognition Challenge. (2014). arXiv:arXiv:1409.0575
- Szegedy et al. (2015) Christian Szegedy, Wei Liu, Yangqing Jia, Pierre Sermanet, Scott E. Reed, Dragomir Anguelov, Dumitru Erhan, Vincent Vanhoucke, and Andrew Rabinovich. 2015. Going deeper with convolutions. In IEEE Conference on Computer Vision and Pattern Recognition, CVPR 2015. 1–9.
- Van der Maaten and Hinton (2008) Laurens Van der Maaten and Geoffrey Hinton. 2008. Visualizing data using t-SNE. Journal of Machine Learning Research 9, 2579-2605 (2008), 85.
- Yang et al. (2017) Fan Yang, Ajinkya Kale, Yury Bubnov, Leon Stein, Qiaosong Wang, M. Hadi Kiapour, and Robinson Piramuthu. 2017. Visual Search at eBay. In Proceedings of the 23rd ACM SIGKDD International Conference on Knowledge Discovery and Data Mining, Halifax, NS, Canada, August 13 - 17, 2017. 2101–2110.
- Yao et al. (2013) Ting Yao, Tao Mei, Chong-Wah Ngo, and Shipeng Li. 2013. Annotation for free: Video tagging by mining user search behavior. In Proceedings of the 21st ACM international conference on Multimedia. ACM, 977–986.
- Yuan et al. (2014) Zhaoquan Yuan, Jitao Sang, Changsheng Xu, and Yan Liu. 2014. A unified framework of latent feature learning in social media. IEEE Transactions on Multimedia 16, 6 (2014), 1624–1635.
- Zhai et al. (2017) Andrew Zhai, Dmitry Kislyuk, Yushi Jing, Michael Feng, Eric Tzeng, Jeff Donahue, Yue Li Du, and Trevor Darrell. 2017. Visual discovery at pinterest. In Proceedings of the 26th International Conference on World Wide Web Companion. 515–524.
- Zhang et al. (2017) Hanwang Zhang, Xindi Shang, Huanbo Luan, Meng Wang, and Tat-Seng Chua. 2017. Learning from collective intelligence: Feature learning using social images and tags. ACM transactions on multimedia computing, communications, and applications (TOMM) 13, 1 (2017), 1.
- Zhang et al. (2018) Yanhao Zhang, Pan Pan, Yun Zheng, Kang Zhao, Yingya Zhang, Xiaofeng Ren, and Rong Jin. 2018. Visual search at alibaba. In Proceedings of the 24th ACM SIGKDD International Conference on Knowledge Discovery and Data Mining. ACM, 993–1001.