Resolved HI in two ultra–diffuse galaxies from contrasting non-cluster environments
Abstract
We report on the first resolved H i observations of two blue ultra-diffuse galaxies (UDGs) using the Giant Metrewave Radio Telescope (GMRT). These observations add to the so-far limited number of UDGs with resolved H i data. The targets are from contrasting non–cluster environments: UDG–B1 is projected in the outskirts of Hickson Compact Group 25 and Secco–dI–2 (SdI–2) is an isolated UDG. These UDGs also have contrasting effective radii with of 3.7 kpc (similar to the Milky Way) and 1.3 kpc respectively. SdI–2 has an unusually large ratio =28.9, confirming a previous single dish H i observation. Both galaxies display H i morphological and kinematic signatures consistent with a recent tidal interaction, which is also supported by observations from other wavelengths, including optical spectroscopy. Within the limits of the observations’ resolution our analysis indicates that SdI–2 is dark matter-dominated within its H i radius and this is also likely to be the case for UDG–B1.Our study highlights the importance of high spatial and spectral resolution H i observations for the study of the dark matter properties of UDGs.
keywords:
galaxies: individual: UDG–B1 and Secco–dI–2 – galaxies: ISM – galaxies: interactions – galaxies: kinematics and dynamics – radio lines: galaxies1 Introduction
Recent studies (van Dokkum et al., 2015; Koda et al., 2015; Yagi et al., 2016) have reported over 1000 extended diffuse galaxies in and surrounding the Coma galaxy cluster (z = 0.0231). These galaxies have central surface brightnesses () of 24 – 26 mag arcsec-2 , effective radii111The effective radius of a galaxy is the radius at which half of the total light is emitted () 1.5 – 5 kpc, median stellar masses of 6 107 M⊙ and were designated by van Dokkum et al. (2015) as ultra–diffuse galaxies (UDGs). These UDGs have a median similar to L* spirals ( 3.7 kpc) but their median stellar masses are more typical of dwarf galaxies 107-8 M⊙ (Lagos et al., 2011, and references therein). While faint, extended, low surface brightness galaxies (LSBs) are not a recent discovery, the Coma UDGs reveal their higher abundance in dense environments (van der Burg et al., 2017). Compared to classical LSBs, UDGs are optically fainter and often more extended (Yagi et al., 2016) with a wide range of optical . Conselice (2018), argues UDGs are part of an earlier reported population of Low–Mass Cluster Galaxies (LMCGs) and attributes their large diameters to interactions with the cluster environment and expected them to be dark matter (DM) dominated. On the face of it, the reported tight correlation between the abundance of UDGs and the mass of the host clusters and groups (van der Burg et al., 2017; Román & Trujillo, 2017) supports environmentally driven formation scenarios, such as those proposed by Baushev (2016); Yozin & Bekki (2015); Carleton et al. (2018). Janssens et al. (2019) reported on the abundance and distribution of UDGs in 6 masive clusters at z = 0.308 to 0.545. The asymmmetric distribution of UDG around 4 of the Janssens et al. (2019) clusters and the anticorelation between the UDG and compact dwarf galaxy distributions highlights the likely role of the cluster environment in both the formation and evolution of UDGs. However, UDGs are also found in groups and in isolation which has lead to alternative formation models which rely, to a greater or lesser extent, on secular processes, e.g. objects from the high–end tail of the DM halo spin parameter distribution (Amorisco & Loeb, 2016) or star formation (SF) driven gas outflows generating extended discs and quenching SF (Di Cintio et al., 2017). Whether UDG/LMCGs (referred from here on as UDGs) turn out to be a subset of classical LSBs, as suggested by Tanoglidis et al. (2020), or separate class(es) of their own, is likely to depend on the so-far unresolved question of how LSBs and UDGs form. Attention is turning toward the DM content and its distribution in UDGs because of its critical role in the formation and evolution of their observable baryonic components. Beyond the cluster environment, where significant ram pressure stripping of a UDGs H i is not expected, H i studies become feasible. Resolved H i in particular is well suited to both the detection of recent interactions and determination of DM properties and as a result, can assist in answering these questions.
In this paper, we present resolved Giant Metrewave Radio Telescope (GMRT) H i observations of two blue (g – i 0.6) UDGs from contrasting non–cluster environments; UDG–B1 is projected in the outskirts of Hickson Compact Group 25 (HCG 25) (Román & Trujillo, 2017; Spekkens & Karunakaran, 2018) while Secco–dI–2 (hereafter SdI–2) is a relatively isolated blue UDG (Bellazzini et al., 2017). Because of gas stripping in dense environments we would expect UDGs in those environments to have redder colours than the the g – i 0.6 colour predicted for UDGs in low density environments (Liao et al., 2019) and UDG–B1 is the bluest UDG (g – i = 0.27 0.05) in a sample of bluer (0.27 g – i 0.55) UDGs surrounding Hickson Compact groups from Román & Trujillo (2017). Table 1 gives a summary of the UDG–B1 and SdI–2 properties. There are differing definitions in the literature of a UDG, in particular, the criteria for their , e.g. (Yagi et al., 2016, 0.7 kpc), (Román & Trujillo, 2017, 1.3 kpc), although the van Dokkum et al. (2015) definition of 1.5 kpc is widely used. SdI–2 ( = 1.3 0.1) has previously been classified as a UDG by Bellazzini et al. (2017); Papastergis et al. (2017) and (Wang et al., 2020). But we note that while the SdI–2 is above the of 1kpc of local group dwarf galaxies (Guo et al., 2020) it is below the minimum of 1.5 kpc for UDGs adopted by many authors, e.g. Forbes et al. (2020a) who would consider SdI–2 as a “small UDG" or “LSB dwarf" rather than a UDG. The of SdI–2 lies only slightly below the 1.5 kpc, which is confirmed by the fact that it’s lies within uncertainties of three of the UDGs in the Leisman et al. (2017) sample of HI rich UDGs. Additionally measurement can change significantly with the optical band (Forbes et al., 2020b). SdI–2’s (measured at 1.30.1 kpc in i band) may well be above 1.5 kpc in g band. Thus given its proximity to the strictest lower limit and consistency with the previous classifications of SdI–2 as a UDG, we adopt its classification as a UDG. We use optical images from the Sloan Digital Sky Survey (SDSS), IAC Stripe 82 and Pan-STARRS1 (Flewelling et al., 2016) as well as UV imaging from Galaxy Evolution Explorer (GALEX) in this paper. UDG–B1 also has an SDSS spectrum that we utilise as part of our analysis.
Section 2 gives details of the GMRT observations, with observational results in section 3. A discussion follows in section 4 with a summary and concluding remarks in section 5. To aid comparisons in this paper we adopt distances to UDG–B1 and SdI–2 of 88 Mpc and 40 Mpc, respectively from Spekkens & Karunakaran (2018) and Papastergis et al. (2017). We also adopt their angular scales of 1 arcmin 25 kpc and 1 arcmin 11 kpc, for UDG–B1 and SdI–2, respectively. All and positions referred to throughout this paper are J2000.0.
| Property222From the literature as noted or if in bold typeface from this work. | Units | UDG–B1 | SdI–2 |
| Voptical333SdI–2 from Bellazzini et al. (2017). | [km s-1] | 644512 | 254950 |
| VHI W20 | [km s-1] | 6450 7 | 2565 4 |
| WW20 | [km s-1] | 90 15 | 80 6 |
| RA444RA and DEC positions for UDG–B1are from Román & Trujillo (2017) and SdI–2 are from (Bellazzini et al., 2017). | [h:m:s] | 03 20 21.1 | 11 44 33.8 |
| DEC | [d:m:s] | -01 10 12.0 | -00 52 00.9 |
| Distance555See section 1. | [Mpc] | 88 | 401 |
| 666UDG–B1 from Román & Trujillo (2017), SdI–2 from Bellazzini et al. (2017). | [kpc] | 3.70.4 | 1.30.1 |
| (0)777UDG–B1 from Trujillo et al. (2017). | [mag arcsec2] | 24.0 | 24.0 |
| Morphology | UDG | UDG | |
| 12+log(O/H)888For UDG–B1 from a SDSS spectrum of the brightest SF knot see Table 3 and SdI–2 from (Bellazzini et al., 2017). | 7.91 0.32 | 8.10.2 | |
| SHI (GMRT) | [Jy km s-1] | 0.80.04 | 0.690.03 |
| (GMRT) | [108 M⊙] | 15 | 2.6 |
| 999UDG–B1 from Román & Trujillo (2017), SdI–2 from Papastergis et al. (2017). | [108 M⊙] | 2.20.3 | 0.09 |
| g – i101010UDG–B1 from Román & Trujillo (2017). SdI–2 from SDSS photometry. | 0.27 0.05 | 0.19 |
2 Observations
UDG–B1 and SdI–2 were observed in H i using the GMRT on 2018 March 8th and 9th and selected observational parameters are detailed in Table 2. H i in UDG–B1 has previously been detected within a VLA D–configration field (Spekkens & Karunakaran, 2018; Borthakur et al., 2010) centred on the HCG 25 group. The UDG–B1 H i was unresolved in the VLA 70 50 arcsec FWHM synthised beam, which provided the motivation to reobserve UDG–B1 with the GMRT to obtain the first ever resolved mapping of its H i. The GMRT data was reduced and analyzed using the standard reduction procedures with the Astronomical Image Processing System (aips) software package. The flux densities are on the scale of Baars et al. (1977), with uncertainties of 5%. After calibration and continuum subtraction in the uv domain the aips, task imagr was used to convert the uv domain data to H i image cubes. Finally integrated H i and velocity field maps were extracted from the image cubes using the aips task momnt. To study the H i distribution in detail, image cubes with different resolutions were produced by applying different ‘tapers’ to the data with varying uv limits. Details of the final low, medium and high resolution maps are given in Table 2.
| UDG-B1 | |
|---|---|
| Rest frequency | 1420.4057 MHz |
| Observation Date | 2018 Mar 9 |
| Integration time | 10.0 hrs |
| primary beam | 24′ at 1420.4057 MHz |
| Low resolution beam–FWHP | 44.82′′ 40.48′′, PA = 14.03∘ |
| Medium resolution beam–FWHP | 26.46′′ 22.65′′, PA = 15.80∘ |
| High resolution beam–FWHP | 22.73′′ 15.31′′, PA = -9.61∘ |
| RA (pointing centre) | 03h 20m 21.102s |
| DEC (pointing centre) | – 01∘ 10′ 13.992′′ |
| SdI–2 | |
| Rest frequency | 1420.4057 MHz |
| Observation Date | 2018 Mar 8 |
| Integration time | 10.0 hrs |
| primary beam | 24′ at 1420.4057 MHz |
| Low resolution beam–FWHP | 39.95′′ 35.38′′, PA = – 10.63∘ |
| Medium resolution beam–FWHP | 24.50′′ 21.99′′, PA = 21.18∘ |
| RA (pointing centre) | 11h 44m 33.802s |
| DEC (pointing centre) | – 00∘ 52′ 00.913′′ |
3 Observational Results
3.1 HI morphology and mass
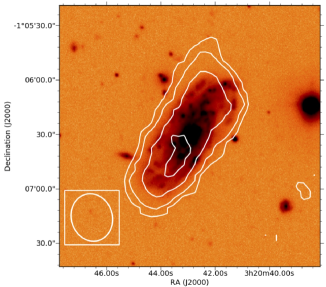
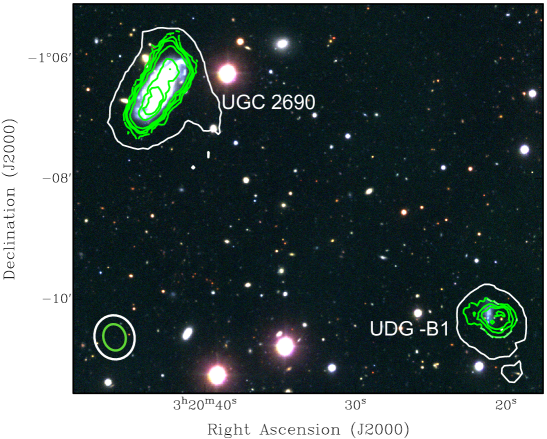
UDG–B1 is projected 9 arcmin (225 kpc) SW of the Hickson Compact Group, HCG 25 centre, see Figure 1. The UDG’s heliocentric radial velocity (Vopt) is 89 km s-1 higher than the mean velocity for HCG 25, Vopt = 6356 km s-1 (NED) with a dispersion () = 61.3 km s-1 (Tovmassian et al., 1999). UDG-B1 is projected within the typical group R200 of 500 kpc (Román & Trujillo, 2017), where R200 is the radius enclosing an overdensity of 200 with respect to the critical density of the universe. Its projected position and velocity are therefore consistent with UDG–B1 being an outskirts member of HCG 25 so past interactions between the UDG–B1 and HCG 25 group members cannot be ruled out. H i was detected in UDG-B1 with the GMRT at a velocity111111The H i velocity was determined from the mid point in the W20 velocity range, i.e. VHI W20 as definded in Reynolds et al. (2020). (VHI) = 64507 km s-1 and in HCG 25 member UGC 2690 (Vopt = 6285 km s-1, W20 = 340 8 km s-1), projected 6.6 arcmin NE and within 165 km s-1 of UDG–B1, see Figure 1. Further details of the H i detected in UGC 2690 are presented in Appendix A.
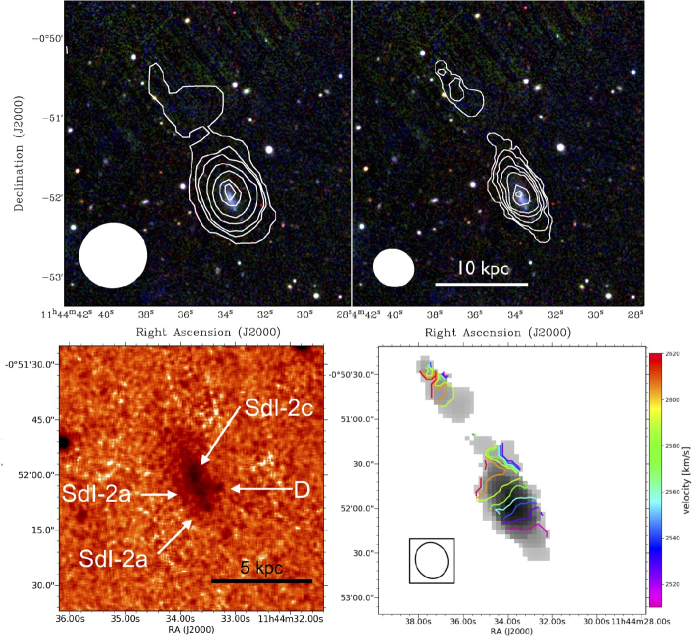
The left–hand panels of Figure 2 show (top to bottom) the low (44.82′′ 40.48′′), medium (26.46′′ 22.65′′) and high (22.73′′ 15.31′′) resolution GMRT UDG–B1 integrated H i map contours overlaid on an IAC Stripe 82 g, r, i composite image. The high resolution H i map contours reveal significant asymmetry in the H i morphology, with the bulk of the high column density H i offset by 20 arcsec (8 kpc) from optical centre. For UGC–B1 the GMRT flux density (SHI) = 0.8 Jy km s-1 which converts to an 1.5 109 M⊙. Spekkens & Karunakaran (2018) have previously reported Green Bank Telescope (GBT) single dish and Very Large Array (VLA) H i detections for UGC–B1 with SHI = 0.6 0.1 Jy km s-1 from the VLA data. At the adopted distance of 88 Mpc this VLA SHI implies = 1.1 109 M⊙, in good agreement with the derived from the GMRT. The VLA flux density sensitivity was 0.5 mJy beam-1 (Borthakur et al., 2010), quite similar to GMRT medium and high resolution maps. For the GBT spectrum Spekkens & Karunakaran (2018) reported a higher peak signal to noise ratio (15.2) than from the VLA spectrum (9.2). At first sight this may seem like some flux loss for the interferometric observations. However, while the GBT pointing was at the position UDG–B1 the GBT FWHP beam is 9 arcmin and thus the spectrum was contaminated by emission from UGC 2690. UGC 2690 is projected 6.6 arcmin from UDG–B1, so lies just beyond the radius of GBT FWHP beam. Combining the GMRT H i spectra of UDG–B1 and UGC 2690, attenuated to 40% of its actual flux, produces a spectrum consistent with the GBT spectrum. So, for the analysis in this paper we adopt the GMRT H i mass. Based on this H i mass and the from Table 2 the ratio for UGC–B1 is 6.8.
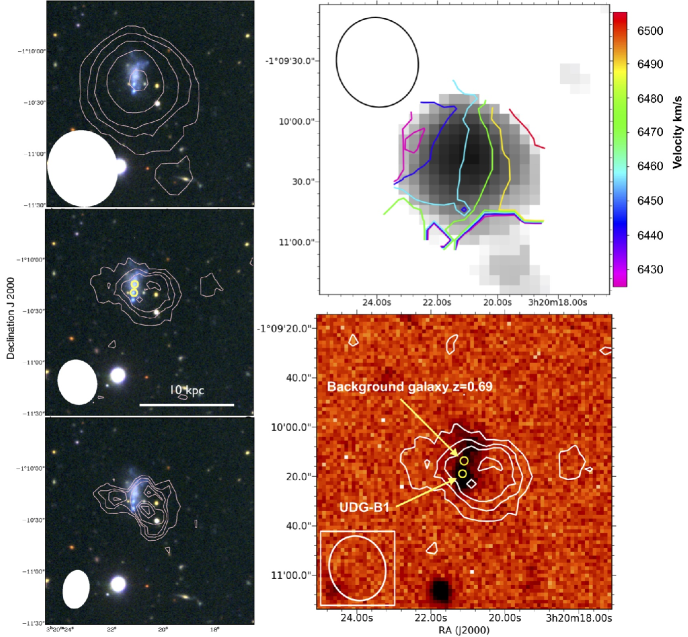
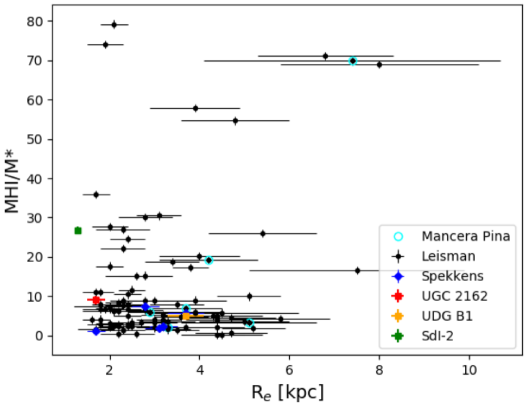
For SdI–2, Figure 3 (Top row) shows the low (39.95′′ 35.38′′) and medium (24.50′′ 21.99′′) resolution GMRT integrated H i map contours overlaid on a smoothed Pan–STARRS g, r, i composite image. Figure 3 shows the main body of the galaxy has an H i extent of 1.2 arcmin (13.6 kpc). A detached H i tail like extension was also detected to the NE of the main H i body reaching 2.4 arcmin (26 kpc) NE of the optical centre in the medium resolution H i map. H i in this extended region has a column density maximum 7 1019 atoms cm2. The main H i body of SdI–2 has optical, NUV and FUV (GALEX) and NIR (WISE 3.4 m and 4.6 m) counterparts, see Figure 3 – Lower right panel. For SdI–2 the GMRT SHI = 0.690.03 J km s-1 which at the adopted distance of 40 Mpc gives 2.6 108 M⊙. A previous H i detection for SdI–2 using the Effelsberg 100 m single dish telescope gave SHI = 0.63 Jy km s-1 which converts to = 2.4 108 M⊙ (Papastergis et al., 2017), in good agreement with the derived from the GMRT. For the analysis in this paper we adopt the GMRT H i mass. Based on the GMRT H i mass and the from (Papastergis et al., 2017), the ratio for SdI–2 is 28.9, which is much higher than is typical for UDGs irrespective of , see Figure 5. As reported in Papastergis et al. (2017) this high ratio is consistent with the trend for isolated UDGs to show significantly higher ratios than UDGs in denser environments. It should be remembered that this plot only considers relatively isolated H i UDGs and does not include cluster galaxies which are expected to be H i deficient. That said we would expect the higher region of the plot to favour high DM halo spin (Amorisco & Loeb, 2016) or star formation SF driven extended disc (e.g. Di Cintio et al., 2017) formation models. Conversely, environment density driven formation scenarios should favour the lower /M∗ ratio regions of the plot, but more H i observations of cluster galaxies are needed to explore this parameter space. A NED search revealed no companions projected within a radius of 30 arcmin ( 330 kpc) and a velocity range of 500 km s-1. However, the SdI–2 head and tail H i morphology is suggestive of a recent interaction. Given this and that the nearerst galaxy cluster (ZwCl 1141.7-0158B) is projected 900 kpc and -1055 km s-1 away, we can reasonably rule out ram pressure stripping as the origin of the one–sided H i tail. This leaves an interaction with a low mass satellite or gas cloud within 7 108 yr as a likely explanation for the H i detached region. The above timescale is based on Holwerda et al. (2011), who predict the H i perturbations from even major mergers will only remain detectable in H i for a maximum of 0.4 to 0.7 Gyr. In summary the H i morphologies of both UGG–B1 and SdI–2 indicate a recent interaction. The evidence for and against a recent interactions is discussed further in Section 4.2.
3.2 HI kinematics
Based on UDG–B1’s GMRT H i spectrum, its VHI = 6450 7 km s-1 and W20 = 90 15 km s-1. This velocity agrees within the uncertainties with the VHI = 64405 km s-1 and W50 = 5010 km s-1 from the VLA (Spekkens & Karunakaran, 2018). Figure 2 (top right panel) shows the UDG–B1 H i low resolution velocity field, with H i detected in the velocity range 6404 km s-1 to 6512 km s-1. The H i velocity field shows a NE to W gradient, which indicates that the H i disc major axis is approximately perpendicular to the N – S optical axis and the change in the position angle of the iso–velocity contours from the NE to W suggests a warping of the disc, although with the caveat that the spatial resolution is low. We attempted to determine the rotational velocity (Vrot) from a 3D model fit to the UDG-B1 H i emission in the medium resolution cube using bbarolo (Di Teodoro & Fraternali, 2015). Unfortunately, the small number of beams across the H i disc and the low signal to noise ratio (S/N) meant this attempt failed. Instead using inclination (i = 17.6∘) and W20 derived from the medium resolution H i cube and equation 1 we estimated Vrot = 148 km s-1.
| (1) |
where,
a, b are the lengths of the major and minor H i axes, 43.3 arcsec and 41.46 arcsec respectively from the medium resolution H i map and q0 =0.3 is the intrinsic axial ratio for an edge on galaxy (Sánchez-Janssen et al., 2010) and
where is the W20 measured from the spectrum and is a correction for instrumental broadening and turbulence (10 km s-1).
However, this inclination corrected Vrot estimate of 148 km s-1 is anomalously high by a factor of 2 to 3 for a UDG of its H i mass, even allowing for the significant uncertainties in the H i major and minor axes because synthised beam is large relative to axes. So, as a check we also calculated Vrot using Equation 1 but replacing the H i axial ratio (b/a) with the optical axial ratio of 0.46 from Román & Trujillo (2017). This substitution resulted in a revised inclination of 68.6∘ and Vrot = 48 km s-1. A visual assessment of the medium resolution H i map in Figure 1 indicates the H i axial ratio is significantly lower than its optical counterpart. It is also important to note the calculations above assume that the H i is dynamical equilibrium, but if UDG–BI has suffered a recent interaction, as the analysis of the H i morphology suggests, the apparently large H i Vrot of 148 km s-1 is more likely an interaction induced kinematic artefact rather than an usually large H i rotation velocity. The implications of the two Vrot estimates for calculation of UDG–B1’s dynamical mass are discussed in section 4.1.
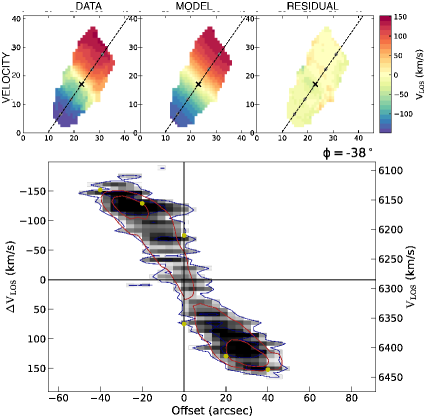
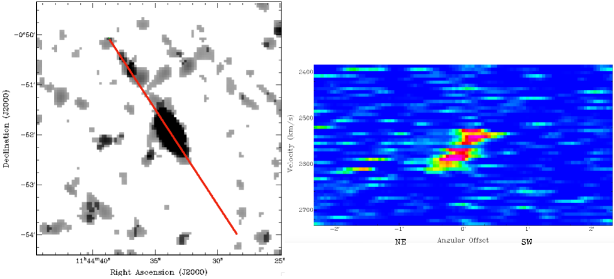
Measurent of SdI–2’s GMRT H i spectrum gives VHI = 2565 4 km s-1 and W20 = 80 6 km s-1. VHI = 2543 km s-1 and W50 = 69 km s-1 were reported for the galaxy in Papastergis et al. (2017) using observations from the Effelsberg 100 m telescope. SdI–2’s velocity field in Figure 3 (lower right panel) shows two distinct kinematic regions; the main H i body of the galaxy, which has a length of 74 ′′ (14 kpc) and displays a regular velocity gradient indicating a possible rotating H i disc ( 2527 km s-1 to 2618 km s-1) and a morphologically detached H i extension to the NE with a narrow range of velocities from 2590 km s-1 to 2611 km s-1. H i velocities in the detached region are similar to those in NE of the main galaxy body The systematic change in PA ( 90∘) of the iso-velocity contours in the main body, indicates the H i disc is significantly warped. Based on the H i major and minor axes of the main body of the galaxy in medium resolution H i map we estimated the inclination of the H i disc at 67∘. Using this inclination and W20 from the medium resolution SdI–2 cube and estimated Vrot = 41 km s-1 using equation 1. We also attempted to use bbarolo to fit a 3D model to the GMRT H i medium resolution cube which gave a fit with an inclination 60∘and Vrot 35 km s-1, but the low number of beams across the disc ( 3) and low S/N ratio in the cube meant we could not place a strong reliance on the fit, but the inclination and Vrot from the two methods are in reasonable agreement. The PV diagram (Figure 4) is from a cut (PA =23.3∘) oriented along the H i disc’s major axis. The PV diagram is consistent with a bulk of H i consisting of a rotating disc with the detached NE region only appearing in a narrow range of velocities ( 2590 km s-1 to 2611 km s-1). Figure 4 also shows low level emission extending NE from main H i body toward the detached H i region and indicating the two H i structure are likely to be associated. This is discussed further in section 4.2.
4 Discussion
4.1 Dark matter halos
Ideally a UDG’s dynamical mass would be determined using its H i rotation curve which in the field or in groups can probe a galaxy’s dynamical mass well beyond the radius of its stellar disk. By fitting a H i rotation curve to DM halo models the mass and mass profile of the DM halo can be estimated. But in clusters because of the absence of H i due to efficient H i stripping by the cluster environment, dynamical and DM halo mass estimates to date are typically based on globular cluster studies. (e.g. Beasley & Trujillo, 2016; Beasley et al., 2016; van Dokkum et al., 2018; van Dokkum et al., 2019b, a) This approach is supported by the scaling relation between the number of globular clusters and the host galaxy’s halo virial mass (Burkert & Forbes, 2020), although the impact of the cluster on a UDGs globular population remain unclear (Forbes et al., 2020a). In the case of the Coma cluster UDG DF–44, which has the largest known DM halo mass of M200 = 1011 – 1012, stellar kinematics provided the dynamical mass (van Dokkum et al., 2019c). There are a small number of Coma UDGs, like DF–44, which have high numbers of globular clusters per unit stellar mass implying extremely massive DM halos with two thirds of Coma UDGs ( 1.5 kpc) having halo masses 1011 M⊙ based on globular cluster–DM halo mass scaling relations Forbes et al. (2020a). These halo masses are consistent with the failed Milky Way mass galaxies. Earlier globular cluster-based studies of galaxy cluster UDGs had indicated that while high dynamical to stellar mass ratios were common, e.g. VCC 1287 and DF 17, typically those studies implied dwarf mass DM halos (e.g. Beasley & Trujillo, 2016; Beasley et al., 2016).
An important recent development has been reports of baryon dominated UDGs based on globular cluster studies (van Dokkum et al., 2018; van Dokkum et al., 2019b, a) and resolved H i Mancera Piña et al. (2019, 2020). Zaritsky (2017), using scaling relations, suggested that UDGs may span a range of DM halo masses between those typically found in large spirals to dwarf galaxies, but further observations are needed to confirm this. Deriving an accurate estimate of a UDG’s DM content from H i requires a rotation curve extracted from resolved H i observations. To date only a few UDGs have been mapped in H i (e.g. Leisman et al., 2017; Sengupta et al., 2019; Mancera Piña et al., 2019). Interestingly, several of these UDGs with resolved H i show an apparent departure from the McGaugh et al. (2000) baryonic Tully Fisher relation (BTFR). Analysis of the DM content of six of the UDGs in the Leisman sample of isolated H i detected UDGs (Mancera Piña et al., 2019, 2020) indicates that those galaxies are baryon dominated within their , see Figure 4 in Mancera Piña et al. (2019), although their results are based on a limited number of bbarolo (Di Teodoro & Fraternali, 2015) 3D kinematic tilted–ring disc model fits for each galaxy. A similar, although lower magnitude, departure from the BTFR was reported in Sengupta et al. (2019) for the UDG, UGC 2162 also derived from bbarolo fitting. Confirmation of a baryon dominated population of UDGs has important implications for the origin of those UDGs. Additionally, the Mancera Piña et al. (2019, 2020) galaxies as well as UGC 2162 have a lower Vrot compared to normal dwarf galaxies of similar H i mass (Mancera Piña et al., 2020; Sengupta et al., 2019). This is consistent with the results from the larger Leisman et al. (2017) sample which found the mean velocity width, W50, for UDGs was significantly narrower (44 km s-1) than for ALFALFA galaxies with a similar selection criteria 119 km s-1).
As noted in section 3.2 the bbarolo 3D kinematic tilted–ring disc models to the H i cube for UDG–B1 failed and for SdI–2 the fit provided only a poorly constrained estimate the DM halo properties. So as an alternative, we estimated their dynamical masses () from the available H i properties. We did this using the H i radii from the medium resolution GMRT integrated H i maps for UDG–B1 and SdI–2 ( 4.0 kpc and 6.8 kpc respectively) and their inclination corrected Vrot 148 km s-1 (UDG–B1) and 41 km s-1 (SdI–2). Using this method their respective was estimated at 45.9 109 M⊙ and 2.7 109 M⊙. The baryonic masses () of the galaxies ( 1.4 + ) from Table 2 equal 1.76 109 M⊙ and 0.35 109 M⊙ for UDG–B1 and SdI–2, respectively. The 1.4 factor applied to the H i masses was to adjust for the helium and molecular gas content of the UDGs. Based on these values the baryon fractions for UDG–B1 and SdI–2 are 0.05 and 0.14, respectively. These fractions indicate that, within the radii where H i was detected, both UDG–B1 and the main body of SdI–2 are both dark matter dominated.
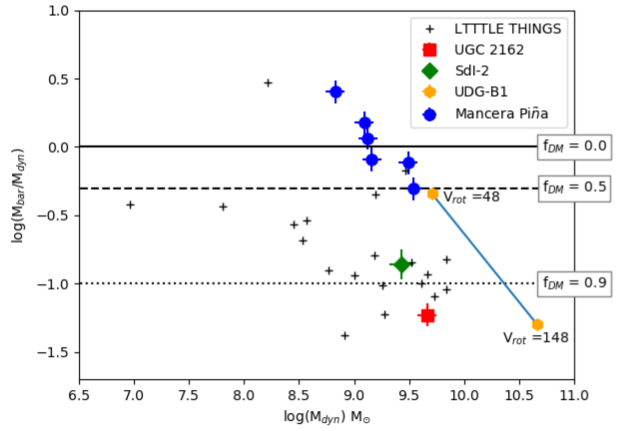
However as noted in Section 3.2, the UDG–B1 inclination corrected Vrot estimate of 148 km s-1 derived from from the H i axial ratio is anomalously high. If instead we use Vrot = 48 km s-1 based on the optical axial ratio it implies a = 5.1 109 M⊙ and baryon fraction ( / ) increases to 0.45. In figure 6, originally from Mancera Piña et al. (2020), we show the log of the ratio of baryonic to dynamical mass versus the log of dynamical mass for UDG–B1, SdI–2, and UGC 2162 (Sengupta et al., 2019) as well as the galaxies from the LITTLE THINGS (Oh et al., 2015), and Mancera Piña et al. (2019) as shown in Mancera Piña et al. (2020). For UDG– B1 we show the masses derived using both Vrot = 148 km s-1 and 48 km s-1, with a blue line joining the two sets of derived masses. The horizontal lines indicate the DM fraction (fDM) shown at the right–hand margin. For UDG–B1 the baryonic (or inversely DM) fraction depends on the adopted Vrot which in turn depends on whether the H i or optical axial ratio is used. Use of the optical axial ratio implies Vrot = 48 km s-1 and a baryon fraction of 0.45, which is close to that of the galaxy in the Mancera Piña et al. (2019) sample with the lowest baryon fraction. Alternatively, using the H i axes ratio and Vrot =148 km s-1 gives much lower baryon fraction of 0.05, which would place it near the extreme of DM dominated dwarfs. As observed in Section 3.2 there are reasons to think the Vrot values from which these baryonic fractions are derived are upper and lower limits. As a result we consider its likely that true baryonic fraction of UDG–B1 lies at an intermediate point in range 0.05 to 0.45 and thus is likely be similar to the median value for the LITTLE THINGS dwarfs, see Figure 6.
Hence, in terms of DM content, our estimates of for SdI–2, and the uncertainly for UDG–B1, suggest the DM halos within the H i radii resemble normal DM dominated dwarf galaxies. Figure 5 shows the / v for UDG–B1, SdI–2 and a selection of UDGs from the literature, including the baryon dominated UDGs reported in (Mancera Piña et al., 2019, 2020), which have 3 kpc. and their uncertainties in the plot are from the literarure sources, principally from Leisman et al. (2017) which are based on their own photometry of SDSS images. We note from the Figure that UDG–B1 has a within the range where baryon dominated UDGs have been reported. This suggests that for UDGs outside clusters their is determined by factor other than their baryon fraction and ratio.
4.2 Evidence for ongoing interactions
Figure 2 (left middle panel) shows the IAC stripe 82 optical image of the UDG–B1 and the two small over plotted yellow circles indicate the positions and 3 arcsec diameters of the SDSS spectra fibres. Each spectra is from a different galaxy with the spectrum in the south from UDG–B1 and the one above it from a background galaxy. With the aid of the SDSS spectra and a NUV (GALEX) image (Figure 2 – lower right panel) we interpret the optical image as showing that UDG–B1 is projected in front of a z=0.69010..0005 background galaxy and extends in faint blue emission 30 arcsec (12.5 kpc) north of the strong star forming region detected in the SDSS UDG–B1 spectrum. This picture of UDG–B1’s elongated N–S morphology is confirmed by the GALEX NUV emission in Figure 2 – lower left panel.
From the UDG–B1 GMRT medium and high resolution H i maps we see the high column density H i is located W of the optical/NUV axes (Figure 2). UDG–B1’s is 3.7 kpc (Román & Trujillo, 2017) and the NED major optical axis of 0.35 arcmin indicates the is 4.4 kpc. Based on the first order 43.3 arcsec major axis estimate from medium resolution H i map we estimate the at 9 kpc and the / ratio = 2.0. So even allowing for the asymmetric nature of the H i distribution and uncertain inclination the UDG–B1 / ratio is consistent with the typical / of 1.8 for late type galaxies (Broeils & Rhee, 1997), i.e, we see no clear indication that the UDG–B1 H i disc is truncated.
The low resolution H i velocity field for UDG–B1 (Figure 2 – upper right panel) shows an overall rotation pattern running approximately perpendicular to the optical/NUV axes, but the change in iso–velocity angle from NE to W suggesting a possible warped disc. The H i/optical axis offset, H i warp and anomalous are all signatures of an interaction well within the H i relaxation time scale of 0.7 Gyr (Holwerda et al., 2011). Such an interaction is likely to have been with a member of HCG 25 group. As noted in Section 3.1 the medium and high–resolution H i maps show the current blue star–forming region is offset in projection from the H i column density maxima which could be a further signature of a recent tidal interaction. A galaxy’s ratio is a measure of the asymmetry in its integrated H i flux density profile (within its W20 velocity range) at velocities above and below the galaxy’s systemic velocity (VHI). = 1.00 is a perfectly symmetric spectrum and 1.26 presents a clear asymmetry signature (Espada et al., 2011; Scott et al., 2018; Reynolds et al., 2020). The for UDG–B1 is 1.23 0.11 providing only marginal support for a recent interaction, particularly in because low signal to noise is understood to increase values (Watts et al., 2020).
UDG–B1’s SDSS spectrum cannot be considered representative of the galaxy as a whole because of the 3 arcsec diameter the SDSS spectrum fibre samples only 2.6% of the UDG–B1 optical disc area and this region has a bluer color than the rest of the galaxy (Román & Trujillo, 2017). Measurements derived from the spectrum, including oxygen abundance, 12+log(O/H) = 8.010.39, and SFR(H) 0.0033 M⊙ yr-1 are set out in Table 3. In this table 12+log(O/H) was obtained as the average from the Marino et al. (2013), (Kobulnicky et al., 1999, lower branch) and Pettini & Pagel (2004) calibrators. The starformation rate was calculated assuming the Kennicutt (1998) conversion formula after correction for Chabrier IMF. The spectrum was corrected for galactic extinction and internal extinction was insignificant. The sub–solar 12 +Log(O/H) values for UDG–B1 indicate that the gas, at least at the position of the spectrum, is unlikely to have been acquired from more evolved members of HCG 25. Additionally, analysis of the SDSS spectra by Román & Trujillo (2017) indicates a stellar age 0.1 Gyr for the region within the SDSS fibre. This young stellar age may simply reflect a local stochastic increase in UDG–B1s star formation, but presence of H i perturbation signatures make it more likely the recent enhancement of SF was triggered by an interaction. In summary the UDG–B1 H i morphology and kinematics both show indications of a recent interaction, which has perturbed its H i disc, most likely with another member of HCG 25 and the blue color and young age of the stellar population at the position of the SDSS spectrum is consistent with star formation triggered by the interaction.
| I()/I(H) 100 | |
|---|---|
| SII6731 | 257.08 8.41 |
| SII6717 | 95.64 3.85 |
| NII6584 | 3.88 0.09 |
| H | 177.78 5.59 |
| OIII5007 | 257.08 8.41 |
| OIII4959 | 95.64 3.85 |
| H | 100.00 4.47 |
| OII3727 | 253.08 14.54 |
| F(H) 10 -16 erg cm-2 s-1 | 7.72 0.07 |
| F(H) 10 -16 erg cm-2 s-1 | 4.34 0.10 |
| H/H 100 | 177.78 0.06 |
| c(H) | 0.00 0.03 |
| EW(H) | 115.0 |
| EW(H) | 41.0 |
| log(OIII/H) | 0.41 0.03 |
| log(NII/H) | -1.66 0.04 |
| log(SII/H) | -0.53 0.09 |
| SFR(H) M☉ yr-1 | 0.003 0.001 |
| M(HII) 105 M☉ | 1.71 |
| 12+log(O/H)M | 7.98 0.19 |
| 12+log(O/H)KL | 7.970.26 |
| 12+log(O/H)PP | 8.070.22 |
| 12+log(O/H) | 8.01 0.39 |
SdI–2’s two most striking features are its high / ratio of 28.9 (see Figure 5), which is comparable to the well known extremely gas–rich dwarf DDO 154 (/ = 31 Watts et al., 2018), and it’s detached H i extended NE region (Figure 3). Given SdI–2’s isolation, ram pressure stripping can almost certainly be ruled out as an explanation for the SdI–2 detached H i extension. So, the most likely explanation for the detached H i extension is that it is debris from the accretion of a smaller gas–rich satellite. There are examples in the literature of isolated galaxies with one-sided H i tails and warped discs attributed to the accretion of or interactions with satellite galaxies (Martínez-Delgado et al., 2009; Sengupta et al., 2012; Scott et al., 2014). However, this proposition is only marginally supported by analysis of the integrated GMRT H i spectrum profile, = 1.200.07. While the evidence from the H i profile analysis is inconclusive, the resolved integrated H i maps and velocity field maps (from the medium resolution cube) provide signatures characteristic of a recent interaction. This demonstrates the higher sensitivity to recent H i interactions of resolved mapping compared to H i profile analysis.
Figure 3, lower left panel, shows a smoothed NUV (GALEX) image of SdI–2. SDSS catalogues the clump marked ’D’ in the figure as a star but it could alternatively be a background galaxy. Optically, SdI–2 consists of an elongated region of bright starforming clumps oriented approxmately N-S. Three of these clumps, SdI–2–a, SdI–2–b and SdI–2–c are identified in the Figure using the nomenclature from Bellazzini et al. (2017). These bright clumps are surrounded by a larger region of low surface brightness NUV emission (Figure 3). This low surface brightness emission is more extened in the NE, extending 20 arcsec (3.6 kpc) NE of the optical centre. Bellazzini et al. (2017) reported 12+log(O/H) of 8.10.02 for clumps SdI–2–a and SdI–2–b, with the difference between them being indistinguishable within the errors. Those authors also reported on a spectrum from the optical centre, SdI–2-c, with model fits indicating a stellar metallicity of Z=0.002 and age of 200 Myr. This spectrum differed from SdI–2–a and SdI–2–b in not having any significant emission lines, presumably because of a lack of ionising photons. The SdI–2–c log(N/O) from Bellazzini et al. (2017) is -1.7 implying a primary production of nitrogen in a low metallicity environment. However, the observed uncertainties of N/O at 12 + log(O/H) 8.3 has been attributed in the literature to a loss of heavy elements via a strong burst (galactic winds) in the recent past or because of the delayed production of oxygen and nitrogen by massive and intermediate–mass stars assuming a low star formation efficiency. So, a possible explanation of the lack of emission line in the SdI–2–c spectrum and the NUV halo is a recent strong bust of SF, but the difficultly with this scenario is the absence of the massive star clusters (M* 104 M⊙) this burst should have produced. We, therefore, conclude that the brightest observed starforming clumps are unlikely to be the result of strong recent star burst. SdI–2’s H i morphology, together with its regular rotating, but wrapped, main body H i disc as well as the perturbed H i kinematics in the NE of the main H i body at similar velocities to those in the detached H i extension (Figure 3 Lower right panel) are suggestive of a recent tidal interaction. While, SdI–2–a and SdI–2–b could be remnants of an absorbed satellite or star forming regions triggered by such an interaction we do not have definitive proof of this.
5 Summary and concluding remarks
We report on H i mapping using the GMRT for two ultra–diffuse galaxies (UDGs) from contrasting environments. UDG–B1 is projected 225 kpc SW of the compact group HCG 25 while Secco–dI–2 (SdI–2) is a relatively isolated UDG. These two UDGs also have contrasting effective radii with of 3.7 kpc (similar to the Milky Way) and 1.3 kpc respectively. The H i morphology and kinematics of UDG–B1 suggest a recent interaction has perturbed both the morphology and kinematics of its H i. UDG–B1’s subsolar metallicity suggests it did not acquire a significant gas mass in the interaction. SdI–2 has two striking features, first its ratio is 28.9 and despite its isolation, it displays a one–sided detached extended H i region to the NW. It’s ratio implies a very low historic star formation efficiency. Based on our estimate of the baryon fraction within H i radius for SdI–2 is 0.14, indicating that galaxy is dark matter dominated, at least within the radius in which H i is detected. However, the baryon fraction for UDG-B1 is quite uncertain because of large uncertainties about the H i disc’s inclination and the question as to whether its H i is in dynamical equilibrium. As a result we were unable to reliably estimate the UDG–B1 DM fraction. The higher / ratio in SdI–2 compared to UDG–B1 is consistent with the result from Papastergis et al. (2017) which indicated UDGs further from group centres have higher / ratios. In the case of UDG–B1 morphological evidence of tidal disturbance and possible stripping (and possibly ram pressure stripping) could explain the smaller stellar mass and redder colour of UDGs at distances closer to group centres as reported in Papastergis et al. (2017). Our study highlights the importance of high spatial and spectral resolution H i observations for the study of the dark matter properties of UDGs. While the narrow range of H i velocities in UDGs argues for a velocity resolution below 10 km s-1, going beyond this level also requires good signal to noise, which adds a further burden to already demanding observations.
Acknowledgements
We thank the staff of the GMRT who have made these observations possible. The GMRT is operated by the National Centre for Radio Astrophysics of the Tata Institute of Fundamental Research. TS acknowledge support by Fundação para a Ciência e a Tecnologia (FCT) through national funds (UID/FIS/04434/2013), FCT/MCTES through national funds (PIDDAC) by this grant UID/FIS/04434/2019 and by FEDER through COMPETE2020 (POCI-01-0145-FEDER-007672). TS also acknowledges the support by the fellowship SFRH/BPD/103385/2014 funded by the FCT (Portugal) and POPH/FSE (EC). TS additionally acknowledges support from DL 57/2016/CP1364/CT0009 from The Centro de Astrofísica da Universidade do Porto. PL is supported by a work contract DL 57/2016/CP1364/CT0010 funded by the FCT. This work was supported by FCT/MCTES through national funds (PIDDAC) by this grant PTDC/FIS-AST/29245/2017. Support for this work was provided by the National Research Foundation of Korea to the Center for Galaxy Evolution Research (No. 2010-0027910) and NRF grant No. 2018R1D1A1B07048314. This research has made use of the NASA/IPAC Extragalactic Database (NED) which is operated by the Jet Propulsion Laboratory, California Institute of Technology, under contract with the National Aeronautics and Space Administration. This research has made use of the Sloan Digital Sky Survey (SDSS). Funding for the SDSS and SDSS-II has been provided by the Alfred P. Sloan Foundation, the Participating Institutions, the National Science Foundation, the U.S. Department of Energy, the National Aeronautics and Space Administration, the Japanese Monbukagakusho, the Max Planck Society, and the Higher Education Funding Council for England. The SDSS Web Site is http://www.sdss.org/. This research made use of APLpy, an open-source Python plotting package hosted at http://aplpy.github.com, (Robitaille & Bressert, 2012).
Data Availability
The data underlying this article will be shared on reasonable request to the corresponding author.
References
- Amorisco & Loeb (2016) Amorisco N. C., Loeb A., 2016, MNRAS, 459, L51
- Baars et al. (1977) Baars J. W. M., Genzel R., Pauliny-Toth I. I. K., Witzel A., 1977, A&A, 61, 99
- Baushev (2016) Baushev A. N., 2016, J. Cosmology Astropart. Phys., 2016, 018
- Beasley & Trujillo (2016) Beasley M. A., Trujillo I., 2016, ApJ, 830, 23
- Beasley et al. (2016) Beasley M. A., Romanowsky A. J., Pota V., Navarro I. M., Martinez Delgado D., Neyer F., Deich A. L., 2016, ApJ, 819, L20
- Bellazzini et al. (2017) Bellazzini M., Belokurov V., Magrini L., Fraternali F., Testa V., Beccari G., Marchetti A., Carini R., 2017, MNRAS, 467, 3751
- Borthakur et al. (2010) Borthakur S., Yun M. S., Verdes-Montenegro L., 2010, ApJ, 710, 385
- Broeils & Rhee (1997) Broeils A. H., Rhee M.-H., 1997, A&A, 324, 877
- Burkert & Forbes (2020) Burkert A., Forbes D. A., 2020, AJ, 159, 56
- Carleton et al. (2018) Carleton T., Errani R., Cooper M., Kaplinghat M., Peñarrubia J., 2018, 2018arXiv180506896C,
- Conselice (2018) Conselice C. J., 2018, Research Notes of the American Astronomical Society, 2, 43
- Di Cintio et al. (2017) Di Cintio A., Brook C. B., Dutton A. A., Macciò A. V., Obreja A., Dekel A., 2017, MNRAS, 466, L1
- Di Teodoro & Fraternali (2015) Di Teodoro E. M., Fraternali F., 2015, MNRAS, 451, 3021
- Espada et al. (2011) Espada D., Verdes-Montenegro L., Huchtmeier W. K., Sulentic J., Verley S., Leon S., Sabater J., 2011, A&A, 532, A117
- Flewelling et al. (2016) Flewelling H. A., et al., 2016, arXiv e-prints, p. arXiv:1612.05243
- Forbes et al. (2020a) Forbes D. A., Alabi A., Romanowsky A. J., Brodie J. P., Arimoto N., 2020a, MNRAS, 492, 4874
- Forbes et al. (2020b) Forbes D. A., Dullo B. T., Gannon J., Couch W. J., Iodice E., Spavone M., Cantiello M., Schipani P., 2020b, MNRAS, 494, 5293
- Guo et al. (2020) Guo Q., et al., 2020, Nature Astronomy, 4, 246
- Holwerda et al. (2011) Holwerda B. W., Pirzkal N., Cox T. J., de Blok W. J. G., Weniger J., Bouchard A., Blyth S.-L., van der Heyden K. J., 2011, MNRAS, 416, 2426
- Janssens et al. (2019) Janssens S. R., Abraham R., Brodie J., Forbes D. A., Romanowsky A. J., 2019, ApJ, 887, 92
- Kennicutt (1998) Kennicutt Robert C. J., 1998, ApJ, 498, 541
- Kobulnicky et al. (1999) Kobulnicky H. A., Kennicutt Robert C. J., Pizagno J. L., 1999, ApJ, 514, 544
- Koda et al. (2015) Koda J., Yagi M., Yamanoi H., Komiyama Y., 2015, ApJL, 807, L2
- Lagos et al. (2011) Lagos P., Telles E., Nigoche-Netro A., Carrasco E. R., 2011, AJ, 142, 162
- Leisman et al. (2017) Leisman L., et al., 2017, ApJ, 842, 133
- Liao et al. (2019) Liao S., et al., 2019, MNRAS, 490, 5182
- Mancera Piña et al. (2019) Mancera Piña P. E., et al., 2019, arXiv e-prints, p. arXiv:1909.01363
- Mancera Piña et al. (2020) Mancera Piña P. E., et al., 2020, ArXiv 180404139L, p. arXiv:2004.14392
- Marino et al. (2013) Marino R. A., et al., 2013, A&A, 559, A114
- Martínez-Delgado et al. (2009) Martínez-Delgado D., Pohlen M., Gabany R. J., Majewski S. R., Peñarrubia J., Palma C., 2009, ApJ, 692, 955
- McGaugh et al. (2000) McGaugh S. S., Schombert J. M., Bothun G. D., de Blok W. J. G., 2000, ApJL, 533, L99
- Oh et al. (2015) Oh S.-H., et al., 2015, AJ, 149, 180
- Papastergis et al. (2017) Papastergis E., Adams E. A. K., Romanowsky A. J., 2017, A&A, 601, L10
- Pettini & Pagel (2004) Pettini M., Pagel B. E. J., 2004, MNRAS, 348, L59
- Reynolds et al. (2020) Reynolds T. N., Westmeier T., Staveley-Smith L., Chauhan G., Lagos C. D. P., 2020, MNRAS, 493, 5089
- Robitaille & Bressert (2012) Robitaille T., Bressert E., 2012, APLpy: Astronomical Plotting Library in Python, Astrophysics Source Code Library (ascl:1208.017)
- Román & Trujillo (2017) Román J., Trujillo I., 2017, MNRAS, 468, 4039
- Sánchez-Janssen et al. (2010) Sánchez-Janssen R., Méndez-Abreu J., Aguerri J. A. L., 2010, MNRAS, 406, L65
- Scott et al. (2014) Scott T. C., et al., 2014, A&A, 567, A56
- Scott et al. (2018) Scott T. C., Brinks E., Cortese L., Boselli A., Bravo-Alfaro H., 2018, MNRAS, 475, 4648
- Sengupta et al. (2012) Sengupta C., et al., 2012, A&A, 546, A95
- Sengupta et al. (2019) Sengupta C., Scott T. C., Chung A., Wong O. I., 2019, MNRAS, 488, 3222
- Spekkens & Karunakaran (2018) Spekkens K., Karunakaran A., 2018, ApJ, 855, 28
- Springob et al. (2005) Springob C. M., Haynes M. P., Giovanelli R., Kent B. R., 2005, ApJS, 160, 149
- Tanoglidis et al. (2020) Tanoglidis D., et al., 2020, ArXiv 180404139L, p. arXiv:2006.04294
- Tovmassian et al. (1999) Tovmassian H. M., Martinez O., Tiersch H., 1999, A&A, 348, 693
- Trujillo et al. (2017) Trujillo I., Roman J., Filho M., Sánchez Almeida J., 2017, ApJ, 836, 191
- Wang et al. (2020) Wang J., Yang K., Zhang Z.-Y., Fang M., Shi Y., Liu S., Li J., Li F., 2020, MNRAS, 499, L26
- Watts et al. (2018) Watts A. B., Meurer G. R., Lagos C. D. P., Bruzzese S. M., Kroupa P., Jerabkova T., 2018, MNRAS, 477, 5554
- Watts et al. (2020) Watts A. B., Catinella B., Cortese L., Power C., 2020, MNRAS, 492, 3672
- Yagi et al. (2016) Yagi M., Koda J., Komiyama Y., Yamanoi H., 2016, ApJS, 225, 11
- Yozin & Bekki (2015) Yozin C., Bekki K., 2015, MNRAS, 452, 937
- Zaritsky (2017) Zaritsky D., 2017, MNRAS, 464, L110
- van Dokkum et al. (2015) van Dokkum P. G., Abraham R., Merritt A., Zhang J., Geha M., Conroy C., 2015, ApJL, 798, L45
- van Dokkum et al. (2018) van Dokkum P., et al., 2018, Nature, 555, 629
- van Dokkum et al. (2019a) van Dokkum P., Danieli S., Romanowsky A., Abraham R., Conroy C., 2019a, Research Notes of the American Astronomical Society, 3, 29
- van Dokkum et al. (2019b) van Dokkum P., Danieli S., Abraham R., Conroy C., Romanowsky A. J., 2019b, ApJL, 874, L5
- van Dokkum et al. (2019c) van Dokkum P., et al., 2019c, ApJ, 880, 91
- van der Burg et al. (2017) van der Burg R. F. J., et al., 2017, A&A, 607, A79
APPENDIX A
UGC 2690
H i was also detected in the SAc galaxy UGC 2690, within GMRT UDG B1 field of view, at VHI = 6275 4 km s-1 with W20 340 8 km s-1. The H i morphology from the medium resolution cube is shown in Figure 7 and displays an asymmetric increase in minor axis diameter NE of the optical centre. A similar asymmetry is seen in optical image. It seems likely both the H i and optical features are due to a recent interaction with another group member. The VHI = 6269 2 km s-1 and W20 = 340 8 km s-1 from the GBT spectrum (Springob et al., 2005) agree within the uncertainties to the GMRT values. Measured from the GMRT spectrum the = 1.220.09 and , as defined by Reynolds et al. (2020), = 5.36. As was the case for SdI–2 the resolved mapping is more sensitive to indications of perturbation than the H i profile parameters. Figure 8 shows the bbarolo velocity field, data, model and residuals from the medium resolution cube and the PV diagram (PA =128∘) for UGC 2690. The bbarolo model fit indicates an H i Vrot = 150 km s-1 inclination of 79∘.