An oversized magnetic sheath wrapping around the parsec-scale jet in 3C 273
Abstract
In recent studies, several AGN have exhibited gradients of the Faraday Rotation Measure (RM) transverse to their parsec-scale jet direction. Faraday rotation likely occurs as a result of a magnetized sheath wrapped around the jet. In the case of 3C 273, using Very Long Baseline Array multi-epoch observations at 5, 8 and 15 GHz in 2009–2010, we observe that the jet RM has changed significantly towards negative values compared with that previously observed. These changes could be explained by a swing of the parsec-scale jet direction which causes synchrotron emission to pass through different portions of the Faraday screen. We develop a model for the jet–sheath system in 3C 273 where the sheath is wider than the single-epoch narrow relativistic jet. We present our oversized sheath model together with a derived wide jet full intrinsic opening angle and magnetic field strength G and thermal particle density at the wide jet–sheath boundary 230 pc downstream (deprojected) from its beginning. Most of the Faraday rotation occurs within the innermost layers of the sheath. The model brings together the jet direction swing and long-term RM evolution and may be applicable to other AGN jets that exhibit changes of their apparent jet direction.
ApJ
1 Introduction
General relativistic magnetohydrodynamic (GRMHD) simulations illustrate the key role of magnetic fields in the formation of relativistic jets in Active Galactic Nuclei (AGN; e.g. Meier et al., 2001; Vlahakis & Königl, 2004; Tchekhovskoy et al., 2011; Zamaninasab et al., 2014). The topology and structure of these magnetic fields remains an active area of research. The rotation of the central supermassive black hole twists magnetic field lines into a helical shape that can be revealed by observations of transverse Faraday rotation gradients. GRMHD simulations also show that accreting supermassive black hole systems naturally form a spine–sheath structure of the relativistic jets as a result of transverse velocity stratification in the outflows (e.g. McKinney, 2006; Nakamura et al., 2018). The sheath, which may be a magnetized screen surrounding the jet or the jet boundary layer, has been suggested as a plausible source of the Faraday rotation (e.g. Asada et al., 2008).
Very Long Baseline Interferometry (VLBI) observations of parsec-scale AGN jets (e.g., Zavala & Taylor, 2003, 2004; O’Sullivan & Gabuzda, 2009) reveal Faraday rotations greater than 45° and a linear dependence of the polarization angle with the wavelength squared. This implies that most of Faraday rotation occurs within the thermal magnetized media located in close proximity to the jet (e.g., Zavala & Taylor, 2004). The detection of a Rotation Measure (RM) gradient across the jet (Asada et al., 2002) in the quasar 3C 273 (z=0.158; Strauss et al. 1992), and subsequently in other AGN (e.g., Gabuzda et al., 2014; Kravchenko et al., 2017), support the scenario that the sheath is threaded by a helical magnetic field.
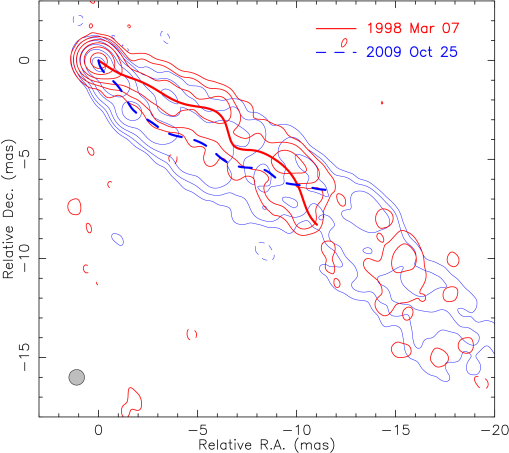
A number of studies have revealed that AGN jets change their direction on parsec-scales over time (e.g., Savolainen et al., 2006; Lister et al., 2013), including 3C 273 (Fig. 1). As different components are ejected in different directions into the jet, they fill in the full jet cross-section. Therefore, the true jet width appears wider after stacking together observations performed over many years (Pushkarev et al., 2017; Kovalev et al., 2020). Hereafter we call the latter a wide jet, while a single-epoch jet is called a narrow jet.
3C 273 (1226023) has been extensively studied with polarimetric VLBI observations, and it remains the best-established case of a transverse RM gradient in AGN jets. In this paper, we present a new multi-epoch high-resolution polarimetric study of 3C 273, and Faraday rotation measure analysis, focusing on its long-term evolution, in order to find a connection between the apparent jet orientation and the values of the Rotation Measure. In Section 2, we describe our observations and data reduction steps. In Section 3, we collect several transverse slice measurements from published research and compare them with our measurements. In Section 4, we present a model of an oversized sheath wrapping around the parsec-scale jet in 3C 273 and discuss the geometry of the jet and physical parameters of the plasma in the sheath.
One milliarcsecond corresponds to a projected linear scale of 2.71 pc at the redshift of 3C 273, assuming km s-1 Mpc-1, , and . For our calculations we use the viewing angle and the corresponding intrinsic full opening angle of the narrow single-epoch jet of 3C 273 (Lisakov et al., 2017).
2 Observations and data reduction
The observations were performed with the 10-element Very Long Baseline Array (VLBA, project codes S2087A, B, C, E) on 2009 August 28, 2009 October 25, 2009 December 5, and 2010 January 26 at seven frequencies: 4.6, 5.0, 8.1, 8.4, 15.4, 23.8, 43.2 GHz with a bandwidth of 16 MHz for frequencies below 15.4 GHz and 32 MHz for 15.4 GHz and above. For the aims of this study, we consider only the 4.6–15.4 GHz frequency range, while detailed polarization analysis of the quasar in the full frequency range will be presented in a separate publication (Lisakov et al. in prep.). Data reduction and calibration, as well as other techniques used for the analysis were discussed by Lisakov et al. (2017).
The polarization calibration was performed in the same manner as described in Kravchenko et al. (2017) and Kravchenko & Kovalev (2017), including instrumental polarization of the antennas that was determined with the task LPCAL in AIPS using 1308326 as a calibrator. An absolute orientation of the electric vector position angle (EVPA) was determined using the net polarization angle of 3C 273, 3C 279, OJ 287, and 1308326 provided by different monitoring programs111VLBA Polarization Calibration Resources http://www.vla.nrao.edu/astro/calib/polar/, UMRAO database https://dept.astro.lsa.umich.edu/datasets/umrao.php, and MOJAVE database http://www.physics.purdue.edu/astro/MOJAVE/. with estimated uncertainty of 5° and 4° at 4.6–8.4 and 15.4 GHz, respectively.
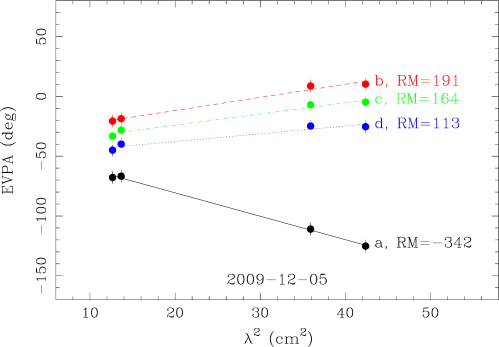
Frequency-dependent map offsets were determined using 2D cross-correlation on optically thin portions of the jet (Lisakov et al., 2017) and were used to align images at the different frequencies. Average map offsets in the jet direction are 0.8 mas between 4.6 and 8.1 GHz and 0.6 mas between 8.1 and 15.4 GHz. The Faraday rotation analysis was performed separately in two frequency ranges: low (4.6 – 8.4 GHz) and middle (8.1 – 15.4 GHz) in order to avoid smearing, which results from a convolution with larger beam sizes. Images at different frequencies were tapered to approximate the resolution of the lower frequency in the corresponding range. All maps were convolved with the restoring beam averaged over four observations at 4.6 and 8.1 GHz in corresponding frequency ranges. We calculated the polarization errors according to Hovatta et al. (2012a), and blanked all pixels whose polarized flux density did not exceed three times the polarization error. The RM is defined as a linear slope of the EVPA dependence. Examples of EVPA fits for different parts of the jet are given in Fig. 2. The solution of the n-ambiguity problem and goodness of the -fit were determined by minimizing the reduced . Accordingly, the pixels that had (which in our case of four data points and two degrees of freedom corresponds to the 95 per cent confidence level) were blanked.
3 RM images and slices
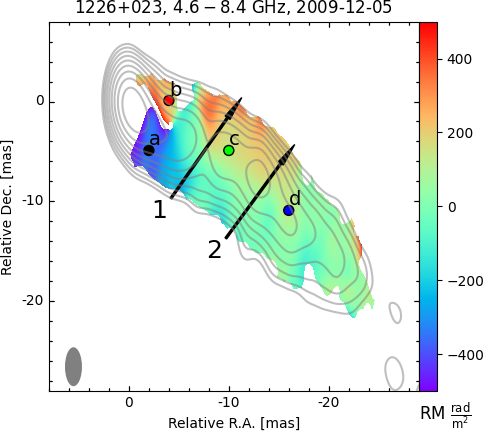
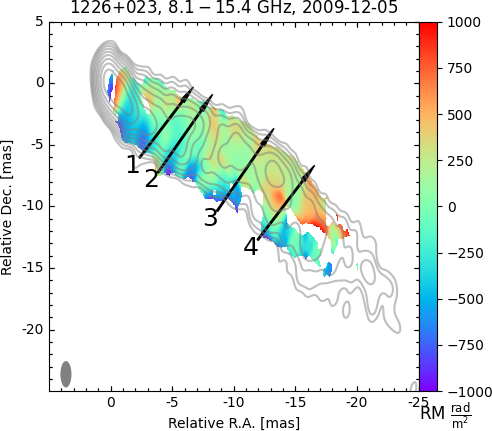
Faraday Rotation Measure images are presented in Fig. 3 for the observations at 4.6–8.4 GHz and in Fig. 4 for the 8.1–15.4 GHz range. Only a single-epoch image is presented, since the RM distribution throughout the jet is consistent over four epochs and does not change dramatically in regions downstream from the core. By the ‘core’ or ‘apparent core’, we mean the most north-eastern region of the jet in the VLBI images. We associate it with the apparent base of the jet and a surface with an optical depth (Blandford & Königl, 1979; Lobanov, 1998). The overall RM distribution is smooth and shows persistent transverse gradients throughout the whole jet length, at least up to 57 pc in projection along the jet.
The absence of detected Rotation Measure close to the apparent core of 3C 273 is usually attributed to depolarization that happens in this region (e.g. Asada et al., 2002; Hovatta et al., 2012b). We note that during our observations in 2009–2010 there was a major -ray flare detected in 3C 273 and a subsequent flare at radio-wavelengths (Lisakov et al., 2017). This is also supported by RadioAstron observations performed in 2012–2014 (Kovalev et al., 2016; Bruni et al., 2017) that show severe variability in the finest-scale structure of 3C 273 which is associated with the apparent core region. This variability together with the low level of polarized emission lead to blanking of the RM values close to the apparent jet base according to our criteria described in Section 2.
To study the long-term evolution of the Rotation Measure and its gradient across the jet, we have collected previously published results on 3C 273. Asada et al. (2002) and Asada et al. (2008) reported a gradient of RM values taken across the jet at 4.6–8.6 GHz mas downstream from the apparent core. In their observations performed on 1995 December 9, 1995 November 22, and 2002 December 15, RM values across the jet from south to north have ranges rad m-2 and rad m-2 , which correspond to a gradient of rad m-2 mas-1 . Zavala & Taylor (2005) reported a much larger transverse gradient of 500 rad m-2 mas-1 taken slightly closer to the apparent core at GHz. Their observations were performed in 2000 January 27 and 2000 August 11, and also exhibit mostly positive RM values along the slice, rad m-2 and rad m-2 at the two epochs, respectively.
Wardle (2018) compiled most of the RM measurements including those of Chen (2005) performed in 1999–2000 at GHz. All RM values transverse to the 3C 273 jet are positive, ranging within rad m-2 at the same location as in the previous works. RM gradients in these observations were rad m-2 mas-1 .
A notable new result came from the research of Hovatta et al. (2012a) based on 8–15 GHz observations on 2006 March 9 and 2006 June 15, where the authors for the first time observed significant negative RM values, in contrast to earlier observations. Hovatta et al. (2012a) report RM values across the jet ranging within rad m-2 , yielding a RM gradient of the same sign rad m-2 mas-1 .
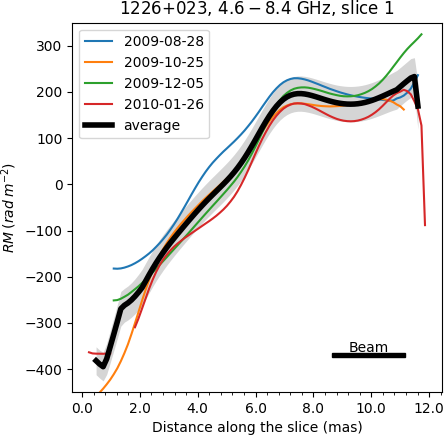
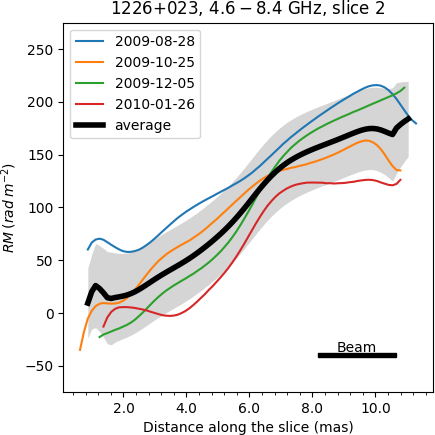
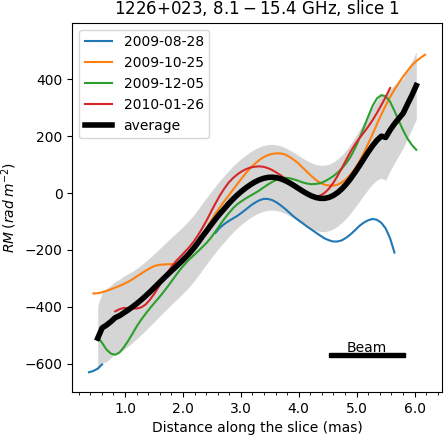
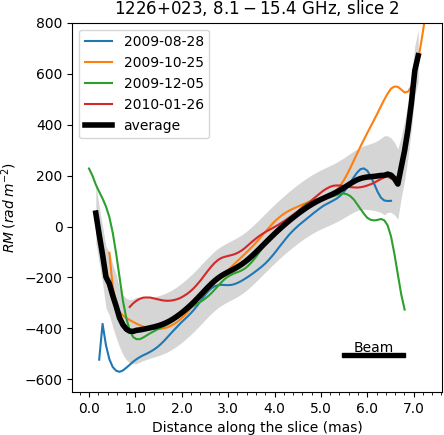
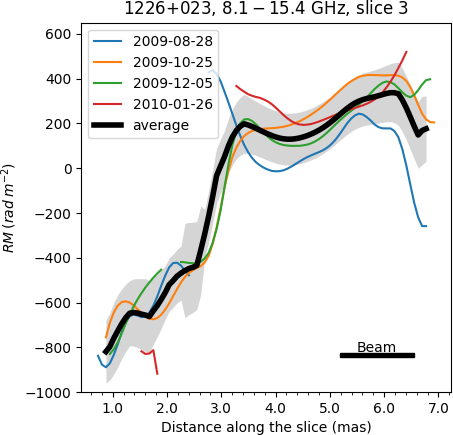
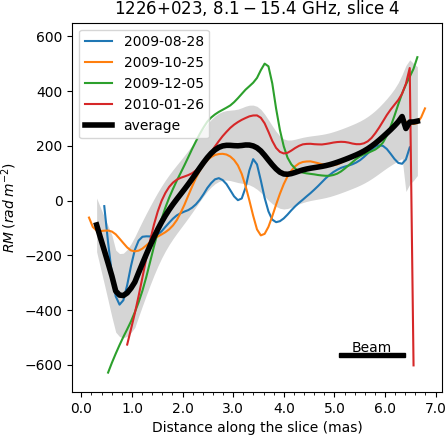
To compare with previous studies, we have analyzed transverse slices from our data taken at 9 mas (as in Asada et al., 2008) and 16 mas (control slice) from the apparent jet base at 4.6–8.4 GHz and 5.5 mas (as in Zavala & Taylor, 2005), 7 mas (as in Hovatta et al., 2012a, slice 2), 13 mas (as in Hovatta et al., 2012a, slice 3), and 16 mas (control slice) at 8.1–15.4 GHz.
As is seen in Fig. 3 (slice 1) and Fig. 4 (slice 1), closer to the apparent core, RM values across the jet are negative at the southern edge of the jet and positive at the northern edge. The range of values is rad m-2 at 4.6–8.4 GHz and rad m-2 at 8.1–15.4 GHz. The latter agrees well with the measurements of Hovatta et al. (2012a). On the other hand, at 4.6–8.4 GHz, farther from the jet beginning, the RM values are positive throughout the whole cross-section of the jet, see Fig. 3 (slice 2). These positive RM profiles are more similar to the 4.6–8.6 GHz results of Asada et al. (2008).
At middle frequencies, transverse RM variations are present at every separation from the core, showing negative values at the southern edge and positive at the northern edge. We note, that due to our higher bandwidth and longer integration times we detect a broader RM distribution across the jet with respect to previous studies, hence more negative RM values are detected at the southern edge of the jet.
4 Discussion
4.1 RM variability
With a large set of observations that span over 14 years and probe variability timescales down to several months, we can study both long-term and short-term evolution of the Rotation Measure values in the jet. We focus here on comparing transverse slices.
Fig. 3 and Fig. 4 clearly show that within the 5 months covered by our observations, the RM values across the jet at different distances from the apparent core do not change significantly. For the whole jet, net RM values change by no more than by 40 rad m-2 at 4.6–8.4 GHz and by no more than 120 rad m-2 at 8.1–15.4 GHz. These values do not exceed the uncertainty associated with the absolute EVPA calibration. Within the 5-month period covered by our observations in 2009–2010 the RM pattern in the jet of 3C 273 has remained largely constant, consistent with the measurements of Zavala & Taylor (2005) over 6 months and three years. This is in contrast to the short timescale variability over three months as reported by Hovatta et al. (2012a).
When considering variability on timescales of years, there are notable changes in the RM distribution in the jet of 3C 273. Asada et al. (2008) reported on the small changes in the RM over 7 years. But a major change appears to have occurred some time between 2003 and 2006. Namely, at 7 mas downstream the jet, there are now negative values at the southern edge of the jet. This was first discovered by Hovatta et al. (2012a) and is fully confirmed with our observations at both 4.6–8.4 GHz and 8.1–15.4 GHz, see e.g. Fig. 3 (slice 1) and Fig. 4 (slice 1).
Although there are alternative explanations of the long-term evolution of the RM values, we argue that anything outside the immediate jet vicinity fails to explain variability on the timescale of several years and large changes in RM, considering the high Galactic latitude of 3C 273 (Taylor et al., 2009).
4.2 Geometry of the jet of 3C 273
According to Lister et al. (2013), the narrow jet of 3C 273 had abruptly changed its apparent direction by in 2003. Fig. 1 shows these structural variations in the quasar jet in application to the observations of 1998 March 7 and 2009 October 25 at 15 GHz. Assuming a constant viewing angle of the overall quasar jet axis of (Lisakov et al., 2017), this translates into an intrinsic jet direction change of , larger than the intrinsic opening angle measured at a single epoch (Lisakov et al., 2017).
With a median apparent jet speed of mas yr-1 (Lister et al., 2019), structural changes should affect the jet by 2010 within about 7 mas from its apparent beginning, consistent with Fig. 1. We also note that some moving features in the jet of 3C 273 have larger apparent speeds, up to mas yr-1, which could potentially double the affected jet region (Savolainen et al., 2006).
4.3 Wide Faraday sheath in 3C 273
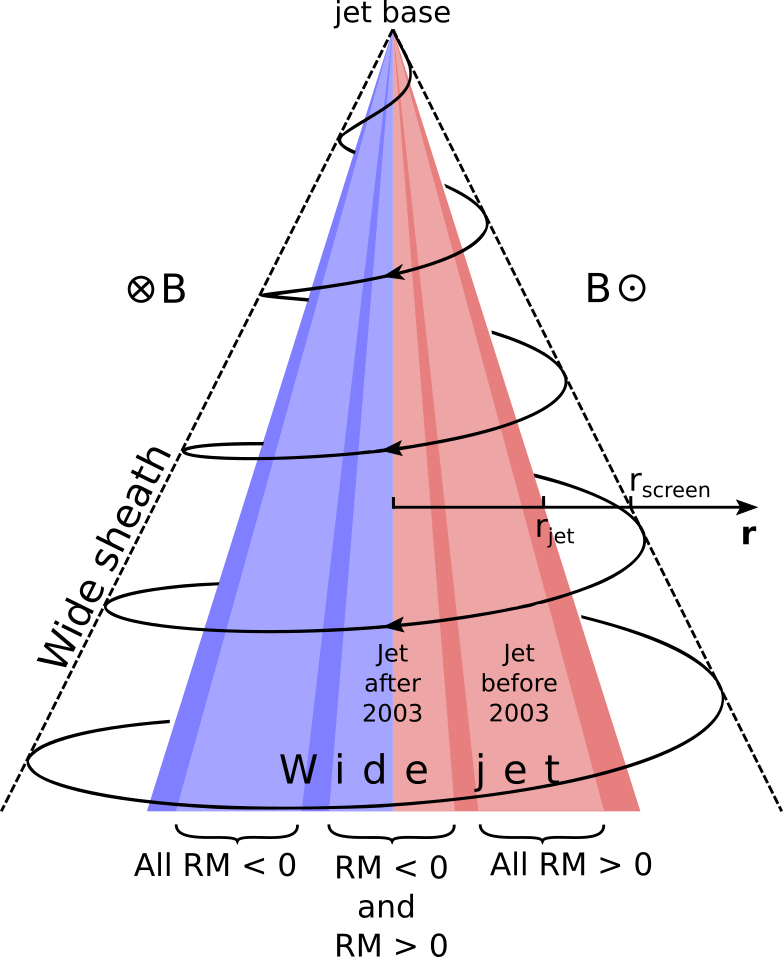
We suggest that the Faraday rotating medium consists of an oversized sheath wrapped around the wide jet instead of being tightly connected with the narrow, single-epoch jet as shown in Fig. 5. The inner opening angle of the sheath is therefore larger than the opening angle of the narrow single-epoch jet that wiggles within the inner opening angle of the oversized sheath. In this scenario, there is a misalignment between the visible narrow relativistic jet axis and the symmetry axis of a broader conical sheath which is threaded with toroidal magnetic field. Therefore, due to the swing in the parsec-scale jet direction occurring in 2003, synchrotron radiation passed through different regions of the Faraday screen and different RM values were observed before and after this change. This possibility was previously considered to explain some RM changes in 3C 273 (Hovatta et al., 2012b) and 3C 120 (Gómez et al., 2011).
There are several possible ways to verify this scenario. Firstly, the screen is detached from the relativistic jet and most probably has a much slower velocity. Therefore, it should evolve relatively slowly. Indeed, for our data, we have measured the jet net RM changes between observations in 2009–2010 as: , , rad m-2 at 4.6–8.4 GHz and , , rad m-2 at 8.1–15.4 GHz. These values are within the uncertainties associated with the EVPA calibration. Secondly, should the rotating medium constitute a sheath around the narrow relativistic jet with thickness comparable to the jet cross-section, it will inevitably be destroyed by the relativistic jet once it changes direction. However, we do not detect any traces of such an interaction.
We note that Park et al. (2019) present RM images of the jet in the radio galaxy M87 within the Bondi radius and conclude that the dominant source of the observed significantly high RMs are hot winds. The latter are non-relativistic, moderately magnetized gas outflows that surround the highly magnetized jet of M87 and are threaded by toroidally-dominated magnetic fields. But M87 shows no RM gradients across its jet. Park et al. (2019) suggest that this is due to a misalignment between the jet axis and the symmetry axis of the toroidal field loops in the Faraday screen, therefore the RM gradients are not observed in M87 since only a portion of the sheath is illuminated. Although the matter which forms the sheath in M87 and in 3C 273 may have a different origin, observational properties for both sources are well explained within the presented model.
Our model of an oversized sheath explains the long-term RM variability in the inner parts of the jet with different apparent directions of the relativistic jet before and after 2003 and hence the jet synchrotron emission passing through different parts of the Faraday screen. We can also predict that if the jet direction changes farther to the south, mostly negative RM values will be observed.
4.4 Screen parameters
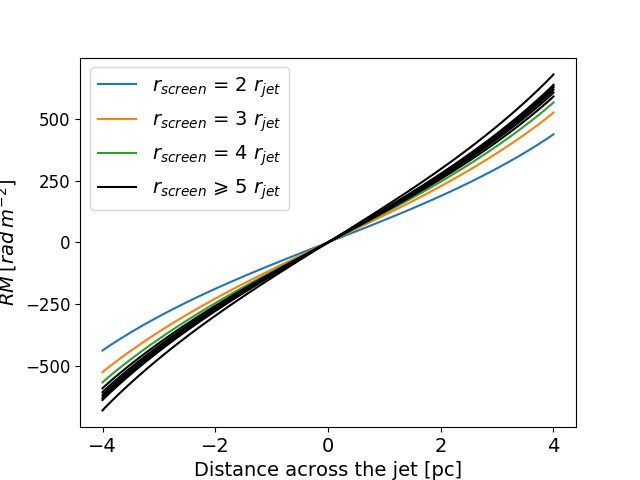
To estimate parameters of the Faraday screen we have developed a simple model. The wide jet with a radius is wrapped by a hollow conical sheath with inner radius and outer radius , see Fig. 5. The toroidal component of the magnetic field in the sheath decays with perpendicular distance from the wide jet axis as and the thermal particle density declines as where and are taken at 1 pc from the wide jet axis. After integrating over different lines of sight perpendicular to the apparent jet direction, we obtained the distribution of the RM values across the jet width. We then convolved these with a Gaussian restoring beam assuming five beams across the jet to resemble the data at 4.6–8.4 GHz. This simple model is designed to account only for smooth and monotonic distribution of RM across the jet and give a hint of typical parameters of the medium in the real sheath.
For any , the inner layers of the screen, up to , contribute 75% of the observed RM as expected from the model, see Fig. 6. This supports our initial assumption that the sheath would be disrupted by the jet changing its direction if this sheath is located in the immediate vicinity of the narrow relativistic jet. Moreover, the predicted RM distribution across the jet is well described by a straight line.
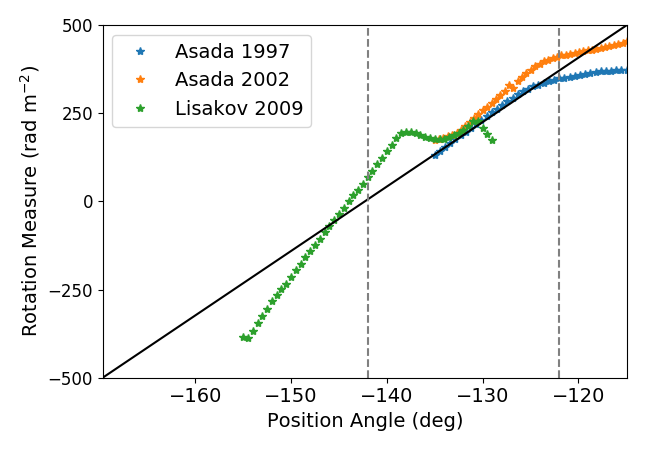
One may assume that the maximum value of the RM across the jet at 9 mas from the apparent core measured by Asada et al. (2002) was 500 rad m-2 and that the minimum value, not observed yet, would be rad m-2 . Then with our measurements of RM values across the jet at 4.6–8.4 GHz taken at the same distance, we estimate a total wide jet intrinsic opening angle of , twice as large as single-epoch estimates (Lisakov et al., 2017). To perform this, we combine transverse RM distributions, taken at different epochs, with the narrow jet position angle changes taken into account, as is shown in Fig. 7. The apparent angular width of the RM distribution at a single epoch is estimated as the width of the transverse jet intensity profile taken at the 1% level. Afterwards, the combined transverse RM distribution was fitted with a linear function, in accordance with the model. The total range of jet position angles, required to obtain a rad m-2 range of the RM, is 55∘ which corresponds to the intrinsic opening angle of the wide jet .
With this estimate, at 9 mas from the apparent core, the total width of the wide jet is 8 pc, pc. As we found for an arbitrary large , the inner layers of the sheath up to are responsible for 75% of the rotation. Hence we assumed . The range of RM values then requires for a path length pc through the sheath. Clearly, and can not be calculated independently within this analysis. At the same time, the line-of-sight path length through the screen could not change the estimates of by more than a factor of two within our model, for any reasonable screen width. With pc, at the wide jet – wide sheath boundary. For assumed magnetic field component parallel to the line of sight at the inner edge of the sheath, the thermal particle density is .
With the same logic applied to the 8.1–15.4 GHz, a range of RM values could be achieved at 5.5 mas from the jet beginning with , as obtained from the model with path length of pc. is 25% higher than that at 9 mas, what is expected given the lower distance to the jet beginning. As is apparent from Fig. 4, transverse RM distributions observed at higher frequencies in general show more complex shape and thus require a more elaborate model to describe them. This is a scope of future work that will allow a better estimate of the Faraday screen parameters.
It is important to note that using the core shift analysis (Lobanov, 1998) and estimates of the magnetic field G and relativistic electron density cm-3 at the jet beginning (Lisakov et al., 2017), the estimated values in the jet are , at 5.5 mas (corresponding to 140 pc, deprojected) and , at 9 mas(230 pc, deprojected) from the apparent jet base.
4.5 The jet opening angle derived from stacked images
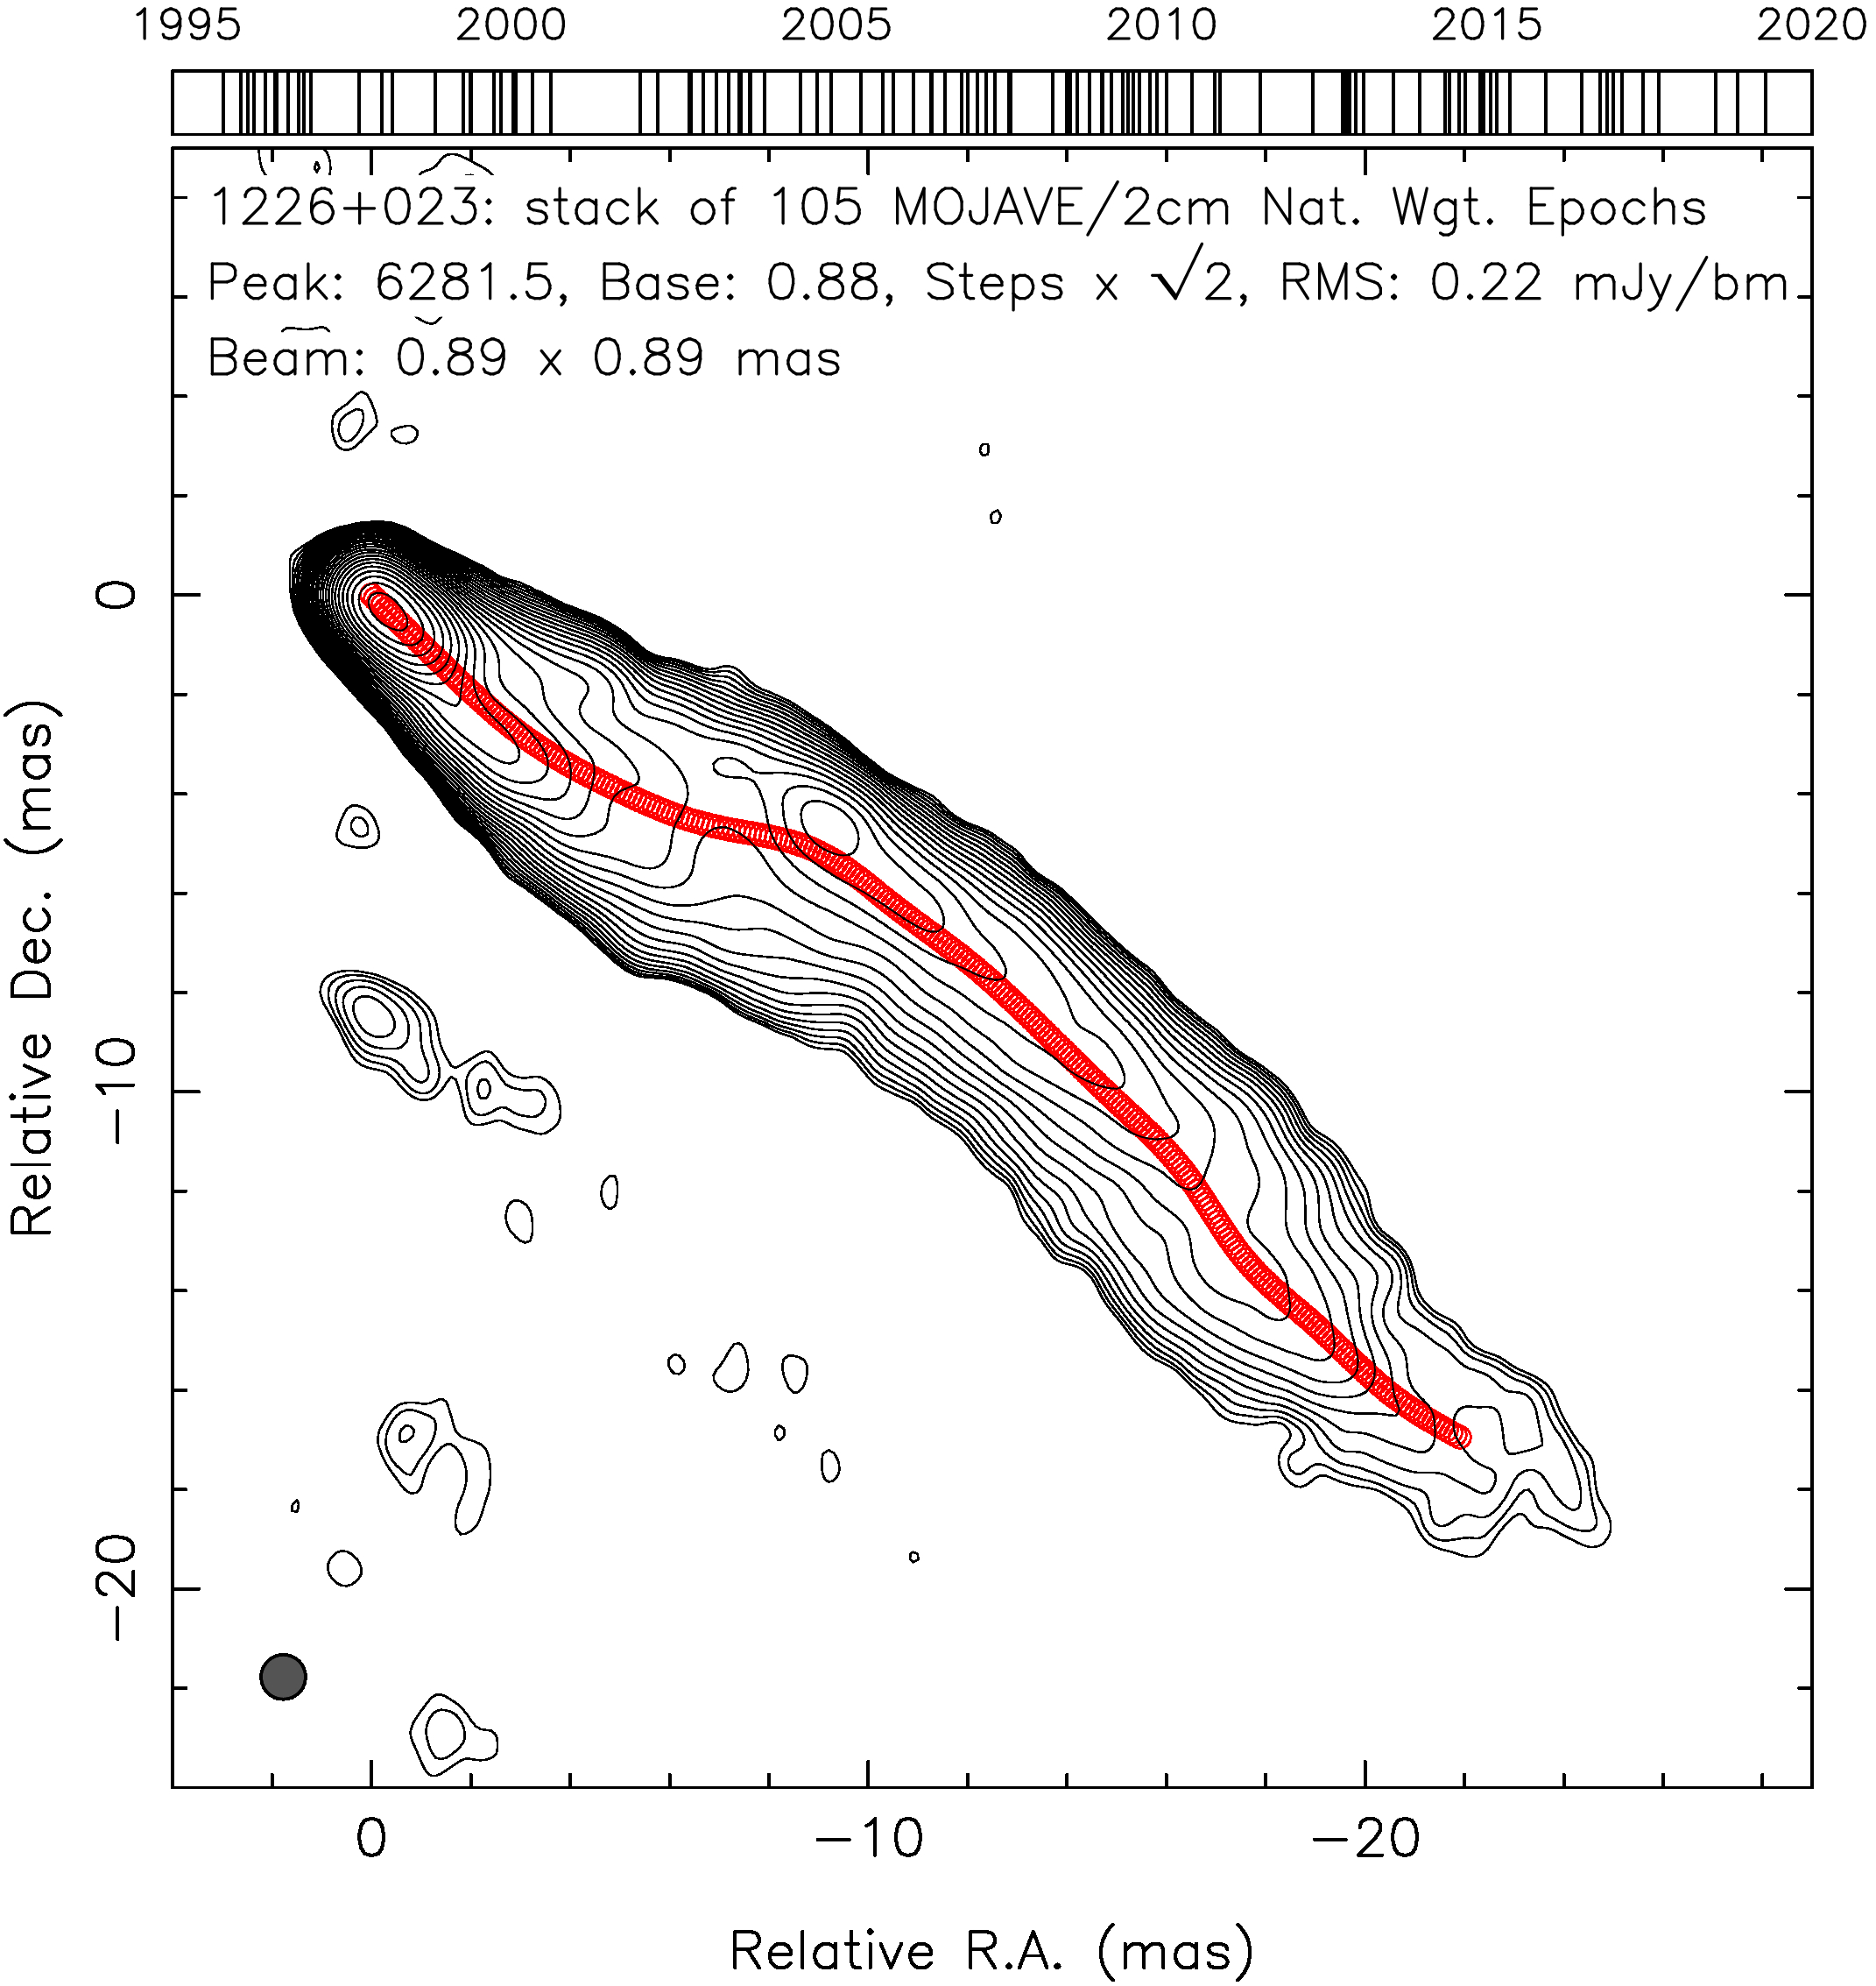
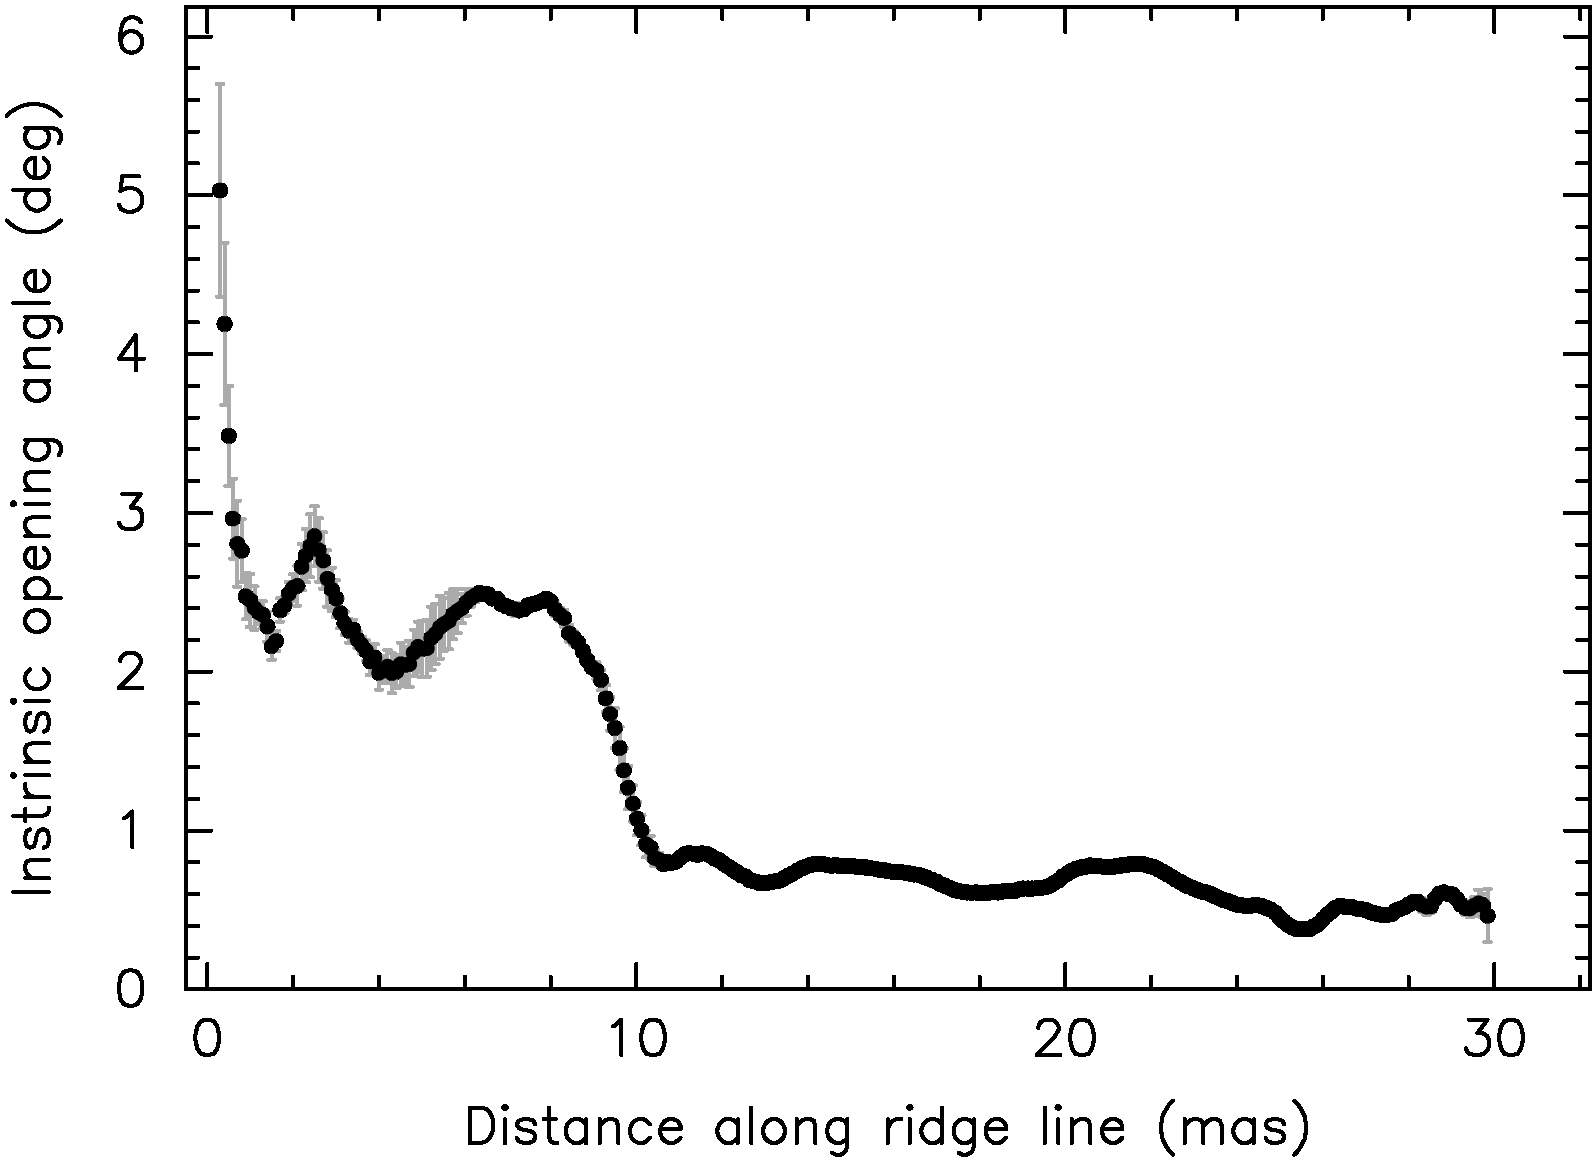
We produced a stacked map of 3C 273 in total intensity at 15 GHz (Fig. 8) using public data from the MOJAVE database (Lister et al., 2019). According to discussion in Section 4.3, this map represents the wide jet in 3C 273. In total, 105 epochs ranging from 1995 July 28 to 2019 April 15 were stacked together. Each single-epoch image was convolved with the same median circular beam and shifted such that the 15 GHz VLBI core is placed in the phase center. The core position (Lister et al., 2019) was determined from source structure modeling performed in the Fourier plane with the procedure modelfit from the Caltech Difmap package (Shepherd, 1997). We fitted a ridge line to the image and measured the apparent wide jet opening angle following the procedure described in Pushkarev et al. (2017). The intrinsic wide jet opening angle, calculated as , is shown in Fig. 9. The intrinsic opening angle of the wide jet is up to the distances of about 9 mas from the core along the ridge line, in noticeable agreement with the estimate made above under the assumption on the minimum Rotation Measure rad m-2.
We also note that high resolution space VLBI images of 3C 273 obtained with RadioAstron at both 1.6 GHz and 4.8 GHz and presented recently by Bruni et al. (2021) show a clear evidence for the new established direction of the jet in 3C 273.
5 Summary
We present new high-resolution images of the Faraday Rotation Measure in the parsec-scale jet of 3C 273, see Section 3, based on multifrequency VLBA polarimetric observations at 4.6–15.4 GHz. From the comparison of our results with the previous studies, we confirm the existence of transverse RM gradients in the jet of 3C 273 out to at least 57 pc projected distance ( pc deprojected), and detect a change of RM towards negative values compared with observations performed before 2003.
In order to coherently explain the change of the jet position angle together with the change of the Faraday Rotation Measure across the jet, in Section 4.3 we develop a model of an oversized sheath that is wrapped around the wide jet in 3C 273. The sheath does not show any rapid variability and most likely is disconnected from the relativistic jet. Single-epoch images of 3C 273 reveal only a portion of the wider jet. After the parsec-scale jet direction swing in 2003, different lines-of-sight through the sheath are sampled, resulting in different observed Faraday Rotation Measure values. We predict that mostly negative RM values will be observed if the jet turns even more southward. Within our model we estimate the total wide jet intrinsic opening angle , based solely on the RM measurements across the jet. Most of the rotation occurs within a layer of width, see Section 4.4. In this scenario, we estimate G and at the jet–sheath border at 9 mas (230 pc, deprojected) from the apparent core at 5 GHz.
We produced a stacked image of 3C 273 in total intensity at 15 GHz using VLBA data at 105 epochs of observations performed during 24 years mainly within the MOJAVE program and its predecessor, the 2 cm VLBA survey, see Section 4.5. The intrinsic wide jet opening angle derived from the transverse cuts is about at the jet region near the 15 GHz core. The outflow quickly collimates to . This regime holds within distances from about 1 to 9 mas from the core, further supporting our model.
References
- Asada et al. (2008) Asada, K., Inoue, M., Kameno, S., & Nagai, H. 2008, ApJ, 675, 79, doi: 10.1086/524000
- Asada et al. (2002) Asada, K., Inoue, M., Uchida, Y., et al. 2002, PASJ, 54, L39, doi: 10.1093/pasj/54.3.L39
- Astropy Collaboration et al. (2013) Astropy Collaboration, Robitaille, T. P., Tollerud, E. J., et al. 2013, A&A, 558, A33, doi: 10.1051/0004-6361/201322068
- Blandford & Königl (1979) Blandford, R. D., & Königl, A. 1979, ApJ, 232, 34, doi: 10.1086/157262
- Bruni et al. (2017) Bruni, G., Gómez, J. L., Casadio, C., et al. 2017, A&A, 604, A111, doi: 10.1051/0004-6361/201731220
- Bruni et al. (2021) Bruni, G., Gómez, J. L., Vega-García, L., et al. 2021, arXiv:2101.07324 [astro-ph]. http://arxiv.org/abs/2101.07324
- Chen (2005) Chen, T. 2005, PhD thesis, Brandeis University, Massachusetts, USA
- Deller et al. (2011) Deller, A. T., Brisken, W. F., Phillips, C. J., et al. 2011, PASP, 123, 275, doi: 10.1086/658907
- Gabuzda et al. (2014) Gabuzda, D. C., Reichstein, A. R., & O’Neill, E. L. 2014, MNRAS, 444, 172, doi: 10.1093/mnras/stu1381
- Gómez et al. (2011) Gómez, J. L., Roca-Sogorb, M., Agudo, I., Marscher, A. P., & Jorstad, S. G. 2011, ApJ, 733, 11, doi: 10.1088/0004-637X/733/1/11
- Hovatta et al. (2012a) Hovatta, T., Lister, M. L., Aller, M. F., et al. 2012a, AJ, 144, 105, doi: 10.1088/0004-6256/144/4/105
- Hovatta et al. (2012b) Hovatta, T., Lister, M. L., Aller, M. F., et al. 2012b, in Journal of Physics Conference Series, Vol. 355, Journal of Physics Conference Series, 012008, doi: 10.1088/1742-6596/355/1/012008
- Kovalev et al. (2020) Kovalev, Y. Y., Pushkarev, A. B., Nokhrina, E. E., et al. 2020, MNRAS, 495, 3576, doi: 10.1093/mnras/staa1121
- Kovalev et al. (2016) Kovalev, Y. Y., Kardashev, N. S., Kellermann, K. I., et al. 2016, ApJ, 820, L9, doi: 10.3847/2041-8205/820/1/L9
- Kravchenko & Kovalev (2017) Kravchenko, E., & Kovalev, Y. 2017, Galaxies, 5, 92, doi: 10.3390/galaxies5040092
- Kravchenko et al. (2017) Kravchenko, E. V., Kovalev, Y. Y., & Sokolovsky, K. V. 2017, MNRAS, 467, 83, doi: 10.1093/mnras/stx021
- Lisakov et al. (2017) Lisakov, M. M., Kovalev, Y. Y., Savolainen, T., Hovatta, T., & Kutkin, A. M. 2017, MNRAS, 468, 4478, doi: 10.1093/mnras/stx710
- Lister et al. (2018) Lister, M. L., Aller, M. F., Aller, H. D., et al. 2018, ApJS, 234, 12, doi: 10.3847/1538-4365/aa9c44
- Lister et al. (2013) —. 2013, AJ, 146, 120, doi: 10.1088/0004-6256/146/5/120
- Lister et al. (2019) Lister, M. L., Homan, D. C., Hovatta, T., et al. 2019, ApJ, 874, 43, doi: 10.3847/1538-4357/ab08ee
- Lobanov (1998) Lobanov, A. P. 1998, A&A, 330, 79. https://arxiv.org/abs/astro-ph/9712132
- McKinney (2006) McKinney, J. C. 2006, MNRAS, 368, 1561, doi: 10.1111/j.1365-2966.2006.10256.x
- Meier et al. (2001) Meier, D. L., Koide, S., & Uchida, Y. 2001, Science, 291, 84, doi: 10.1126/science.291.5501.84
- Nakamura et al. (2018) Nakamura, M., Asada, K., Hada, K., et al. 2018, ApJ, 868, 146, doi: 10.3847/1538-4357/aaeb2d
- O’Sullivan & Gabuzda (2009) O’Sullivan, S. P., & Gabuzda, D. C. 2009, MNRAS, 393, 429, doi: 10.1111/j.1365-2966.2008.14213.x
- Park et al. (2019) Park, J., Hada, K., Kino, M., et al. 2019, ApJ, 871, 257, doi: 10.3847/1538-4357/aaf9a9
- Pushkarev et al. (2017) Pushkarev, A. B., Kovalev, Y. Y., Lister, M. L., & Savolainen, T. 2017, MNRAS, 468, 4992, doi: 10.1093/mnras/stx854
- Savolainen et al. (2006) Savolainen, T., Wiik, K., Valtaoja, E., & Tornikoski, M. 2006, A&A, 446, 71, doi: 10.1051/0004-6361:20053753
- Shepherd (1997) Shepherd, M. C. 1997, in Astronomical Society of the Pacific Conference Series, Vol. 125, Astronomical Data Analysis Software and Systems VI, ed. G. Hunt & H. E. Payne (San Francisco: ASP), 77
- Strauss et al. (1992) Strauss, M. A., Huchra, J. P., Davis, M., et al. 1992, ApJS, 83, 29, doi: 10.1086/191730
- Taylor et al. (2009) Taylor, A. R., Stil, J. M., & Sunstrum, C. 2009, ApJ, 702, 1230, doi: 10.1088/0004-637X/702/2/1230
- Tchekhovskoy et al. (2011) Tchekhovskoy, A., Narayan, R., & McKinney, J. C. 2011, MNRAS, 418, L79, doi: 10.1111/j.1745-3933.2011.01147.x
- van Moorsel et al. (1996) van Moorsel, G., Kemball, A., & Greisen, E. 1996, in Astronomical Society of the Pacific Conference Series, Vol. 101, Astronomical Data Analysis Software and Systems V, ed. G. H. Jacoby & J. Barnes, 37
- Vlahakis & Königl (2004) Vlahakis, N., & Königl, A. 2004, ApJ, 605, 656, doi: 10.1086/382670
- Wardle (2018) Wardle, J. 2018, Galaxies, 6, 5, doi: 10.3390/galaxies6010005
- Zamaninasab et al. (2014) Zamaninasab, M., Clausen-Brown, E., Savolainen, T., & Tchekhovskoy, A. 2014, Nature, 510, 126, doi: 10.1038/nature13399
- Zavala & Taylor (2003) Zavala, R. T., & Taylor, G. B. 2003, ApJ, 589, 126, doi: 10.1086/374619
- Zavala & Taylor (2004) —. 2004, ApJ, 612, 749, doi: 10.1086/422741
- Zavala & Taylor (2005) —. 2005, ApJ, 626, L73, doi: 10.1086/431901