Quenching factor measurements of sodium nuclear recoils in NaI:Tl determined by spectrum fitting
Abstract
We have performed measurements of sodium nuclear recoils in NaI:Tl crystals, following scattering by neutrons produced in a 7Li(p,n)7Be reaction. Understanding the light output from such recoils, which is reduced relative to electrons of equivalent energy by the quenching factor, is critical to interpret dark matter experiments that search for nuclear scattering interactions. We have developed a spectrum-fitting methodology to extract the quenching factor from our measurements, and report quenching factors for nuclear recoil energies between 36 and 401 keV. Our results agree with other recent quenching factor measurements that use quasi-monoenergetic neutron sources. The new method will be applied in the future to the NaI:Tl crystals used in the SABRE experiment.
1 Introduction
Weakly Interacting Massive Particles (WIMPs) are a well-motivated dark matter candidate that are expected to interact with ordinary matter via nuclear scattering. There is a large and ongoing search for such interactions from galactic WIMPs in terrestrial detectors, with most experiments returning null results [1]. A notable exception is the DAMA experiment, which for many years has observed a modulation in the count rate of low energy events in their NaI:Tl detector consistent with that expected from WIMP dark matter [2]. This observation has motivated numerous other NaI:Tl-based searches that aim to independently measure the DAMA modulation [3, 4, 5], though none have unambiguously confirmed or refuted this result to date.
Understanding the scintillation response of NaI:Tl to nuclear recoils is essential to interpret any potential dark matter signal. The light yield from nuclear recoils is reduced relative to electron recoils of the same energy due to energy losses to lattice excitations and additional non-radiative carrier de-excitation pathways in regions of high excitation density [6]. Furthermore, in practice, detectors are calibrated using gamma-ray sources that produce electron recoils, so to set the correct energy scale for nuclear recoil interactions the quenching factor
| (1.1) |
must be known. Here and are the light yields due to a nuclear recoil and electron recoil of equal energy, respectively.
The DAMA experiment has measured values of 0.3 and 0.09 for Na and I recoils, respectively, using a 252Cf source and a simulation of the expected distribution of recoils [7]. More recent experiments using quasi-monoenergetic neutrons from deuteron-deuteron neutron generators and 7Li(p,n)7Be reactions have indicated an energy dependence where the Na quenching factor decreases with energy, though there is some inconsistency between these results [8, 9, 10, 11]. This study provides an additional measurement of the quenching factor of Na recoils in a NaI:Tl crystal, and exploits a full spectrum fitting methodology as a means to improve the modelling of the recoil spectrum.
2 Experiment
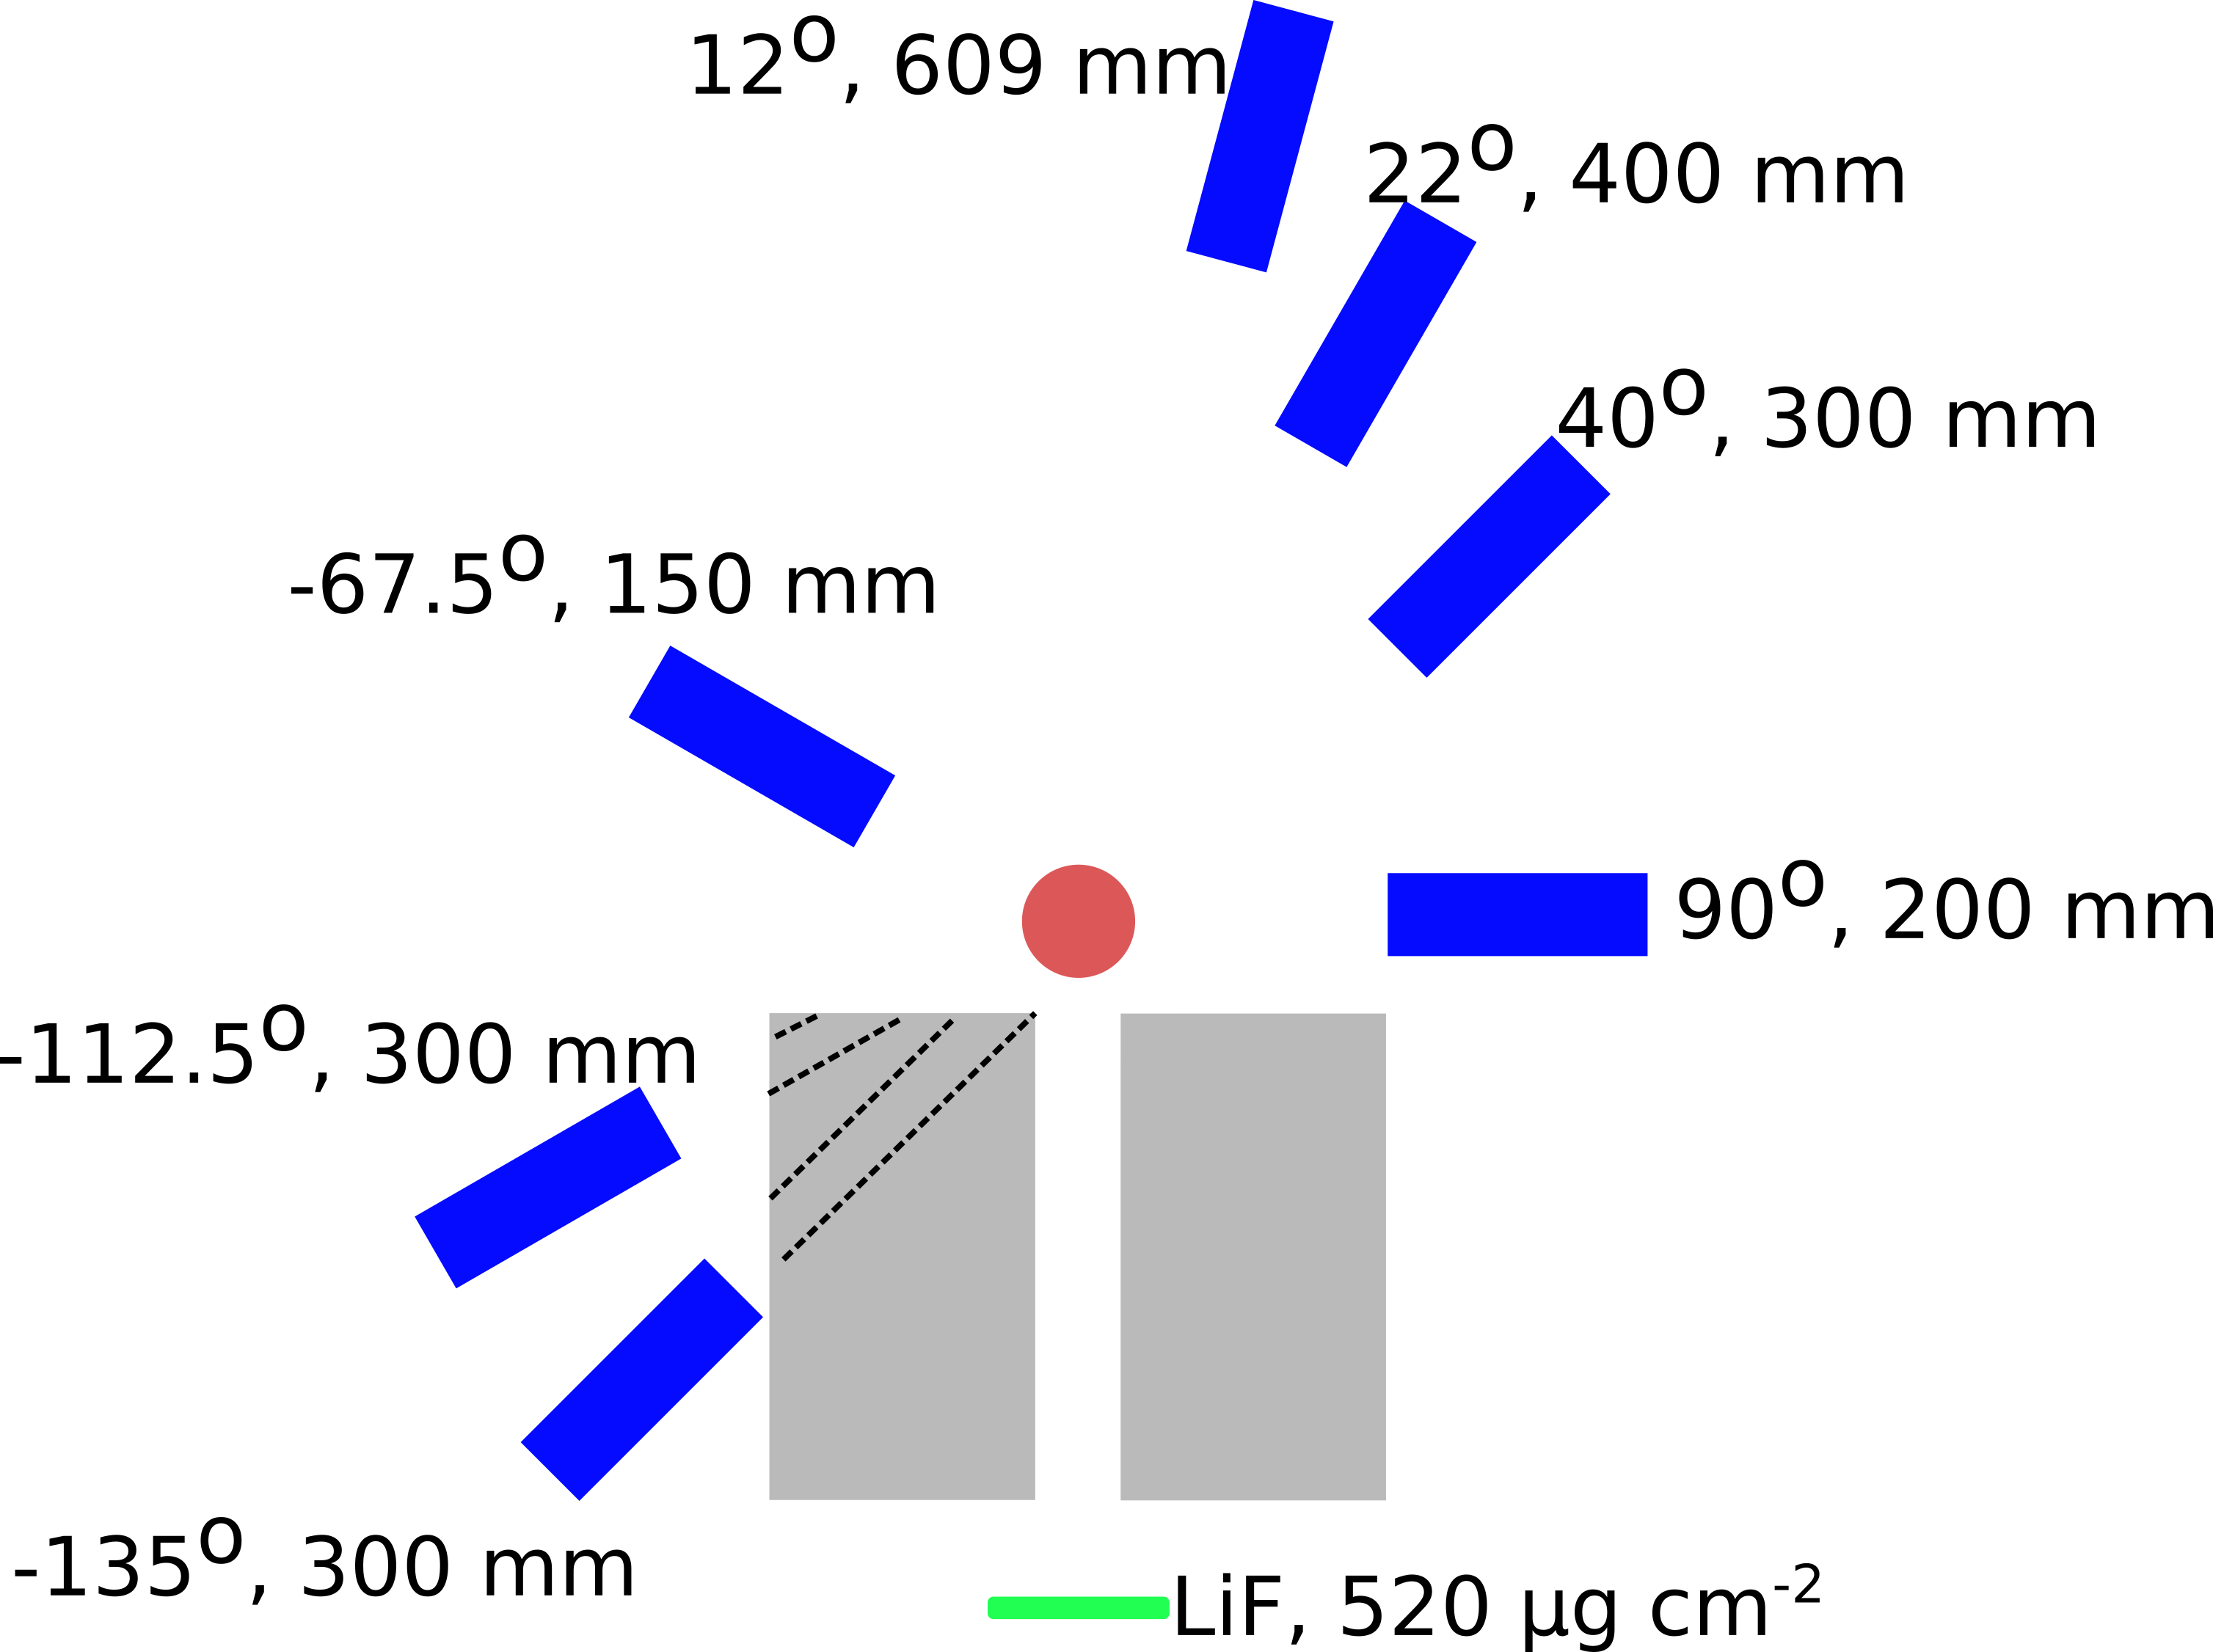
Figure 1 illustrates the experimental setup. The choice of geometry was guided by a toy model that used cross-section data and kinematic calculations to predict coincidence rates, neutron times of flight, and nuclear recoil energies (including their spread) based on a simplified angular acceptance.
2.1 NaI:Tl Detector
An encapsulated 40 mm diameter, 40 mm height, cylindrical NaI:Tl crystal was employed to measure the nuclear recoils. The crystal was originally manufactured in the USSR circa 1988, and the growth method and thallium concentration are unknown. The crystal enclosure includes a transparent window, allowing readout with photomultipliers. Two Hamamatsu H11934-200 1 x 1 inch ultra-bialkali (43% peak quantum efficiency) photomultipliers were coupled to the window using optical grease before wrapping with layers of teflon tape and black adhesive tape. The light yield from this setup was measured, using calibration sources and the peak charge from single photoelectrons, to be 2 PE/keV, which was lower than expected. We attribute this low sensitivity to a combination of poor optical coupling, owing to the mismatch between the crystal window and the PMT size, and a low intrinsic light yield from the crystal.
2.2 LiF Target and Proton Beam
A g/cm2 LiF foil on a 20 mg/cm2 Ta backing was placed at the target location. This was irradiated by a pulsed beam of protons provided by the 14UD accelerator at the Australian National University’s Heavy Ion Accelerator Facility [12]. A range of beam energies was chosen, sufficient to generate quasi-monoenergetic neutrons via 7Li(p,n)7Be [13, 14]. The target backing was sufficient to stop the primary proton beam, but had a negligible effect upon the neutrons. The pulsed beam width had a FWHM less than 2 nanoseconds, repeated every 747 ns. The beam current varied throughout the measurements, and also with beam energy, in a range between approximately 0.2 and 2 nA. Neutron production was confirmed at the time of measurement using the time difference spectrum between a BaF2 scintillation detector placed close to the target and the beam pulse timing signal. This time spectrum exhibited a prompt peak from gammas emanating from the target and a delayed peak due to neutrons (section 3.6). Two measurement campaigns were carried out, with proton beam energies of 2.44 MeV, 3 MeV, and 5.2 MeV in the first and 3 MeV and 6 MeV in the second.
Neutrons exited the vacuum chamber through a thinned aluminium vacuum flange. A cylindrical HDPE collimator was placed after the target so that the 25 mm aperture was collinear with the beam axis. The NaI:Tl detector was aligned with the aperture, 30 cm from the LiF target. This collimator included 25 mm diameter through-holes to allow the transport of neutrons to the backward-angle scattered neutron detectors.
2.3 Liquid Scintillator Detectors
Seven liquid scintillator detectors were placed at the angles and distances from the centre of the NaI:Tl crystal outlined in figure 1 to tag scattered neutrons. The detectors were aligned using a theodolite, so the error in the mean angle is expected to be negligibly small.
The scintillation detectors were made with a diameter of 38 mm and a length of 15 cm. The length was chosen to give a balance between a sufficiently high macroscopic scattering cross-section (> 90% for the neutrons traversing the cylindrical axis) and a small neutron time of flight over the length of the sensitive volume. The neutron time of flight over the liquid scintillator volume varied from 14 ns to 5 ns at the lowest and highest beam energies, respectively. The inner surfaces of the detectors were fabricated from 5 mm thick teflon, aside from a borosilicate glass window sealed with a Viton o-ring. The scintillation light was read out via a 1.5 inch diameter Hamamatsu H10828 photomultiplier with a super bialkali photocathode (35% peak quantum efficiency), coupled to the detector window using optical grease. A thin aluminium housing covered the outer surfaces of the liquid scintillator detectors as light shielding, supplemented with duct tape and aluminium foil.
We used EJ-309, a low-hazard liquid scintillator with excellent particle identification capabilities, as the detection material. The scintillator was bubbled with nitrogen before filling the detectors in a nitrogen glove box. A small gas volume was included with the liquid scintillator to allow for thermal expansion.
2.4 Data Acquisition
An XIA Pixie16 digitizer [15] was used to capture digitized waveform signals from all 9 detectors (7 liquid scintillators, 2 NaI:Tl channels) at 500 million samples per second with 12 bit resolution in both runs. A beam sync signal was generated as a logic signal in phase with the beam bunches. This was captured as a constant-fraction discriminator (CFD) time relative to the Pixie16 clock, not as a waveform. In the second run, the CFD timing signal from the BaF2 neutron monitor was also captured and used to correct for the drift in the phase relationship between the beam timing signal and the arrival of the beam burst at the target (section 3.6). The data acquisition system did not have a global trigger, instead each channel was digitized whenever the signal exceeded a threshold. The thresholds for the detector channels were set low enough to measure single photoelectrons.
To prevent excessive triggering, a signal over threshold in the liquid scintillator or NaI:Tl channels required a coincident signal in one of the NaI:Tl or liquid scintillator channels, respectively. An ideal trigger for the beam timing signal would require a coincident liquid scintillator and NaI:Tl channel. However, due to a limitation of our digitizer control implementation, we instead required a two-fold multiplicity of coincident signals amongst all of the liquid scintillator and NaI:Tl channels. This meant that events where both NaI:Tl channels triggered dominated the data stream, however these events could be readily rejected in later analysis. When it was acquired, the rate in the BaF2 detector was low enough that self-triggering was sufficient.
3 Signal Processing
The digitized waveforms were processed to estimate the pulse arrival time, charge, and a particle identification metric for each detector channel.
3.1 Trigger Time
A significant amount of RF noise was observed in the NaI:Tl waveforms. To mitigate this noise and reduce the analysis threshold, the waveforms were digitally filtered using a Wiener filter. A Wiener filter requires an estimate of the power spectral density of the signal (), and the noise (), which together give an estimate of the signal to noise ratio in Fourier space. The filter is then defined as
so that frequencies where the signal-to-noise ratio is high are passed, and frequencies where it is low are attenuated.
Since noise was most problematic for low amplitude pulses, the filter was optimised for single photoelectron events. A population of single photoelectron waveforms was selected using a time over threshold cut. These were then aligned in time by up-sampling the waveforms and aligning to the maximum. The averaged power spectral density in the trigger region about the single photoelectron signal was used as an estimate of , and the averaged power spectral density of the pre-trigger region was used as an estimate of .
For the adopted analysis threshold of 1 photoelectron, signal processing without filtering led to inaccurate timing for a large number of events due to misidentifying noise in the pre-trigger region as the pulse arrival time. This can be quantified by the fraction of waveforms for which the pulse was determined to arrive more than 100 ns before the expected trigger time set by the digitizer’s trigger delay. This fraction was 48% without filtering and 0.3% with the filter. A qualitative sampling of the remaining events that fell outside this time window revealed that most remaining events were due to pile-up, triggering on the tails of cosmic events, and similar undesirable events. We required the pulse arrival time as determined by our processing to arrive within a timing window relative to the start of the waveform to exclude these remaining events.
The liquid scintillator detectors did not exhibit the same level of electronic noise, and their timing was determined using a threshold on the unfiltered waveforms.
3.2 Pulse Charge
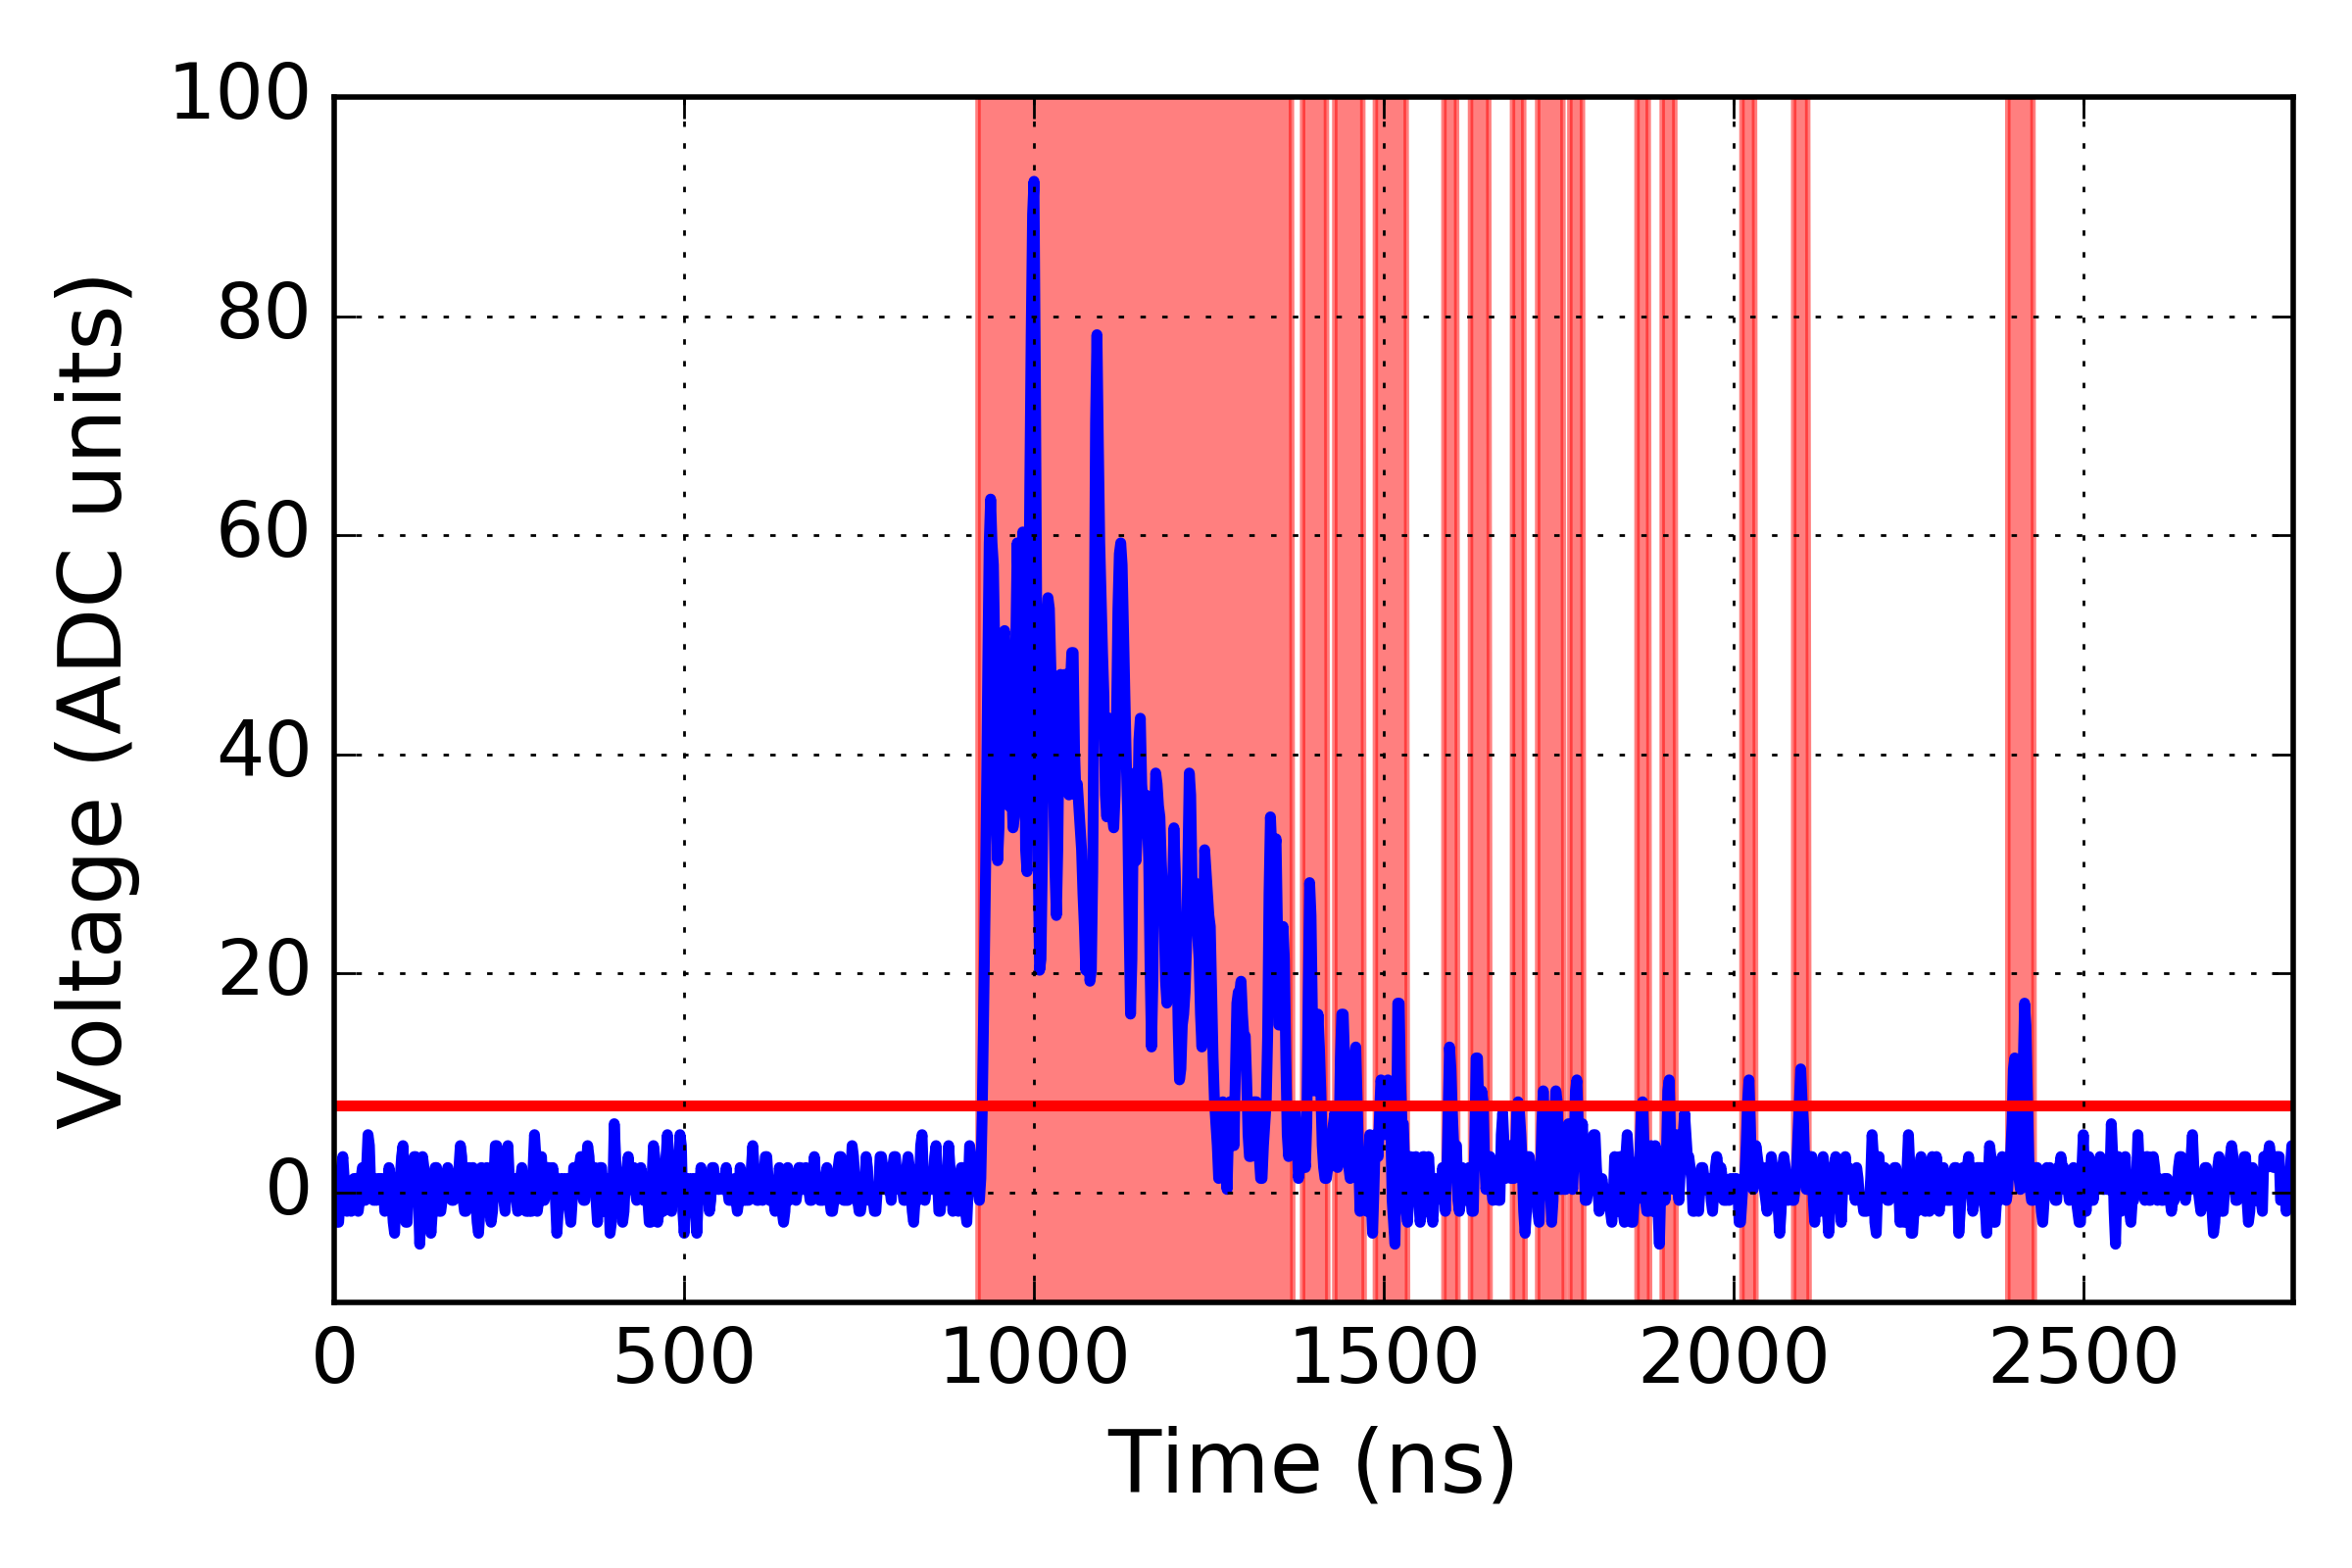
The low charge NaI:Tl events tend to be composed of single photoelectrons that are well-separated in time owing to the 250 ns NaI:Tl decay time, which is slow relative to the few ns signal width from a single photoelectron. Thus, a simple fixed integration approach performed poorly for low-charge NaI:Tl events and was unable to resolve the single photoelectron peak due to integrating the noise between well-separated single photoelectron events.
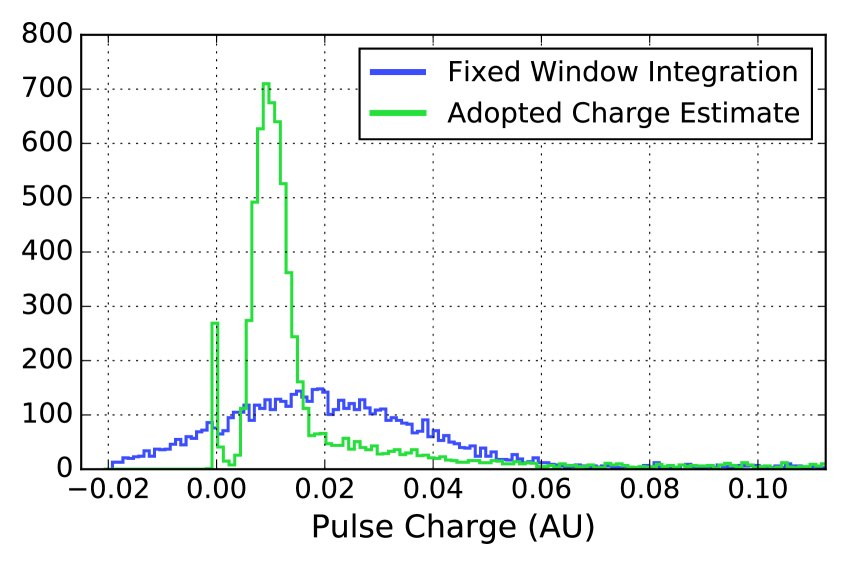
To avoid this, only regions around where the waveform exceeded a threshold were integrated. The threshold was chosen to be approximately 0.5 photoelectrons, to optimise the energy resolution. This algorithm is outlined schematically in figure 2(a). This approach performed much better than a fixed integration window at low charge, allowing single photoelectron events to be identified (figure 2(b)), while maintaining identical performance at high charge. This algorithm was adopted for all NaI:Tl energy estimates in this analysis.
3.3 Efficiency Correction
The NaI:Tl detection efficiency drops below 1 at low energies due to there being few scintillation photons per event. Thus, the numbers of events measured near the threshold is an underestimation of the true spectrum, which can lead to incorrect predictions of the quenching factor [16]. We have estimated the detection efficiency using coincidences between the two NaI:Tl photomultipliers; the efficiency of an individual channel is given by
| (3.1) |
where is the number of observed coincidences between channel and and is the number of counts in channel evaluated in an identical energy range. The coincident efficiency is the product of the two efficiencies and the efficiency of the union of the two channels is given by:
| (3.2) |
where is the coincident efficiency. The union of all events passing the cuts was used for the analysis of our measurements, and the resulting spectra were corrected by an energy-dependent fit to this efficiency given by
| (3.3) |
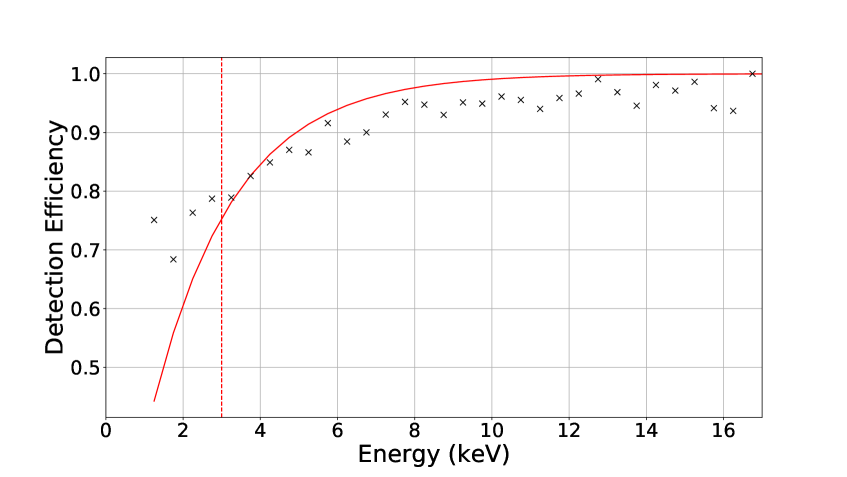
This model function is motivated by the fact that the detection efficiency ought to be 1 minus the Poisson probability of detecting zero photoelectrons. The fit is given in figure 3. The model fit is not perfect, and there are differences in the higher energy range that may stem from the difficulty of measuring unit efficiency with limited statistics. We imposed an analysis threshold at 3 keV in part to mitigate the degraded fit at low energies. The effect of the fit to the efficiency does not have a significant systematic effect on our quenching factor results: a reanalysis of the quenching factors without any efficiency correction resulted in a change to the quenching factor.
3.4 Particle Identification
A well-known attribute of liquid scintillators is that the time distribution of the emitted scintillation light depends upon the stopping power of the particle that deposited energy in the material. This property can form the basis of particle identification.
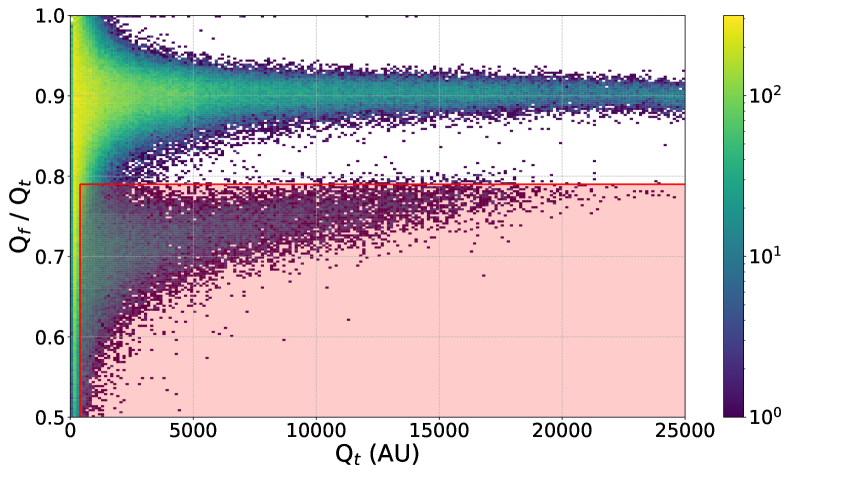
There are a number of techniques possible for particle identification. We used the charge comparison method [17], with the metric Qf/Qt, where Qf is the charge in the first part of the pulse and Qt is the total pulse charge. Fixed integration windows about the pulse arrival time were used to estimate the charge. The free parameters for the algorithm are the integration lengths, which were determined using a parameter grid search to be optimal at 10 ns for and 100 ns for . Figure 4 illustrates the excellent particle identification performance of the scintillator.
3.5 Quality Cuts
We applied a quality cut to all measurements to remove spurious noise events in the NaI:Tl photomultiplier channels. This charge asymmetry cut required that the difference in the proportion of charge detected between the two photomultipliers not be too great, such that
where and are the charges measured in the two NaI:Tl photomultipliers.
We also applied a separate cut requiring that the two NaI:Tl signals arrive within 250 ns of each other.
3.6 Beam Synchronisation Drift
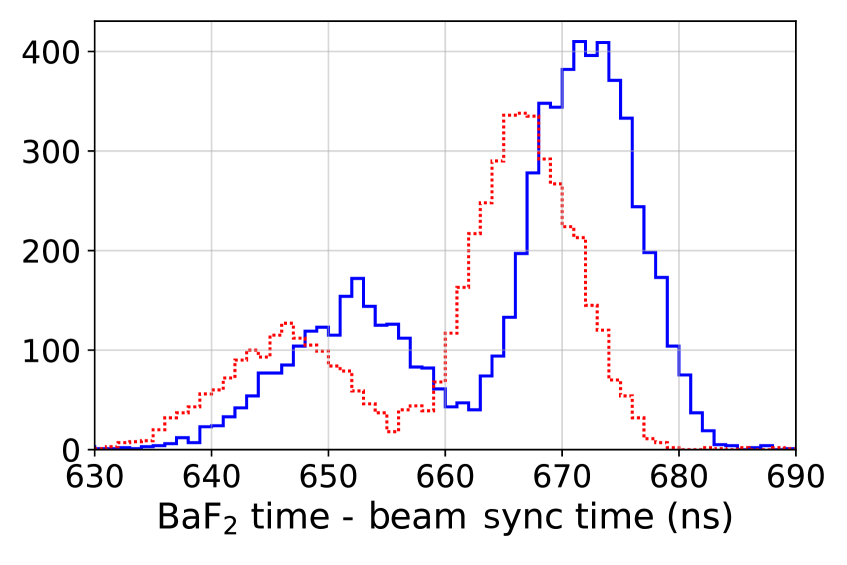
An analysis of the first measurement campaign revealed that the phase relationship between the beam sync signal and the arrival of the proton pulse at the target changed over time. In the second campaign this relationship was tracked by recording the timing signal from the BaF2 signal, which yielded time spectra as shown in figure 5(a). The two spectra, which represent 20 second slices of the run, show an obvious shift in the arrival time of the pulse relative to the beam sync signal.
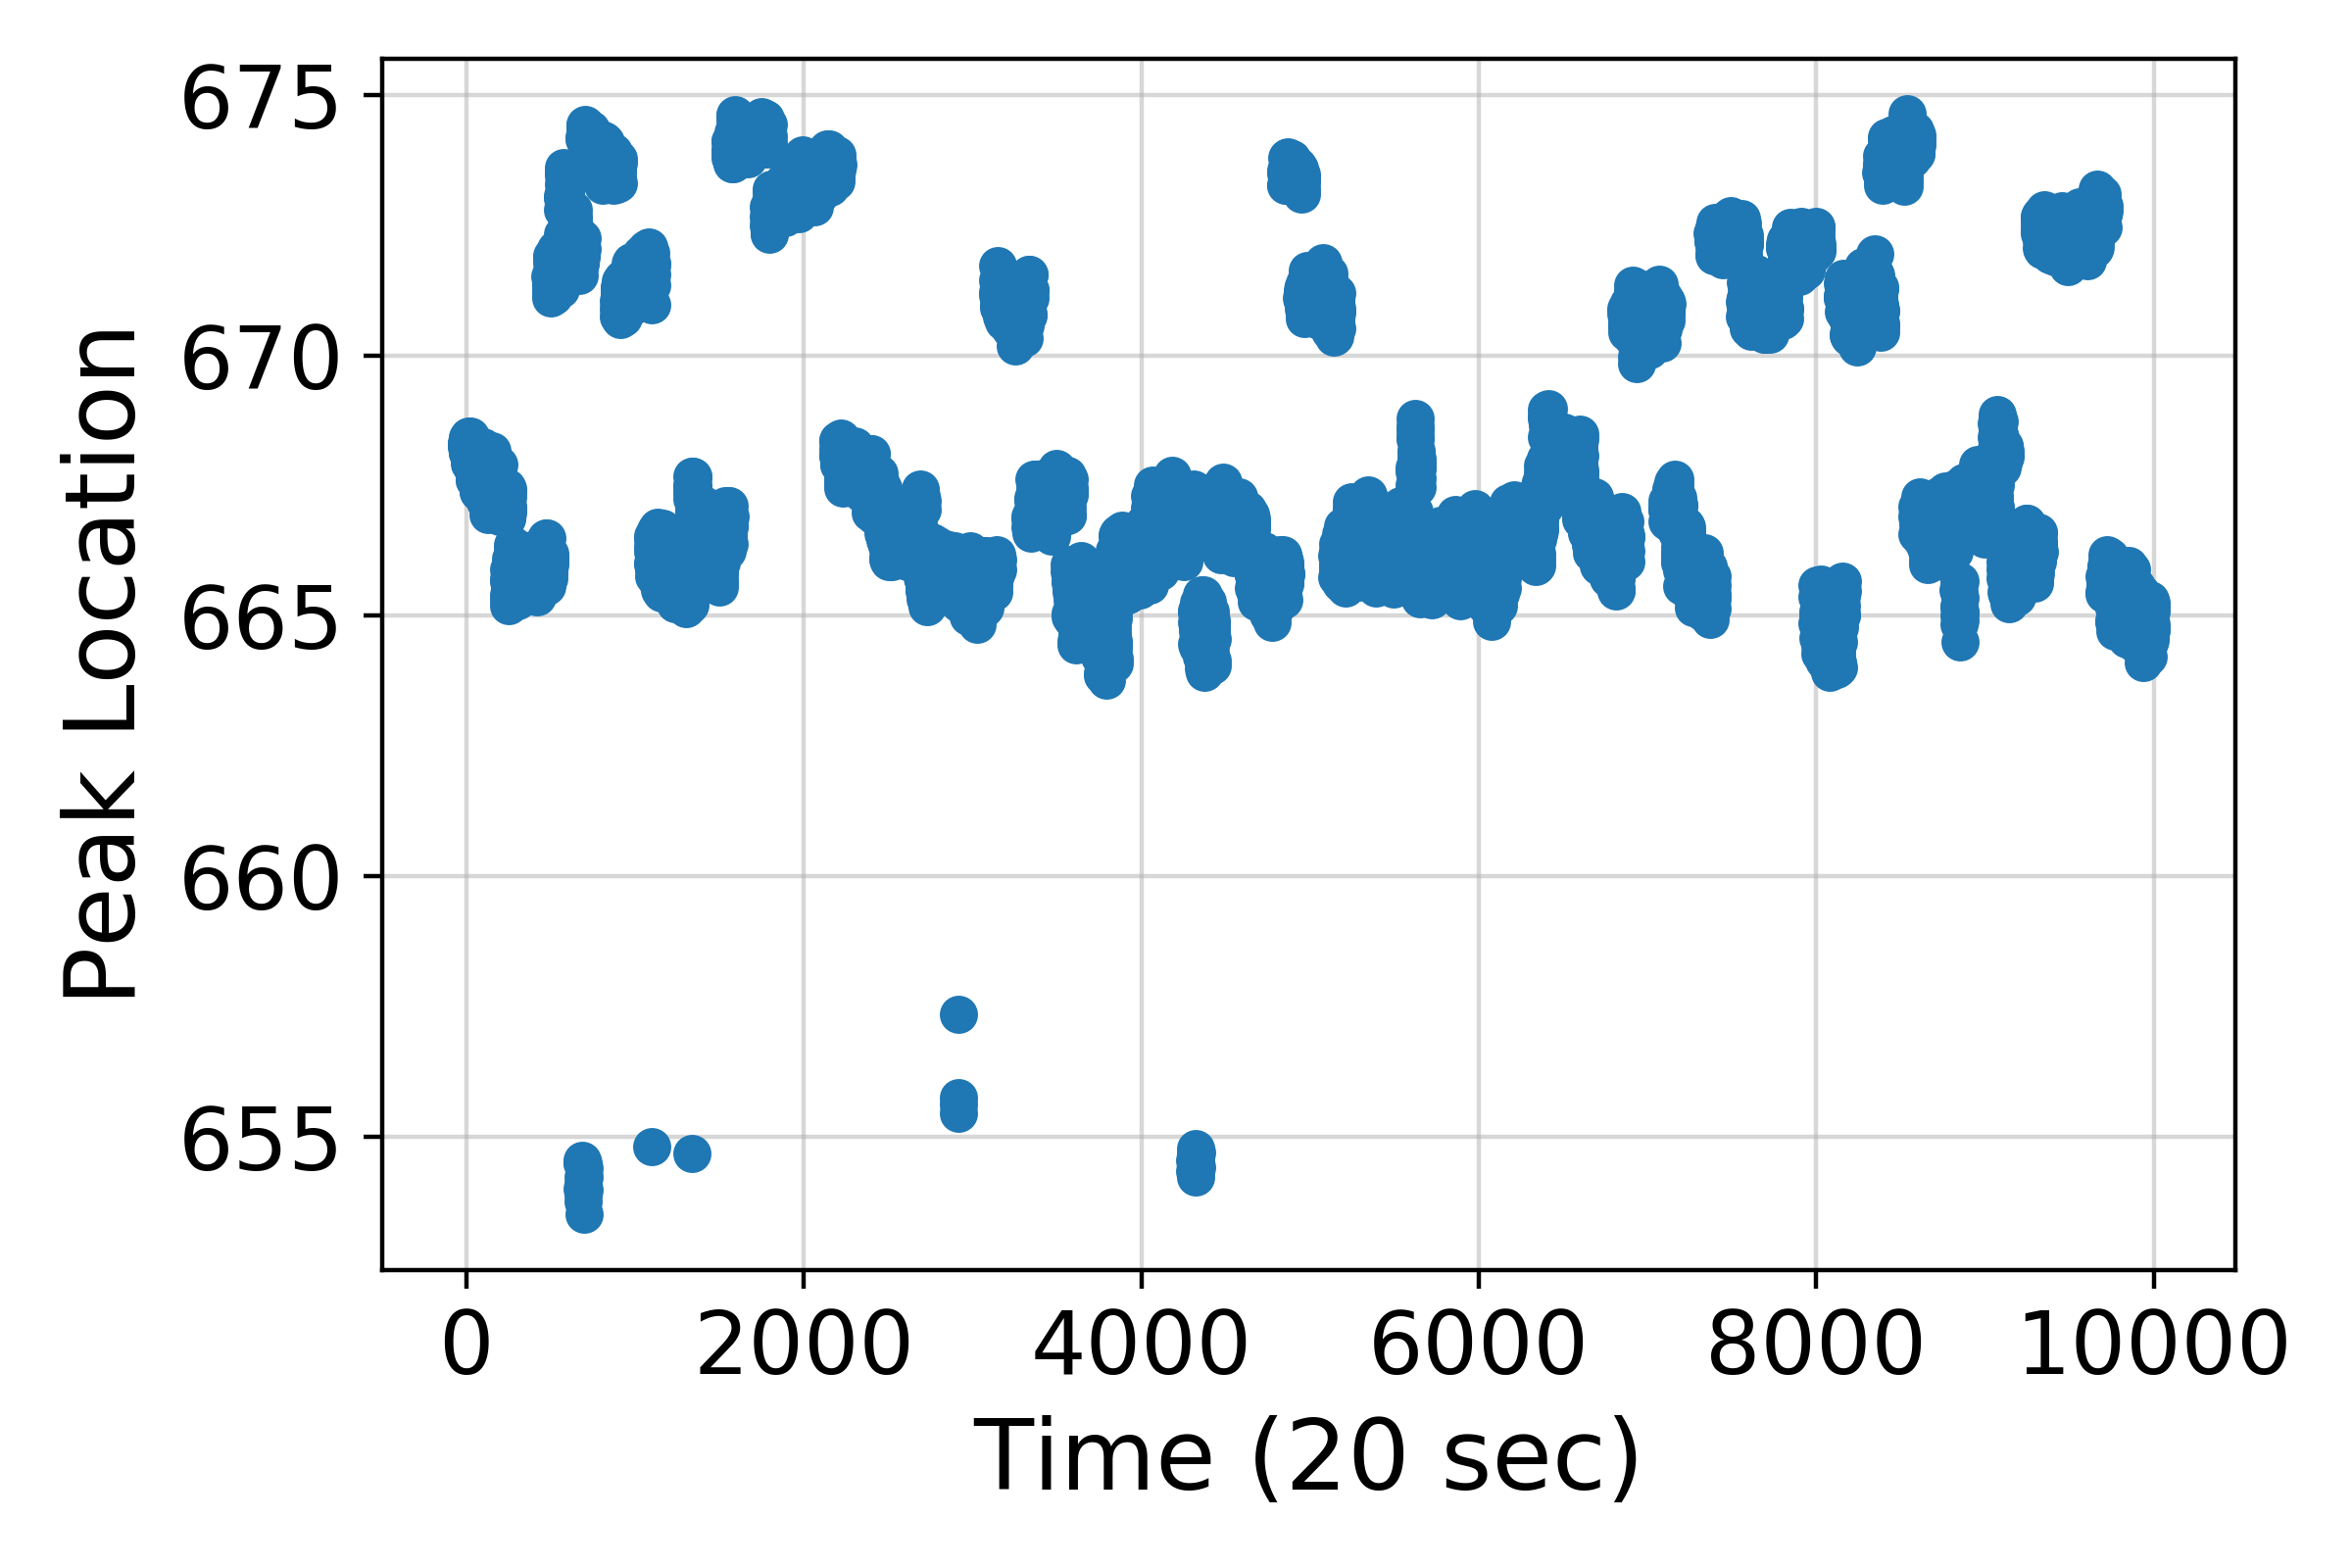
To track this shift, we have performed fits to every analogous timing spectrum representing sequential 20 second slices of beam irradiation. The fit model used two Gaussian functions, and cuts were made to ensure the fit converged and achieved an acceptable goodness-of-fit. For time periods where the fits were not of sufficient quality, the mean of adjacent fits was used instead. In general, poor fits were only returned when the beam was not irradiating the target. The resulting distribution of the position of the prompt gamma signal during the 3 MeV beam measurement is shown in figure 5(b). There appears to be continuous small-scale variability as well as sudden step-like changes. The origins of these timing variations are not known, however they have been corrected for in our analysis.
4 Results
4.1 Electron Recoil Analysis
The combined energy estimate for all events was based on the summed charge contributions of both NaI:Tl photomultipliers in both nuclear and electron recoil measurements. The electron recoil energy scale was set using gamma ray sources: 133Ba, 137Cs, 152Eu, and 241Am. The spectral peaks were fit to a Gaussian function on a linearly interpolated background.
We corrected the measured charge in the NaI:Tl detector for the known non-linear electron recoil response [18, 19] to obtain a linearised electron-equivalent energy scale. A small non-linearity remained evident at high energies, which was accounted for by using a piecewise linear fit based on a linear calibration of the low-energy peaks below 80 keV and a separate calibration based on the high energy peaks above this energy.
A shift in the energy scale was evident during the irradiation, based on the movement of the location of the gamma ray associated with the first excited state of 127I at 57.6 keV. These could have been gain variations in the photomultipliers or due to differences in the spatial location of source calibration and beam events. The shifts were accounted for by tracking the position of this peak at the different beam energies and applying a uniform energy scale correction. Only the low-angle liquid scintillator detectors with iodine recoil energies less than 5 keV were used in the gain correction, so that the contribution from the iodine recoil energies did not strongly affect the peak location. (Note that the low quenching factor reduces the correction to approximately 250 eV.) The uncertainty of the corrections was limited by the number of inelastic scattering events collected at these angles, which translates to an additional 1% uncertainty in the quenching factor results to account for the variability in the energy scale.
The energy resolution of the linearised NaI:Tl energies was fitted with a function proportional to the square root of the energy, and this function was used to smear the simulated spectra (section 5) with the experimental resolution.
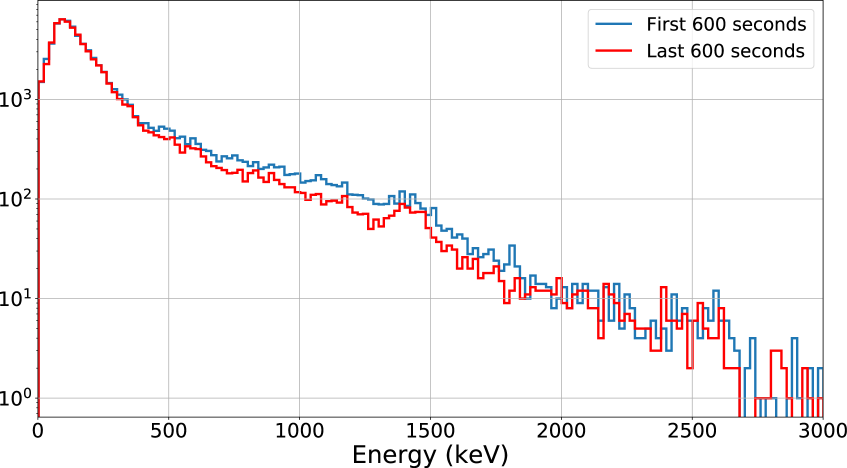
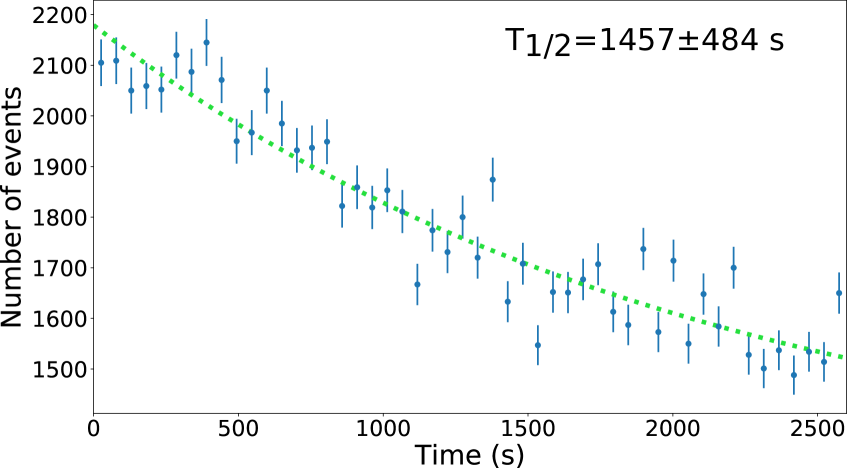
Following the irradiation, we captured background measurements of the NaI:Tl to investigate the activation of the crystal. The background rate varied throughout the 2600 second measurement, especially in the 450 keV to 2000 keV range (figure 6(a)). A fit of the decay to an exponential function with constant background in this region gives a half-life of 1457 484 seconds, which is consistent with the 128I half-life of 1499.4 1.2 seconds. 128I is expected to be produced abundantly via neutron capture on 127I.
4.2 Nuclear Recoil Analysis
Nuclear recoils were selected using timing cuts and particle identification cuts in the liquid scintillator detectors.
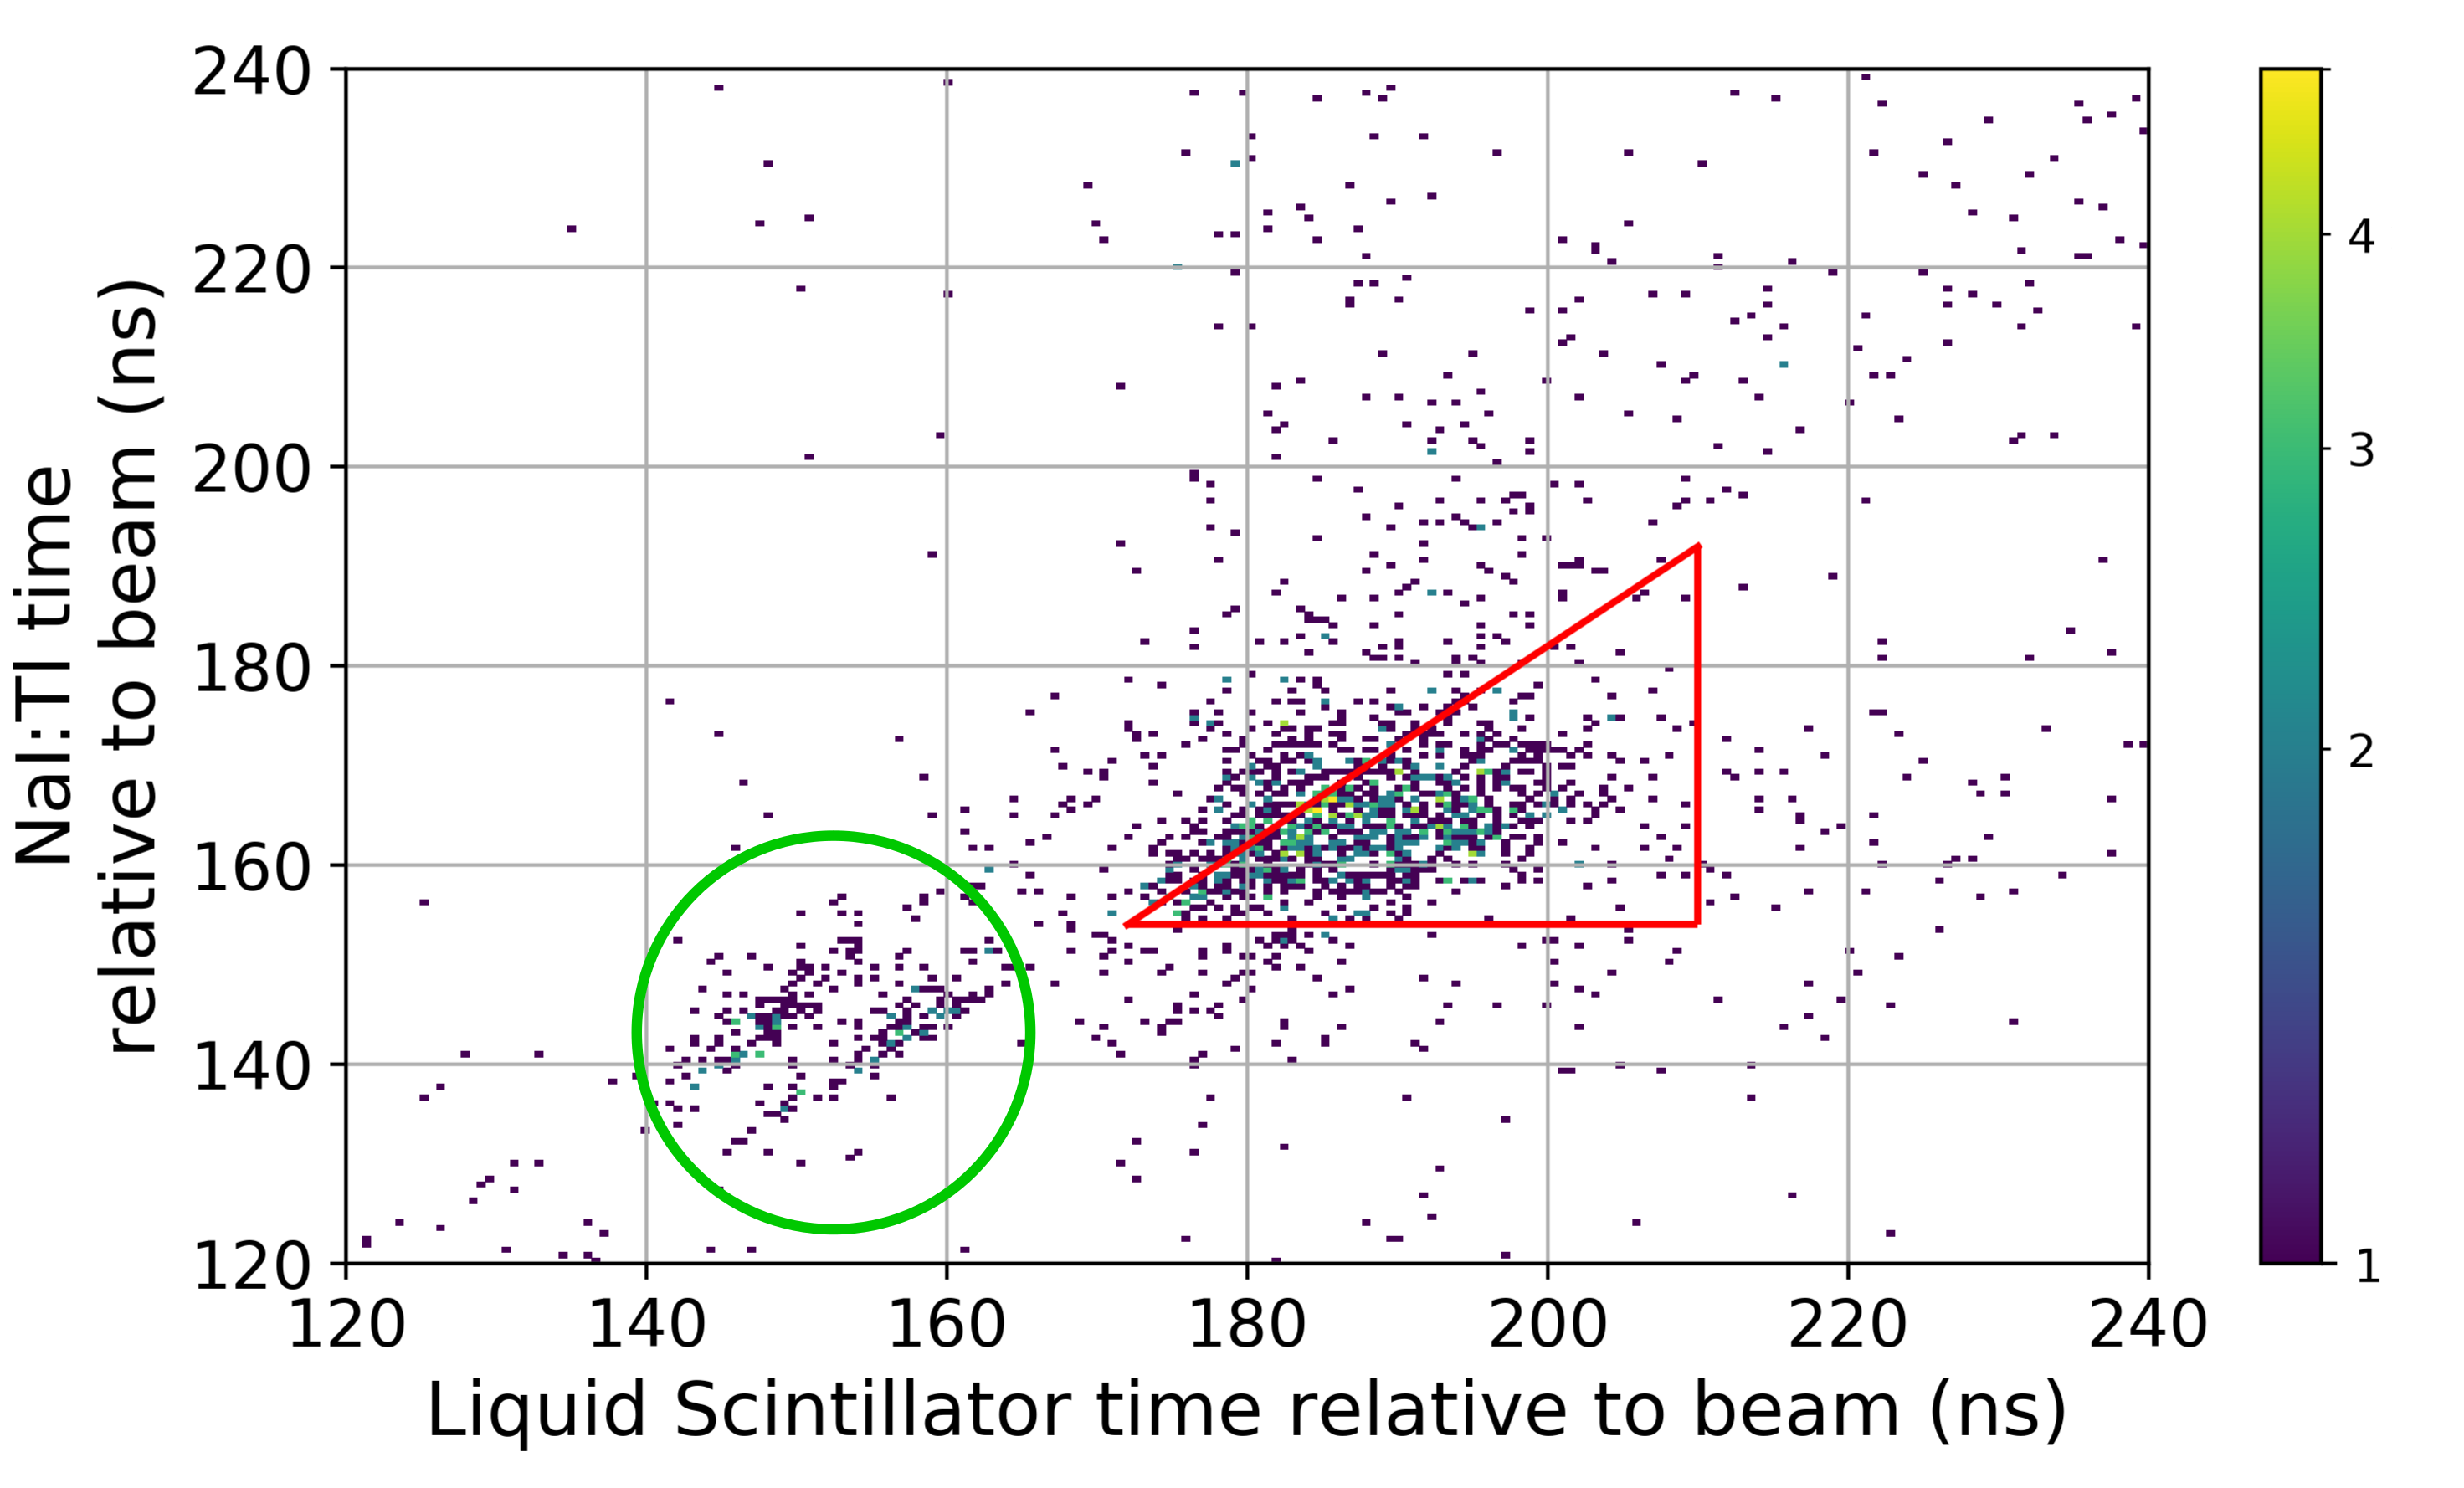
Figure 7 shows a time correlation plot (relative to the beam pulse time) for the 3 MeV proton beam dataset at 90∘ recoil angle. The population lying along the diagonal line represents fast coincidences from events such as Compton-scattered gamma rays and cosmic ray showers. The excess along this line (green circle, figure 7) is due to prompt gamma ray interactions in both detectors. The timing distribution exhibits a bimodal spread due to a 10 ns offset that appeared in the digitizer, which is especially apparent in the prompt signal. This extra timing spread has required the use of stringent timing cuts, which are expected to affect the statistical power of the measurement but not the recoil spectrum. The nuclear recoil events are delayed in both the NaI:Tl detector and the liquid scintillator detectors, and the cut region used to select these events is shown on the figure. Given the measurement geometry used to generate the plot, the neutron arrival time should be delayed by ns and ns relative to the prompt gamma burst for the NaI:Tl and liquid scintillator detectors, respectively. These predicted times are consistent with the observed delays in figure 7). Analogous cuts were made for all detectors and beam energies.
5 Simulation
5.1 Neutron Beam Generation
We used the Geant4 toolkit, version 10.5 [20], to simulate the neutron interactions within the experimental geometry. In order to properly simulate the low energy neutrons generated for this experiment, we used the "QGSP_BIC_HP" physics list. This list uses nuclear data to transport neutrons with energies less than 20 MeV with high precision. Range cuts for neutrons and protons were reduced to zero in order to invoke the Geant4 processes needed to accurately simulate low energy behaviour. Primary neutrons were emitted in a 1 mm radius beam spot from the centre of the LiF target.
The energies and momenta of the neutrons were calculated using SimLiT [14]. SimLiT is a specialized Monte Carlo computational tool designed to calculate the neutron energy and angle distributions produced from 7Li(p,n)7Be and 7Li(p,n)7Be∗ reactions for given proton beam and target parameters. SimLiT natively supports proton energies above the 7Li(p,n)7Be reaction threshold up to 3.5 MeV. This is lower than some of the energies used for our experiment. Therefore, we have extended the SimLiT energy range using neutron production cross sections from Liskien et al. [13] and LiF stopping powers from SRIM [21].
Due to neutron emission from the 7Be excited state, the proton beam produces two quasi-monoenergetic, forward-directed neutron beams. Neutrons from the 7Li(p,n)7Be∗ reaction make up 0.8%, 20%, and 10% of the total neutrons produced for the 2.44, 3 and 5.2 MeV proton beams respectively. Hence the 7Li(p,n)7Be∗ reaction contributes a non-negligible portion of the total neutrons produced, for all but the lowest energy.
5.2 Recoil Energies
We simulated the unquenched recoil spectra by tagging neutrons that deposit energy in the NaI:Tl and exit at a polar angle subtended by the front face of one of the liquid scintillator detectors used in our geometry. Figure 8 shows the fraction of the simulated neutrons that scattered in the NaI detector towards the scintillator placed at 67.5 degrees from the beam line for the initial 3 MeV proton energy; this represents 0.007% of the simulated events. Most of these events, approximately 73%, involve neutrons that travel straight into the NaI detector. However, the remaining 27% are neutrons that interact with other materials (predominantly the collimator) prior to reaching the NaI detector. Thus, they can have significantly different energies, as shown by the spread of events above the blue dashed line in figure 8. Of these, neutrons that are not emitted in the forward direction towards the collimator can reach the detector by scattering off beamline and vacuum fittings surrounding the target. Of the neutrons that scatter into the 67.5 degree scintillator, 7% are from the 7Li(p,n)7Be∗ reaction.
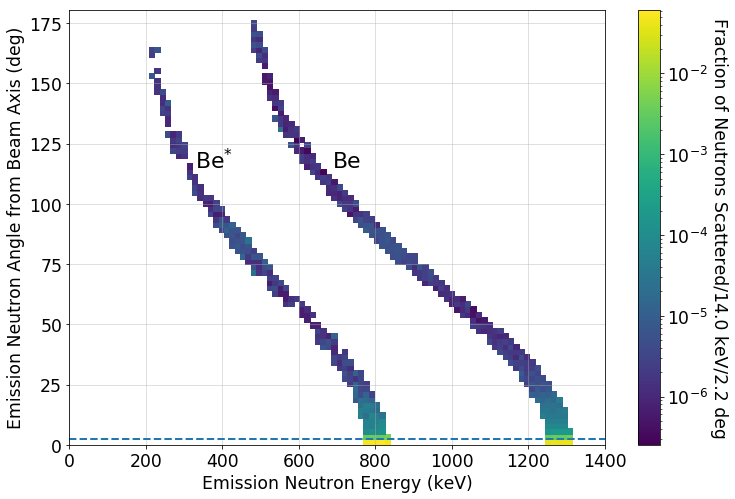
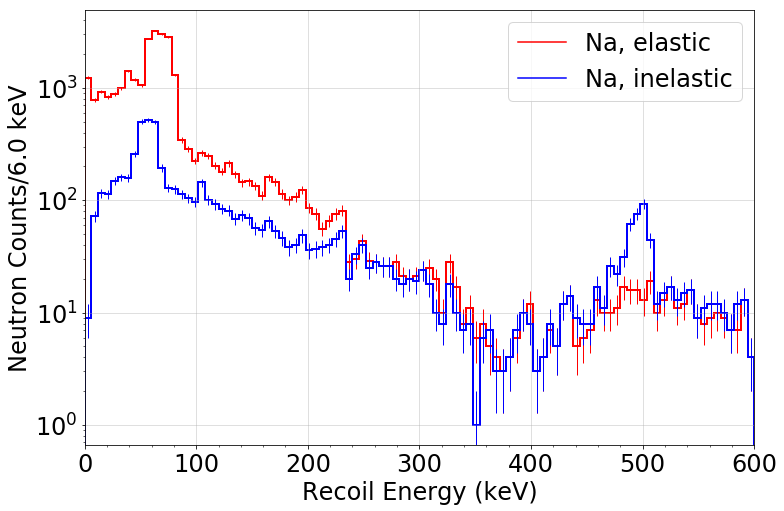
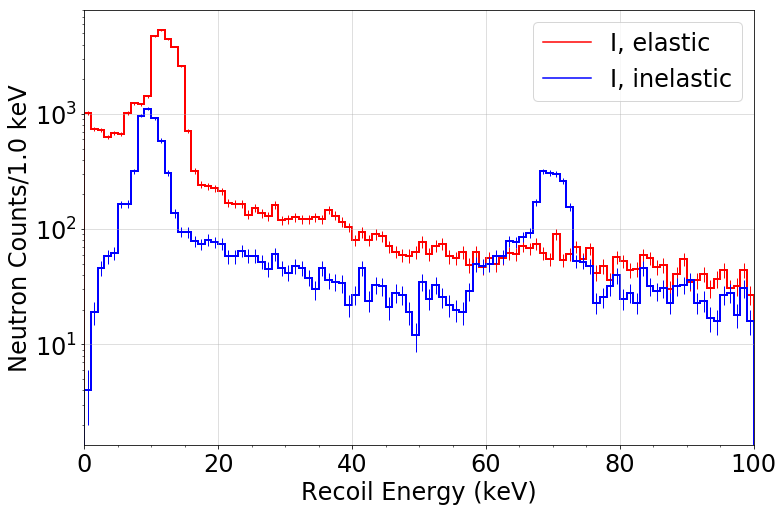
Figure 9 shows the energy spectrum associated with the neutrons that were scattered into the liquid scintillator placed at 67.5 degrees from the beam line. The non-resonant backgrounds in figures 9(a) and 9(b) are due to multiple neutron scattering, which makes up 23.8% of events. Smaller peaks seen to the left of their larger counterparts (for example the small elastic Na peak centred at 40 keV before the larger one centred at 60 keV) in figure 9(a) are due to neutrons from the 7Li(p,n)7Be∗ reaction. The elastic Na and I peaks in the low energy region <10 keV, are mainly due to events where neutrons lose energy in the collimator or aluminium casing before scattering in the detector. This was determined by comparing simulations where the collimator and aluminium casing were removed from the geometry.
6 Quenching Factor Analysis
Previous quasi-monoenergetic neutron studies of the quenching factor in NaI:Tl have fit the nuclear recoil peaks with Gaussian functions to extract the quenching factor. In our analysis, we have decided to fit the spectrum of simulated results to the experimentally measured recoil spectra. This approach allowed us to leverage the information contained in the inelastic recoil peaks, and also helped to incorporate complicating effects such as multiple scattering within the NaI:Tl, scattering from the collimator, and lower energy neutron emissions from the excited 7Be state. A comparative analysis involving fits with a simple Gaussian fit to the visible Na recoil peaks and linear background gave quenching factor results that differed from the spectrum fit analysis by between 7% and 43%. The fitted peak location also depended upon the choice of the fit range. Furthermore, not all recoil spectra could easily be fitted with a Gaussian. This is especially true for the higher beam energy data, where the elastic scattering peak was broadened by lower energy components associated with emissions from the excited 7Be state and inelastic scattering events where the gamma ray escaped the NaI:Tl.
6.1 Spectrum Fit
We applied multiplicative parameters to the simulated Na and I recoil energies to model the quenching factors. These parameters were adjusted so as to minimise the negative log-likelihood of the resulting simulated distribution, given the measured data.
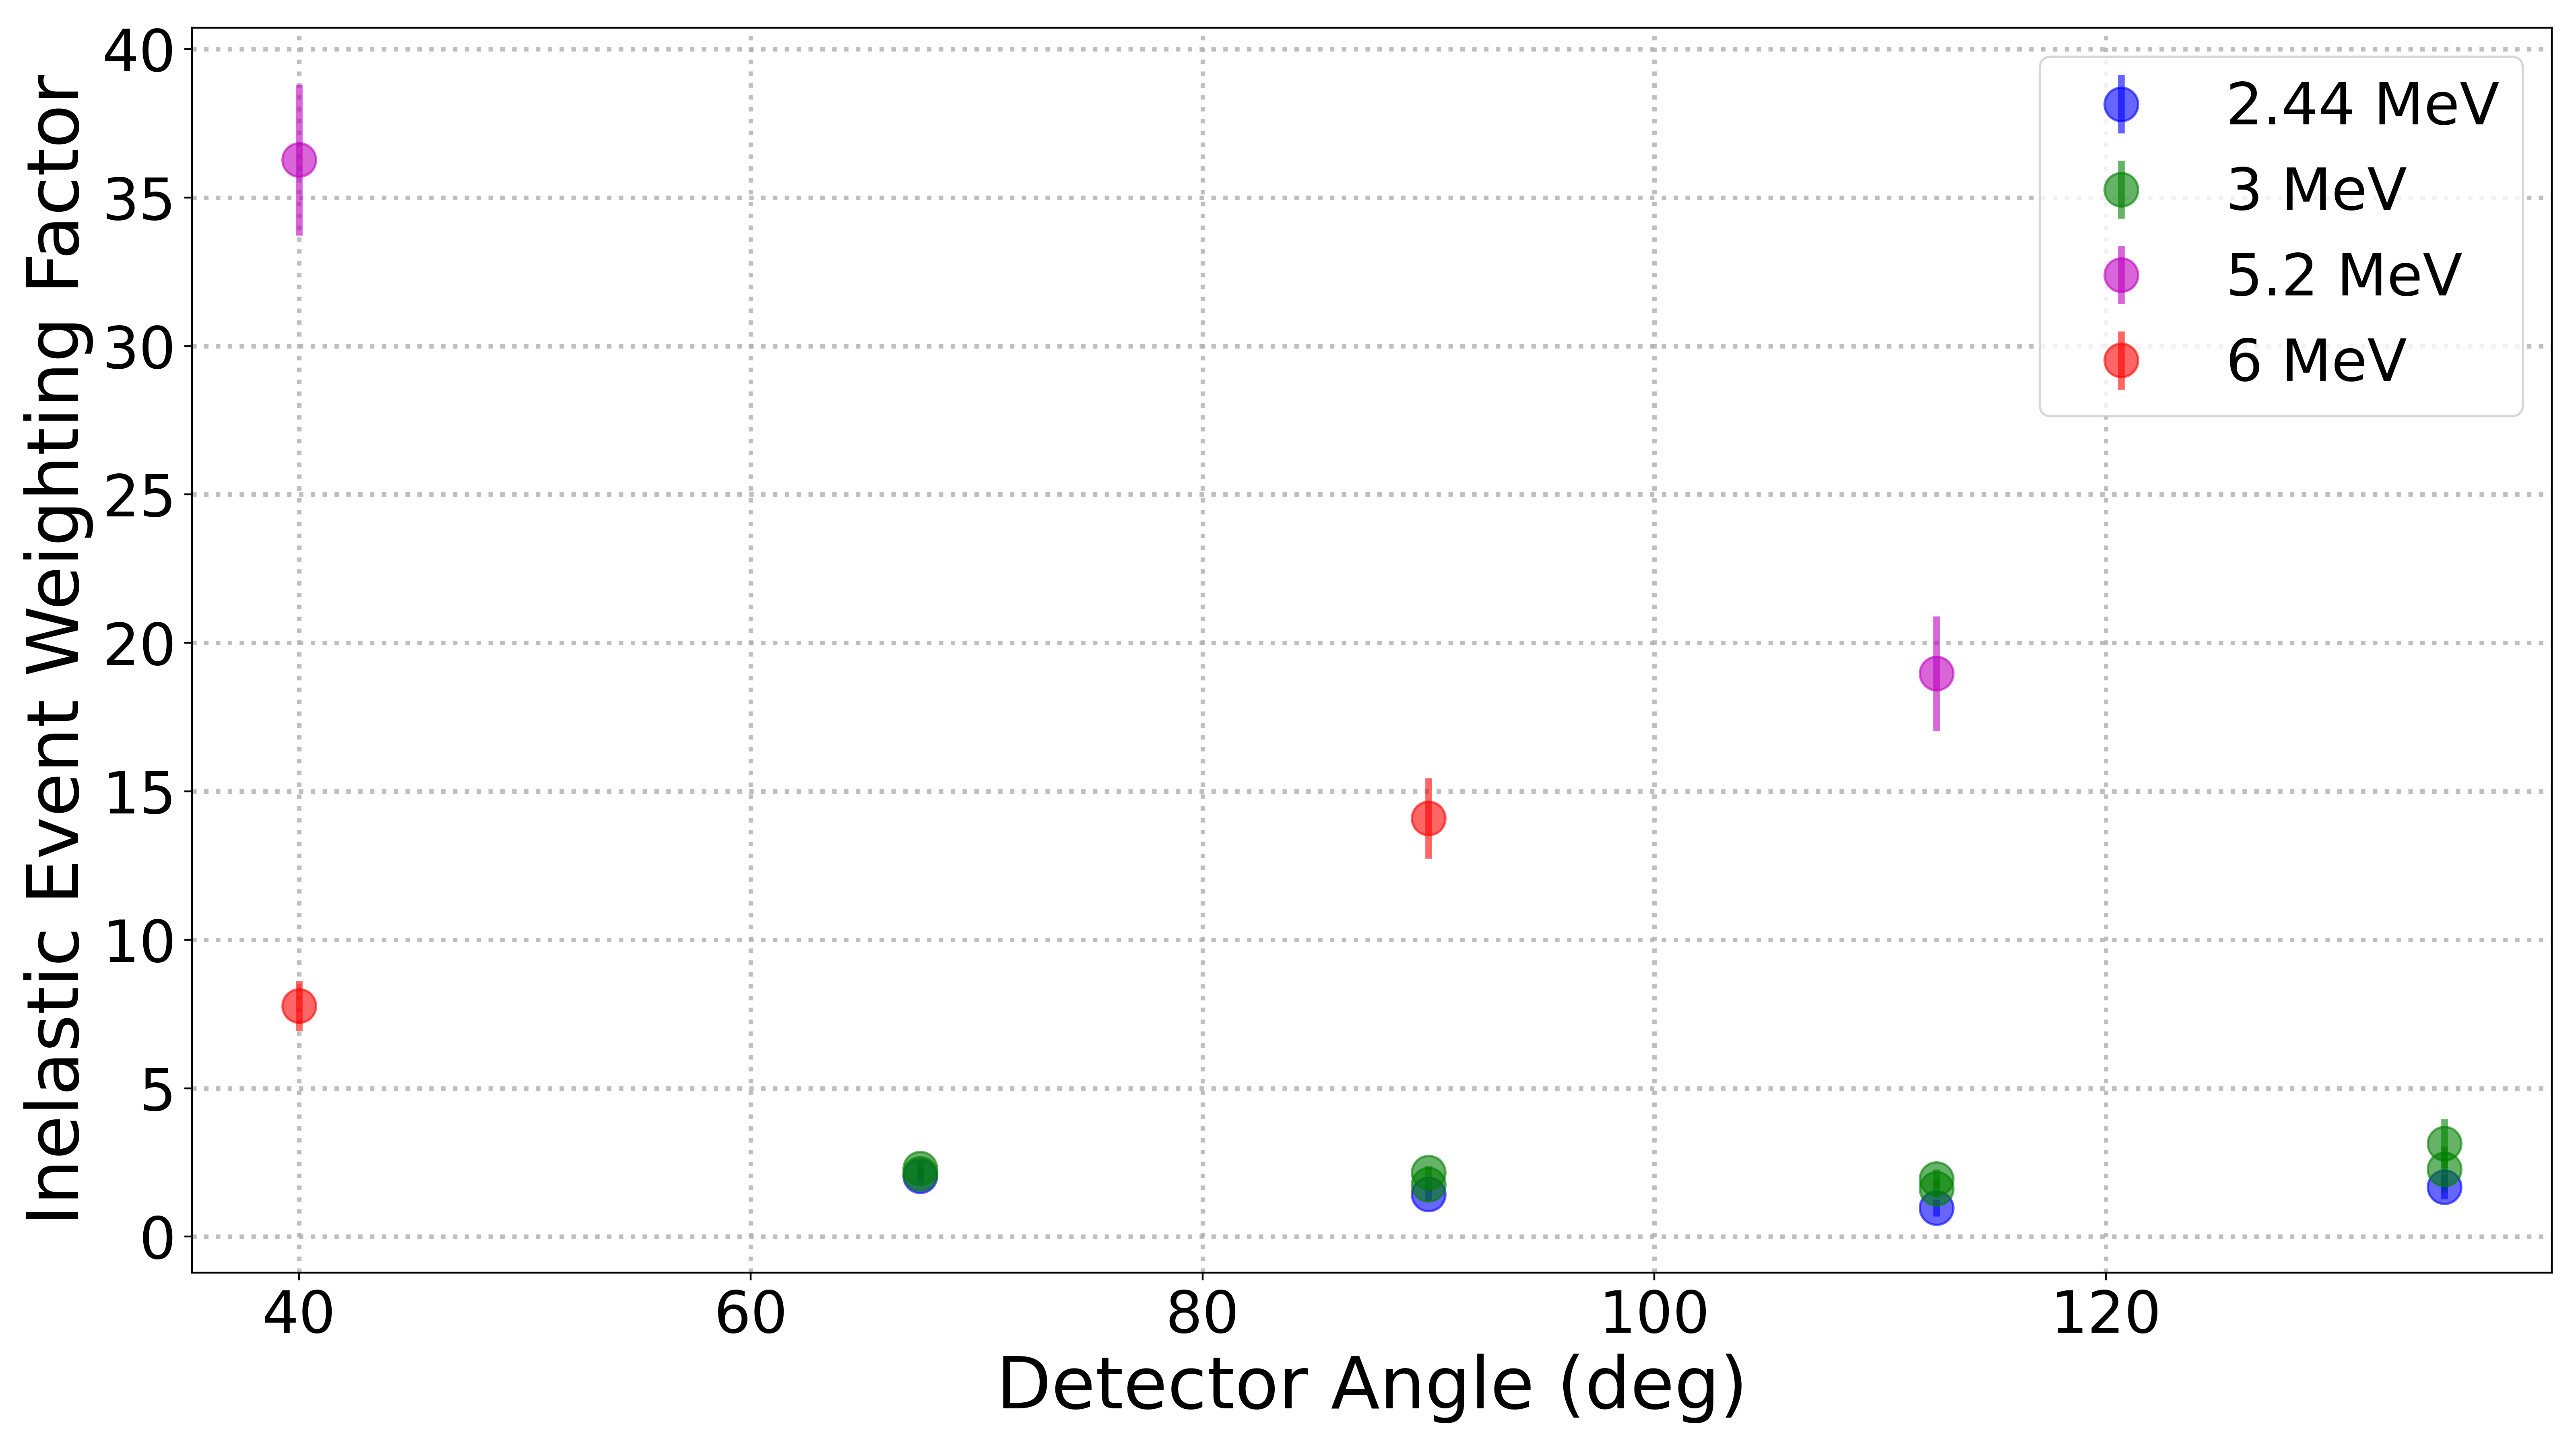
An important feature in the recoil spectra is the peak at 58 keV from the inelastic excitation of 127I. The energy deposit from such events is the sum of the 57.6 keV gamma ray and the recoiling nuclear energy deposit. Since the I recoil energies were low due to the experimental kinematics, and the I quenching factor is low, the location of this peak did not move during our measurements. However, this feature was consistently under-predicted by the Geant4 model at all neutron energies, which led to poor fits. To mitigate this effect, a third parameter was introduced in the likelihood model which weighted these inelastic scattering events. Figure 10 shows the fitted inelastic scattering weights, which were broadly consistent with being near 2 for the 2.44 MeV and 3 MeV beam energies, and higher for the higher beam energies.
The fitted detector resolution was applied to the simulated spectra to allow comparison with the experimental results. Our early analysis of the resolution smearing showed that smearing the quenched nuclear recoil energies tended to under-predict the widths of the associated features in the spectrum. Instead we have applied the energy resolution to the unquenched nuclear recoil energies; this gives a better fit to our measurements.
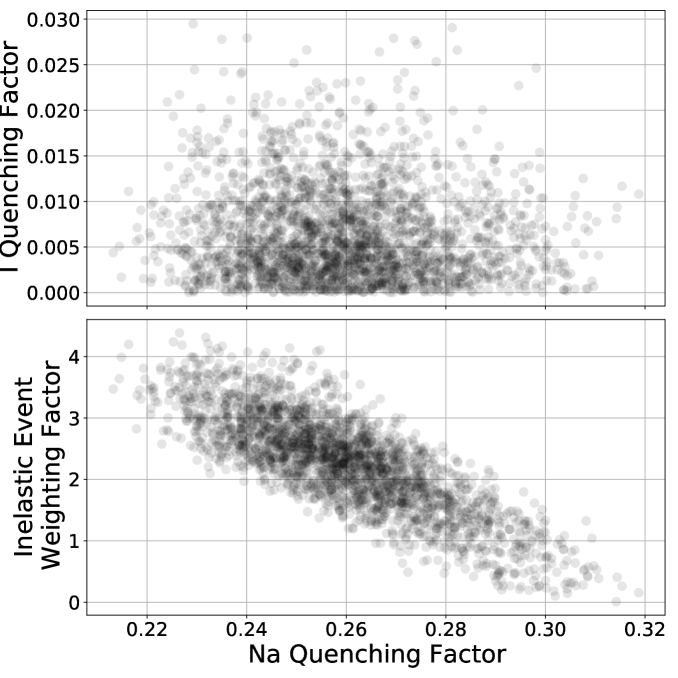
Once a maximum likelihood parameter estimate was made, we sampled via Markov Chain Monte Carlo in order to assess the posterior distribution of quenching factors and inelastic peak biasing allowed by the data. Figure 11 demonstrates this sampling for a single beam energy and liquid scintillator detector. Typical fits showed only weak correlations between the fit parameters, with the strongest correlation between the Na quenching factor and the peak biasing shown in the figure, with a correlation coefficient of 0.8. This correlation arose from a trade-off between the location of the Na elastic recoil peak and the inelastic I peak intensity, when the peaks were close in energy.
Recoil spectra were excluded from our analysis where the fitted quenching factors predicted recoil peaks below the 3 keV analysis threshold, since there is less informative data available to properly constrain the fit. Fits where the Na recoil peak coincided with the 57.6 keV inelastic excitation peak were also excluded, since this degeneracy also led to poor fitting constraints. The highest energy nuclear recoil distributions above the maximum fitted energy of 401 keV were also excluded, since these gave poor fits to the simulated spectra – the Na elastic recoil peak tended to be broader than expected from simulation, and this flat spectrum did not adequately constrain the fit parameters.
6.2 Results
l0.3inb1.4in(())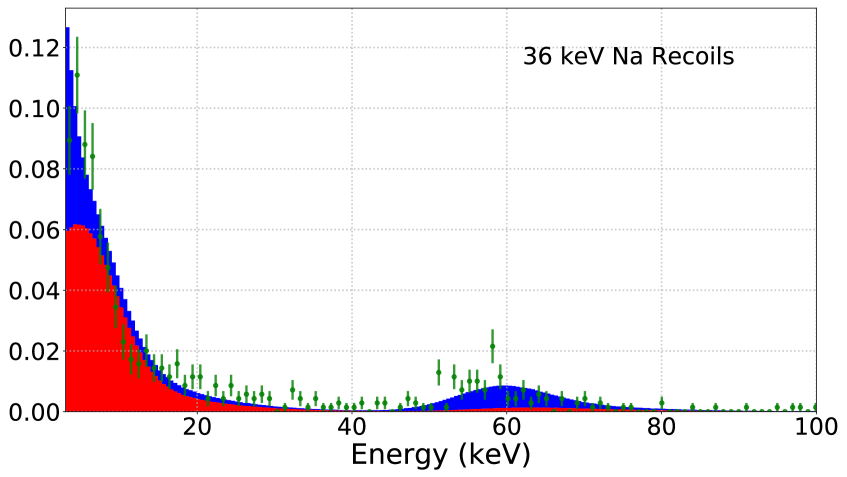
l0.3inb1.4in(())
l0.3inb1.4in(())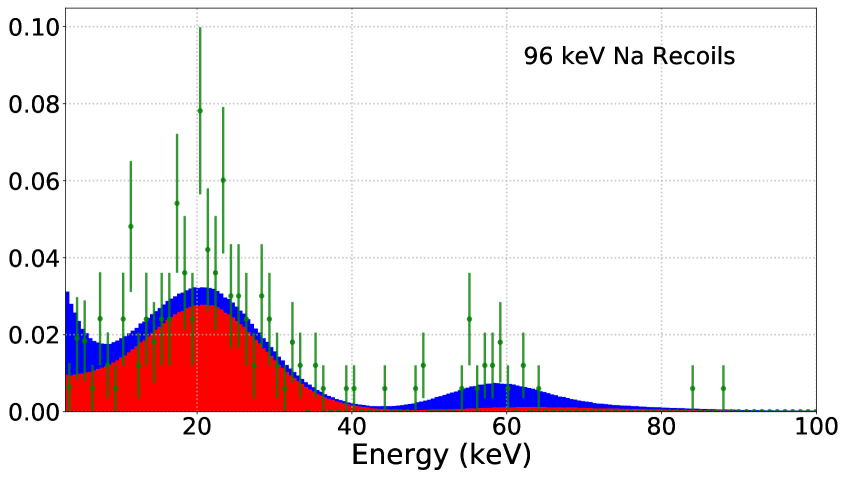
l0.3inb1.4in(())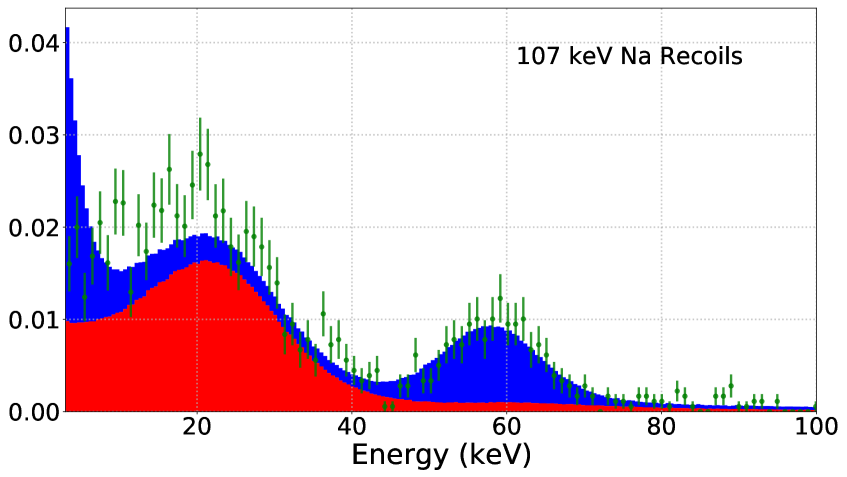
l0.3inb1.4in(())
l0.3inb1.4in(())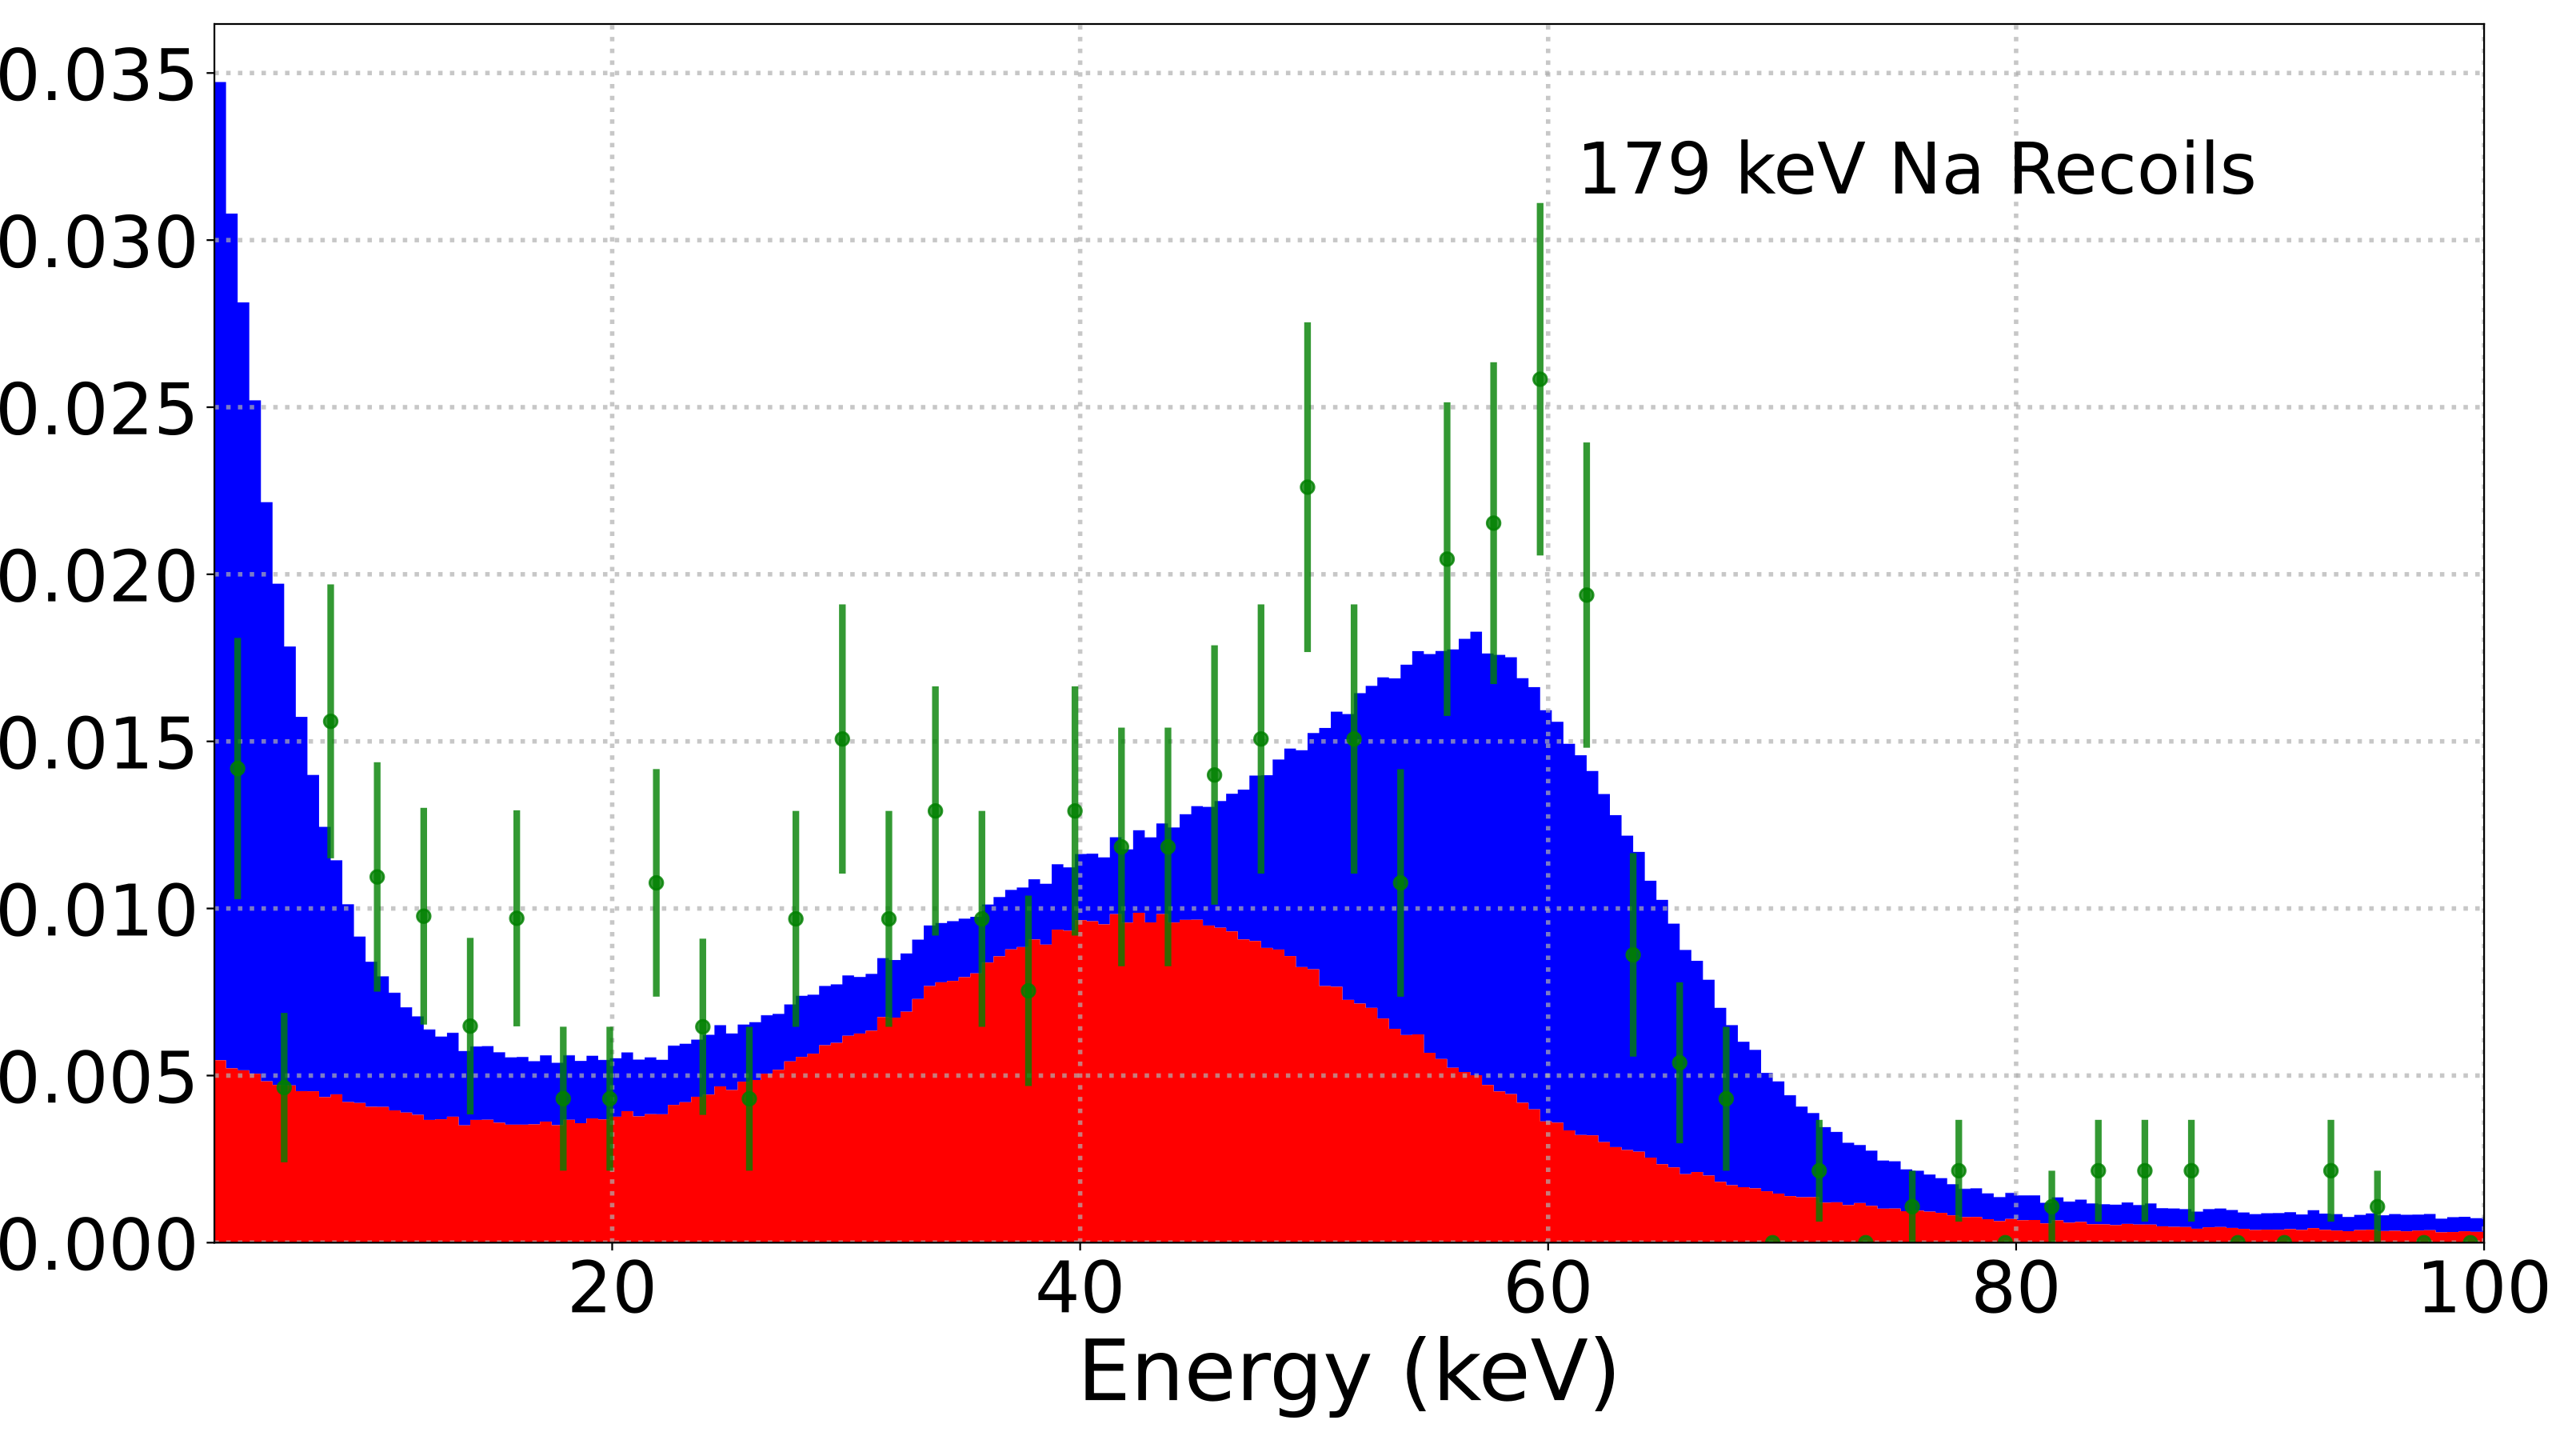
l0.3inb1.4in(())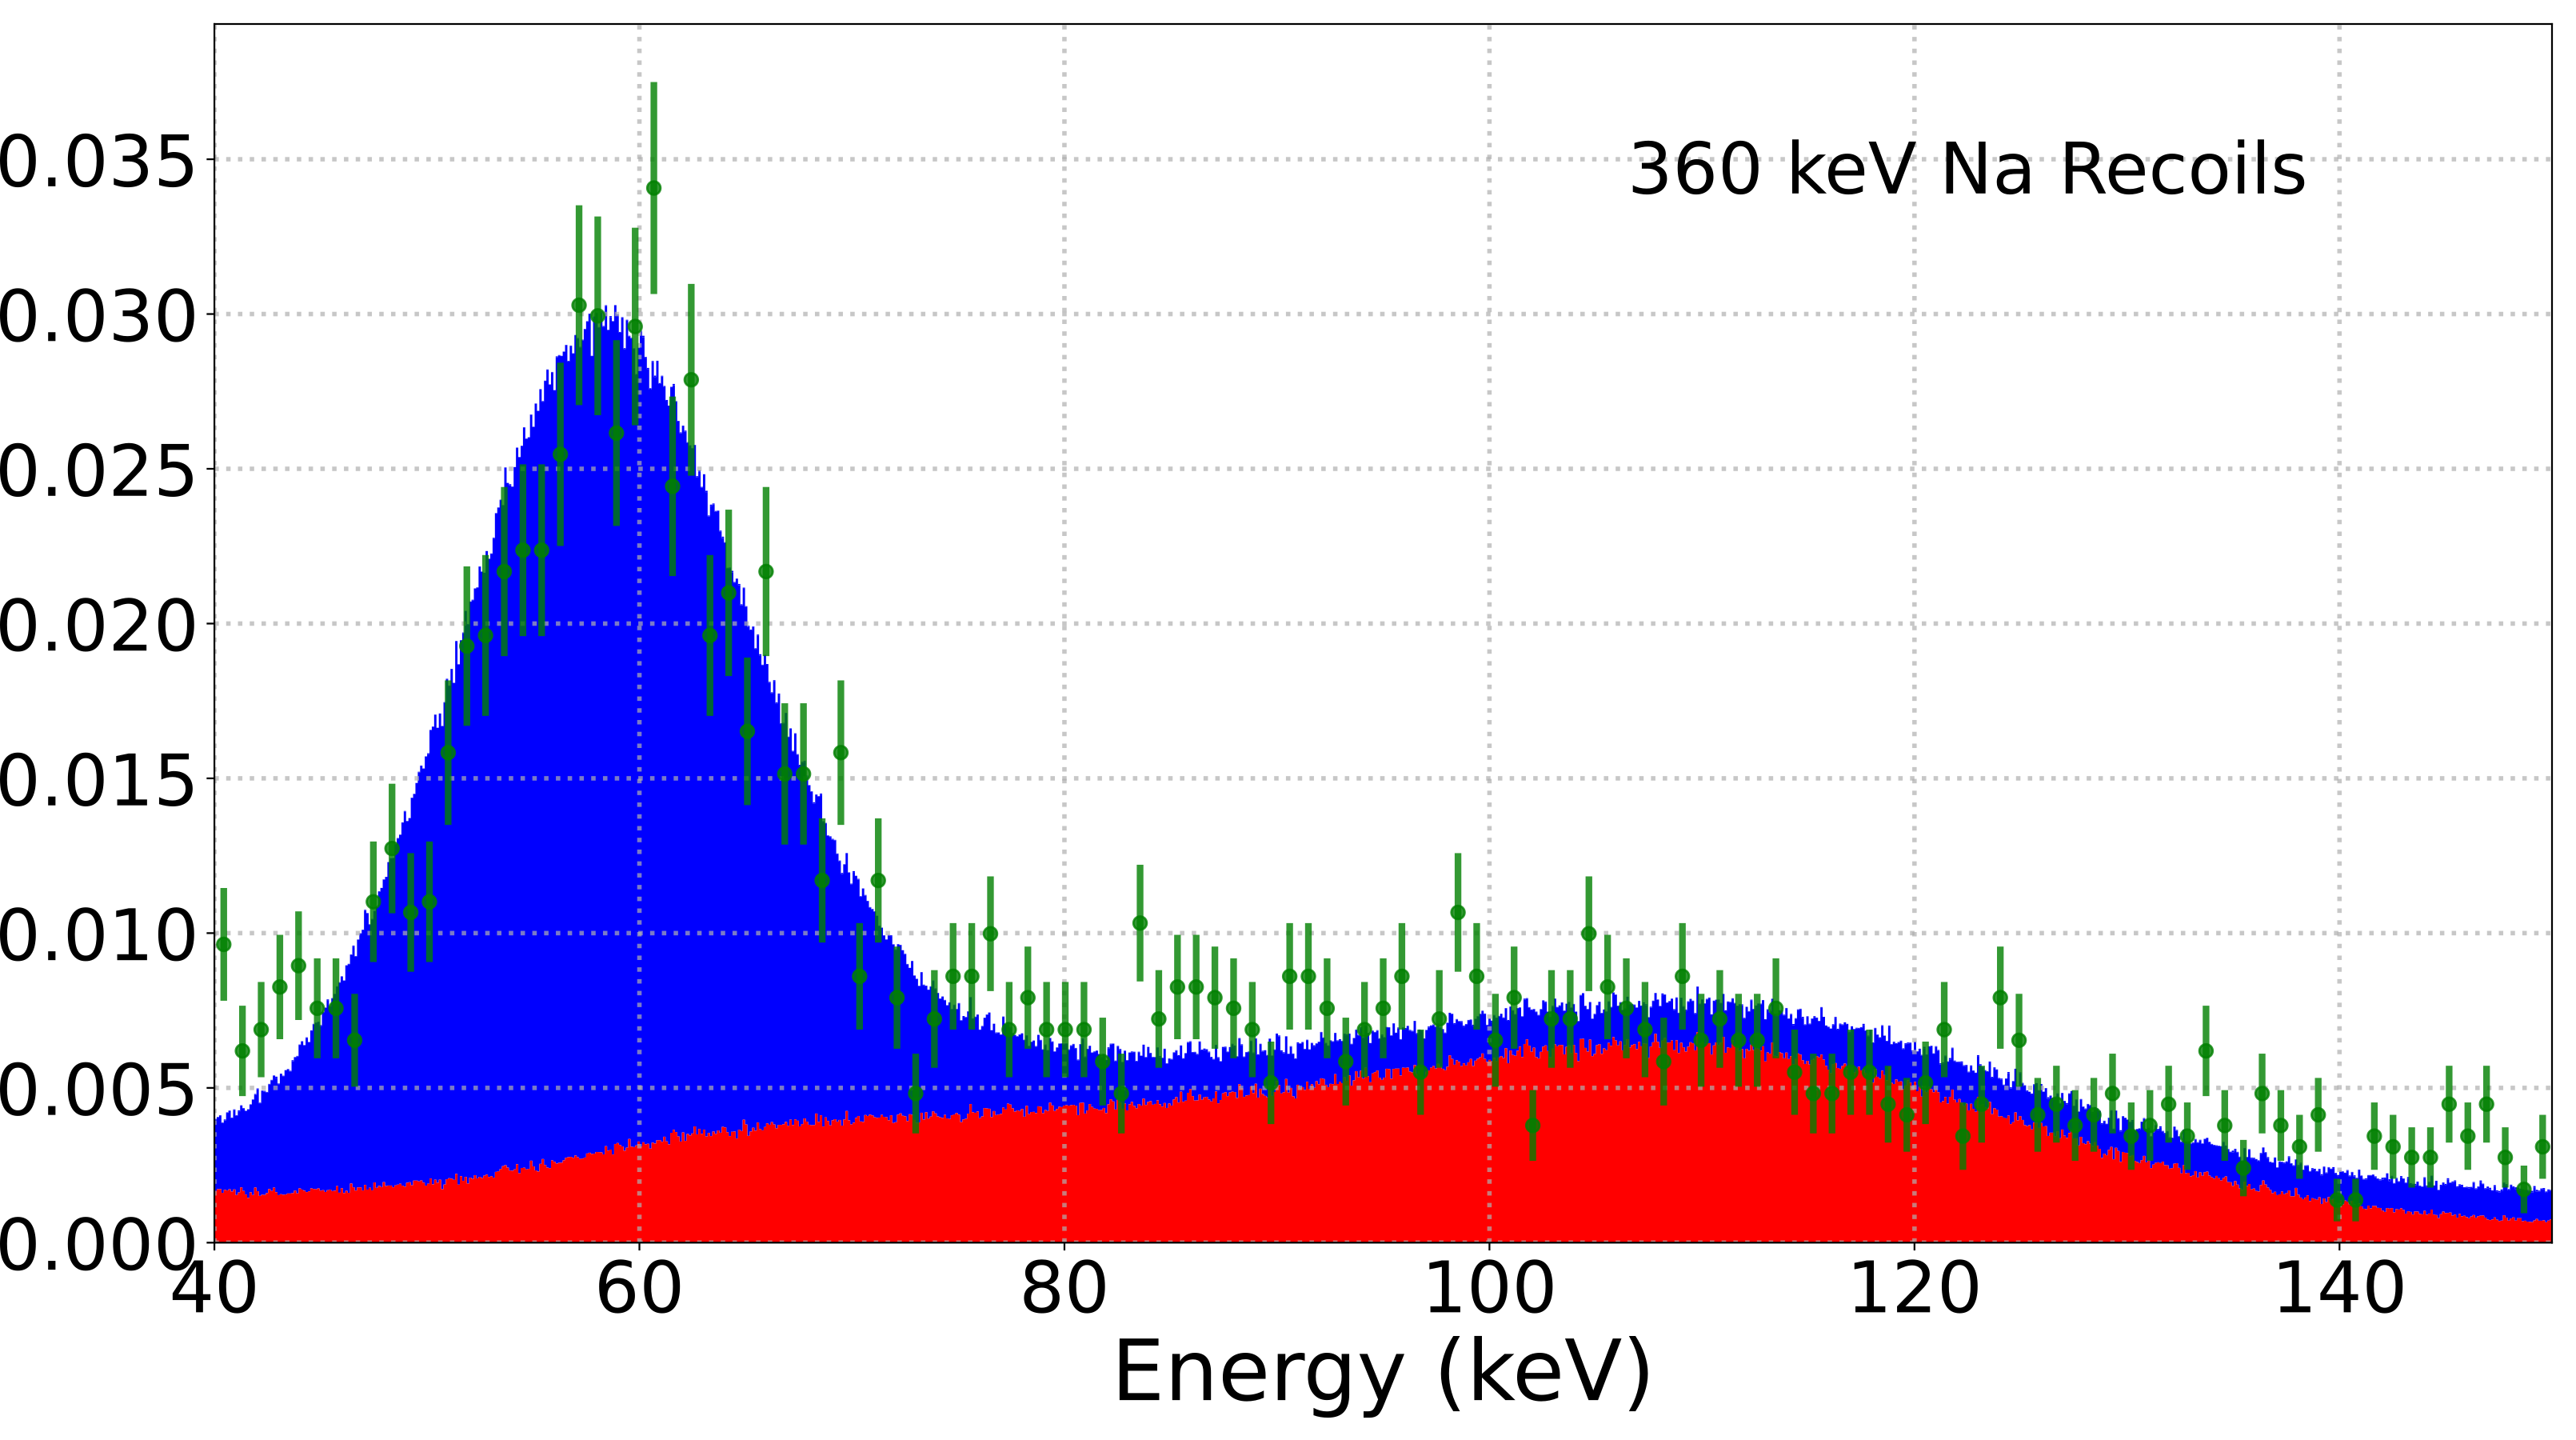
l0.3inb1.4in(())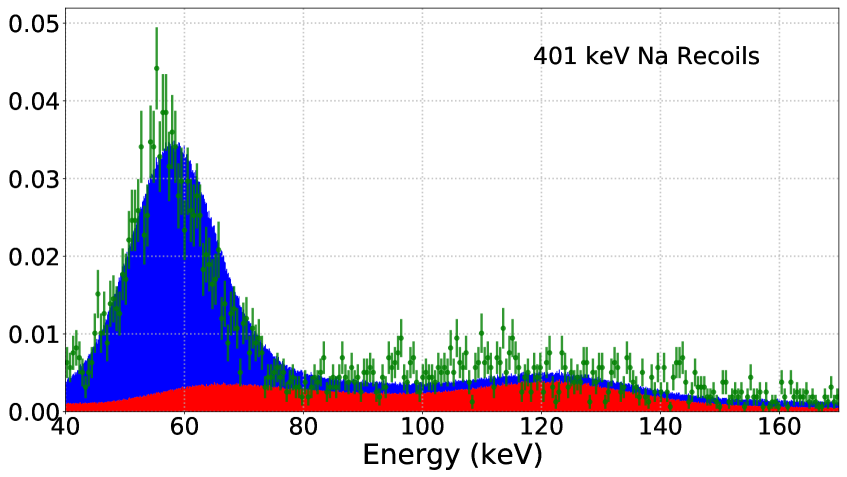
Figure 12 shows some of the fitted recoil spectra across the range of Na recoil energies studied. The fits describe the data reasonably well around the recoil peak and the inelastic excitation lines. The low-energy rise is due to the tail of the I elastic scattering peak.
We chose the fit range to be as large as possible to make full use of the measured data, including the inelastic excitation peaks, which carry information about the iodine recoils that would otherwise fall below threshold. An exception is the highest energy fitted Na recoils, associated with the 112.5∘ detector at 5.2 MeV beam energy, and the 90∘ detector at 6 MeV beam energy. In these cases the elastic scattering distributions were quite broad and these fits tended to find quenching factors which optimised the Na elastic scattering to other features of the spectrum. In these cases the fit was performed using a restricted energy range to avoid this problem (figures 12(g) and 12(h)).
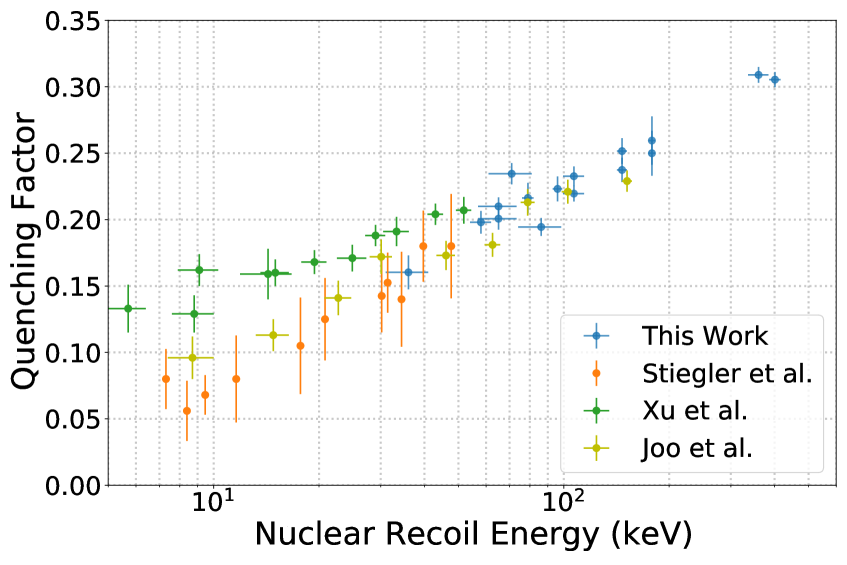
The Na recoil quenching factors are given in figure 13 and table 1. The Na recoil energies are taken to be the mean of the elastic scattering peak predicted by SimLiT.
Our fits also included the I quenching factor. These were constrained by the location of the main iodine inelastic excitation peak. However, these quenching factors tended to have large uncertainties and are not reported. The covariance between the I and Na quenching factors was not large for any of the fits, so that the poor constraints on the I quenching factors do not strongly influence the Na results.
The systematic errors that could affect our results have been minimised as much as possible. The event selection for tagging nuclear recoil events was deliberately chosen to be relatively conservative to avoid contamination from electron recoil events, and we assume that the small remaining proportion of such events does not affect the quenching factor in a significant way. An imperfect knowledge of the resolution and energy calibration at low energies can also give rise to systematic errors. The resolution model was extrapolated below the energy threshold, which reproduced the observed rise at low energy associated with the tail of the iodine elastic scattering peak. The effect of these sources of systematic error is difficult to assess quantitatively, however we assume such errors are small owing to our relatively high analysis threshold.
| Scattered neutron angle | Proton Beam Energy (MeV) | Recoil Energy (keV) | Quenching Factor |
|---|---|---|---|
| 67.5∘ | 2.44 | 36 5 | 0.160 0.013 |
| 90∘ | 2.44 | 58 1 | 0.198 0.009 |
| 67.5∘ | 3 | 65 8 | 0.201 0.008 |
| 67.5∘ | 3† | 65 8 | 0.210 0.007 |
| 40∘ | 5.2 | 71 10 | 0.235 0.008 |
| 112.5∘ | 2.44 | 79 3 | 0.216 0.011 |
| 40∘ | 6 | 86 12 | 0.194 0.007 |
| 135∘ | 2.44 | 96 3 | 0.223 0.009 |
| 90∘ | 3 | 107 7 | 0.233 0.007 |
| 90∘ | 3† | 107 7 | 0.220 0.006 |
| 112.5∘ | 3 | 147 5 | 0.252 0.010 |
| 112.5∘ | 3† | 147 5 | 0.237 0.009 |
| 135∘ | 3 | 179 4 | 0.260 0.018 |
| 135∘ | 3† | 179 4 | 0.250 0.017 |
| 90∘ | 6 | 360 24 | 0.309 0.006 |
| 112.5∘ | 5.2 | 401 15 | 0.305 0.006 |
7 Discussion and Future Work
Our results are self-consistent across two measurement campaigns and different neutron beam energies. They are also consistent with previous measurements insofar as they show a decreasing quenching factor with recoil energy. There is some tension amongst the previous studies, which may arise from a crystal-dependence to the quenching factor or systematic differences between the methodologies employed in those studies. Our measurement results show a mild preference for the lower quenching factors amongst those previously measured, though we were limited in our ability to examine these differences by the relatively high energy threshold.
The main outcome of this work is to demonstrate a spectrum fitting methodology for the measurement of the Na quenching factors in NaI:Tl with 7Li(p,n)7Be neutrons. Our fits exhibit excellent agreement with the experimental results over a wide energy range. We intend to perform similar measurements using this methodology on high quality NaI:Tl off-cuts from the SABRE experiment’s crystals [3] in an optimised enclosure and measurement geometry. These measurements will allow a lower energy quenching factor determination and help to probe any crystal dependence.
8 Acknowledgements
We would like to thank the technical staff at the ANU Heavy Ion Accelerator Facility, who fabricated detector housings, built the beamline hardware, and carefully aligned the detectors in the correct geometry. We would also like to thank A. Duffy from Swinburne University for the use of his NaI:Tl crystal. This work was supported by the Australian Research Council Discovery Program through project number DP170101675.
References
- [1] P. A. Zyla et al., Review of particle physics, Progress of Theoretical and Experimental Physics 2020 (2020) 083C01.
- [2] R. Bernabei, P. Belli, A. Bussolotti, F. Cappella, V. Caracciolo, R. Cerulli et al., First model independent results from DAMA/LIBRA-phase2, Nuclear Physics and Atomic Energy 19 (2018) 307–325.
- [3] M. Antonello, E. Barberio, T. Baroncelli, J. Benziger, L. J. Bignell, I. Bolognino et al., The SABRE project and the SABRE Proof-of-Principle, The European Physical Journal C 79 (2019) .
- [4] G. Adhikari, P. Adhikari, E. B. de Souza, N. Carlin, S. Choi, M. Djamal et al., Search for a dark matter-induced annual modulation signal in NaI(Tl) with the COSINE-100 experiment, Physical Review Letters 123 (2019) .
- [5] J. Amaré, S. Cebrián, I. Coarasa, C. Cuesta, E. García, M. Martínez et al., First results on dark matter annual modulation from the ANAIS-112 experiment, Physical Review Letters 123 (2019) .
- [6] A. Hitachi, Liquid rare gases and inorganic scintillators for WIMP searches, in The Identification of Dark Matter, pp. 344–349, 2005, DOI [https://www.worldscientific.com/doi/pdf/10.1142/9789812770288_0047].
- [7] R. Bernabei, P. Belli, V. Landoni, F. Montecchia, N. W. Di, A. Incicchitti et al., New limits on WIMP search with large-mass low-radioactivity NaI(Tl) set-up at Gran Sasso, Physics Letters B 389 (1996) 757 .
- [8] J. I. Collar, Quenching and channeling of nuclear recoils in NaI(Tl): Implications for dark-matter searches, Phys. Rev. C 88 (2013) 035806.
- [9] J. Xu, E. Shields, F. Calaprice, S. Westerdale, F. Froborg, B. Suerfu et al., Scintillation efficiency measurement of Na recoils in NaI(Tl) below the DAMA/LIBRA energy threshold, Phys. Rev. C 92 (2015) 015807.
- [10] T. Stiegler, C. Sofka, R. C. Webb and J. T. White, A study of the NaI(Tl) detector response to low energy nuclear recoils and a measurement of the quenching factor in NaI(Tl), arXiv [physics.ins-det] (2017) 1706.07494.
- [11] H. Joo, H. Park, J. Kim, J. Lee, S. Kim, Y. Kim et al., Quenching factor measurement for NaI(Tl) scintillation crystal, Astroparticle Physics 108 (2019) 50 .
- [12] Bignell, L. J., Barberio, E., Froehlich, M. B., Lane, G. J., Lennon, O., Mahmood, I. et al., SABRE and the Stawell Underground Physics Laboratory: Dark matter research at the Australian National University, EPJ Web Conf. 232 (2020) 01002.
- [13] H. Liskien and A. Paulsen, Neutron production cross sections and energies for the reactions 7Li(p,n)7Be and 7Li(p,n)7Be∗, Atomic Data and Nuclear Data Tables 15 (1975) 57 .
- [14] M. Friedman, D. Cohen, M. Paul, D. Berkovits, Y. Eisen, G. Feinberg et al., Simulation of the neutron spectrum from the 7Li(p,n) reaction with a liquid-lithium target at Soreq Applied Research Accelerator Facility, Nuclear Instruments and Methods in Physics Research Section A: Accelerators, Spectrometers, Detectors and Associated Equipment 698 (2013) 117 .
- [15] X. LLC., Pixie-16, 2020 (accessed Sept 15, 2020).
- [16] J. I. Collar, Light WIMP searches: The effect of the uncertainty in recoil energy scale and quenching factor, arXiv [astro-ph.IM] (2010) 1010.5187.
- [17] J. Adams and G. White, A versatile pulse shape discriminator for charged particle separation and its application to fast neutron time-of-flight spectroscopy, Nuclear Instruments and Methods 156 (1978) 459.
- [18] B. D. Rooney and J. D. Valentine, Scintillator light yield nonproportionality: calculating photon response using measured electron response, IEEE Transactions on Nuclear Science 44 (1997) 509.
- [19] I. V. Khodyuk, P. A. Rodnyi and P. Dorenbos, Nonproportional scintillation response of NaI:Tl to low energy x-ray photons and electrons, Journal of Applied Physics 107 (2010) 113513 [https://doi.org/10.1063/1.3431009].
- [20] S. Agostinelli, J. Allison, K. Amako, J. Apostolakis, H. Araujo, P. Arce et al., Geant4—a simulation toolkit, Nuclear Instruments and Methods in Physics Research Section A: Accelerators, Spectrometers, Detectors and Associated Equipment 506 (2003) 250 .
- [21] J. F. Ziegler, M. Ziegler and J. Biersack, SRIM – the stopping and range of ions in matter (2010), Nuclear Instruments and Methods in Physics Research Section B: Beam Interactions with Materials and Atoms 268 (2010) 1818 .