Self-Interacting Dark Matter and Small-Scale Gravitational Lenses in Galaxy Clusters
Abstract
Recently, Meneghetti et al. reported an excess of small-scale gravitational lenses in galaxy clusters. We study its implications for self-interacting dark matter (SIDM), compared with standard cold dark matter (CDM). We design controlled N-body simulations that incorporate observational constraints. The presence of early-type galaxies in cluster substructures can deepen gravitational potential and reduce tidal mass loss. Both scenarios require a relatively high baryon concentration in the substructure to accommodate the lensing measurements, and their tangential caustics are similar. The SIDM substructure can experience gravothermal collapse and produce a steeper density profile than its CDM counterpart, leading to a larger radial galaxy-galaxy strong lensing cross section, although this effect is hard to observe. Our results indicate SIDM can provide a unified explanation to small-scale lenses in galaxy clusters and stellar motions in dwarf galaxies.
Introduction. Strong gravitational lensing is characterized by the existence of giant arcs, rings, and multiple images caused by the deflection of lights by massive foreground galaxies, groups, or galaxy clusters Schneider et al. (1992); Kneib and Natarajan (2011). It provides a powerful tool for testing cosmological models Cao et al. (2012); Merten et al. (2015), determining the mass distribution of clusters Newman et al. (2013); Annunziatella et al. (2017); Bonamigo et al. (2018), probing substructures Mao and Schneider (1998); Dalal and Kochanek (2002); Keeton et al. (2003); Xu et al. (2009); Grillo et al. (2015); Natarajan et al. (2017); Nierenberg et al. (2017); Gilman et al. (2020a); Minor et al. (2020a) and dark matter properties Vegetti and Vogelsberger (2014); Minor et al. (2020b); Gilman et al. (2020b); Andrade et al. (2020); He et al. (2020); Nadler et al. (2021). Recently, Meneghetti et al. reported that observed substructures in galaxy clusters are more efficient lenses than those predicted in simulations of standard cold dark matter (CDM) Meneghetti et al. (2020), indicating that the former are more dense and compact. Other studies also show strong lensing clusters contain more substructures with high maximum circular velocities than predicted in CDM simulations Grillo et al. (2015); Munari et al. (2016). The tension could be resolved in CDM with a different implementation of baryonic feedback, resulting in dense substructures Bahé (2021); Robertson (2021).
We study self-interacting dark matter (SIDM) Spergel and Steinhardt (2000); Kaplinghat et al. (2016); Tulin and Yu (2018) in light of small-scale gravitational lenses observed in Meneghetti et al. (2020). In this scenario, dark matter collisions thermalize the inner halo over cosmological timescales Dave et al. (2001); Vogelsberger et al. (2012); Rocha et al. (2013); Zavala et al. (2013). Compared with CDM, SIDM better explains diverse dark matter distributions inferred in a wide range of galactic systems from ultra-diffuse galaxies to galaxy clusters Firmani et al. (2000); Kaplinghat et al. (2016); Kamada et al. (2017); Creasey et al. (2017); Salucci (2019); Ren et al. (2019); Kaplinghat et al. (2019, 2020); Yang et al. (2020); Sagunski et al. (2021). It may also explain the origin of supermassive black holes Balberg and Shapiro (2002); Pollack et al. (2015); Choquette et al. (2019); Feng et al. (2020). The observations of dense substructures in galaxy clusters Meneghetti et al. (2020) seem to challenge SIDM, as the thermalization could lead to shallow density cores, which are prone to tidal disruption. In contrast to this general expectation, we will show in this work that the SIDM substructure can be as efficient as its CDM counterpart in producing small-scale lenses, after taking into account realistic stellar distributions and tidal environments.
We design N-body SIDM and CDM simulations to model the MACS J1206.2-0847 (MACSJ1206) cluster, one of the examples studied in Meneghetti et al. (2020), and construct four benchmark cases, covering a representative range of halo concentration. The presence of early-type galaxies in the substructures could significantly accelerate the onset of SIDM gravothermal collapse Balberg et al. (2002); Koda and Shapiro (2011); Essig et al. (2019); Huo et al. (2020). For all benchmarks, our simulated SIDM subhalos experience collapse after of tidal evolution and become more dense than their CDM counterparts, assuming a self-scattering cross section per mass of , which is relatively conservative Tulin and Yu (2018). For both SIDM and CDM scenarios, the simulated substructures require a high baryon concentration to be consistent with the observations in Meneghetti et al. (2020).
We further model strong lensing observables and compute galaxy-galaxy strong lensing (GGSL) cross sections for the benchmarks. The tangential caustic predicted in the SIDM substructure is comparable to its CDM counterpart, while the former has a much larger radial GGSL cross section, with details depending on the source redshift and initial halo concentration. We will also show mock lensing images and discuss observational implications of a radial GGSL cross section.
Modeling the cluster system. We model the host cluster using a static spherical potential characterized by a Navarro-Frenk-White (NFW) density profile Navarro et al. (1997) and fix its corresponding scale density and radius as and , respectively. It well reproduces the projected total mass profile of MACSJ1206 Bergamini et al. (2019); Caminha et al. (2017); Bonamigo et al. (2018). We set the apocenter of our simulated substructures to be , with a tangential velocity of . During the tidal evolution, their distance to the host center oscillates in the range . The orbit controls the significance of tidal stripping, and hence the mass loss. In our setup, the mass of the simulated substructures at is . The strong lensing analysis in Meneghetti et al. (2020) focuses on substructures within of the virial radius of the host cluster, which is , and most of them have a mass in the range . Thus our simulated cluster system well represents those studied in Meneghetti et al. (2020).
For the subhalos, we use an NFW profile to model their initial dark matter distribution. We fix the initial virial halo mass to be , and choose four benchmark values for the concentration, i.e., , , and , corresponding to , , and higher than the cosmological median at Dutton and Macciò (2014), respectively. For each of the benchmarks, we convert their (, ) to (, ) to specify the initial NFW density profile in our simulations. Note for a given set of and , the interpretation of depends on the redshift. Consider , at which infall is expected to occur, the concentration of the benchmarks, from low to high, is , , , and away from the median () Dutton and Macciò (2014), which are representative.
We fix the initial stellar mass as , expected from the stellar-to-halo mass relation Moster et al. (2013), and model its distribution with a truncated singular isothermal profile as in Meneghetti et al. (2020), , where is the density normalization factor and is the cutoff radius. This is consistent with observations of early-type galaxies Bolton et al. (2006); Treu et al. (2006); Koopmans et al. (2006); Gavazzi et al. (2007). We take following the size-mass relation Carleton et al. (2019), and . We use live particles for the subhalo and stellar components and perform both SIDM and CDM simulations. For the former, we choose , approximately the lower limit that could explain observations on galactic scales Tulin and Yu (2018). For comparison, we also perform CDM simulations without including stars. As we will show that the stellar component is important in producing strong lensing observables.
We use the public GADGET-2 code Springel (2005); Springel et al. (2001), and extend it with a module modeling dark matter self-interactions Huo et al. (2020); Yang et al. (2020), which has been validated in both gravothermal expansion and collapse regimes with results from Ren et al. (2019); Essig et al. (2019); Pollack et al. (2015); Koda and Shapiro (2011). We use the code SpherIC Garrison-Kimmel et al. (2013) to generate initial conditions for the simulated substructures. The mass of the simulated particle is for both subhalo and stellar components, and the softening length is . The resolution is high enough to avoid numerical artifacts concerning disruption of substructures van den Bosch (2017); van den Bosch et al. (2018); van den Bosch and Ogiya (2018). We let the simulated substructures evolve for in the tidal field of MACSJ1206.
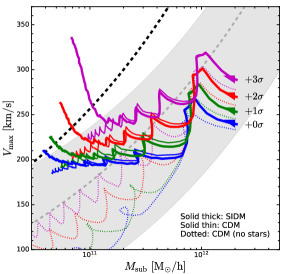
Gravothermal collapse. The left panel of Fig. 1 shows the evolution of the maximum circular velocity vs the total substructure mass for the benchmarks with (magenta) (red) (green) and (blue) from our SIDM (solid thick) and CDM (solid thin) simulations, where we include both subhalo and stellar components as in Meneghetti et al. (2020). The arrow on each curve denotes the direction of the evolution. The subhalos lose the majority of their mass after tidal evolution, while the stellar mass is only reduced by an factor. Our final total stellar and subhalo masses are consistent with those of cluster substructures from the Illustris simulations Niemiec et al. (2019); Vogelsberger et al. (2014). For comparison, our CDM simulations without including stars are shown (dotted).
The maximum circular velocities of the CDM substructures decrease continuously, aside from oscillatory features due to tidal interactions. For those with stars, the final values are close to the high end of the range predicted in cosmological hydrodynamical simulations Meneghetti et al. (2020) (gray band) and the average value from the strong lensing observations (black dashed). We also see that the values predicted in our CDM simulations without stars are still within the gray band. It implies that a large population of simulated substructures with AGN feedback in Meneghetti et al. (2020) has diffuse baryon distributions and high dark matter fractions. For our simulated substructures with stars, the baryon mass fraction is after of tidal evolution, which is reasonable compared to that of observed cluster galaxies Annunziatella et al. (2017).
The simulated SIDM substructures follow a similar trend for most of the evolution time, but their values spike toward the measured ones at late stages, as gravothermal collapse occurs and their central densities increase. At , all four SIDM benchmarks, even the one with a median concentration (), are denser than their CDM counterparts with stars. The collapse occurs earlier if is higher, leading to a higher density at , as its timescale is extremely sensitive to the concentration Essig et al. (2019). We find the presence of stellar particles deepens potential and accelerates gravothermal evolution, as in the isolated case Elbert et al. (2018); Sameie et al. (2018); Feng et al. (2020). Without stars, the collapse would not occur within unless is higher than the median, and a subhalo with median would be nearly destroyed Yang et al. (2020). In the cluster environment, tidal stripping could also speed up the onset of gravothermal collapse Nishikawa et al. (2020); Sameie et al. (2020); Kahlhoefer et al. (2019); Correa (2020); Turner et al. (2020).
Strong lensing observables. To further see implications for strong lensing observations, we compute GGSL cross sections for the simulated substructures. We adopt thin-lens approximation and project the mass distribution of the host cluster and substructure, assumed to be spherical, onto the lens plane, which is perpendicular to the line of sight. The distance between the substructure and the host center is fixed to be . We denote the angular positions as and on the lens and source planes, respectively. It is convenient to introduce effective lensing potential as Schneider et al. (1992); Kneib and Natarajan (2011):
where is the scaled projected density and is the critical density. and are lens and source angular diameter distances, respectively, and the distance between the two. We calculate these quantities in a flat universe with matter energy density and Ade et al. (2014). The lens equation is , where is the deflection angle.
For each simulated substructure, we model its total density profile with a numerical interpolation function and construct its surface density assuming spherical symmetry. We have checked that the substructure slightly deviates from spherical symmetry after tidal evolution, but the deviation is minor and it has negligible effects on the lensing observables. For a substructure plus its host cluster, we determine the lensing potential by solving the Poisson equation . We implement the fast Fourier transformation method on a grid, and use the software Mathematica 12 for numerical computation.
After obtaining , we calculate the shear matrix as and the pseudo-vector shear , where and are indices of the two spatial coordinates. The tangential and radial critical lines are contours of and , respectively. We obtain their corresponding caustic lines by mapping them onto the source plane using the lens equation, and compute tangential and radial GGSL cross sections defined as the area enclosed by the secondary caustic Meneghetti et al. (2013). We have further performed convergence tests and confirmed lensing results discussed below are robust.
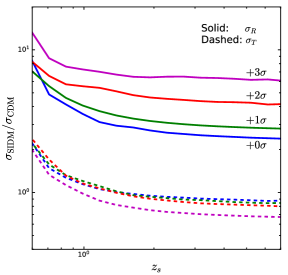
The right panel of Fig. 1 shows ratios of SIDM to CDM tangential (dashed) and radial (solid) GGSL cross sections as a function of the source redshift . The tangential cross sections are comparable for both cases and the differences are within order unity. Interestingly, the SIDM substructure has larger a radial cross section than its CDM counterpart, by a factor of for , and the difference increases with the concentration. But this effect is hard to observe as we will discuss later. For the CDM substructures without stars, their surface density is low and the lensing effect is negligible.
We see the SIDM substructure can be as compact and dense as its CDM counterpart in reproducing small-scale lenses of galaxy clusters. In contrast to the general expectation, the lensing excess reported in Meneghetti et al. (2020) does not rule out SIDM. Instead, it could be an indicator of gravothermal catastrophe induced by dark matter self-interactions. We also find a compact stellar density profile is necessary in reproducing observed strong lenses in both SIDM and CDM; see also Meneghetti et al. (2020); Bahé (2021); Robertson (2021) for related discussions.
Although our simulations are based on a particular choice of the cross section, i.e., , the lower limit to be relevant for dwarf galaxies, the benchmarks capture all the essential features predicted in SIDM. For example, a larger cross section in the subhalo would further shorten the collapse timescale, resulting in an even high central density. Since there is a strong constraint of for cluster halos with masses Kaplinghat et al. (2016); Sagunski et al. (2021); Andrade et al. (2020), we consider a velocity-dependent SIDM scenario, which can be naturally realized in many particle physics models, see Tulin and Yu (2018).
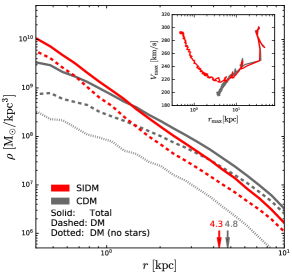
Density profiles. We take the benchmark with () and perform a detailed case study. In Fig. 2, we show its dark matter (dashed) and total (solid) density profiles with (red) and without (gray) dark matter self-interactions. After of evolution, the collapse leads to an overdense region within , and a less dense region , compared to the CDM subhalo. For the CDM substructure without including stars (dotted), the density is significantly lower. The inset displays the evolution of and for SIDM and CDM substructures with stars, their values decrease overall due to tidal mass loss. The SIDM one becomes further smaller at late stages, as the collapse occurs and the central density increases; see also Turner et al. (2020).
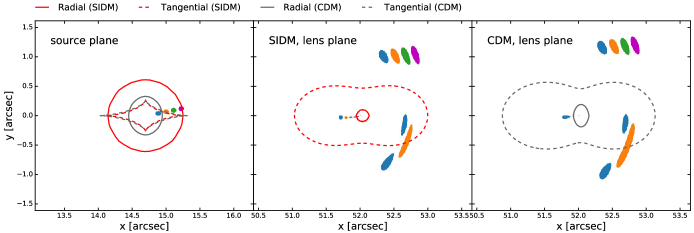
The left panel of Fig. 3 shows the corresponding secondary tangential (dashed) and radial (solid) caustics, assuming a source at for the SIDM (red) and CDM (gray) benchmarks (). For SIDM, the enclosed area of the radial caustic is much larger than the tangential one. For CDM, they are comparable, but both are smaller than the area of the SIDM radial caustic. For a collapsed SIDM substructure, the total density profile is steeper than the isothermal profile , and hence its associated radial caustic is larger than the tangential one.
Mock lensed images. The left panel of Fig. 3 displays four mock sources at four representative locations; the middle (SIDM) and right (CDM) panels show their corresponding lensed images, together with the critical lines mapped from the caustics using the lens equation. The innermost blue source is inside radial and tangential caustics predicted in SIDM and CDM, and it has four images in both cases Blandford and Narayan (1986); Schneider et al. (2006). The source in orange sits on the second fold caustic in SIDM while it only crosses the tangential caustic in CDM, thus it has one more image in the former case. Similarly, the sources in green and magenta have one more image in SIDM than in CDM. Our example explicitly illustrates that the collapsed SIDM substructure has a higher capability of producing multiple images. Observationally, the predicted images in the central region are difficult to detect because they are highly demagnified and obscured by bright objects. Thus it remains challenging to differentiate a collapsed SIDM substructure from its CDM counterpart with lensing observations.
We compute the Einstein radii as and for the SIDM and CDM benchmarks with stars, respectively, denoted in Fig. 2 with arrows, where is defined as the radius of the circle with the same area as that enclosed by the critical line Meneghetti et al. (2013). It’s not surprising that they are comparable. In our setup, the stellar component dominates the inner region and both cases have similar stellar distributions after tidal evolution. In addition, during the collapse process, the SIDM central density increases, but the total mass does not change. As indicated in Fig. 2, for CDM, while for SIDM. Thus the mass distribution induced by gravothermal collapse does not produce an appreciable change in the enclosed mass within .
Discussion and Conclusions. Our simulations assume a compact stellar distribution motivated by observations of early-type galaxies. Hydrodynamical simulations show that for field SIDM halos with masses stars could dominate the inner region Robertson et al. (2018); Di Cintio et al. (2017); Despali et al. (2019); Robertson et al. (2020); Sameie et al. (2021). Thus our assumption is well justified. In addition, the SIDM halo structure is more resilient to feedback than its CDM counterpart, because of rapid energy redistributions induced by the self-interactions; see Robles et al. (2017); Fitts et al. (2019). We expect our overall predictions are robust, and it would be interesting to further test them with cosmological simulations. In summary, we have shown that a collapsed SIDM substructure could have a steep density profile, to be consistent with small-scale gravitational lenses observed in galaxy clusters. The features of strong lensing observables predicted in the SIDM scenario could be further tested using existing data Talbot et al. (2020), and upcoming observations Drlica-Wagner et al. (2019).
Acknowledgments
We thank Haipeng An, Seong Chan Park, and Massimo Meneghetti for useful discussions. DY was supported by NSFC under Grant No. 11975134 and the National Key Research and Development Program of China under Grant No.2017YFA0402204. HBY was supported by the U.S. Department of Energy under Grant No. de-sc0008541 and the John Templeton Foundation under Grant ID# 61884. The opinions expressed in this publication are those of the authors and do not necessarily reflect the views of the John Templeton Foundation.
References
- Schneider et al. (1992) P. Schneider, J. Ehlers, and E. E. Falco, Gravitational Lenses (Springer-Verlag Berlin Heidelberg New York, 1992).
- Kneib and Natarajan (2011) J.-P. Kneib and P. Natarajan, Astron. Astrophys. Rev. 19, 47 (2011), eprint 1202.0185.
- Cao et al. (2012) S. Cao, Y. Pan, M. Biesiada, W. Godlowski, and Z.-H. Zhu, JCAP 03, 016 (2012), eprint 1105.6226.
- Merten et al. (2015) J. Merten et al., Astrophys. J. 806, 4 (2015), eprint 1404.1376.
- Newman et al. (2013) A. B. Newman, T. Treu, R. S. Ellis, D. J. Sand, C. Nipoti, J. Richard, and E. Jullo, Astrophys. J. 765, 24 (2013), eprint 1209.1391.
- Annunziatella et al. (2017) M. Annunziatella et al., Astrophys. J. 851, 81 (2017), eprint 1711.02109.
- Bonamigo et al. (2018) M. Bonamigo, C. Grillo, S. Ettori, G. B. Caminha, P. Rosati, A. Mercurio, E. Munari, M. Annunziatella, I. Balestra, and M. Lombardi, Astrophys. J. 864, 98 (2018), eprint 1807.10286.
- Mao and Schneider (1998) S.-d. Mao and P. Schneider, Mon. Not. Roy. Astron. Soc. 295, 587 (1998), eprint astro-ph/9707187.
- Dalal and Kochanek (2002) N. Dalal and C. S. Kochanek, Astrophys. J. 572, 25 (2002), eprint astro-ph/0111456.
- Keeton et al. (2003) C. R. Keeton, B. Gaudi, and A. Petters, Astrophys. J. 598, 138 (2003), eprint astro-ph/0210318.
- Xu et al. (2009) D. Xu, S. Mao, J. Wang, V. Springel, L. Gao, S. White, C. Frenk, A. Jenkins, G. Li, and J. Navarro, Mon. Not. Roy. Astron. Soc. 398, 1235 (2009), eprint 0903.4559.
- Grillo et al. (2015) C. Grillo et al., Astrophys. J. 800, 38 (2015), eprint 1407.7866.
- Natarajan et al. (2017) P. Natarajan et al., Mon. Not. Roy. Astron. Soc. 468, 1962 (2017), eprint 1702.04348.
- Nierenberg et al. (2017) A. M. Nierenberg, T. Treu, G. Brammer, A. H. G. Peter, C. D. Fassnacht, C. R. Keeton, C. S. Kochanek, K. B. Schmidt, D. Sluse, and S. A. Wright, Mon. Not. Roy. Astron. Soc. 471, 2224 (2017), eprint 1701.05188.
- Gilman et al. (2020a) D. Gilman, X. Du, A. Benson, S. Birrer, A. Nierenberg, and T. Treu, Mon. Not. Roy. Astron. Soc. 492, L12 (2020a), eprint 1909.02573.
- Minor et al. (2020a) Q. E. Minor, M. Kaplinghat, T. H. Chan, and E. Simon (2020a), eprint 2011.10629.
- Vegetti and Vogelsberger (2014) S. Vegetti and M. Vogelsberger, Mon. Not. Roy. Astron. Soc. 442, 3598 (2014), eprint 1406.1170.
- Minor et al. (2020b) Q. E. Minor, S. Gad-Nasr, M. Kaplinghat, and S. Vegetti (2020b), eprint 2011.10627.
- Gilman et al. (2020b) D. Gilman, S. Birrer, A. Nierenberg, T. Treu, X. Du, and A. Benson, Mon. Not. Roy. Astron. Soc. 491, 6077 (2020b), eprint 1908.06983.
- Andrade et al. (2020) K. E. Andrade, J. Fuson, S. Gad-Nasr, D. Kong, Q. Minor, M. G. Roberts, and M. Kaplinghat (2020), eprint 2012.06611.
- He et al. (2020) Q. He, A. Robertson, J. Nightingale, S. Cole, C. S. Frenk, R. Massey, A. Amvrosiadis, R. Li, X. Cao, and A. Etherington (2020), eprint 2010.13221.
- Nadler et al. (2021) E. O. Nadler, S. Birrer, D. Gilman, R. H. Wechsler, X. Du, A. Benson, A. M. Nierenberg, and T. Treu (2021), eprint 2101.07810.
- Meneghetti et al. (2020) M. Meneghetti et al., Science 369, 1347 (2020), eprint 2009.04471.
- Munari et al. (2016) E. Munari, C. Grillo, G. De Lucia, A. Biviano, M. Annunziatella, S. Borgani, M. Lombardi, A. Mercurio, and P. Rosati, Astrophys. J. Lett. 827, L5 (2016), eprint 1607.01023.
- Bahé (2021) Y. M. Bahé, Mon. Not. Roy. Astron. Soc. (2021), eprint 2101.12112.
- Robertson (2021) A. Robertson, Mon. Not. Roy. Astron. Soc. 504, L7 (2021), eprint 2101.12067.
- Spergel and Steinhardt (2000) D. N. Spergel and P. J. Steinhardt, Phys. Rev. Lett. 84, 3760 (2000), eprint astro-ph/9909386.
- Kaplinghat et al. (2016) M. Kaplinghat, S. Tulin, and H.-B. Yu, Phys. Rev. Lett. 116, 041302 (2016), eprint 1508.03339.
- Tulin and Yu (2018) S. Tulin and H.-B. Yu, Phys. Rept. 730, 1 (2018), eprint 1705.02358.
- Dave et al. (2001) R. Dave, D. N. Spergel, P. J. Steinhardt, and B. D. Wandelt, Astrophys. J. 547, 574 (2001), eprint astro-ph/0006218.
- Vogelsberger et al. (2012) M. Vogelsberger, J. Zavala, and A. Loeb, Mon. Not. Roy. Astron. Soc. 423, 3740 (2012), eprint 1201.5892.
- Rocha et al. (2013) M. Rocha, A. H. G. Peter, J. S. Bullock, M. Kaplinghat, S. Garrison-Kimmel, J. Onorbe, and L. A. Moustakas, Mon. Not. Roy. Astron. Soc. 430, 81 (2013), eprint 1208.3025.
- Zavala et al. (2013) J. Zavala, M. Vogelsberger, and M. G. Walker, Mon. Not. Roy. Astron. Soc. 431, L20 (2013), eprint 1211.6426.
- Firmani et al. (2000) C. Firmani, E. D’Onghia, V. Avila-Reese, G. Chincarini, and X. Hernandez, Mon. Not. Roy. Astron. Soc. 315, L29 (2000), eprint astro-ph/0002376.
- Kamada et al. (2017) A. Kamada, M. Kaplinghat, A. B. Pace, and H.-B. Yu, Phys. Rev. Lett. 119, 111102 (2017), eprint 1611.02716.
- Creasey et al. (2017) P. Creasey, O. Sameie, L. V. Sales, H.-B. Yu, M. Vogelsberger, and J. Zavala, Mon. Not. Roy. Astron. Soc. 468, 2283 (2017), eprint 1612.03903.
- Salucci (2019) P. Salucci, Astron. Astrophys. Rev. 27, 2 (2019), eprint 1811.08843.
- Ren et al. (2019) T. Ren, A. Kwa, M. Kaplinghat, and H.-B. Yu, Phys. Rev. X 9, 031020 (2019), eprint 1808.05695.
- Kaplinghat et al. (2019) M. Kaplinghat, M. Valli, and H.-B. Yu, Mon. Not. Roy. Astron. Soc. 490, 231 (2019), eprint 1904.04939.
- Kaplinghat et al. (2020) M. Kaplinghat, T. Ren, and H.-B. Yu, JCAP 06, 027 (2020), eprint 1911.00544.
- Yang et al. (2020) D. Yang, H.-B. Yu, and H. An, Phys. Rev. Lett. 125, 111105 (2020), eprint 2002.02102.
- Sagunski et al. (2021) L. Sagunski, S. Gad-Nasr, B. Colquhoun, A. Robertson, and S. Tulin, JCAP 01, 024 (2021), eprint 2006.12515.
- Balberg and Shapiro (2002) S. Balberg and S. L. Shapiro, Phys. Rev. Lett. 88, 101301 (2002), eprint astro-ph/0111176.
- Pollack et al. (2015) J. Pollack, D. N. Spergel, and P. J. Steinhardt, Astrophys. J. 804, 131 (2015), eprint 1501.00017.
- Choquette et al. (2019) J. Choquette, J. M. Cline, and J. M. Cornell, JCAP 07, 036 (2019), eprint 1812.05088.
- Feng et al. (2020) W.-X. Feng, H.-B. Yu, and Y.-M. Zhong (2020), eprint 2010.15132.
- Balberg et al. (2002) S. Balberg, S. L. Shapiro, and S. Inagaki, Astrophys. J. 568, 475 (2002), eprint astro-ph/0110561.
- Koda and Shapiro (2011) J. Koda and P. R. Shapiro, Mon. Not. Roy. Astron. Soc. 415, 1125 (2011), eprint 1101.3097.
- Essig et al. (2019) R. Essig, S. D. Mcdermott, H.-B. Yu, and Y.-M. Zhong, Phys. Rev. Lett. 123, 121102 (2019), eprint 1809.01144.
- Huo et al. (2020) R. Huo, H.-B. Yu, and Y.-M. Zhong, JCAP 06, 051 (2020), eprint 1912.06757.
- Navarro et al. (1997) J. F. Navarro, C. S. Frenk, and S. D. M. White, Astrophys. J. 490, 493 (1997), eprint astro-ph/9611107.
- Bergamini et al. (2019) P. Bergamini, P. Rosati, A. Mercurio, C. Grillo, G. B. Caminha, M. Meneghetti, A. Agnello, A. Biviano, F. Calura, C. Giocoli, et al., Astronomy and Astrophysics 631, A130 (2019), eprint 1905.13236.
- Caminha et al. (2017) G. B. Caminha, C. Grillo, P. Rosati, M. Meneghetti, A. Mercurio, S. Ettori, I. Balestra, A. Biviano, K. Umetsu, E. Vanzella, et al., Astronomy and Astrophysics 607, A93 (2017), eprint 1707.00690.
- Bonamigo et al. (2018) M. Bonamigo, C. Grillo, S. Ettori, G. B. Caminha, P. Rosati, A. Mercurio, E. Munari, M. Annunziatella, I. Balestra, and M. Lombardi, Astrophysical Journal 864, 98 (2018), eprint 1807.10286.
- Dutton and Macciò (2014) A. A. Dutton and A. V. Macciò, Mon. Not. Roy. Astron. Soc. 441, 3359 (2014), eprint 1402.7073.
- Moster et al. (2013) B. P. Moster, T. Naab, and S. D. M. White, Mon. Not. Roy. Astron. Soc. 428, 3121 (2013), eprint 1205.5807.
- Bolton et al. (2006) A. S. Bolton, S. Burles, L. V. Koopmans, T. Treu, and L. A. Moustakas, Astrophys. J. 638, 703 (2006), eprint astro-ph/0511453.
- Treu et al. (2006) T. Treu, L. Koopmans, A. Bolton, S. Burles, and L. Moustakas, Astrophys. J. 640, 662 (2006), eprint astro-ph/0512044.
- Koopmans et al. (2006) L. V. Koopmans, T. Treu, A. S. Bolton, S. Burles, and L. A. Moustakas, Astrophys. J. 649, 599 (2006), eprint astro-ph/0601628.
- Gavazzi et al. (2007) R. Gavazzi, T. Treu, J. D. Rhodes, L. V. Koopmans, A. S. Bolton, S. Burles, R. Massey, and L. A. Moustakas, Astrophys. J. 667, 176 (2007), eprint astro-ph/0701589.
- Carleton et al. (2019) T. Carleton, R. Errani, M. Cooper, M. Kaplinghat, J. Peñarrubia, and Y. Guo, Mon. Not. Roy. Astron. Soc. 485, 382 (2019), eprint 1805.06896.
- Springel (2005) V. Springel, Mon. Not. Roy. Astron. Soc. 364, 1105 (2005), eprint astro-ph/0505010.
- Springel et al. (2001) V. Springel, N. Yoshida, and S. D. M. White, New Astron. 6, 79 (2001), eprint astro-ph/0003162.
- Garrison-Kimmel et al. (2013) S. Garrison-Kimmel, M. Rocha, M. Boylan-Kolchin, J. Bullock, and J. Lally, Mon. Not. Roy. Astron. Soc. 433, 3539 (2013), eprint 1301.3137.
- van den Bosch (2017) F. C. van den Bosch, Mon. Not. Roy. Astron. Soc. 468, 885 (2017), eprint 1611.02657.
- van den Bosch et al. (2018) F. C. van den Bosch, G. Ogiya, O. Hahn, and A. Burkert, Mon. Not. Roy. Astron. Soc. 474, 3043 (2018), eprint 1711.05276.
- van den Bosch and Ogiya (2018) F. C. van den Bosch and G. Ogiya, Mon. Not. Roy. Astron. Soc. 475, 4066 (2018), eprint 1801.05427.
- Niemiec et al. (2019) A. Niemiec, E. Jullo, C. Giocoli, M. Limousin, and M. Jauzac, Mon. Not. Roy. Astron. Soc. 487, 653 (2019), eprint 1811.04996.
- Vogelsberger et al. (2014) M. Vogelsberger, S. Genel, V. Springel, P. Torrey, D. Sijacki, D. Xu, G. F. Snyder, D. Nelson, and L. Hernquist, Mon. Not. Roy. Astron. Soc. 444, 1518 (2014), eprint 1405.2921.
- Elbert et al. (2018) O. D. Elbert, J. S. Bullock, M. Kaplinghat, S. Garrison-Kimmel, A. S. Graus, and M. Rocha, Astrophys. J. 853, 109 (2018), eprint 1609.08626.
- Sameie et al. (2018) O. Sameie, P. Creasey, H.-B. Yu, L. V. Sales, M. Vogelsberger, and J. Zavala, Mon. Not. Roy. Astron. Soc. 479, 359 (2018), eprint 1801.09682.
- Nishikawa et al. (2020) H. Nishikawa, K. K. Boddy, and M. Kaplinghat, Phys. Rev. D 101, 063009 (2020), eprint 1901.00499.
- Sameie et al. (2020) O. Sameie, H.-B. Yu, L. V. Sales, M. Vogelsberger, and J. Zavala, Phys. Rev. Lett. 124, 141102 (2020), eprint 1904.07872.
- Kahlhoefer et al. (2019) F. Kahlhoefer, M. Kaplinghat, T. R. Slatyer, and C.-L. Wu, JCAP 12, 010 (2019), eprint 1904.10539.
- Correa (2020) C. A. Correa (2020), eprint 2007.02958.
- Turner et al. (2020) H. C. Turner, M. R. Lovell, J. Zavala, and M. Vogelsberger (2020), eprint 2010.02924.
- Ade et al. (2014) P. A. R. Ade et al. (Planck), Astron. Astrophys. 571, A16 (2014), eprint 1303.5076.
- Meneghetti et al. (2013) M. Meneghetti, M. Bartelmann, H. Dahle, and M. Limousin, Space Sci. Rev. 177, 31 (2013), eprint 1303.3363.
- Blandford and Narayan (1986) R. Blandford and R. Narayan, Astrophysical Journal 310, 568 (1986).
- Schneider et al. (2006) P. Schneider, C. Kochanek, and J. Wambsganss, Gravitational lensing: strong, weak and micro: Saas-Fee advanced course 33, vol. 33 (Springer Science & Business Media, 2006).
- Robertson et al. (2018) A. Robertson et al., Mon. Not. Roy. Astron. Soc. 476, L20 (2018), eprint 1711.09096.
- Di Cintio et al. (2017) A. Di Cintio, M. Tremmel, F. Governato, A. Pontzen, J. Zavala, A. Bastidas Fry, A. Brooks, and M. Vogelsberger, Mon. Not. Roy. Astron. Soc. 469, 2845 (2017), eprint 1701.04410.
- Despali et al. (2019) G. Despali, M. Sparre, S. Vegetti, M. Vogelsberger, J. Zavala, and F. Marinacci, Mon. Not. Roy. Astron. Soc. 484, 4563 (2019), eprint 1811.02569.
- Robertson et al. (2020) A. Robertson, R. Massey, V. Eke, J. Schaye, and T. Theuns (2020), eprint 2009.07844.
- Sameie et al. (2021) O. Sameie, M. Boylan-Kolchin, R. Sanderson, D. Vargya, P. Hopkins, A. Wetzel, J. Bullock, and A. Graus (2021), eprint 2102.12480.
- Robles et al. (2017) V. H. Robles, , et al., Mon. Not. Roy. Astron. Soc. 472, 2945 (2017), eprint 1706.07514.
- Fitts et al. (2019) A. Fitts et al., Mon. Not. Roy. Astron. Soc. 490, 962 (2019), eprint 1811.11791.
- Talbot et al. (2020) M. S. Talbot, J. R. Brownstein, K. S. Dawson, J.-P. Kneib, and J. Bautista (2020), eprint 2007.09006.
- Drlica-Wagner et al. (2019) A. Drlica-Wagner et al. (LSST Dark Matter Group) (2019), eprint 1902.01055.