Sensitivity to New Physics of Isotope Shift Studies using the Coronal Lines of Highly Charged Calcium Ions
Abstract
Promising searches for new physics beyond the current Standard Model (SM) of particle physics are feasible through isotope-shift spectroscopy, which is sensitive to a hypothetical fifth force between the neutrons of the nucleus and the electrons of the shell. Such an interaction would be mediated by a new particle which could in principle be associated with dark matter. In so-called King plots, the mass-scaled frequency shifts of two optical transitions are plotted against each other for a series of isotopes. Subtle deviations from the expected linearity could reveal such a fifth force. Here, we study experimentally and theoretically six transitions in highly charged ions of Ca, an element with five stable isotopes of zero nuclear spin. Some of the transitions are suitable for upcoming high-precision coherent laser spectroscopy and optical clocks. Our results provide a sufficient number of clock transitions for – in combination with those of singly charged Ca+ – application of the generalized King plot method. This will allow future high-precision measurements to remove higher-order SM-related nonlinearities and open a new door to yet more sensitive searches for unknown forces and particles.
Since its inception, the Standard Model (SM) of particle physics has been the cornerstone of our understanding of nature, but since it leaves open fundamental questions about dark matter, dark energy, mass hierarchy, and others, it is considered still incomplete, and therefore new physics (NP) is sought after.
By exploiting the unrivalled accuracy of laser spectroscopy, atomic physics offers unique sensitivity for searches for physics beyond the SM (for a review see Safronova et al. (2018)). Feeble non-gravitational interactions between normal matter and, e. g., dark matter, would result in changes of atomic and molecular energy levels. Depending on the dark matter candidate and the properties of the field representing it, oscillations Arvanitaki et al. (2015); Stadnik and Flambaum (2015a), drifts Stadnik and Flambaum (2015b) or transient changes Derevianko and Pospelov (2014) in energy levels can occur. Optical atomic clocks Ludlow et al. (2015) with up to 18 digits of accuracy have already been employed to put bounds on the mass of dark matter candidates Kennedy et al. (2020); Wcisło et al. (2016, 2018); Roberts et al. (2020).
Recently, a complementary approach Delaunay et al. (2017); Berengut et al. (2018) proposes probing the existence of a hypothetical fifth force coupling electrons and neutrons by means of isotope-shift (IS) spectroscopy Solaro et al. (2020); Counts et al. (2020). Isotopic perturbations of optical transitions are dominated by two effects: (i) the nuclear recoil (mass shift, MS), and (ii) the modification of the electron-nucleus interaction potential by the nuclear charge distribution (field shift, FS). The dependence on the mostly poorly known nuclear charge distribution is eliminated by measuring Knollmann et al. (2019); Manovitz et al. (2019); Miyake et al. (2019); Gebert et al. (2015a); Shi et al. (2017); Müller et al. (2020) two different transitions and using a so-called King-plot King (1963). This yields a linear relationship in first order between the two transition frequencies. A fifth force coupling electrons and neutrons would break this linearity Delaunay et al. (2017); Frugiuele et al. (2017); Flambaum et al. (2018); Fichet (2018); Berengut et al. (2018). Caution is, however, needed, since nonlinearity can also arise from higher-order SM effects Flambaum et al. (2018); Berengut et al. (2018), which then cloud the NP effects. To separate them, high precision atomic and nuclear structure calculations for the former are required Yerokhin et al. (2020); Reinhard et al. (2020); Tanaka and Yamamoto (2020); Mikami et al. (2017); Flambaum et al. (2018), which are feasible for few-electron systems such as highly charged ions (HCI). Alternatively, a generalized King plot (GKP) proposed by Mikami et al. (2017) and further developed by Berengut et al. (2020) employs measurements of additional electronic transitions for eliminating the impact of higher-order SM effects on such NP searches.
| Observed | fac | ratip/grasp | Elec. coeff. | |||||||||
|---|---|---|---|---|---|---|---|---|---|---|---|---|
| Ion | Transition | Energy (eV) | Wavel. (nm) | En. (eV) | (s-1) | En. (eV) | (s-1) | K (eV u) | F (eV/fm2) | |||
| Ca11+ | - | 3.7262192(28) | 332.73458(25) | 3.716(3) | 483(1) | 3.718(1) | 483.9(1) | - | - | |||
| Ca12+ | - | 3.0332843(19) | 408.74572(26) | 3.022(4) | 316(1) | 3.012(2) | 312(1) | - | - | |||
| Ca14+ | - | 2.2757757(7) | 544.79971(16) | 2.31(2) | 83(2) | 2.32(2) | 83(2) | - | - | |||
| Ca14+ | - | 2.1766536(10) | 569.60923(26) | 2.15(5) | 91(6) | 2.06(3) | 81(3) | - | - | |||
| Ca15+ | - | 4.5397089(27) | 273.11046(16) | 4.60(6) | 459(17) | 4.5352(2) | 439.0(1) | - | - | |||
| Ca16+ | - | 3.3995766(74) | 364.70482(79) | 3.3839(8) | 272.2(2) | 3.392(3) | 274(1) | - | - | |||
| Ca+ | - | - | 1.699932 Kramida et al. (2020) | 729.348 Kramida et al. (2020) | 1.88(6) | 1.7(2) | 2.0228(4) | - | - | - | ||
Recently, optical-clock-like spectroscopy of HCI was demonstrated by means of sympathetic laser cooling and quantum logic operations in a linear Paul trap Micke et al. (2020). Relative fractional uncertainties as low as can be achieved through absolute frequency measurements, limited by the SI-second. For optical transition frequencies of the order of () this corresponds to an absolute uncertainty of the order of (), which is roughly a thousand times smaller than the natural linewidths of magnetic-dipole transitions in HCI. Nevertheless, this level of subdivision is possible using techniques employed by atomic clocks. With such precision, it would be possible to constrain the NP Berengut et al. (2020) beyond the limits set in neutron Barbieri and Ericson (1975); Leeb and Schmiedmayer (1992); Nesvizhevsky et al. (2008); Pokotilovski (2006) and electron scattering Adler et al. (1974), and fifth-force studies Bordag et al. (2001, 2009).
In this Letter, we experimentally determine accurate wavelengths for six magnetic dipole (M1) forbidden lines of Ca ions in the charge stages through , and identify which ones transition directly to the electronic ground state and thus are suitable for coherent laser spectroscopy Schmidt et al. (2005) IS measurements. We perform calculations of their IS and use them to construct King plots (KP) as well as generalized King plots (GKP) to suppress higher-order SM terms, to see their effects and find the most suitable combination of transitions for the search of NP influences.
Calcium ions are particularly suitable for King-plot studies since this element has five stable isotopes with zero nuclear spin. Additionally, Ca has narrow transitions in various charge states which can be accurately measured by high-precision laser spectroscopy using common optical frequency metrology methods. In the past, the isotope shifts of broad dipole allowed Nörtershäuser et al. (1998); Mortensen et al. (2004); Gorges et al. (2015); Hashimoto et al. (2011); Shi et al. (2016); Gebert et al. (2015b) as well as narrow transitions Benhelm et al. (2007); Knollmann et al. (2019); Solaro et al. (2020) in singly charged Ca have been investigated. In HCI, the strongly bound outer electrons can undergo fine-structure Morgan et al. (1995); Draganić et al. (2003); Orts et al. (2006); Crespo López-Urrutia (2008); Crespo López-Urrutia and Harman (2014); Murata et al. (2017); Windberger et al. (2016); Bekker et al. (2018) and hyperfine-structure Klaft et al. (1994); Crespo López-Urrutia et al. (1996); Seelig et al. (1998); Crespo López-Urrutia et al. (1998); Beiersdorfer et al. (2001) transitions in the optical range. Some of them contribute to the corona spectrum and are therefore known as coronal lines. Optical transitions in HCI can also arise from level crossings Berengut et al. (2010, 2012); Windberger et al. (2015); Bekker et al. (2019). These involve orbitals of very different character, and thus promise a high sensitivity to NP (see, e.g. Ong et al. (2014); Berengut et al. (2011a); Derevianko et al. (2012); Dzuba and Flambaum (2015); Safronova et al. (2014); Porsev et al. (2020); Cheung et al. (2020); Kimura et al. (2019)), making them strong candidates for such studies Kozlov et al. (2018).
To produce Ca HCI, we used the Heidelberg electron beam ion trap (EBIT) Levine et al. (1988, 1989); Crespo López-Urrutia et al. (1999). There, an electron beam emitted by a thermionic cathode is accelerated to energies between and and strongly compressed by a coaxial 8 T magnetic field. Depending on its energy, electron impact ionization brings atoms crossing the beam to the desired charge state. Resulting HCI are radially trapped by the negative space charge potential generated by the electron beam and axially by biased drift tubes. A small oven is used to evaporate a substance containing Ca. The resulting molecular beam crosses the electron beam and is dissociated there, thus releasing millions of Ca atoms for ionization. Collisions with the electron beam heat up these HCI in the deep trapping potential of the EBIT to temperatures around to K. These values depend on the charge as well as current density of the beam, and on the axial trapping potential. Less current or a shallow trap lead to lower temperature and smaller Doppler width, however at the cost of a weaker signal. The trap is periodically dumped every few seconds in order to avoid a slow accumulation of undesired ions of barium and tungsten, elements which are constituents of the thermoionic cathode and slowly evaporate from there.
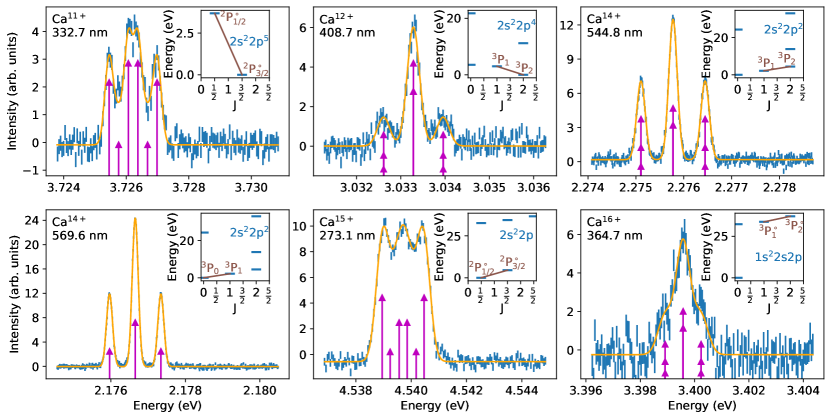
In the trap, the forbidden optical transitions of interest are excited by electron impact. Using four lenses and several mirrors, we project a rotated image of the horizontal ion cloud onto the vertical entrance slit of a 2-meter Czerny-Turner spectrometer Bekker et al. (2018, 2019) equipped with a cryogenically cooled CCD camera. We calibrate the spectral dispersion function through a polynomial fit of the line positions of known transitions Kramida et al. (2020), emitted by suitable hollow cathode lamps. Spectra of such lamps are automatically taken before and after each of the approximately 30-minute-long exposures needed for the HCI lines. The two-dimensional spectral images are cleaned from cosmic events, corrected from optical aberrations and calibrated, as explained in detail in Refs. Windberger et al. (2015); Bekker et al. (2018, 2019). Transition wavelengths are determined by fitting Gaussians to the resolved Zeeman components, taking calculated Clebsch-Gordan coefficients as initial parameters for the -factors. Results are shown in figure 1 with the respective level diagrams of the transitions, and summarized in Table 1. We estimate the uncertainty as the square root of the quadratic summation of the uncertainties of both the Zeeman line fit (for the Ca16+ transition the largest contribution) and the dispersion-function calibration, which dominates for the two Ca14+ transitions. The four transitions of the Ca11+, Ca12+ and Ca14+ were observed in the solar corona with roughly hundredfold larger uncertainties Jefferies et al. (1971).
For the observed transitions in the charge states from to , as well as the transition, we calculated theoretical transition energies and their dependence on hypothetical NP with the Flexible Atomic Code (fac) version 1.1.5 Gu (2008) and crosscheck with ratip/grasp Fritzsche (2012). For this, a fictitious mediator is modeled by a Yukawa central potential and introduced as a perturbation to the electromagnetic field acting upon the electrons:
| (1) |
Here, is the reduced Planck constant and the speed of light. The coupling strength is defined as , where and are the couplings of to electrons and neutrons, respectively. is the mass number and is the nuclear charge. For the present estimates, we set a value of , which is below the limits of current exclusion plots, such as shown in Ref. Berengut et al. (2020). The Yukawa range is set by the mediator mass : a lighter particle has a longer-range effect than a heavier one.
| 103 | 104 | 105 | 106 | |||||
|---|---|---|---|---|---|---|---|---|
| Trans. | fac | grasp | fac | grasp | fac | grasp | fac | grasp |
| Ca11+ | 9.85 | 9.81 | 8.82 | 8.80 | 1.54 | 1.67 | 0.0163 | 0.0252 |
| Ca12+ | 8.36 | 8.33 | 7.51 | 7.51 | 1.33 | 1.45 | 0.0139 | 0.0221 |
| Ca | 4.89 | 4.88 | 4.45 | 4.40 | 0.96 | 0.80 | 0.0203 | 0.0087 |
| Ca | 6.71 | 6.06 | 6.07 | 5.51 | 1.07 | 1.07 | 0.0065 | 0.0126 |
| Ca15+ | 11.4 | 11.2 | 10.4 | 10.2 | 2.47 | 2.44 | 0.0605 | 0.0573 |
| Ca16+ | 8.69 | 8.56 | 7.90 | 7.78 | 1.52 | 1.51 | 0.0177 | 0.0177 |
| Ca+ | -31.9 | -35.3 | 9.37 | 14.8 | 2.51 | 4.52 | 0.119 | 0.223 |
In first-order perturbation theory, the IS is defined for transition as the sum of the SM mass and field shift, as well as the shift induced by the NP mediator:
| (2) |
where is the isotope pair , thus is the difference of transition between isotope and reference isotope ; , and are electronic constants of the shift terms, is the difference of the inverse isotope masses and is the difference of the mean square nuclear charge radii. The NP part depends on the isotopes with and (see equation 1) defining the coupling strength with regards to the coupling range.
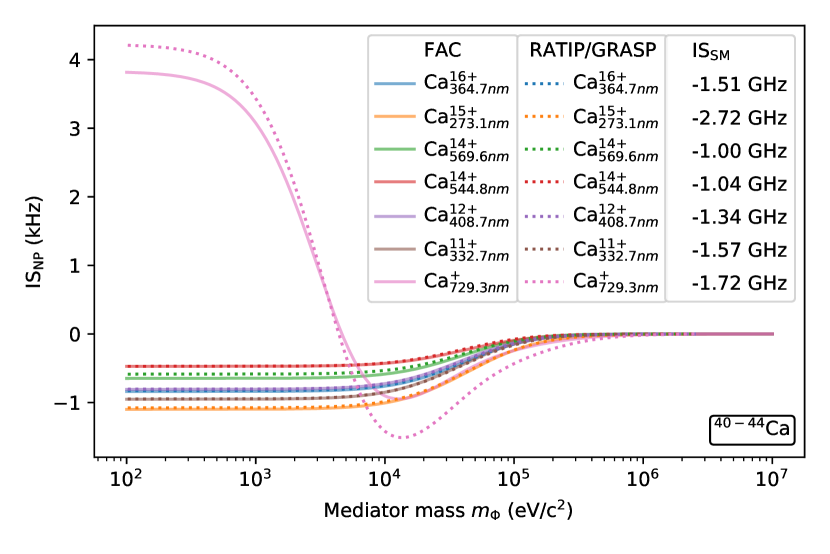
Figure 2 shows the IS of the studied transitions induced by NP for the Ca isotope pair (40,44); the associated electronic coefficients are listed in table 2. To highlight the effects of the NP particle, the dominating SM contribution was subtracted from the total IS. For comparison, we also included the Ca+ transition. It shows a larger shift than the transitions due to the difference in between the initial and final state. One advantage of HCI is that their reduced number of electrons makes calculations more easily converge than those for neutrals or singly charged ions, as apparent from the differences between FAC and RATIP/GRASP for Ca+.
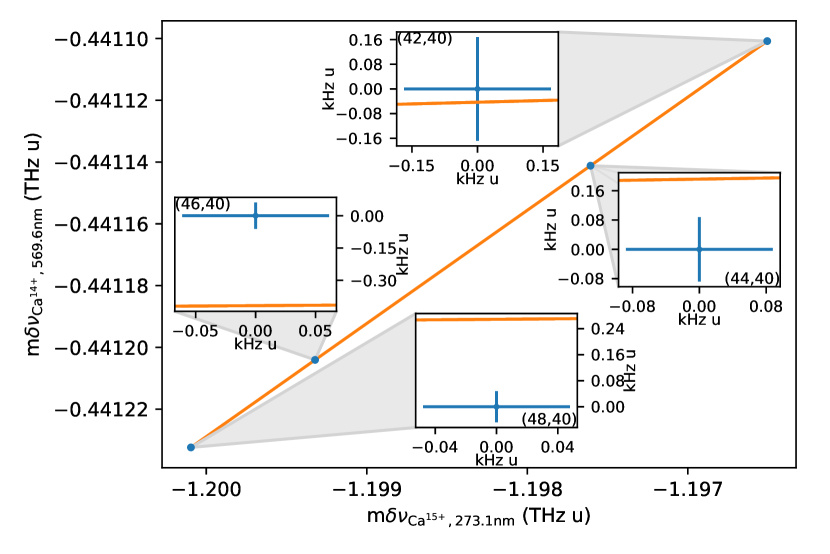
To analyze the IS without an accurate knowledge of the change of the nuclear charge radius , one can use the approach of King King (1963), where the isotope shifts of two transitions in different isotope pairs , divided by the mass parameter (denoted as for modified), are plotted against each other. A linear behavior along all points is expected from first-order perturbation theory, while nonlinearities would arise from either higher order effects from the SM, or from NP parts:
| (3) | ||||
Here, the first two terms represent the linear behavior between the isotope shifts of the two transitions and , from equation 2, for different isotope pairs . The third term, with the variable , induces a nonlinearity when varies for the transitions and mediator masses. The King plot can be constructed from the fac results, where the SM and NP electronic coefficients can be taken from table 1 and table 2, respectively. This is shown for the mediator mass of and a coupling strength of in figure 3.
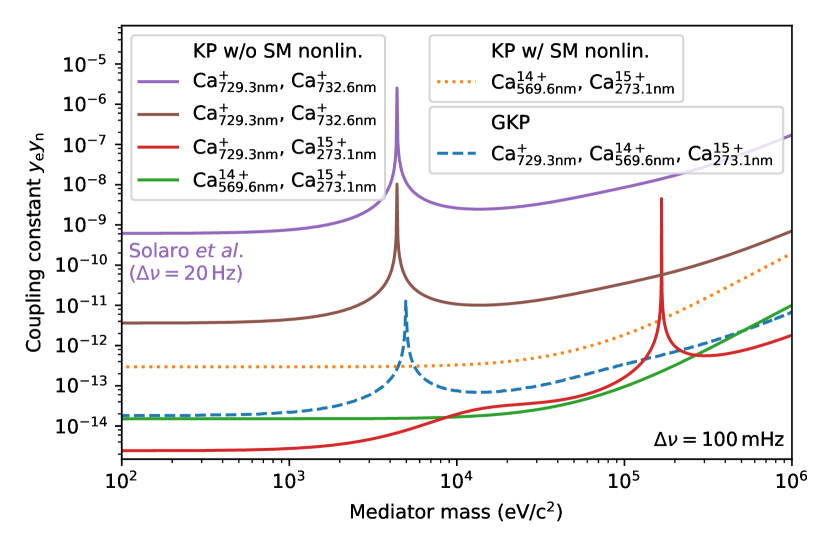
To quantify the chances of detecting NP, we can display the nonlinearity over its error, using the equations from Berengut et al. (2020). This allows us to plot the lowest possible coupling strength where the nonlinearity can still be resolved with a given measurement uncertainty. Figure 4 plots this measurement boundary for different mediator masses with an expected measurement uncertainty of for future coherent laser spectroscopy measurements. The (violet) curve corresponds to the transitions used in Solaro et al. (2020) with a measurement uncertainty of 20 Hz. The brown curve corresponds to this transition pair with the uncertainty level from the present paper. As their electronic coefficients are very similar, they are not an ideal pair for the King plot analysis. Two out of the four transitions ground-state transitions studied here are shown in a King plot. The most promising candidate is the pair, but the HCI-only pair shows also a greater chance of finding NP than the -only pair. To show potential higher order SM effects, a quadratic mass shift in order of Flambaum et al. (2018) is added to the HCI pair . This term causes additional SM nonlinearities, which greatly limit the bounds that can be placed in the coupling strength (orange). However, it is expected that ongoing calculations of the quadratic mass shift terms in Ca+ and the different Ca HCI will reduce their contributions to the general uncertainty. Furthermore, the problem can be bypassed altogether by using the generalized King plot (blue), as the additional transition is used to separate the higher-order SM effects from the NP effects, similarly to what has been done to obtain equation 3. It is important to mention that specific knowledge of the higher orders of the SM contributions is not needed here Mikami et al. (2017); Berengut et al. (2020).
With the higher order SM limitations overcome, we now discuss the required accuracy. A statistical uncertainty of approximately 2 Hz was achieved for a broad magnetic-dipole (M1) transition in Ar13+ Micke et al. (2020) through laser scans of the line. By actively stabilizing that probe laser to the M1 clock transition Peik et al. (2005); Riis and Sinclair (2004), frequency data could be continuously acquired for hours or days and thereby an even lower uncertainty reached. This requires cooling the HCI down to ( K) for suppression of Doppler broadening and other systematic shifts. Most HCIs lacking laser-cooling transitions, we employ instead sympathetic cooling with a single 9Be+ located in the same trapping potential as the HCI Micke et al. (2020). However, because simultaneously cooling and manipulating two different HCIs with one Be ion in a three-species Coulomb crystal would be very complex, IS frequency measurements are most likely to be performed sequentially. If the primary frequency standard, the Cs fountain, is used as reference, it would limit the fractional accuracy to the low level. This underlies our assumed 100 mHz uncertainty for an individual transition, for which several weeks of continuous averaging would be required (see, for example, Lange et al. (2021)). A better option would be direct optical-optical comparisons Rosenband et al. (2008); Godun et al. (2014); Beloy et al. (2021); Dörscher et al. (2021); Lange et al. (2021) against an optical frequency standard that is more stable than the Cs standard, yielding frequency differences for the isotopes independent of it. The statistical uncertainty would then be dominated by the comparatively broad natural linewidth of the HCI clock transition. With the system presented in Ref. King et al. (2021) and a 7 ms-long clock transition interrogation pulse (leading to an interaction-time limited linewidth of 114 Hz), quantum projection noise would cause a statistical uncertainty of approximately , where is the averaging time in seconds. The assumed uncertainty of 100 mHz () would then require only a few hours of averaging, instead of weeks. If the systematic shifts are controlled at the level which is now standard in optical atomic clocks, their contribution to the overall uncertainty will become negligible.
In future, if the difficulties of using three-ion Coulomb crystals can be overcome, IS could be determined in a single measurement using common or separate spectroscopy lasers. If ions of two or more different isotopes are entangled to prepare decoherence-free, noise-insensitive Hilbert subspaces Pruttivarasin et al. (2015), the accuracy of the IS frequency comparisons would be further increased, as shown in Ref. Manovitz et al. (2019).
Our measurements and calculations established six forbidden, laser-accessible transitions in highly charged calcium ions, four of which have a transition to the ground level, and thus are accessible for coherent laser spectroscopy, i. e., quantum logic spectroscopy. This expands the possibilities for King plot-based IS searches for new physics. Taken together with the two already well-studied optical transitions in Ca+ ions, the number of combinations suitable for NP searches grows Delaunay et al. (2017); Berengut et al. (2011b); Frugiuele et al. (2017); Fichet (2018); Berengut et al. (2018); Flambaum et al. (2018) and opens up the use of the generalized King-plot analysis Berengut et al. (2020) for this type of experiment. In this way, limitations by higher-order SM can be overcome, and the NP parameter space can be probed more stringently than currently possible.
Acknowledgements
Financial support was provided by the Max-Planck-Gesellschaft and the Physikalisch-Technische Bundesanstalt. We acknowledge support from the Max Planck-Riken-PTB Center for Time, Constants and Fundamental Symmetries, the Deutsche Forschungsgemeinschaft through SCHM2678/5-1 and SU 658/4-1, the collaborative research centers “SFB 1225 (ISOQUANT)”and “SFB 1227 (DQ-mat)”, and Germany’s Excellence Strategy-EXC-2123/1 QuantumFrontiers-390837967. This project also received funding from the European Metrology Programme for Innovation and Research (EMPIR) cofinanced by the Participating 5 States and from the European Union’s Horizon 2020 research and innovation programme (Project No. 17FUN07 CC4C). JCB was supported in this work by the Alexander von Humboldt Foundation and the Australian Research Council (DP190100974).
References
- Safronova et al. (2018) M. S. Safronova, D. Budker, D. DeMille, D. F. J. Kimball, A. Derevianko, and C. W. Clark, Rev. Mod. Phys. 90, 025008 (2018).
- Arvanitaki et al. (2015) A. Arvanitaki, J. Huang, and K. Van Tilburg, Phys. Rev. D 91, 015015 (2015).
- Stadnik and Flambaum (2015a) Y. V. Stadnik and V. V. Flambaum, Phys. Rev. Lett. 114, 161301 (2015a).
- Stadnik and Flambaum (2015b) Y. V. Stadnik and V. V. Flambaum, Phys. Rev. Lett. 115, 201301 (2015b).
- Derevianko and Pospelov (2014) A. Derevianko and M. Pospelov, Nat Phys 10, 933 (2014).
- Ludlow et al. (2015) A. D. Ludlow, M. M. Boyd, J. Ye, E. Peik, and P. O. Schmidt, Reviews of Modern Physics 87, 637 (2015).
- Kennedy et al. (2020) C. J. Kennedy, E. Oelker, J. M. Robinson, T. Bothwell, D. Kedar, W. R. Milner, G. E. Marti, A. Derevianko, and J. Ye, Phys. Rev. Lett. 125, 201302 (2020).
- Wcisło et al. (2016) P. Wcisło, P. Morzyński, M. Bober, A. Cygan, D. Lisak, R. Ciuryło, and M. Zawada, Nat. Astron. 1, 0009 (2016).
- Wcisło et al. (2018) P. Wcisło, P. Ablewski, K. Beloy, S. Bilicki, M. Bober, R. Brown, R. Fasano, R. Ciuryło, H. Hachisu, T. Ido, J. Lodewyck, A. Ludlow, W. McGrew, P. Morzyński, D. Nicolodi, M. Schioppo, M. Sekido, R. L. Targat, P. Wolf, X. Zhang, B. Zjawin, and M. Zawada, Sci. Adv. 4, eaau4869 (2018).
- Roberts et al. (2020) B. M. Roberts, P. Delva, A. Al-Masoudi, A. Amy-Klein, C. Bærentsen, C. F. A. Baynham, E. Benkler, S. Bilicki, S. Bize, W. Bowden, J. Calvert, V. Cambier, E. Cantin, E. A. Curtis, S. Dörscher, M. Favier, F. Frank, P. Gill, R. M. Godun, G. Grosche, C. Guo, A. Hees, I. R. Hill, R. Hobson, N. Huntemann, J. Kronjäger, S. Koke, A. Kuhl, R. Lange, T. Legero, B. Lipphardt, C. Lisdat, J. Lodewyck, O. Lopez, H. S. Margolis, H. Álvarez-Martínez, F. Meynadier, F. Ozimek, E. Peik, P.-E. Pottie, N. Quintin, C. Sanner, L. D. Sarlo, M. Schioppo, R. Schwarz, A. Silva, U. Sterr, C. Tamm, R. L. Targat, P. Tuckey, G. Vallet, T. Waterholter, D. Xu, and P. Wolf, New Journal of Physics 22, 093010 (2020).
- Delaunay et al. (2017) C. Delaunay, R. Ozeri, G. Perez, and Y. Soreq, Phys. Rev. D 96, 093001 (2017).
- Berengut et al. (2018) J. C. Berengut, D. Budker, C. Delaunay, V. V. Flambaum, C. Frugiuele, E. Fuchs, C. Grojean, R. Harnik, R. Ozeri, G. Perez, and Y. Soreq, Phys. Rev. Lett. 120, 091801 (2018).
- Solaro et al. (2020) C. Solaro, S. Meyer, K. Fisher, J. C. Berengut, E. Fuchs, and M. Drewsen, Phys. Rev. Lett. 125, 123003 (2020).
- Counts et al. (2020) I. Counts, J. Hur, D. P. L. Aude Craik, H. Jeon, C. Leung, J. C. Berengut, A. Geddes, A. Kawasaki, W. Jhe, and V. Vuletić, Phys. Rev. Lett. 125, 123002 (2020).
- Knollmann et al. (2019) F. W. Knollmann, A. N. Patel, and S. C. Doret, Phys. Rev. A 100, 022514 (2019).
- Manovitz et al. (2019) T. Manovitz, R. Shaniv, Y. Shapira, R. Ozeri, and N. Akerman, Phys. Rev. Lett. 123, 203001 (2019).
- Miyake et al. (2019) H. Miyake, N. C. Pisenti, P. K. Elgee, A. Sitaram, and G. K. Campbell, Phys. Rev. Research 1, 033113 (2019).
- Gebert et al. (2015a) F. Gebert, Y. Wan, F. Wolf, C. N. Angstmann, J. C. Berengut, and P. O. Schmidt, Physical Review Letters 115, 053003 (2015a).
- Shi et al. (2017) C. Shi, F. Gebert, C. Gorges, S. Kaufmann, W. Nörtershäuser, B. K. Sahoo, A. Surzhykov, V. A. Yerokhin, J. C. Berengut, F. Wolf, J. C. Heip, and P. O. Schmidt, Applied Physics B 123, 2 (2017).
- Müller et al. (2020) P. Müller, K. König, P. Imgram, J. Krämer, and W. Nörtershäuser, Physical Review Research 2, 043351 (2020).
- King (1963) W. H. King, J. Opt. Soc. Am. 53, 638 (1963).
- Frugiuele et al. (2017) C. Frugiuele, E. Fuchs, G. Perez, and M. Schlaffer, Phys. Rev. D 96, 015011 (2017).
- Flambaum et al. (2018) V. V. Flambaum, A. J. Geddes, and A. V. Viatkina, Phys. Rev. A 97, 032510 (2018).
- Fichet (2018) S. Fichet, Phys. Rev. Lett. 120, 131801 (2018).
- Yerokhin et al. (2020) V. A. Yerokhin, R. A. Müller, A. Surzhykov, P. Micke, and P. O. Schmidt, Phys. Rev. A 101, 012502 (2020).
- Reinhard et al. (2020) P.-G. Reinhard, W. Nazarewicz, and R. F. Garcia Ruiz, Phys. Rev. C 101, 021301(R) (2020).
- Tanaka and Yamamoto (2020) M. Tanaka and Y. Yamamoto, Progress of Theoretical and Experimental Physics 2020 (2020), 10.1093/ptep/ptaa121.
- Mikami et al. (2017) K. Mikami, M. Tanaka, and Y. Yamamoto, The European Physical Journal C 77, 896 (2017).
- Berengut et al. (2020) J. C. Berengut, C. Delaunay, A. Geddes, and Y. Soreq, Phys. Rev. Research 2, 043444 (2020).
- Gu (2008) M. F. Gu, Canadian Journal of Physics 86, 675 (2008).
- Fritzsche (2012) S. Fritzsche, Computer Physics Communications 183, 1525 (2012).
- Kramida et al. (2020) A. Kramida, Y. Ralchenko, J. Reader, and NIST ASD Team, “NIST Atomic Spectra Database (ver. 5.7),” (2020), accessed: 2019-07-27.
- Micke et al. (2020) P. Micke, T. Leopold, S. A. King, E. Benkler, L. J. Spieß, L. Schmöger, M. Schwarz, J. R. Crespo López-Urrutia, and P. O. Schmidt, Nature 578, 60 (2020).
- Barbieri and Ericson (1975) R. Barbieri and T. Ericson, Physics Letters B 57, 270 (1975).
- Leeb and Schmiedmayer (1992) H. Leeb and J. Schmiedmayer, Phys. Rev. Lett. 68, 1472 (1992).
- Nesvizhevsky et al. (2008) V. V. Nesvizhevsky, G. Pignol, and K. V. Protasov, Phys. Rev. D 77, 034020 (2008).
- Pokotilovski (2006) Y. N. Pokotilovski, Physics of Atomic Nuclei 69, 924 (2006).
- Adler et al. (1974) S. L. Adler, R. F. Dashen, and S. B. Treiman, Phys. Rev. D 10, 3728 (1974).
- Bordag et al. (2001) M. Bordag, U. Mohideen, and V. Mostepanenko, Physics Reports 353, 1 (2001).
- Bordag et al. (2009) M. Bordag, G. L. Klimchitskaya, U. Mohideen, and V. M. Mostepanenko, Advances in the Casimir effect, Vol. 145 (OUP Oxford, 2009).
- Schmidt et al. (2005) P. O. Schmidt, T. Rosenband, C. Langer, W. M. Itano, J. C. Bergquist, and D. J. Wineland, Science 309, 749 (2005).
- Nörtershäuser et al. (1998) W. Nörtershäuser, K. Blaum, K. Icker, P. Müller, A. Schmitt, K. Wendt, and B. Wiche, The European Physical Journal D - Atomic, Molecular, Optical and Plasma Physics 2, 33 (1998).
- Mortensen et al. (2004) A. Mortensen, J. J. T. Lindballe, I. S. Jensen, P. Staanum, D. Voigt, and M. Drewsen, Phys. Rev. A 69, 042502 (2004).
- Gorges et al. (2015) C. Gorges, K. Blaum, N. Frömmgen, C. Geppert, M. Hammen, S. Kaufmann, J. Krämer, A. Krieger, R. Neugart, R. Sánchez, and W. Nörtershäuser, Journal of Physics B: Atomic, Molecular and Optical Physics 48, 245008 (2015).
- Hashimoto et al. (2011) Y. Hashimoto, M. Kitaoka, T. Yoshida, and S. Hasegawa, Applied Physics B 103, 339 (2011).
- Shi et al. (2016) C. Shi, F. Gebert, C. Gorges, S. Kaufmann, W. Nörtershäuser, B. K. Sahoo, A. Surzhykov, V. A. Yerokhin, J. C. Berengut, F. Wolf, J. C. Heip, and P. O. Schmidt, Applied Physics B 123, 2 (2016).
- Gebert et al. (2015b) F. Gebert, Y. Wan, F. Wolf, C. N. Angstmann, J. C. Berengut, and P. O. Schmidt, Phys. Rev. Lett. 115, 053003 (2015b).
- Benhelm et al. (2007) J. Benhelm, G. Kirchmair, U. Rapol, T. Körber, C. F. Roos, and R. Blatt, Phys. Rev. A 75, 032506 (2007).
- Morgan et al. (1995) C. A. Morgan, F. G. Serpa, E. Takács, E. S. Meyer, J. D. Gillaspy, J. Sugar, J. R. Roberts, C. M. Brown, and U. Feldman, Phys. Rev. Lett. 74, 1716 (1995).
- Draganić et al. (2003) I. Draganić, J. R. Crespo López-Urrutia, R. DuBois, S. Fritzsche, V. M. Shabaev, R. S. Orts, I. I. Tupitsyn, Y. Zou, and J. Ullrich, Phys. Rev. Lett. 91, 183001 (2003).
- Orts et al. (2006) R. S. Orts, Z. Harman, J. R. C. López-Urrutia, A. N. Artemyev, H. Bruhns, A. J. G. Martínez, U. D. Jentschura, C. H. Keitel, A. Lapierre, V. Mironov, V. M. Shabaev, H. Tawara, I. I. Tupitsyn, J. Ullrich, and A. V. Volotka, Phys. Rev. Lett. 97, 103002 (2006).
- Crespo López-Urrutia (2008) J. R. Crespo López-Urrutia, Canadian Journal of Physics 86, 111 (2008).
- Crespo López-Urrutia and Harman (2014) J. R. Crespo López-Urrutia and Z. Harman, “Emission and laser spectroscopy of trapped highly charged ions in electron beam ion traps,” in Fundamental Physics in Particle Traps, edited by W. Quint and M. Vogel (Springer Berlin Heidelberg, Berlin, Heidelberg, 2014) pp. 315–373.
- Murata et al. (2017) S. Murata, T. Nakajima, M. S. Safronova, U. I. Safronova, and N. Nakamura, Phys. Rev. A 96, 062506 (2017).
- Windberger et al. (2016) A. Windberger, F. Torretti, A. Borschevsky, A. Ryabtsev, S. Dobrodey, H. Bekker, E. Eliav, U. Kaldor, W. Ubachs, R. Hoekstra, J. R. Crespo López-Urrutia, and O. O. Versolato, Phys. Rev. A 94, 012506 (2016).
- Bekker et al. (2018) H. Bekker, C. Hensel, A. Daniel, A. Windberger, T. Pfeifer, and J. R. Crespo López-Urrutia, Phys. Rev. A 98, 062514 (2018).
- Klaft et al. (1994) I. Klaft, S. Borneis, T. Engel, B. Fricke, R. Grieser, G. Huber, T. Kühl, D. Marx, R. Neumann, S. Schröder, P. Seelig, and L. Völker, Phys. Rev. Lett. 73, 2425 (1994).
- Crespo López-Urrutia et al. (1996) J. R. Crespo López-Urrutia, P. Beiersdorfer, D. W. Savin, and K. Widmann, Physical Review Letters 77, 826 (1996).
- Seelig et al. (1998) P. Seelig, S. Borneis, A. Dax, T. Engel, S. Faber, M. Gerlach, C. Holbrow, G. Huber, T. Kühl, D. Marx, K. Meier, P. Merz, W. Quint, F. Schmitt, M. Tomaselli, L. Völker, H. Winter, M. Würtz, K. Beckert, B. Franzke, F. Nolden, H. Reich, M. Steck, and T. Winkler, Phys. Rev. Lett. 81, 4824 (1998).
- Crespo López-Urrutia et al. (1998) J. R. Crespo López-Urrutia, P. Beiersdorfer, K. Widmann, B. B. Birkett, A.-M. Mårtensson-Pendrill, and M. G. H. Gustavsson, Phys. Rev. A 57, 879 (1998).
- Beiersdorfer et al. (2001) P. Beiersdorfer, S. B. Utter, K. L. Wong, J. R. Crespo López-Urrutia, J. A. Britten, H. Chen, C. L. Harris, R. S. Thoe, D. B. Thorn, E. Träbert, M. G. H. Gustavsson, C. Forssén, and A.-M. Mårtensson-Pendrill, Phys. Rev. A 64, 032506 (2001).
- Berengut et al. (2010) J. C. Berengut, V. A. Dzuba, and V. V. Flambaum, Phys. Rev. Lett. 105, 120801 (2010).
- Berengut et al. (2012) J. C. Berengut, V. A. Dzuba, V. V. Flambaum, and A. Ong, Phys. Rev. A 86, 022517 (2012).
- Windberger et al. (2015) A. Windberger, J. R. Crespo López-Urrutia, H. Bekker, N. S. Oreshkina, J. C. Berengut, V. Bock, A. Borschevsky, V. A. Dzuba, E. Eliav, Z. Harman, U. Kaldor, S. Kaul, U. I. Safronova, V. V. Flambaum, C. H. Keitel, P. O. Schmidt, J. Ullrich, and O. O. Versolato, Phys. Rev. Lett. 114, 150801 (2015).
- Bekker et al. (2019) H. Bekker, A. Borschevsky, Z. Harman, C. H. Keitel, T. Pfeifer, P. O. Schmidt, J. R. Crespo López-Urrutia, and J. C. Berengut, Nature Communications 10, 5651 (2019).
- Ong et al. (2014) A. Ong, J. C. Berengut, and V. V. Flambaum, “Optical transitions in highly charged ions for detection of variations in the fine-structure constant,” in Fundamental Physics in Particle Traps, edited by W. Quint and M. Vogel (Springer Berlin Heidelberg, Berlin, Heidelberg, 2014) pp. 293–314.
- Berengut et al. (2011a) J. C. Berengut, V. A. Dzuba, V. V. Flambaum, and A. Ong, Physical Review Letters 106, 210802 (2011a).
- Derevianko et al. (2012) A. Derevianko, V. A. Dzuba, and V. V. Flambaum, Physical Review Letters 109, 180801 (2012).
- Dzuba and Flambaum (2015) V. A. Dzuba and V. V. Flambaum, Hyperfine Interact. 236, 79 (2015).
- Safronova et al. (2014) M. S. Safronova, V. A. Dzuba, V. V. Flambaum, U. I. Safronova, S. G. Porsev, and M. G. Kozlov, Phys. Rev. A 90, 052509 (2014).
- Porsev et al. (2020) S. G. Porsev, U. I. Safronova, M. S. Safronova, P. O. Schmidt, A. I. Bondarev, M. G. Kozlov, I. I. Tupitsyn, and C. Cheung, Phys. Rev. A 102, 012802 (2020).
- Cheung et al. (2020) C. Cheung, M. S. Safronova, S. G. Porsev, M. G. Kozlov, I. I. Tupitsyn, and A. I. Bondarev, Phys. Rev. Lett. 124, 163001 (2020).
- Kimura et al. (2019) N. Kimura, R. Kodama, K. Suzuki, S. Oishi, M. Wada, K. Okada, N. Ohmae, H. Katori, and N. Nakamura, Phys. Rev. A 100, 052508 (2019).
- Kozlov et al. (2018) M. G. Kozlov, M. S. Safronova, J. R. Crespo López-Urrutia, and P. O. Schmidt, Rev. Mod. Phys. 90, 045005 (2018).
- Levine et al. (1988) M. A. Levine, R. E. Marrs, J. R. Henderson, D. A. Knapp, and M. B. Schneider, Physica Scripta 1988, 157 (1988).
- Levine et al. (1989) M. A. Levine, R. E. Marrs, J. N. Bardsley, P. Beiersdorfer, C. L. Bennett, M. H. Chen, T. Cowan, D. Dietrich, J. R. Henderson, D. A. Knapp, A. Osterheld, B. M. Penetrante, M. B. Schneider, and J. H. Scofield, Nuclear Instruments and Methods in Physics Research Section B: Beam Interactions with Materials and Atoms 43, 431 (1989).
- Crespo López-Urrutia et al. (1999) J. R. Crespo López-Urrutia, A. Dorn, R. Moshammer, and J. Ullrich, Physica Scripta T80, 502 (1999).
- Jefferies et al. (1971) J. T. Jefferies, F. Q. Orrall, and J. B. Zirker, Solar Physics 16, 103 (1971).
- Peik et al. (2005) E. Peik, T. Schneider, and C. Tamm, Journal of Physics B: Atomic, Molecular and Optical Physics 39, 145 (2005).
- Riis and Sinclair (2004) E. Riis and A. G. Sinclair, Journal of Physics B: Atomic, Molecular and Optical Physics 37, 4719 (2004).
- Lange et al. (2021) R. Lange, N. Huntemann, J. M. Rahm, C. Sanner, H. Shao, B. Lipphardt, C. Tamm, S. Weyers, and E. Peik, Phys. Rev. Lett. 126, 011102 (2021).
- Rosenband et al. (2008) T. Rosenband, D. B. Hume, P. O. Schmidt, C. W. Chou, A. Brusch, L. Lorini, W. H. Oskay, R. E. Drullinger, T. M. Fortier, J. E. Stalnaker, S. A. Diddams, W. C. Swann, N. R. Newbury, W. M. Itano, D. J. Wineland, and J. C. Bergquist, Science 319, 1808 (2008).
- Godun et al. (2014) R. M. Godun, P. B. R. Nisbet-Jones, J. M. Jones, S. A. King, L. A. M. Johnson, H. S. Margolis, K. Szymaniec, S. N. Lea, K. Bongs, and P. Gill, Phys. Rev. Lett. 113, 210801 (2014).
- Beloy et al. (2021) K. Beloy, M. I. Bodine, T. Bothwell, S. M. Brewer, S. L. Bromley, J.-S. Chen, J.-D. Deschênes, S. A. Diddams, R. J. Fasano, T. M. Fortier, Y. S. Hassan, D. B. Hume, D. Kedar, C. J. Kennedy, I. Khader, A. Koepke, D. R. Leibrandt, H. Leopardi, A. D. Ludlow, W. F. McGrew, W. R. Milner, N. R. Newbury, D. Nicolodi, E. Oelker, T. E. Parker, J. M. Robinson, S. Romisch, S. A. Schäffer, J. A. Sherman, L. C. Sinclair, L. Sonderhouse, W. C. Swann, J. Yao, J. Ye, X. Zhang, and Boulder Atomic Clock Optical Network (BACON) Collaboration, Nature 591, 564 (2021).
- Dörscher et al. (2021) S. Dörscher, N. Huntemann, R. Schwarz, R. Lange, E. Benkler, B. Lipphardt, U. Sterr, E. Peik, and C. Lisdat, Metrologia 58, 015005 (2021).
- King et al. (2021) S. A. King, L. J. Spieß, P. Micke, A. Wilzewski, T. Leopold, J. R. C. López-Urrutia, and P. O. Schmidt, “Algorithmic ground-state cooling of weakly-coupled oscillators using quantum logic,” (2021), arXiv:2102.12427 [physics.atom-ph] .
- Pruttivarasin et al. (2015) T. Pruttivarasin, M. Ramm, S. G. Porsev, I. I. Tupitsyn, M. S. Safronova, M. A. Hohensee, and H. Häffner, Nature 517, 592 (2015).
- Berengut et al. (2011b) J. C. Berengut, V. V. Flambaum, and E. M. Kava, Phys. Rev. A 84, 042510 (2011b).